automatization of feeding the heat flux data to …
TRANSCRIPT

LAPPEENRANTA UNIVERSITY OF TECHNOLOGY
LUT School of Energy Systems
Energy Technology
Antti Sirainen
AUTOMATIZATION OF FEEDING THE HEAT FLUX DATA TO
WATER CIRCULATION SIMULATIONS OF RECOVERY
BOILERS
Examiner: Professor, PhD. Esa Vakkilainen
Instructors: M.Sc. (Tech) Jukka Röppänen
Lic.Sc. (Tech) Jari Lappalainen
ABSTRACT
Lappeenranta University of Technology
School of Energy Systems
Energy Technology
Antti Sirainen
Automatization of feeding the heat flux data to water circulation simulations of
recovery boilers
Master’s Thesis
2016
67 pages, 34 figures, 2 tables and 13 appendices
Examiner: Professor, Ph.D. Esa Vakkilainen
Instructors: M.Sc. (Tech) Jukka Röppänen
Lic.Sc. (Tech) Jari Lappalainen
Keywords: Apros, Automatization, Black liquor, Heat flux, Recovery boiler, Simulation,
Water circulation
The aim of this thesis is to familiarize with the water-steam circulation simulations. The main
target is to develop an Excel based calculation tool to handle and transfer heat flux data to the
Apros 6 simulation program. It is also important to make this as automated as possible to
make water circulation calculations more simple, comparable and precise. This is possible
with Excel macros and new feature in Apros 6, SCL command files. SCL commands enable
smooth data transfer between Apros and Excel.
Data management within the water circulations calculations has earlier been onerous and the
accuracy has depended on the modeler. In this thesis, modern and more realistic CFD models
are used to create heat flux values for heat transfer surfaces of a recovery boiler. This is a
major improvement to the reliability of the water circulation studies.
In the experimental part, new Excel calculation tool and the modified heat flux values are
tested in practice. Old Apros water circulation model is updated with new heat fluxes and its
structure is modified to be more accurate. The new model is also tested with 115 % capacity
to study how the recovery boiler’s water circulation works with a higher thermal power and
what changes it causes. These three different cases are compared to each other, and the
changes caused in water-steam flows are studied.

TIIVISTELMÄ
Lappeenrannan teknillinen yliopisto
School of Energy Systems
Energiatekniikan koulutusohjelma
Antti Sirainen
Lämpövuojakauman syöttämisen automatisointi soodakattilan vesikiertolaskentaan
Diplomityö
2016
67 sivua, 34 kuvaa, 2 taulukkoa ja 13 liitettä
Tarkastaja: Professori, TkT Esa Vakkilainen
Ohjaajat: DI Jukka Röppänen
TkL Jari Lappalainen
Hakusanat: Apros, Automatisointi, Mustalipeä, Lämpövuo, Soodakattila, Mallinnus,
Vesikierto
Tässä työssä perehdytään soodakattiloiden vesikiertomallin rakentamiseen. Työn
päätavoitteena on kehittää simulointimallia varten taulukkolaskentapohja, jonka avulla
soodakattilan lämpövuotietoja on yksinkertaista ja nopeaa käsitellä ja siirtää Apros 6 -
simulointiohjelmaan. Lisäksi tarkoituksena on pyrkiä automatisoimaan työvaiheet
mahdollisimman pitkälle, jolloin vesikiertolaskennan tekeminen yksinkertaistuisi,
yhtenäistyisi ja tarkentuisi. Tämä on mahdollista Excel- makrojen ja Apros 6:n uusien
toimintojen avulla. Apros 6:ssa on nyt mahdollista hyödyntää SCL- komentotiedostoja,
joiden avulla sujuva tiedonsiirto Aproksen ja Excelin välillä vodaan toteuttaa.
Vesikiertolaskentaan käytettävän datan käsittely on aikaisemmin ollut työlästä ja sen
tarkkuus on pitkälti riippunut mallintajasta. Tässä diplomityössä päästään hyödyntämään
uusimpia ja realistisempia soodakattiloiden CFD- malleja, joiden avulla pystytään luomaan
aikaisempaa tarkemmat lämpövuojakaumat soodakattilan lämpöpinnoille. Tämä muutos
parantaa vesikiertolaskennan tarkkuutta.
Työn kokeellisessa osassa uutta Excel laskentatyökalua ja uusia lämpövuoarvoja testataan
käytännössä. Eräs vanha Apros- vesikiertomalli päivitetään uusilla lämpövuoarvoilla ja sen
rakenteeseen tehdään muutoksia tarkkuuden parantamiseksi. Uuden mallin toimivuutta
testataan myös 115 %:n kapasiteetilla ja tutkitaan kuinka kyseinen vesikiertopiiri reagoi
suurempaan lämpötehoon. Näitä kolmea eri tilannetta vertaillaan toisiinsa ja tarkastellaan
eroavaisuuksia niiden vesi-höyrypiireissä.

FOREWORD
This Master’s Thesis was made for Recovery Boilers Technology department of Andritz Oy
in Kotka.
I wish to thank my supervising Professor Esa Vakkilainen for his assistance for this work. I
thank my instructor Jukka Röppänen for opportunity for this interesting and challenging
subject. Thank you also for good instructions and advices. I express my thanks to my second
instructor Jari Lappalainen at VTT for best available guidance of Apros 6. Without your help
this thesis would have been nearly impossible to accomplish.
I would like to thank my colleagues at Andritz for the good time and tips to my thesis.
I want to thank students of Armatuuri for the best five years of my life. Thanks for all those
good moments and jokes. Especially thanks to my friends who have shared the good and bad
moments with me; lectures, exercises, excursions, gravity racer competitions, gentleman’s
evenings etc.
Finally, I thank my family and girlfriend for supporting during my studies. They have always
encouraged and helped me to achieve my ambitions.
Kotka, 2nd
of August, 2016
Antti Sirainen

LIST OF SYMBOLS
A surface area [m2]
cp specific heat at constant pressure [J/kgK]
d diameter [m]
h heat transfer coefficient [W/m2K]
k thermal conductivity [W/mK]
L length [m]
s thickness [m]
T temperature [˚C]
v velocity [m/s]
q heat flux [W/m2]
g gravity [m/s2]
Greek
α absorptivity [-]
ε emissivity [-]
∆ difference [-]
μ viscosity [kg/ms]
π pi [-]
ρ density [kg/m3]
σ Stefan-Boltzmann constant [W/m2K
4]
Ф heat transfer [W]
Subscripts
c convective
conv convection
D diameter
dg dust gas
e excess
eff efficient
ex external

g gas
i inside
lm logarithmic
m mean
max maximum
min minimum
o outside
r radiative
s surface
sat saturation
w wall
x specific location
∞ free stream conditions
Abbreviations
BB Boiler bank
CFD Computational fluid dynamics
CHF Critical heat flux
CO2 Carbon dioxide
FAC Flow-accelerated corrosion
MCR Maximum continuous rating
NOX Nitrogen oxides
NCG Non-condensable waste gases
Pr Prandtl’s number
Re Reynolds number
RWS Rear wall screen
SCL Simantics Constraint Language
SOX Sulfur oxides
tds/t Tons of dry solid pre day
TRS Total reduced Sulphur
VBA Visual basics for applications

TABLE OF CONTENTS
1. INTRODUCTION .............................................................................................................9
2. MODERN RECOVERY BOILER ..................................................................................10
2.1 Functions of recovery boiler ..........................................................................................11
2.2 Typical construction of modern recovery boiler ............................................................12
2.3 Furnace design ...............................................................................................................14
2.4 Black liquor combustion ................................................................................................15
2.4 Combustion air systems .................................................................................................16
2.5 Water circulation ...........................................................................................................17
2.5.1 Natural circulation ..................................................................................................18
2.5.2 Forced circulation ...................................................................................................19
2.5.3 Once-through circulation ........................................................................................20
2.6 Fouling control...............................................................................................................20
2.7 Emissions .......................................................................................................................22
3. NATURAL CIRCULATION BOILERS .........................................................................24
3.1 Operating principle ........................................................................................................24
3.1.2 Single drum boilers .................................................................................................24
3.1.2 Two drum boilers ....................................................................................................25
3.1.3 Eckrohr boilers ........................................................................................................26
3.2 Heat transfer in the boiler ..............................................................................................27
3.2.1 Conduction ..............................................................................................................28
3.2.2 Convection ..............................................................................................................30
3.2.3 Radiation .................................................................................................................34
3.2.4 Overall heat transfer ...............................................................................................36
3.3 Fluid Dynamics ..............................................................................................................38
3.3.1 Two-phase flow in vertical pipes ............................................................................38
3.3.2 Two-phase flow in horizontal pipe .........................................................................39
3.3.3 Boiling process .......................................................................................................41
3.4 Circulation Problems .....................................................................................................41
3.4.1 Critical heat flux .....................................................................................................42
3.4.2 Steam drum .............................................................................................................43

3.4.3 Unbalanced flow .....................................................................................................44
3.4.4 Water side corrosion ...............................................................................................44
4. WATER CIRCULATION MODELLING ......................................................................47
4.1 Used softwares ...............................................................................................................47
4.1.1 Apros ..........................................................................................................................47
4.1.2 Ansys Fluent ...............................................................................................................48
4.1.3 Microsoft Excel ..........................................................................................................48
4.2 Roles of the softwares ....................................................................................................49
4.2.1 Apros simulation of the water-steam circuits .............................................................49
4.2.2 Solving the heat fluxes by Ansys Fluent ....................................................................49
5. CREATING HEAT FLUX VALUES .............................................................................51
5.1 Recovery boiler furnace CFD model .............................................................................51
5.2 Creating accurate heat flux values for Apros .................................................................52
6. APROS SIMULATION MODEL FOR RECOVERY BOILER .....................................54
6.1 Description of the model ...............................................................................................54
6.2 Model improvements .....................................................................................................55
6.3 Transfer of heat flux ......................................................................................................55
7. RESULTS ........................................................................................................................57
7.1 General energy balances ................................................................................................57
7.2 Sensitivity analysis ........................................................................................................58
7.2.1 Structural changes .......................................................................................................58
7.2.2 Changes in heat flux ...................................................................................................59
7.2.3 Flow changes ..............................................................................................................60
7.3 Load change test ............................................................................................................62
7.4 Conclusions and development suggestions ....................................................................63
8. SUMMARY .....................................................................................................................65
REFERENCES..................................................................................................................…...66
APPENDICES…………………………………………………………..……………………68

9
1. INTRODUCTION
The main target for computational water circulation studies for recovery boilers is to ensure
proper water circulation in the specific design. This is the way how boiler manufacturers
ensure that pipe dryouts, critical heat fluxes, unstable flows, too high flow velocities and
excessive pressure losses do not occur in the pipelines. Water circulation studies can also be
used to test how different pipe sizes and other dimensions, temperatures and capacities affect.
The main weaknesses in earlier water circulation calculations have been inaccuracy in certain
areas and a large amount of work. Especially heat fluxes have been problematic and they
have been based on practical experiences and rough CFD models. Nowadays, more accurate
CFD models can be used to calculate heat fluxes; with small changes they are highly
workable for providing input data for water circulation studies.
This Master’s thesis has been done in the order of Andritz Oy. The aim of this thesis is to
improve the water circulation studies. The objective is to create an accurate way to solve and
feed heat flux data for the Apros 6 simulation program. This is done by Excel based
calculation tool, APPI, which is automated by using Visual Basics for Applications. With this
spreadsheet it is possible to handle and feed all the data needed for working with water
circulation simulation.

10
2. MODERN RECOVERY BOILER
Concentrated black liquor consists of organic dissolved wood residues and inorganic cooking
chemicals. In recovery boilers the combustion of the organic portion of the liquor produces
heat which is used to make high pressure steam that generates electricity and low pressure
steam for process use. Also costly inorganic sulfur compounds are recovered and recycled
back into the process. (Gullichsen, J. et al. 1999, 9-10)
Figure 1. Modern recovery boiler (Vakkilainen E. 2007, 2-2)

11
2.1 Functions of recovery boiler Recovery boiler’s three main functions are:
Burn the organic material of black liquor to generate steam
Recycle and regenerate used chemicals from black liquor
Minimize emissions from several waste streams in an environmentally friendly way
(Gullichsen, J. et al. 1999, 95)
The important pulping chemicals, such as sulfur and sodium, are separated from black liquor
in the recovery boiler. Chemicals are recovered as suitable compounds for further processing
in the chemical circulation loop (Figure 2). The efficiency of reduction from sodium sulfate
into sodium sulphide is an important measure of the recovery boiler’s performance. The
sodium that remains, will create sodium carbonate, when it reacts with carbon dioxide. The
chemical smelt that flows from the furnace through smelt spouts comprise sodium sulfide,
sodium carbonate and sodium sulfate. (Knowpulp)
Figure 2. Kraft recovery process (Tran, H. & Vakkilainen, E.)
Before burning, the dry solids content of separated black liquor is increased by removing
excess water in the evaporation process. Burning the organic materials and the chemical
reactions of recovering, release a considerable amount of heat energy. This heat energy is
transferred to water-filled tubes in walls of the boiler. The generated steam is used in
different stages of the pulping process, and in turbines to produce electricity. (Knowpulp)

12
2.2 Typical construction of modern recovery boiler The primary factors directing the development of the recovery boilers are the investment
cost, liquor processing capacity, energy efficiency and environmental requirements. The
chemical recovery system must be able to handle much more material than before, leading to
larger black liquor capacities and bigger recovery boilers (Figure 3). The world’s largest
recovery boiler is under construction and its capacity is going to be 12 000 tds/d
(Gullichsen, J. et al. 1999, 96)
Figure 3. Capacity increase of recovery boilers (Pentinsaari, 38)
A modern recovery boiler has a single drum design, widely spaced superheaters and vertical
steam generating bank. The most significant change in the past years has been the transition
to single drum construction. This change has been permitted by the better quality control of
boiler water. There are numerous advantages in the single drum construction compared to the
old two drum design. It reduces the possibility of water leakage to the furnace. There are
fewer holes in the drum wall so it can be constructed thinner, which allows faster start up and
stop-down. Also the gas flow to the boiler bank is smoother and the heating surface
engineering is simpler. (Vakkilainen, E. 2007, 1-6)
The spacing between superheater panels has increased to minimize fouling. With an
increased number of superheaters the heat transfer difference between a clean and fouled
surface is smaller. This feature simplifies the temperature control of the superheater outlet
steam, particularly during start-ups. Plugging of the new superheaters is unlikely, the

13
cleaning easier, and the soot blowing steam consumption is low. (Gullichsen, J. et al. 1999,
98)
Nowadays some modern recovery boilers have a pre-boiler bank before the actual boiler
bank. Water comes down from the steam drum to the inlet headers on the bottom of the bank.
Water starts to vaporize in the pre-boiler bank and natural circulation pushes water back into
the steam drum. This technique is used to decrease flue gas boiler bank inlet temperature
below 600 ˚C, depending on the black liquor properties and the fly ash melting behavior. Pre-
boiler bank prevents fouling in narrow boiler bank structures. The boiler bank (Figure 4)
works similarly as the pre-boiler bank but vertical part of the screen can be connected to the
structure of the boiler bank, when the pre-boiler bank is not needed. It is also much larger and
flue gases turn vertically down, when they come across back wall of the boiler bank. After
the boiler banks flue gases rise up to the first economizer. (Pentinsaari, 24)
Figure 4. Boiler generating bank (Pentinsaari, 25)
The dry solids content of the incoming black liquor dry solids flow is the most important
design criterion, because it establishes the required size of the boiler. With the heating value
of the black liquor this defines the boiler capacity. With water and steam values the
maximum continuous rating (MCR) steam flow is established. (Vakkilainen, E. 2007, 2-3)
14
2.3 Furnace design Good furnace design and high quality materials improve the recovery boiler safety and heat
transfer. That is why furnace walls and floors are continually under investigation for better
materials and proper water circulation design. Sufficient water flow lowers the wall
temperature and prevents pipe damages. (Vakkilainen, E. 2007, 10-13)
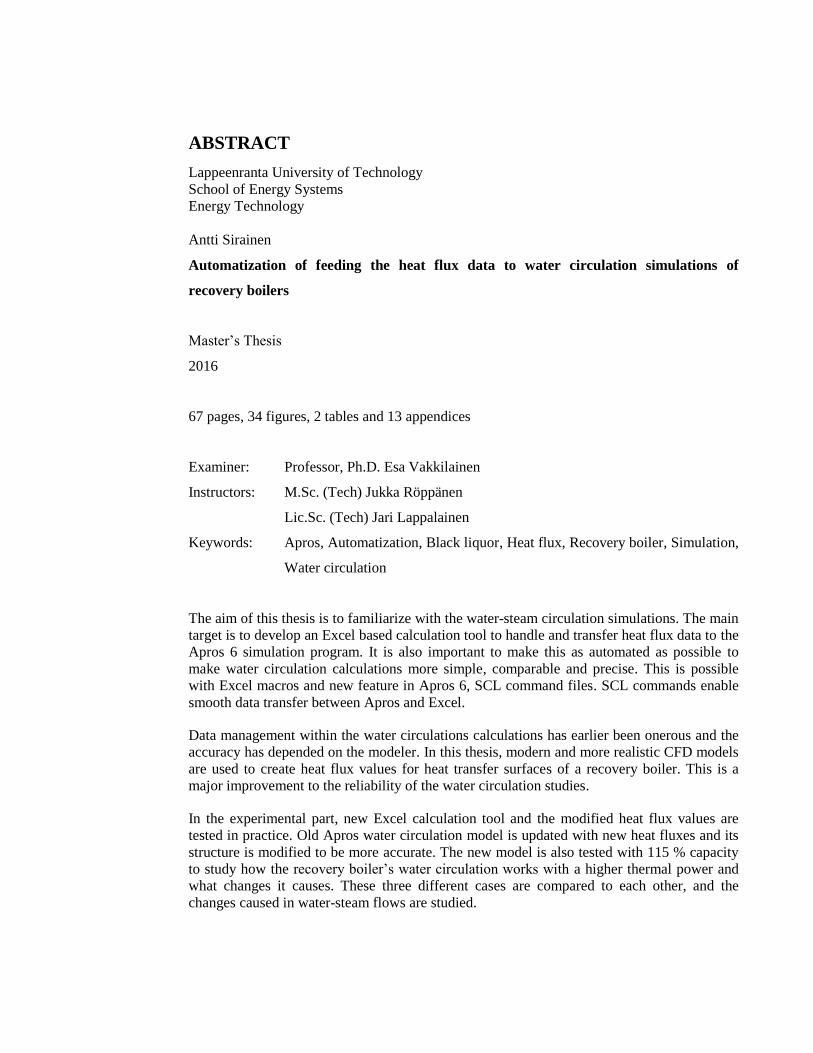
Usually the critical leaks occur in the lowest 3 m of the furnace walls (Figure 5). Proper floor
angel (2,5˚ – 4 ̊) improves the water flow, and helps to avoid parts where steam bubbles could
get stuck causing insulating gas films. Normally 0,5 m/s is the minimum velocity for safe and
steady water flow in floor tubes. Smelt spouts are usually installed 20–30cm above the floor
level so the entire floor is covered with smelt layer and reduction efficiency is high.
(Vakkilainen, E. 2007, 10-13)
The most common wall design in recovery boilers is compound tubing. Typical furnace tube
materials are Sanicro 38 and 304L. They have high corrosion resistance and they are used in
lower part of the furnace. Cheaper carbon steel is used above the highest air level. It resists
most corrosive conditions at oxygen rich conditions but bare carbon steel cannot resist black
liquor burning. (Vakkilainen, E. 2007, 10-13)
Figure 5. Furnace of recovery boiler (Vakkilainen, E. 2007, 10-13)

15
2.4 Black liquor combustion The sulfate pulping process produces large amount of black liquor. Black liquor is generated
in the cooking process as the white liquor dissolves the lignin and other organic compounds
in the wood. Weak black liquor is removed from the pulp during the pulp washing. The
separation is done to recover the cooking chemicals and to remove the organic substances
that weaken the quality of the pulp. In the evaporation plant, water is removed from the weak
black liquor, and the resulting strong black liquor is transferred to the recovery boiler (Figure
6). The sulfate pulping process produces large amount of black liquor. In modern chemical
pulping the typical black liquor dry solids content is over 75 %. (Knowpulp)
Figure 6. Black liquor combusting in the furnace (Vakkilainen, E. 2007, 5-1, text modified)
The increase of black liquor dry solids content has substantially affected the main operating
variables of the steam generation (Table 1). Dryer black liquor is particularly advantageous
since the flue gas flow often limits recovery boiler capacity. (Gullichsen, J. et al. 1999, 97)
Improving steam produce goes hand in hand with dry solid content. For example, a rise in dry
solids content from 65 % up to 80 %, increases the main steam flow about 7 %. The rise is
more than 2 % for each 5 % increase in dry solids. (Gullichsen, J. et al. 1999, 96) High black

16
liquor dry solid content also helps to reduce sulfur species in emissions. When the liquor is
dryer, it increases furnace temperature and sulfur dioxide reacts with sodium to produce
sodium sulfite. (Vakkilainen, E. 2007, 11-2)
Table 1. Effects of different liquor dry solids content (Vakkilainen, E. 2007, 6-21)
2.4 Combustion air systems Black liquor consists of organic and inorganic materials that react in the recovery boiler
furnace. To be able to sustain steady combustion, proper air feeding system is needed. When
the organic content in the black liquor increases, by reason of higher dry solids content, more
air is needed per unit of black liquor for combustion. The primary target of the air system
design is to preserve a high and steady temperature and gas supply in the lower part of the
furnace. With a proper design, the combustion takes place in the lower part and increases the
reduction efficiency and decreases the emissions. (Vakkilainen, E. 2007, 7-2 – 7-6)
Combustion air is typically introduced into the furnace at various horizontal elevations to
ensure optimum combustion and minimize emissions (Figure 6). Air is provided in to the
furnace by forced draft fans, and the flow is controlled with dampers in furnace openings,
ducts and by adjusting air fans. The air flow control with dampers in furnace openings causes
high duct air pressures which increases blower’s power consumption, but ensures balanced
flow through each opening. (Vakkilainen, E. 2007, 7-2 – 7-6)
The combustion air is delivered into the furnace at least from three levels: primary, secondary
and tertiary. Because the reducing conditions are preserved close to the char bed, in the lower
part of the furnace, the primary and secondary air levels must be located close to the floor
below the black liquor guns (Figure 6). Approximately 70 %–75 % of total combustion air is

17
introduced through the primary and secondary air nozzles, so the rest and excess air by the
tertiary air nozzles. The main reasons of tertiary air are to burn the remaining combustible
particles in the center part of the furnace and minimize NOx emissions. (Vakkilainen, E.
2007, 7-2 – 7-6).
2.5 Water circulation The circulation starts from the feed water tank, where water is pumped to the economizer.
There it is heated up to almost the saturation temperature by the flue gases. Using these feed
water preheaters, flue gases temperature decreases and therefore improves boiler efficiency.
(Gullichsen, J. et al. 1999, 263)
Water tube boilers can be classified into three different types based on the method of steam
and water circulation.
Natural circulation boilers
Forced circulation boilers
Once through boilers
Figure 7. Different water circulation types (Gullichsen, J. et al. 1999, 264)
18
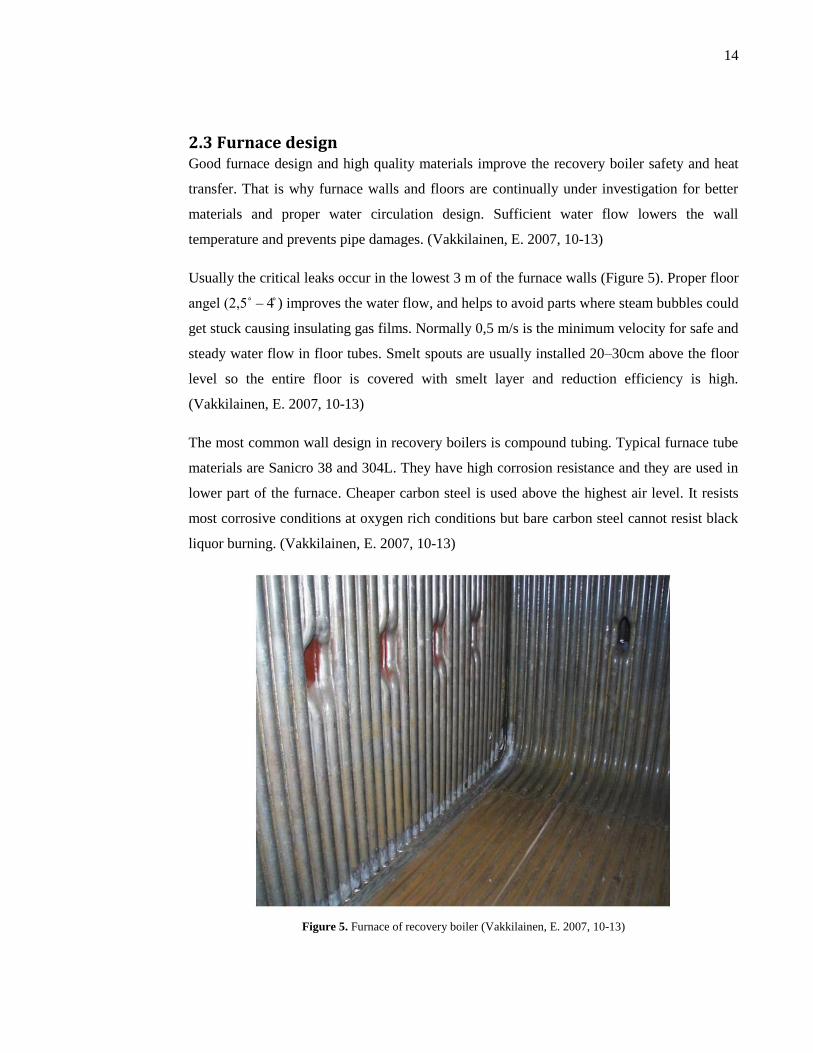
2.5.1 Natural circulation
In the natural circulation concept, the circulation of water and steam is based on the density
difference between hot and cold fluids. The downcomer from the drum and tubes around the
furnace construct a continuous tube system (Figure 8). First nearly saturated water runs down
to the header, where the flow is divided into the risers at furnace walls. In the risers water
heats up and starts to vaporize. The density of the flowing water-steam mixture in the risers is
lower than in the downcomer. This density difference causes the driving pressure (∆pst) that
pushes water-steam mixture up to the drum:
∆𝑝𝑠𝑡 = 𝑔 ∙ ∆𝐻 ∙ (𝜌𝑤 − 𝜌𝐺) (1)
where ρG = average density of water-steam mixture in the riser
ρw = density of saturated water in the downcomer
∆H = difference in levels of the drum and the point in the risers where the vaporizing
begins
g = standard gravity
When boiling starts in the bottom part of the furnace it will increase the mass flow of water.
(Gullichsen, J. et al. 1999, 263–265)
Figure 8. The principle of natural circulation (Huhtinen, M. 1994, 115, text modified)

19
The biggest weakness for this principle is the critical pressure of water. In this level, p = 22,1
MPa, the densities of water and steam are equal, 315 kg/m3, so the driving pressure is not
created anymore. Therefore natural circulation is not suitable for high pressure boilers. The
maximum pressure for proper circulation, when the steam leaves the drum, is approximately
17,0 MPa. In this pressure the density of water is about five times higher than the density of
steam. (Gullichsen, J. et al. 1999, 263–264) Figure 9 represents how operation point of
natural circulation is determined by the driving force and the flow resistance.
Figure 9. Operation point of natural circulation (Henrik, A. 1990, 834, text modified)
2.5.2 Forced circulation
In forced circulation boilers, the water-steam circulation is very similar with natural
circulation boiler except the circulation pump. High pressure water is conducted to the
vaporizer using forced circulation pumps, which also drive the mixture of water and steam
from the vaporizer back to the steam drum. Because of the forced circulation, the boiler can
be designed to use slightly higher pressures than the natural circulation concept. But the
separation of the water-steam mixture in the steam drum is still based on the difference of
densities. That is why forced the circulation boilers cannot be operated at supercritical
pressures. (Knowpulp)

20
2.5.3 Once-through circulation
Once-through boilers can be characterized as long externally heated pipe of tube system
where water is fed into pipe from one end and released as superheated steam at the other end
of the pipe. Because all the water is vaporized in furnace walls, there is no need to for a drum
and the steam can be led directly to superheaters. Once-though boilers are mostly used in
large scale power plants at supercritical pressures. This maximizes the electricity production.
(Knowpulp)
There are two main types of once through boilers: Benson and Sulzer (Figure 10). The most
common and simplest design is the Benson boiler, where the point of complete evaporation
varies with the capacity load. This design is used in large-scale steam boilers. Sulzer
monotube boiler has a special pressure vessel, Sulzer bottle, for separating water and
impurities from steam. Therefore the evaporation point is always at the bottle. (Teir, S. 2003,
65–66)
Figure 10. Schematic pictures of Benson boiler (left) and Sulzer boiler (right) (Teir, S. 2003, 65–66)
2.6 Fouling control During the combustion small char fragments, liquor particles and alkali elements entrain to
the flue gas flow. This hot ash can solidify on cooler heat transfer surfaces and cause fouling.
Fouling and fouling related phenomena have always been a major concern in recovery boiler
design and operation. With the modern computer based control system the changes in fouling
21
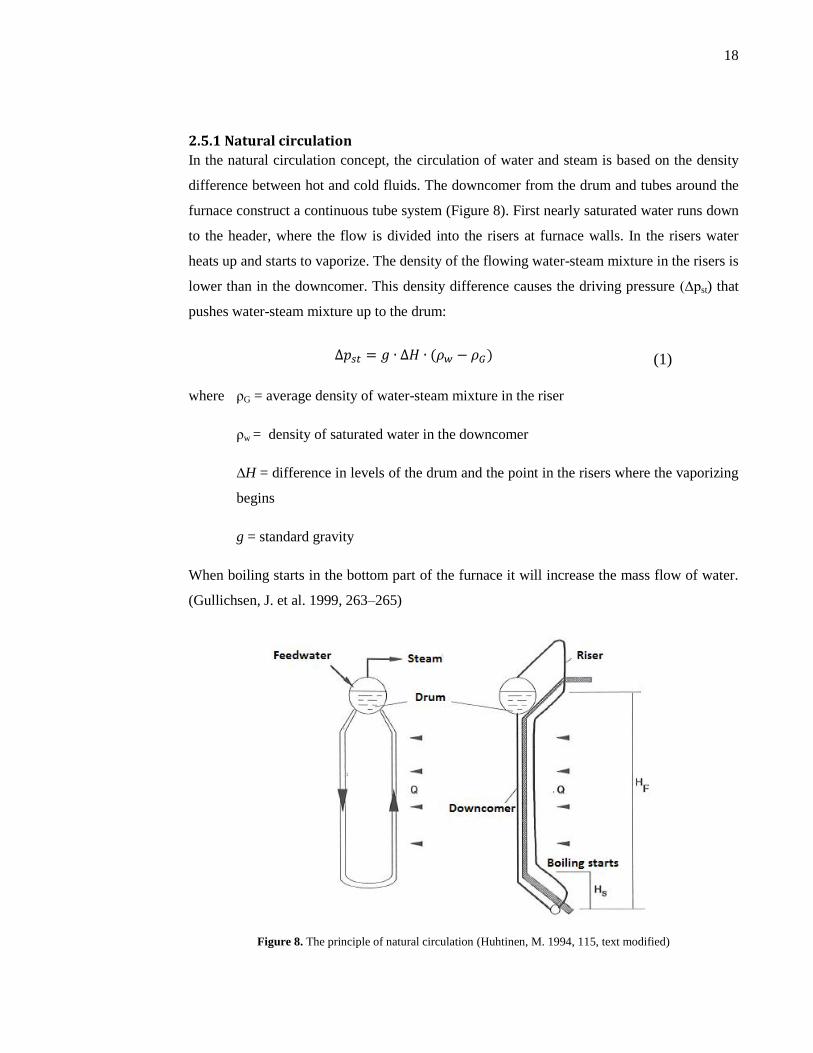
at certain heat transfer surface can be recognized. This enables to use soot blowing directly to
those surfaces where it is most necessary. (Gullichsen, J. et al. 1999, 123–124)
Figure 11. Fouled boiler bank (Vakkilainen, E. 2007, 8-3)
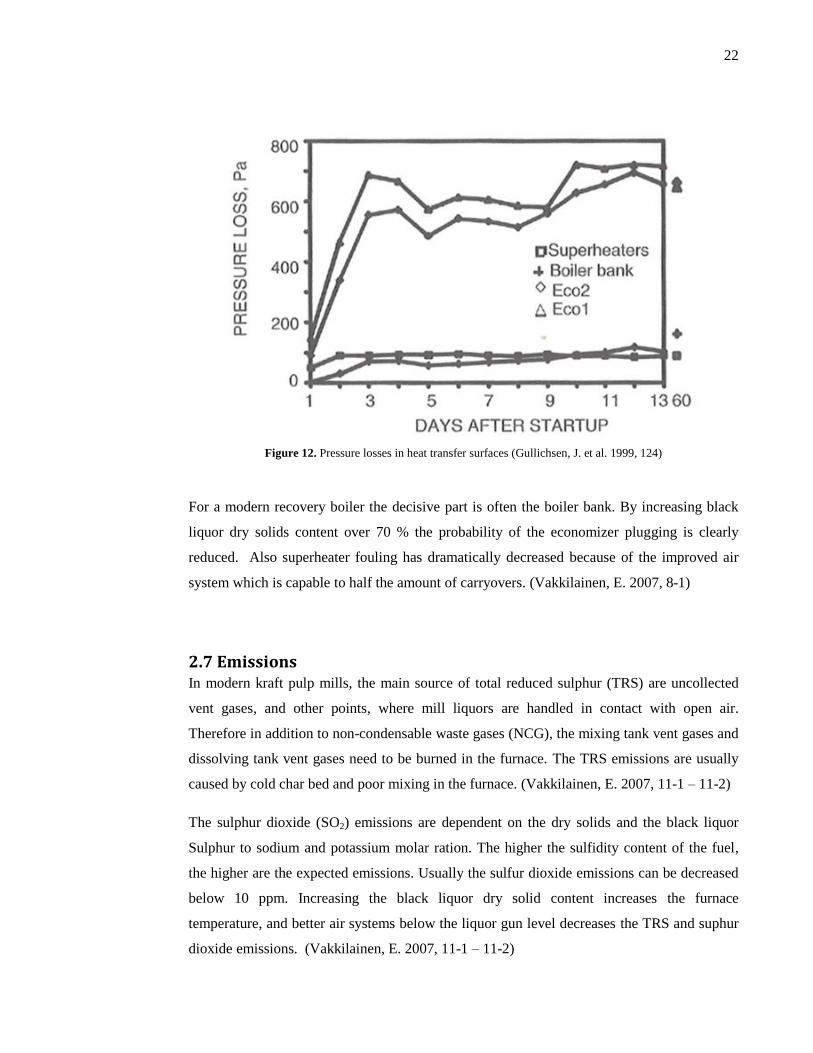
The heat flow at a heat transfer surface depends on the heat transfer area and temperature
difference between flue gas and water-steam mixture. When this surface get fouled it causes a
decrease in heat transfer efficient. At the same time the accumulation of deposits decreases
available gas flow area, and thus flue gas velocity grows causing increased pressure loss
(Figure 12). The fouling can increase until the flue gas fan cannot supply sufficient pressure
and flow. Then the recovery boiler load must be decreased, or the surfaces must be cleaned.
(Gullichsen, J. et al. 1999, 123–124)
22
Figure 12. Pressure losses in heat transfer surfaces (Gullichsen, J. et al. 1999, 124)
For a modern recovery boiler the decisive part is often the boiler bank. By increasing black
liquor dry solids content over 70 % the probability of the economizer plugging is clearly
reduced. Also superheater fouling has dramatically decreased because of the improved air
system which is capable to half the amount of carryovers. (Vakkilainen, E. 2007, 8-1)
2.7 Emissions In modern kraft pulp mills, the main source of total reduced sulphur (TRS) are uncollected
vent gases, and other points, where mill liquors are handled in contact with open air.
Therefore in addition to non-condensable waste gases (NCG), the mixing tank vent gases and
dissolving tank vent gases need to be burned in the furnace. The TRS emissions are usually
caused by cold char bed and poor mixing in the furnace. (Vakkilainen, E. 2007, 11-1 – 11-2)
The sulphur dioxide (SO2) emissions are dependent on the dry solids and the black liquor
Sulphur to sodium and potassium molar ration. The higher the sulfidity content of the fuel,
the higher are the expected emissions. Usually the sulfur dioxide emissions can be decreased
below 10 ppm. Increasing the black liquor dry solid content increases the furnace
temperature, and better air systems below the liquor gun level decreases the TRS and suphur
dioxide emissions. (Vakkilainen, E. 2007, 11-1 – 11-2)

23
Nitrogen oxides (NOx) emissions mainly consist of nitric oxide (NO). Recent changes in
modern recovery boiler operations have increased the NOx level: high black liquor dry solids,
combustion of NCG and combustion of dissolving vent gases. Nitrogen emissions can be
reduced by optimization of the air and fuel feeding and in the future by selective catalytic
reduction (SCR). (Vakkilainen, E. 2007, 11-3 – 11-4)
Nowadays the dust emissions after the recovery boiler economizer are typically low. They
are strongly dependent on boiler load and the furnace gas upward velocity. Firing with high
velocities and small droplets of black liquor causes excess carryover and high dust loading.
The Dust emission can be efficiently reduced by using electrostatic precipitators. (Gullichsen,
J. et al. 1999, 11-8 – 11-9)
Table 2. Emissions of recovery boilers in four decades (Andritz)
24
3. NATURAL CIRCULATION BOILERS
Depending mainly on the size of the boiler, there can be used few different types of natural
circulation structures. The most common concepts of natural circulations are single and bi-
drum boilers that are suitable for large scale power plants. For smaller boilers an option is
Eckrohr boiler. (Teir, S. 2003, 52–54)
3.1 Operating principle The main operating principles in all different types of natural circulation boilers are the same,
but specialization for different fuels, temperatures and pressures chances, the structure.
Because the circulation is caused by density differences of water, the design is simple and
reliability is high. Main components for natural circulations are steam drum, downcomers
and vaporizer tubes. (Teir, S. 2003, 54–55)
3.1.2 Single drum boilers
The feedwater is pumped in the water-steam circulation from the feed water tank. The feed
water is preheated in the economizer to about 10 ˚C below the boiling temperature. The
temperature must stay below under the saturation temperature to avoid untimely boiling in
the economizer pipes. From economizer the feed water flows to the steam drum, where it is
mixed with the existing water. (Teir, S. 2003, 54–55)
From the drum, saturated water flows through the downcomer tubes to the main inlet header
(Figure 13). In the main inlet header the water flow is distributed to the riser tubes where it
partially evaporates. The raiser tubes form the evaporator unit in the boiler. After these hot
tubes, the water-steam mixture returns in the steam drum. There steam is separated from
liquid water and led to the superheaters, where liquid water returns into the downcomers.
The steam from steam drum is heated beyond its saturation point in the superheaters. After
the last superheater the steam exits the boiler and continues to steam turbines. In a modern
recovery boiler, the main steam output temperature is typically 490-515 ˚C and pressure 95-
110 bar. (Teir, S. 2003, 54–55)

25
Figure 13. Natural circulation in a single drum boiler (Knowpulp)
3.1.2 Two drum boilers
The two drum boiler design represents the old model of recovery boilers (Figure 14). Their
maximum capacity is about 1700 tds/d. The main steam pressure is typically about 8,5 MPa
and temperature 480 ˚C. The newest two drum boilers have horizontal economizers and they
use three level air systems. (Vakkilainen, E. 2007, 2-4 – 2-5)
The pre-heated feedwater flows to the upper steam drum, which is primarily a water-steam
separator and distribution device. This boiler bank is a natural circulation steam generator,
where cooler water flows down the back part, and hot water-steam mixture flows upwards in
the front of the bank. The lower drum is called as a mud drum. Water flows down from the
mud drum through downcomers to the lower furnace headers. There the flow is separated to
floor tubes, goes up through the furnace waterwalls, and up to the roof tubes, and finally back
to the steam drum. (Grace, M.)
Compared to the single drum boilers, the two drum boilers have many practical problems.
Single drum construction eliminates the possibility of water leakage to furnace as it is located
outside the furnace. There are also much less holes in the steam drum walls, so wall thickness

26
can be thinner, that improve start up and stop-down times, and the whole single drum
construction is low-priced. The biggest weaknesses in the two drum boiler design are that it is
not possible to use high capacities, temperature and pressures. Tube stiffness limits cross
flow two drum arrangement to about 2000 tds/d size, and vertical flow two drum
constructions have suffered flow plugging because of vibration stiffeners. (Vakkilainen, E.
2007, 1-6)
Figure 14. Two drum recovery boiler (Adams, T. et al. 1997, 5)
3.1.3 Eckrohr boilers
The Eckrohr boilers, also known as corner tube boilers, are usually small size water tube
boilers. The first boilers were designed for low power capacities, but nowadays corner tube
boilers can as well be manufactured for high power capacities and pressures. The advantage
of the corner tube design is its versatility. It can be used to generate hot water, to heat up
thermal oil, and to heat other heat exchanges. (Echrohr-kessel)
The design of Eckrohr boiler is very simple (Figure 15). The construction is very similar to
earlier introduced natural circulation boilers but the capacity is usually modest. Water flows
from the drum to down corner tubes, and further to collector, where it is separated to bottom

27
tubes. Water starts to vaporize in the riser tubes and the water-steam mixture flows upwards.
Steam is partly separated already in the overflow tubes and mixture tubes and the rest in the
steam drum. The remaining liquid water continues its circulating, via down corner tubes and
return tubes, until it vaporizes. (Echrohr-kessel)
Figure 15. Natural circulation in an Eckrohr boiler (Scheider kessel)
3.2 Heat transfer in the boiler Heat transfer is the phenomenon how the heat energy transfers from the hot furnace to
cooling water. Heat transfer happens in three different modes that are explained in the figure
16 below. When a temperature gradient occurs in a stationary medium, it is called as
conduction to refer to the heat transfer that exists across the medium. The second mode,
convection, refers to heat transfer that happens between a surface and a moving fluid if they
are at different temperatures. The third one way of thermal heat transfer is thermal radiation.
All surfaces of finite temperature emit energy in the form of electromagnetic waves.
(Incropera, F. et al. 1996, 2)

28
Figure 16. Heat transfer modes (Incropera, F. et al. 1996, 2)
The biggest heat transfer to water occurs in the furnace, where it is transferred through
furnace wall tubes. The rows of tubes at the furnace walls which are part of the water
circulation circuit, are called waterwalls. Cooler water is fed to the main inlet header where it
is divided into the smaller wall tubes. Water raising these hot wall tubes receives heat from
the char bed and flames. The furnace walls can represent as much as 50 % of the heat transfer
to produce steam. (Adams, T. et al. 1997, 13)
The upper part of furnace, the bullnose, is located on the rear wall of the furnace. Its intention
is to protect the superheaters from direct furnace radiation, and to turn the combustion gas
flow around the corner towards the boiler exit opening. The convective heat transfer section
consists of superheaters, boiler bank, economizer and may include a set of screen tubes.
Mainly the heat transfer from the hot flue gas to these banks happens by convection. Still in
the hottest parts, such as screen tubes, radiation can contribute nearly half of the heat transfer.
(Adams, T. et al. 1997, 13–14)
3.2.1 Conduction
As mentioned earlier, heat transfer caused by the temperature difference through a solid
material is called as conduction. Heat flows from the hotter side to the cooler side. Heat
transfer continuous until the temperature balance is reached.
The following equation 2 presents the heat flow by conduction (Incropera, F. et al. 1996, 4):

29
𝑞𝑥′′ = 𝑘𝑇1 − 𝑇2
𝑠= 𝑘
∆𝑇
𝑠 (2)
where
qx’’ = conduction heat flux in specific location [W/m2]
k = thermal conductivity [W/mK]
T = temperature [K]
s = thickness of the wall [m]
Different materials have different thermal conductivities. Metals are excellent thermal
conductors, while gases have very low thermal conductivity. Figure 17 presents the thermal
conductivities for some materials. (Gullichen, J. et al. 1999, 284)
Figure 17. Thermal conductivity (Incropera, F. et al. 1996, 47)

30
3.2.2 Convection
The convection heat transfer mode is continuous both by the bulk motion and by random
molecular motion of the fluid within the boundary layer. The contribution due to the
molecular motion dominates near the surface where the fluid velocity is low. Actually in the
interface between the surface and the fluid, the velocity of fluid is zero and heat is transferred
by this mechanism only. Equation for convective heat flux is shown below (Incropera, F. et
al. 1996, 6–8)
𝑞′′ = ℎ(𝑇∞ − 𝑇𝑠) (3)
where
q’’ = convective heat flux [W/m2]
h = convection heat transfer coefficient [W/m2K]
T∞ = temperature above boundary layer [K]
Ts = surface temperature [K]
The convection heat transfer coefficient can be calculated by (Incropera, F. et al. 1996, 314)
ℎ = 𝑁𝑢 ∙ 𝑘
𝐿 (4)
Nu = Nusselt number [-]
k = thermal conductivity [W/mK]
L = length of the boundary [m]
Nusselt number is equal to the dimensionless temperature gradient at the surface, and it
provides a measure of the convection heat transfer occurring at the surface.
Nusselt number is often calculated by (Incropera, F. et al. 1996, 314)
31
𝑁𝑢 =ℎ𝐿
𝑘= 𝑓(𝑅𝑒, 𝑃r) = 𝐶 ∙ 𝑅𝑒𝑚 ∙ 𝑃𝑟𝑛 (5)
C = constant from Reynolds number [-]
Re = Reynolds number [-]
m = constant [-]
Pr = Prandtl’s number [-]
n = constant [-]
Where C, constants m and n vary with nature of the surface geometry and the type of flow
(Incropera, F. et al. 1996, 347).
Reynolds number represents the ratio of the inertia to viscous forces (Equation 6). When the
value is small, the inertia forces are relative to the viscous forces. The turbulences are then
dissipated and the flow remains laminar. When the Reynolds number increases, the inertia
forces can be sufficient to amplify the apprehension mechanisms, and a transition to
turbulence occurs. (Incropera, F. et al. 1996, 295)
𝑅𝑒 = 𝜌 ∙ 𝑢∞ ∙ 𝑥
𝜇 (6)
where
ρ = flue gas density [kg/m3]
u = flue gas velocity [m/s]
x = length of the boundary [m]
μ = dynamic viscosity [kg/ms]
Prandtl number represents the ratio of the momentum and thermal diffusivities. The Prandtl
number can be expressed in the form of (Incropera, F. et al. 1996, 320)
𝑃𝑟 = 𝑐𝑝 ∙ 𝜇
𝑘 (7)

32
where
cp = specific heat at constant pressure [J/kgK]
k = thermal conductivity [W/mK]
More recently, instead of equation 5, a new formula (Zhukauskas correlation) has been
proposed as follows:
𝑁𝑢 = 𝐶 ∙ 𝑅𝑒𝐷,𝑚𝑎𝑥𝑚 ∙ 𝑃𝑟0,36 ∙ (
𝑃𝑟
𝑃𝑟𝑠)
14 (8)
For fluid flow across tube bundles (Figure 18), that is composed of 20 or more rows (NL ≥
20): (Incropera, F. et al. 1996, 380)
[
𝑁𝐿 ≥ 200,7 ≤ Pr ≤ 500
1000 ≤ 𝑅𝑒𝐷,𝑚𝑎𝑥 ≤ 2 ∙ 106]
where all properties except Pr are evaluated at the arithmetic mean of the fluid inlet and
outlet temperatures and constants C and m depend on flow conditions.
Figure 18. Tube bank in cross flow (Incropera, F. et al. 1996, 377)

33
Newton’s law of cooling is often used to present the heat transfer of surfaces. The mean
temperature Tm is a convenient reference temperature for internal flows, and the free
temperature Ts for external flows. Accordingly, Newton’s law of cooling may be expressed
as (Incropera, F. et al. 1996, 427)
𝑞𝑠′′ = ℎ(𝑇𝑠 − 𝑇𝑚) (9)
For circular tubes heat transfer can also be written by (Incropera, F. et al. 1996, 432)
𝑞𝑠′′ =
𝑞𝑐𝑜𝑛𝑣
𝑃 ∙ 𝐿 (10)
where P is the surface perimeter and L is the length.
The total heat transfer rate qconv can be simplified to form: (Incropera, F. et al. 1996, 436)
𝑞𝑐𝑜𝑛𝑣 = ℎ𝐴𝑠∆𝑇𝑙𝑚 (11)
where
As is the tube surface area
∆Tlm is the logarithmic mean temperature difference (Incropera, F. et al. 1996, 436)
∆𝑇𝑙𝑚 = ∆𝑇𝑜 − ∆𝑇𝑖
ln (∆𝑇𝑜∆𝑇𝑖
)
(12)
where
∆To is the fluid temperature at outlet
∆Ti is the fluid temperature at inlet

34
When evaporation happens at a solid-liquid boundary it is called as boiling. Boiling takes
place when the surface temperature Ts exceeds the saturation temperature Tsat corresponding
to the liquid pressure. Heat transfer from the surface to the liquid can be calculated by using
appropriate form of Newton’s law of cooling (Equation 9) (Incropera, F. et al. 1996, 537)
𝑞𝑠′′ = ℎ(𝑇𝑠 − 𝑇𝑠𝑎𝑡) = ℎ∆𝑇𝑒
where
Te = excess temperature (≡Ts-Tsat)
The boiling process is characterized by the formation of bubbles, which grow and
subsequently detach from the pipe surface. Vapor bubble growth and dynamics depend on the
excess temperature, thermophysical properties of the fluid, and the nature of the surface. The
dynamics of the bubble formation affect liquid motion near the surface, and thus strongly
influence the heat transfer coefficient. (Incropera, F. et al. 1996, 537-538)
Turbulent convection heat transfer for steam and water flowing inside a circular tube can be
calculated with Hausen equation (Vakkilainen, E. 2007, 6-18):
𝑁𝑢𝑖 = 0,0235 ∙ (𝑅𝑒0,8 − 230) ∙ (1,8 ∙ 𝑃𝑟0,3 − 0,8) (13)
[2300 < 𝑅𝑒 < 10 ∙ 106
0,6 < 𝑃𝑟 < 500]
3.2.3 Radiation
Thermal radiation is energy that is emitted to material that is at a finite temperature. The
emission may be attributed to changes in the electron configurations of the constituent atoms
or molecules. The radiation field is transported by electromagnetic waves, so it does not need
the presence of material medium. The maximum theoretical heat flux that ideal radiator may
emit is the emissive power. (Incropera, F. et al. 1996, 9)

35
𝑞𝑚𝑎𝑥′′ = 𝜎𝑇𝑠
4 (14)
σ = Stefan-Boltzmann constant (= 5,67·10-8
W/m2 K
4)
Ts = absolute temperature of the surface [K]
The heat flux emitted by a real surface is less than the ideal radiator. The emissivity
represents a measure of how efficiently a surface emits energy relative to a blackbody.
(Incropera, F. et al. 1996, 9)
𝑞′′ = 휀𝜎𝑇𝑠4 (15)
ε = the surface emissivity [-] (Incropera, F. et al. 1996, 649)
Consider radiation exchange between two black surfaces of arbitrary shape (Figure 19).
Defining qi→j as the rate at which radiation leaves surface i and is intercepted by surface j.
The net heat flux to the surface is (Incropera, F. et al. 1996, 729)
𝑞𝑛𝑒𝑡′′ = 𝐴𝑖𝐹𝑖𝑗𝜎(𝑇𝑖
4 − 𝑇𝑗4)
(16)
A = arbitrarily oriented surface [m2]
F = view factor [-]
Figure 19. Surface radiosity (Incropera, F. et al. 1996, 645)
36
3.2.4 Overall heat transfer
The overall heat transfer for recovery boiler is a complex phase. There is many variables and
accurate results are practically impossible to achieve. That is why some simplifications and
approximations are needed. The overall heat transfer in boiler can be expressed with general
heat transfer equation. (Vakkilainen, E. 2007, 6-16)
Ф = ℎ𝐴∆𝑇 (17)
where
Ф = heat transfer [W]
h = overall heat transfer coefficient [W/m2K]
A= heat transfer surface [m2]
∆T = temperature difference [K]
The overall heat transfer coefficient h is a function of convective and radiative heat transfer.
(Vakkilainen, E. 2007, 6-16)
ℎ = 𝑓0
1ℎ𝑖
∙1
ℎ𝑜+ 𝐹(𝜆, 𝑑𝑜, 𝑑𝑠, 𝑠)
(18)
ℎ𝑜 = 𝑓𝑛 ∙ ℎ𝑐 + ℎ𝑟 + ℎ𝑒𝑥
where
fn = form correction [-]
fo = overall correction [-]
hi = inside heat transfer coefficient referred to the outside surface [W/m2K]
ho= outside heat transfer coefficient [W/m2K]
hr = radiative heat transfer coefficient [W/m2K]
hex = external heat transfer [W/m2K]
hc = convective heat transfer coefficient [W/m2K]

37
k = heat conductivity of tube material [W/mK]
do = outside tube diameter [m]
ds = inside tube diameter [m]
s = tube wall thickness [m]
The correction for number of rows, fn,
𝑓𝑛 = [
(𝑛𝑟 − 1)2 − 1
(𝑛𝑟 − 1)2; 𝑛𝑟 > 1
0,75 ; 𝑛𝑟 = 1
]
where nr is the number of rows in heat transfer surface.
The heat transfer resistance through a tube of uniform material for a tubular construction with
separated tubes is
𝐹(𝜆, 𝑑0, 𝑑𝑠, 𝑠) = 1
𝑑𝑜2𝑘
𝑙𝑛𝑑𝑜𝑑𝑖
(19)
Radiation heat transfer coefficient can be determined by radiation heat flow. (Vakkilainen, E.
2007, 6-16)
ℎ𝑟 = Ф
𝐴𝑒𝑓𝑓(𝑇𝑔 − 𝑇𝑤) (20)
If temperatures and emissivities are known, the radiation heat flow Ф can be expressed as
(Vakkilainen, E. 2007, 6-17)
Ф = 𝐴𝑒𝑓𝑓
휀𝑤
𝛼𝑑𝑔 + 휀𝑤 − 𝛼𝑑𝑔휀𝑤𝛿(휀𝑑𝑔𝑇𝑔
4 − 𝛼𝑑𝑔𝑇𝑤4)
(21)
38
where
Aeff = efficient area [m2]
εw = emissivity of the wall [-]
εdg = emissivity of the dust gas [-]
αdg = absorptivity of the dust gas [-]
Tg = temperature of the gas [K]
Tw = temperature of the wall [K]
3.3 Fluid Dynamics To ensure proper operation of a natural circulation boiler, certain aspects in the fluid
dynamics must be well known. In a recovery boiler there is a large amount of heat pipes in
different temperature conditions and positions, so it is a challenging task to guarantee a good
and steady flow. By knowing the following facts, properly water-steam circulation can be
achieved.
3.3.1 Two-phase flow in vertical pipes
Two-phase water-steam flow may occur in many different regimes or structures. Especially
in heat pipes the transition from one pattern to another is more a continuous process than
abrupt. However, for heated, co-current water-steam flow in vertical tube, four general flow
patterns are recognized (Figure 20). (Collier, J. 1981, 9–12)
1) Bubbly flow is the first phase after the saturated, single phase flow, when water starts
to vaporize in heating pipe. It contains relatively discrete bubbles in continuous
liquid water phase. Bubble shape, size and distribution are dependent upon the flow
rate, enthalpy, heat input rate and pressure.
2) Slug flow consist mainly of large bubbles, approaching the tube size in diameter,
separated from the tube wall by a small layer of slugs of water which may also
contain small amount of bubbles.

39
3) Annular flow happens, when bubbles unites forming a thin liquid layer on the tube
wall with a continuous steam core. There most of the liquid is flowing up in the
annular film. At high volume fractions of gas, the annular film becomes very thin and
bubble generation is suppressed.
4) Drop flow is the last step before single phase steam flow. A continuous steam core
transports entrained water droplets which slowly evaporate until all the water is
turned into steam. (Collier, J. 1981, 9–12)
Figure 20. The development of a two-phase flow (Collier, J. 1981, 134)
3.3.2 Two-phase flow in horizontal pipe
Flow patterns in two-phase horizontal flows are much more influenced by the gravity than
vertical flow. That generates two different layers, the gas on the top and the liquid on the
40
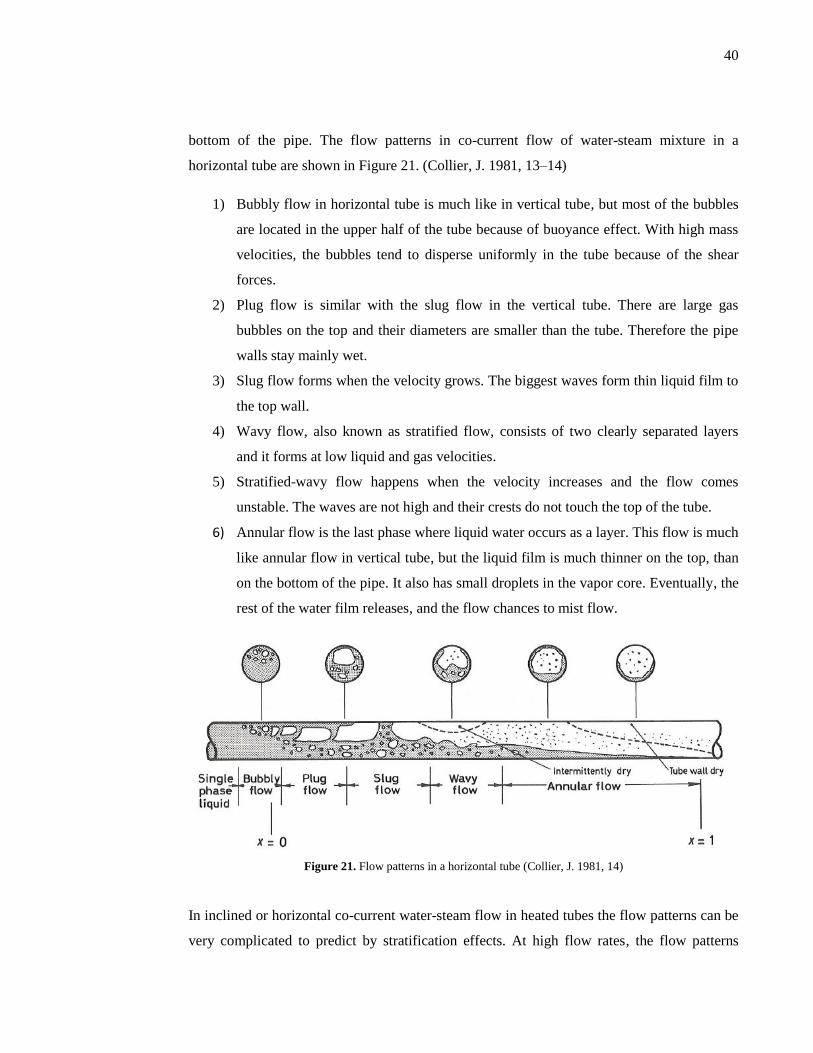
bottom of the pipe. The flow patterns in co-current flow of water-steam mixture in a
horizontal tube are shown in Figure 21. (Collier, J. 1981, 13–14)
1) Bubbly flow in horizontal tube is much like in vertical tube, but most of the bubbles
are located in the upper half of the tube because of buoyance effect. With high mass
velocities, the bubbles tend to disperse uniformly in the tube because of the shear
forces.
2) Plug flow is similar with the slug flow in the vertical tube. There are large gas
bubbles on the top and their diameters are smaller than the tube. Therefore the pipe
walls stay mainly wet.
3) Slug flow forms when the velocity grows. The biggest waves form thin liquid film to
the top wall.
4) Wavy flow, also known as stratified flow, consists of two clearly separated layers
and it forms at low liquid and gas velocities.
5) Stratified-wavy flow happens when the velocity increases and the flow comes
unstable. The waves are not high and their crests do not touch the top of the tube.
6) Annular flow is the last phase where liquid water occurs as a layer. This flow is much
like annular flow in vertical tube, but the liquid film is much thinner on the top, than
on the bottom of the pipe. It also has small droplets in the vapor core. Eventually, the
rest of the water film releases, and the flow chances to mist flow.
Figure 21. Flow patterns in a horizontal tube (Collier, J. 1981, 14)
In inclined or horizontal co-current water-steam flow in heated tubes the flow patterns can be
very complicated to predict by stratification effects. At high flow rates, the flow patterns
41
behave close to the vertical tubes. But at lower rates, additional distinct flow patterns takes
place as gravity stratifies the flow with steam concentrated in the upper portion of the tube.
This may cause problems because critical heat flux (CHF) or dryout conditions occur at much
lower steam qualities and lower heat input rates in horizontal and inclined tubes. (Stultz, S. &
Kitto, J. 1992, 5-3)
3.3.3 Boiling process
Flow boiling is a complex phenomenon that consists of interaction of two phase fluid flow,
gravity, material phenomena and boiling heat transfer mechanisms. Figure 20 is a classic
picture of boiling in a long, uniformly heated, circular tube. The water enters the pipe from
below as a subcooled liquid and convection heat transfer cools down the tube wall. Water
temperature rises, and finally in region B the subcooled nucleate boiling starts, while the wall
temperature remains few degrees above the saturation temperature. (Collier, J. 1981, 133–
136)
The water-steam mixture proceeds through a series of flow patterns such as bubbly, slug and
annular. This is a result of the complex interplay of surface tension forces, interfacial
phenomena, pressure drop, water-steam densities and momentum effects coupled with the
surface boiling behavior. (Collier, J. 1981, 133–136)
Next type of boiling, convective boiling, also results in high heat transfer rates. There heat
transfer occurs through conduction and convection across the thin annular film, with surface
evaporation at the water-steam interface. It has to be noted that some of the liquid water
occurs in the steam core as dispersed droplets. Eventually, in region G, the tube surface is no
longer covered with water layer and it leads to dryout. At this point the wall temperature
starts rapidly to increase. (Collier, J. 1981, 133–136)
3.4 Circulation Problems Natural circulation boilers have some circulation challenges that have to be noticed. Because
recovery boilers do not have circulation pumps, the water-steam flow must be designed
properly before use. With good engineering these problems can be solved and natural
circulation boiler is easy and safe to use.

42
3.4.1 Critical heat flux
Critical heat flux is very important phenomenon to consider in the water circulation design.
The key factors for CHF are pressure, steam quality and mass flux. Also flow passage
dimensions, heat flux profile and wall surface configurations affect the formation of critical
heat flux. Figure 22 shows how the tube wall temperature acts under different heat input
conditions. When heat fluxes are low, the fluid flow can be nearly evaporated without a
temperature rise. With moderate and high heat fluxes the point of CHF moves towards the
tube inlet and cause some temperature rise. At very high heat fluxes CHF occurs at a low
steam quality, and causes a rapid temperature rise in tube walls, even that the metal
temperature can be high enough for melting. At extremely high heat input rates, CHF can
occur even in subcooled water (Stultz, S. & Kitto, J. 1992, 5-3 – 5-6)
In recovery boilers critical heat flux can be prevented with proper water circulation
engineering. The main target is to ensure constant water flow in tubes, and so to prevent
dryout. Stratified flow (Figure 21) is undesired situation in heat pipes. Risk for it is higher
especially when the amount of steam fraction is high. The biggest probability to critical heat
flux appears in horizontal and sloping heat pipes, for example in the roof and bull nose. If
water-steam flow is unstable, CHF can occur also in vertical heat pipes in the furnace. The
most dangerous situation is, when the flow is stratified and heat is transferred from above, i.e.
from the dry side. (Röppänen, J. conversation)
Figure 22. Tube wall temperatures under different heat input conditions (Stultz, S. & Kitto, J. 1992, 5-4)

43
3.4.2 Steam drum
The main function of a steam drum is to separate the water-steam mixture that comes from
risers. The separation efficiency of steam drum must be high, because liquid may contain
salts that can be very harmful to superheaters and turbines by causing deposits. (Gullichsen,
J. et al. 1999, 265-266) Contamination causes economic harm, so the level of these solids
must stay below 0,6 ppm. Steam drum also prevents water droplet carryover into the
superheaters, and minimize steam carryunder into the downcomers. Because the solubility of
salts is much higher in liquid water, the droplet carryover level is kept under 0,25 % by
weight. Those harmful impurities are removed from circulation by continuous blow-down.
(Stultz, S. & Kitto, J. 1992, 5-13)
Figure 23 introduces the construction of a large scale modern steam drum, where the water-
steam separation is done by cyclones and drop separators. The water-steam mixture comes
from the risers to cyclone, where it is separated due to centrifugal forces. The cyclone
separation is widely used and effective but it causes a large pressure loss. Then steam flows
through drop separators, where heavier water drops hit corrugated plates and get separated
from the steam flow. In older boilers, where water-steam flow is modest and pressure is low,
steam can be separated by using baffle plates. Their function is based on gravity by different
density of steam and water. Heavy water drops fall down, while lighter steam rises to the
steam outlet connection. (Gullichsen, J. et al. 1999, 265–266)
Figure 23. Construction of a steam drum (Vakkilainen, E. 2007, 7-12 – 7-13)

44
3.4.3 Unbalanced flow
Instability in two-phase flow in heat pipes can cause water circulation problems with by
sudden changes in flow direction, reduction in flow rate and oscillating flow rates in a single
flow passage. Frequently in multi-channel systems, the total mass flow rate can remain
constant while oscillating flows in individual heat pipes still may occur. Two most common
types of unbalanced flow in boiler pipes are excursive instability, including Ledinegg and
flow reversal, and density wave oscillations. (Stultz, S. & Kitto, J. 1992, 5-10 – 5-12)
The excursive instability is characterized by conditions, where small interferences in
operating parameters result in a large flow rate change to a separate steady-state level.
Unsteadiness may occur, if the slope of the pressure drop versus flow characteristic curve for
the tube becomes less, than the slope of the supply curve. (Stultz, S. & Kitto, J. 1992, 5-10 –
5-12)
Density wave instabilities involve kinematic wave propagation phenomena. Regenerative
feedback between the flow rate, vapor formation and pressure drop produces self-sustaining
alternating waves of higher and lower density mixture that travel through the tube. This
dynamic instability can occur in single tubes that contain two-phase flows. (Stultz, S. &
Kitto, J. 1992, 5-10 – 5-12)
These unstable conditions in steam generating can cause unit control problems, risk of critical
heat flux, tube wall temperature oscillation, and thermal fatigue failure and accelerated
corrosion attack. These instabilities can be reduced by smooth changes in heat input and
increasing circulate pressure e.g. using larger size downcomer pipes to decrease pressure
losses. (Stultz, S. & Kitto, J. 1992, 5-10 – 5-12)
3.4.4 Water side corrosion
Inner walls of tubes can be exposed to many different types of corrosion. Water side
corrosion can cause safety and operational reliability risk for the recovery boiler. To prevent
this corrosion feedwater purity, temperature and flow velocity have strict limits.
(Vakkilainen, E. 2007, 10-10)
Oxygen corrosion accuses pitting of tube inside surface and rapid failure of a tube can happen
with comparatively small overall metal loss. Evens small amounts of dissolved oxygen can

45
cause serious damage to pipe walls, and oxygen turns extremely corrosive when water
temperature rises. Oxygen corrosion can occur also when boiler is out of service, but it can be
prevented by filling the dry pipe lines with nitrogen. Oxygen is almost completely removed
in a deaerator or by chemical additives. However a small amount of oxygen is needed to
reduce flow assisted corrosion. (Vakkilainen, E. 2007, 10-10)
Wrong pH levels also cause corrosion problems. Acid corrosion occurs, when water pH is too
low, and caustic corrosion when it is too high. Highly acidic or caustic conditions in water
side can dissolve the protecting magnetite layer from the pipe wall surface. Control of pH in
high purity feedwater systems can be very problematic. Feedwater for example is subject to
extreme pH swings. Commonly some buffering chemical is used to balance the § pH level,
typical selection is phosphate. (Vakkilainen, E. 2007, 10-11)
Flow-accelerated corrosion (FAC) may cause high rates of wall thinning of piping, tubing
and vessels made of carbon and low-alloy steels that are exposed to wet steam or high-
temperature water. This kind of conditions typically occurs in power generation industry. In
the worst case, it may cause breaks in some high temperature and pressure component
releasing high-temperature water or steam. The main reason to flow-accelerated corrosion is
the dissolution of the normally protective oxide films on carbon or low-alloy steel at high-
flow or highly turbulent locations. It reduces or eliminates the oxide film and leads to a rapid
removal of the tube material (Figure 24). (Huttunen-Saarivirta, E. & Auerkari, P. 2014)
Figure 24. Flow-accelerated corrosion damaged pipe (U.S. Water)

46
To minimize the risk of FAC in the downcomers and other boiler pipes, the water
temperature should be above 300 ˚C, while the maximum risk zone is 100 ˚C–280 ˚C. The
flow velocity in recovery boiler tubes should be below 10 m/s, because of the low oxygen
content of the system (<5μg/kg). Proper material selection can also reduce the risk. Replacing
carbon and carbon-manganese steels by higher chromium steel grades helps to reach better
FAC resistance. (Huttunen-Saarivirta, E. & Auerkari, P. 2014)
One important factor in preventing water-steam side corrosion is to keep internal pipe walls
clean. Major factors for to the formation of a heat deterrent scale or deposit are contaminating
elements present in the makeup water, metal oxides transported to the boiler with feed water,
contaminants from rest of the plant introduced into the condensate returned to the boiler and
solids present in condenser leakage. Good blowdown adjustments also help to keep surfaces
clean. Some compounds, such as calcium carbonate and calcium sulfate, can precipitate in
the header and pipe walls. These substances have a low thermal conductivity, and even a thin
scale layer can cause overheating in the wall. (Vakkilainen, E. 2007, 10-12)

47
4. WATER CIRCULATION MODELLING
Computational cater circulation studies can be done many different softwares which are
specialized to certain tasks. Modern modeling programs for heat transfer and flow
calculations are capable to give more detailed data than earlier. In other words, the water
circulation calculations are more reliable than a decade ago.
4.1 Used softwares The number of commercial computer softwares for water circulation modeling is quite
limited. The most commonly used simulation programs are Nova, IPSEpro and APROS. Heat
fluxes are collected e.g. from CFD models which are made using Ansys Fluent. Other well-
known CFD programs are OpenFOAM and ANSYS CFX. ANITA is the process simulation
software that is used in Andritz for recovery boilers, and in this thesis it was used to calculate
thermal powers and few other needed process values. For modification and analysis of data,
Microsoft Excel is used, due to its universality and versatility.
4.1.1 Apros Apros is software that provides tools, solution algorithms and model libraries for full-scale
modelling and simulation of dynamic processes, such as pulp and paper mills, nuclear power
plants and combustion power plants. (Apros) In this case, when a recovery boiler is modeled,
Apros Combustion is the version used. Apros Combustion is dynamic simulation program for
thermal power plant process design and engineering. Although Apros is primarily used for
dynamic studies of processes, this work concentrates for data input and results of steady
states in design conditions. It can be used to build highly realistic power plant models,
including boiler, turbine plant, automation and electrical system. Apros Combustion uses the
same thermal hydraulic solvers than Apros Nuclear which have been validated and verified
on nuclear industry requirements. (Apros, Combustion)

48
4.1.2 Ansys Fluent Ansys Fluent is modeling software to model flow, heat transfer and reactions for industrial
applications varying from fluid flow studies to combustion in a furnace. The modelling
approach of Ansys Fluent is generally, known as Computational Fluid Dynamics (CDF).
(Ansys Fluent) CFD codes are structured around the numerical algorithms that handle fluid
flow and heat transfer problems. In order to provide easy contact to their solving power, CFD
packages include sophisticated user interfaces to input the system parameters and to examine
the results. The technique is very powerful and spans a wide range of industrial and non-
industrial application areas. Some examples where CFD models are used: power plants,
turbomachinery and chemical process engineering. (Ansys Fluent)
4.1.3 Microsoft Excel Microsoft Excel is universal spreadsheet software to analyze and present data. The Windows
version of Excel supports programming through Visual Basic for Applications (VBA). It is a
programming language that gives the ability to process data efficiently (Figure 25). The most
common use of VBA is to automate repeating tasks, but in capable hands it a powerful tool to
do complex functions. These programmed files are called as macros. Visual Basic for
Applications works by running macros, step-by-step procedures written in Visual Basic.
(Microsoft Excel)
Figure 25. Example of VBA commands

49
4.2 Roles of the softwares Water circulation study consists of many different sections and operations in its workflow.
Even though the simulation is made by a single tool Apros, many additional calculations and
foreknowledge is needed before the simulation can be done. One of the key objectives of this
Master’s thesis was to simplify the workflow and unify these stages.
4.2.1 Apros simulation of the water-steam circuits Recovery boiler’s simulation in this thesis was made using the Apros Combustion version
6.06. Simulation model’s layout is built up with design knowledge when dimensions,
components and most important process values are known. When the module structure is
ready, all the specific information, e.g. temperatures, pressures and pipe dimensions, and
boundary conditions of water-steam circulation are transferred from the supporting tool,
Excel. After this operation, pipe coordinates can be gathered from Apros back to Excel for
heat flux calculations. When heat fluxes have been are created, they are matched with to the
right heat pipes with their coordinates. Then this data is transferred to the simulation model in
Apros.
With this information, simulation is done until water-steam flows in the system have reached
steady situation, known as steady state. Now all the important system data, e.g. flow speeds,
void fractions, mass fractions, can be collected and transferred from Apros to the Excel tool
for studying. With those values can be decided that is some construction modifications
needed.
4.2.2 Solving the heat fluxes by Ansys Fluent Computational fluid dynamics simulations of recovery boilers are done using Ansys Fluent
software. A CFD provides a realistic way to model flow fields and thermodynamics that take
place in a recovery boiler furnace. With these models, it is possible to examine multiple
situations with different capacities, fouling rates and air flows. That is why a suitable way to
estimate the heat fluxes to the heated tubes.
In the first stage, a furnace model was made from one recovery boiler that best matches a
modern recovery boiler furnace design. From this model, all the furnace heat fluxes were
50
collected. In the second stage, a more detailed CFD model, designed especially for the
superheater region, handled the upper furnace part from the bull nose to the end of boiler
generating bank. Heat fluxes to the upper part of the furnace, rear wall screen and boiler
bank were obtained from this model. This modern model can accurately solve the heat
transfer also into the super heaters, which was a great improvement compared to previous
models.
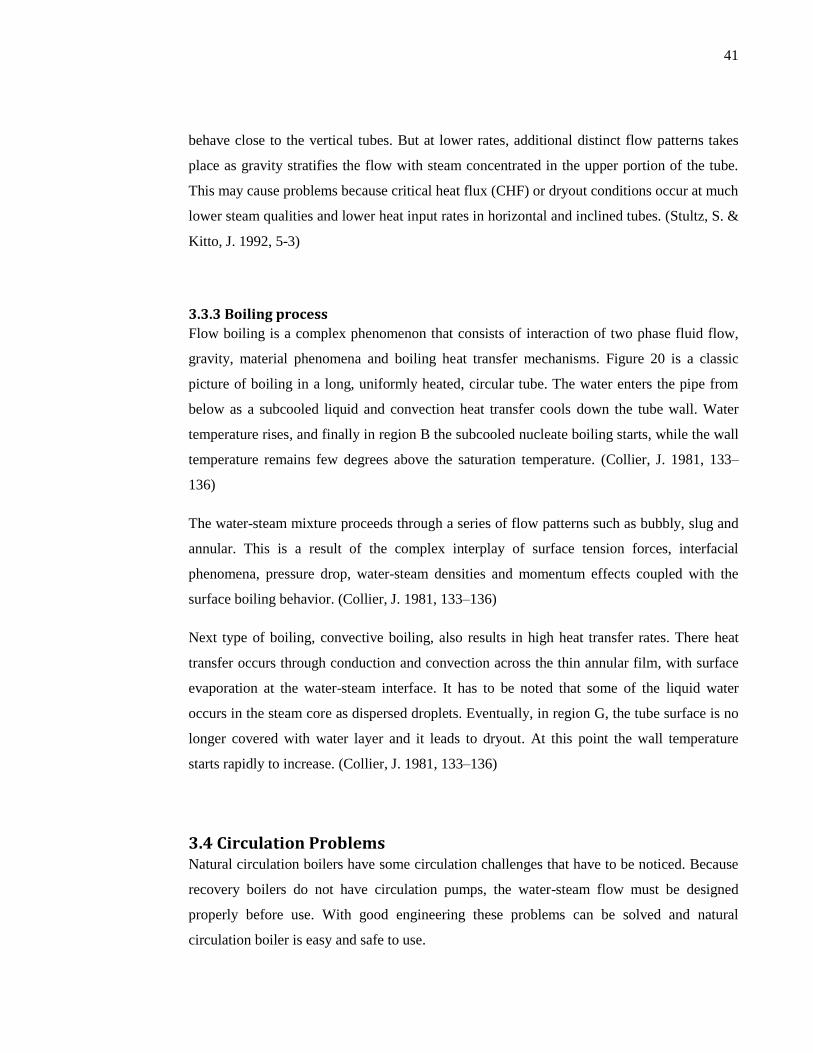
Heat flux values for the horizontal screen were taken from a CFD model that has been
especially made for studying heat transfer in the screen. By combining these models, a highly
realistic and accurate recovery boiler model was obtained. It included all the heat flux values
that were needed in a water circulation simulation. Figure 26 shows heat flux distribution to
the walls in the upper part of a recovery boiler.
Figure 26. CFD simulation results on heat fluxes of upper part of the recovery boiler

51
5. CREATING HEAT FLUX VALUES
Advanced CFD models for heat flux calculations are a one key for better water circulation
modelling. Determining the correct heat fluxes for the boiler heat transfer surfaces is a
complicated operation. However, it is the best way to estimate the heat transfer inside the
boiler and nowadays the accuracy of the CFD models has improved considerably.
5.1 Recovery boiler furnace CFD model The boiler geometry and design values of the base model are from Andritz boiler. The
Computational Fluid Dynamics (CFD) model is based on ANSYS Fluent 14.0 customized
with numerous in-house sub-models. Measured data from several operating recovery boilers
has been used for validating the model. The heat transfer surfaces of the boiler are modeled
as momentum and heat sinks. The heat sink values are based on the boiler heat balance. The
momentum sink values are approximated for the heat transfer surfaces based on their physical
constructions. (Maakala, V. & Miikkulainen, P. 2015, 119–129)
A large part of the combustion modeling is done by in-house codes that are especially
designed for recovery boilers. Black liquor spraying is done by a specific code which forms
several sheets of liquor in both vertical and horizontal directions. Combustion air is delivered
into the boiler by air ports. Those holes and other openings are modeled as patches on the
boiler walls. The openings are adjusted by the code automatically to use the velocity and
mass flow that are given by the user. (Maakala, V. & Miikkulainen, P. 2015, 119–129)
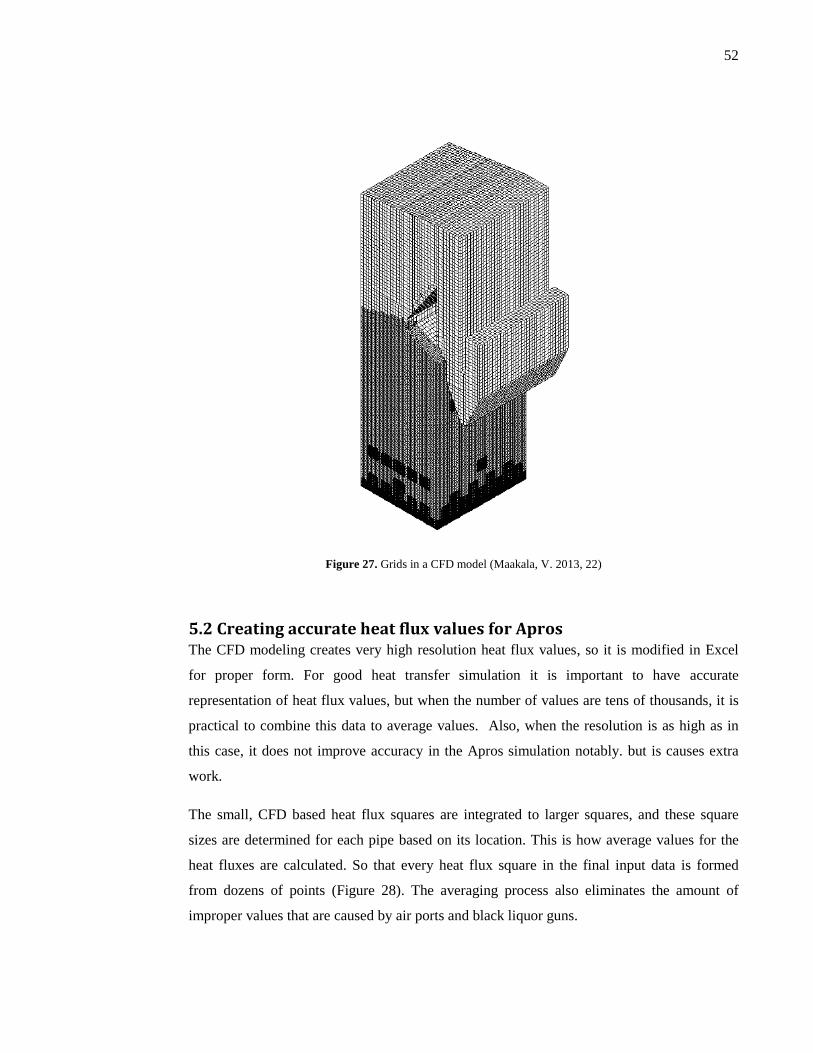
An example computational grid is shown in Figure 27. Typically, from one to three million
hexahedral cells are used. The grids are normally refined on the air levels and close to the air
ports, liquor guns and burners. (Maakala, V. & Miikkulainen, P. 2015, 119–129)
52
Figure 27. Grids in a CFD model (Maakala, V. 2013, 22)
5.2 Creating accurate heat flux values for Apros The CFD modeling creates very high resolution heat flux values, so it is modified in Excel
for proper form. For good heat transfer simulation it is important to have accurate
representation of heat flux values, but when the number of values are tens of thousands, it is
practical to combine this data to average values. Also, when the resolution is as high as in
this case, it does not improve accuracy in the Apros simulation notably. but is causes extra
work.
The small, CFD based heat flux squares are integrated to larger squares, and these square
sizes are determined for each pipe based on its location. This is how average values for the
heat fluxes are calculated. So that every heat flux square in the final input data is formed
from dozens of points (Figure 28). The averaging process also eliminates the amount of
improper values that are caused by air ports and black liquor guns.

53
The shape of each element in the furnace wall grid is a rectangle which height is about 2 % of
the furnace height. Width is between 0,5 % and 10 % of the furnace, depending on its
location. Near the corners the rectangle is narrow, and in the middle part, the grid gets wider.
The heat flux values are more specific in the corner for the reason that circulation problems
are more common in the corner areas. In the central part of the furnace, the heat flux values
are substantially larger and the circulation is steadier. The heat pipes are horizontally
separated in 16 different groups in each wall and numbers of pipes vary depending on the
location in the furnace. In the boiler generating bank, the heat flux values are so modest that 8
groups is enough to ensure accurate values.
The thermal power of recovery boilers and heat transfer surface area are not same in different
boilers, so the heat fluxes need adjusted to right size. This is done with right coefficients for
every part of the boiler. When the thermal power of the examined recovery boiler and the
initial heat fluxes are known, it is possible to calculate proportions between these cases.
Figure 28. Sketch of a heat flux map for rear wall

54
6. APROS SIMULATION MODEL FOR RECOVERY BOILER
A new model is created based on an old water circulation model using the Apros 6.06
program. The model was improved with structural changes and the entire heat flux
distribution was renewed. A powerful new feature compared to the earlier Apros 5 version is
that Apros 6 is capable to read Simantics Constraint Language (SCL) commands. With the
new SCL script files it is easier and more flexible to transmit data to Apros and gather it
back. Steps of simulation are represented in Appendix 1.
6.1 Description of the model Apros model represent the water circulation of recovery boiler. Model includes all the
components that belong to the real water-steam circulation circuit, such as pipes, tanks and
valves. For heat transfer simulation, the heat pipes are the most important components. The
heat pipes are used to receive the heat flux data and they form all the heat transfer surfaces of
the boiler.
Figure 29. Commonly used components in Apros modelling. 1. Pipe, 2. Point, 3. Pipe with heat structure, 4. Tank,
5. Basic valve
55
All these components are graphically connected to each other. Points are very important
components for the automatic processing of the heat flux data, because they contain
coordinate data. The coordinates are given for every point in the model update phase via SCL
commands. Apros propagates this coordinate information for each pipe and pipe section, and
accordingly, this information is available for matching with the heat flux data. This part is
vital for respect of the realistic heat transfer modelling.
6.2 Model improvements Earlier the heat flux calculations and transfer to Apros have been largely time consuming and
handmade operations, but with macros in Excel and SCL commands in Apros, we succeeded
to decrease the workload considerably. This enables more accurate water circulation models
with less time and work.
To improve the accuracy of water circulation simulation, the numbers of heat pipe groups
were increased by 50 %. This permits to use smaller pipe groups, and it is possible to get
more specific data from the circulation. Especially, improvements in corners are a major
achievement of this study. Currently the minimum widths of CFD squares are as small as
three vertical pipes.
Automation of the heat flux data transfer to Apros required some modifications for the model
structure compared to earlier model. To use the heat flux maps it is very important to give
right coordinates to all heat pipes. Earlier the x and y coordinates were not affecting to
calculations, so elevation was the only position information of the pipes, but now all the
coordinates are given to points. Points have to be added in places, where heat pipes direction
change or pipe groups are combined. Also some pipes have to be added because of the new
points. Effect of the new pipes and points to water circulation itself is negligible.
6.3 Transfer of heat flux
The heat flux values are transferred to the calculations level of Apros. The appropriate heat
structures, heat nodes, are searched with SCL via heat points. The heat nodes represent the
outer surface of the pipe wall where heat is transferred (Figure 30). The heat pipes can be

56
separated in parts, without adding more pipes. In other words, the heat pipes can be
discretized in axial direction into a desired number of sections, which improves accuracy for
the pressure distribution and heat transfer. By giving coordinates for the connection points
and choosing the number of heat nodes, every generated heat nodes in the calculating level
have now their own names and center point coordinates. This way the heat flux values are
properly transmitted despite of the discretization used.
SCL commands are used to collect the heat node data which is imported to Excel. Then the
heat nodes can be matched with their coordinates to right squares of the heat transfer
surfaces. Heat flux from the corresponding square is now linked to right heat node. This
operation is repeated to all heat nodes via specific macros. The number of heat nodes for the
whole simulation model is over 8000. From the Excel tool, the heat node names and the heat
flux values are transferred to Apros using a SCL script. Consequently all heat pipes have
been updated with the correct heat flux values.
Figure 30. The heat flux values are transferred to the heat nodes at the heat pipes outer wall

57
7. RESULTS
After the model modifications, heat flux updates and simulations till steady state, the
simulation results were uploaded to the Excel tool. The comparison with the results obtained
by the old practice was possible. The comparison was done using different flow parameters
and energy balances. The models used were the original version and the new version, both
having the same target boiler. Also a transient simulation was conducted to study water
circulation dynamics. In the dynamic simulation, the new recovery boiler model was also
simulated using 115 % capacity.
7.1 General energy balances The new heat flux data is based on CFD model of recovery boiler, which is a combination of
two different boilers. This means that thermal power must be modified to respond the values
of the new boiler. The Changes are made with coefficient when wanted thermal power values
are solved using the ANITA software. After the scaling, the thermal powers between old and
new version steam generation are identical.
The biggest difference with these models happens in the furnace. ANITA gives only one
thermal power value for heat transfer surface below the bull nose. This causes small
uncertainties to the heat flux values. Raising the black liquor capacity up to 115 % thermal
power rises. These changes are represented in Figure 31. It shows how the capacity change
raises the thermal powers especially in the convection heat transfer surfaces, such as screen
and boiler bank. Those surfaces are sensitive to flue gas flows and temperature variety.

58
Figure 31. Thermal power changes
7.2 Sensitivity analysis The modifications done to the simulation model construction, and the more accurate heat
fluxes naturally cause some changes in the simulated water-steam flows. Sensitivity analysis
was made to study these changes. Analysis was based on values of flow velocity, void
fractions and circulation rations.
7.2.1 Structural changes The improvements to the heat flux accuracy caused some structural changes. For example,
smaller pipe groups were used to enable more specific heat flux distribution. For direct
comparison, the Apros models should be as same as possible. However, the added heat pipes,
pipes and points did not cause notable changes to water-steam circuit calculations. Also,
separation at large pipe groups to smaller ones was done so that flow conditions stay the
same. These acts only improve the accuracy of the water circulation study, especially in the
important corner area. The updated structures of new model are represented in appendices 8-
13.

59
7.2.2 Changes in heat flux When the new heat fluxes are based on modern CFD models, the values are much more
detailed than before. The biggest differences compared to earlier values are located in
furnace. The thermal power values that directed to walls are very large and flows in the
furnace are unstable. Above the bull nose the heat fluxes are more modest, so the differences
between models are small.
Figure 32 and Appendix 2 represent heat flux distributions of the front wall for the old and
new model. Shapes of the heat fluxes vary greatly even though conditions in the furnaces are
identical. In the old version the heat flux was divided symmetrical by to two parts and
maximum values stand on 1/3 of height of the furnace. In the new model the heat flux
maximum values are located in the lower and upper part of the furnace. The major reasons
for the changed distribution with the new heat flux values are due to unstable gas flows,
different air systems and slightly different furnace geometry.
Differences in the heat fluxes are caused by many reasons. The earlier values were based on
less accurate CFD model and practical experiences. This approach has been accurate enough
to build workable models for water-steam circuits. The new heat flux values from the modern
CFD models and the small data processing give better tools for water the circulation studies.

60
Figure 32. Calculated relative heat flux distributions of the front wall. Old model on the left side and modern
model on the right side
7.2.3 Flow changes Differences between the results of the old and new simulations are caused by many reasons,
but the biggest factor is the heat flux. Figure 33 shows how flow velocities grow in furnace
wall, except in rear wall. When the heat fluxes are focused on the lower levels in the furnace,
height difference between the steam drum and beginning of boiling level increases. This
phenomenon leads to a bigger driving force (Equation 1) and consequently the flow
improves. It is the main reason for the higher water-steam velocities. Figure 28 represents
heat flux distribution in the rear wall, where heat fluxes are mainly located in the upper part
and cause much weaker flow than before. Even though the flow velocities grow in the front
wall, left wall, right wall and boiler bank by about 20 %, the changes are still acceptable and
do not cause problems.
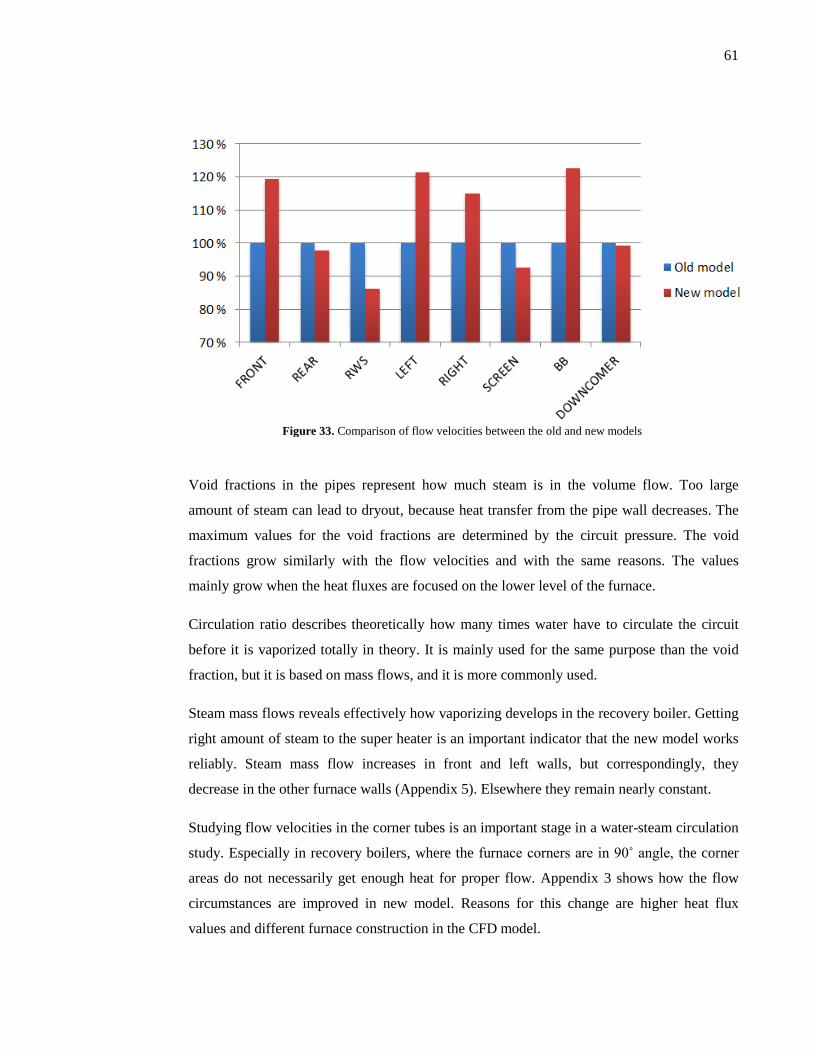
61
Figure 33. Comparison of flow velocities between the old and new models
Void fractions in the pipes represent how much steam is in the volume flow. Too large
amount of steam can lead to dryout, because heat transfer from the pipe wall decreases. The
maximum values for the void fractions are determined by the circuit pressure. The void
fractions grow similarly with the flow velocities and with the same reasons. The values
mainly grow when the heat fluxes are focused on the lower level of the furnace.
Circulation ratio describes theoretically how many times water have to circulate the circuit
before it is vaporized totally in theory. It is mainly used for the same purpose than the void
fraction, but it is based on mass flows, and it is more commonly used.
Steam mass flows reveals effectively how vaporizing develops in the recovery boiler. Getting
right amount of steam to the super heater is an important indicator that the new model works
reliably. Steam mass flow increases in front and left walls, but correspondingly, they
decrease in the other furnace walls (Appendix 5). Elsewhere they remain nearly constant.
Studying flow velocities in the corner tubes is an important stage in a water-steam circulation
study. Especially in recovery boilers, where the furnace corners are in 90˚ angle, the corner
areas do not necessarily get enough heat for proper flow. Appendix 3 shows how the flow
circumstances are improved in new model. Reasons for this change are higher heat flux
values and different furnace construction in the CFD model.

62
7.3 Load change test A case where recovery boiler’s capacity is increased by 15 % was selected to test. New
thermal powers are calculated in ANITA software and heat fluxes are scaled to right size.
This simulation was made to study what kind of changes happens after this shift. System with
the flow velocities, void fractions, circulation ratios and the steam mass flow, it can be
decided, does this boiler need some construction modifications before increasing its capacity.
Figure 34 shows changes in the flow velocities compared to the new 100 % capacity model
that was used for the earlier results. As mentioned previously, the biggest changes happen in
the screen and boiler generating bank. Increased amount of flue gases and increased
temperatures affect especially in these heat transfer parts and rise steam mass flow (Appendix
5). In the wall areas, the changes are much smaller. Same phenomena happen in steam
generating values. In the wall surfaces the mass flow increases slightly over 10 %, but in the
boiler generating bank even 30 %.
Bigger thermal power raises void fractions and decrease circulation ration (Appendix 6–7).
Void fractions grow approximately 2–3 % but the circulation ration diminishes over 10 % per
each wall. Total circulation ration decreases over 20 % and it approaches the lowest
acceptable level.
Figure 34. Flow velocities in 100 % and 115 % capacities

63
7.4 Conclusions and development suggestions The changes observed in the simulation results of the water-steam circulation, which were
mainly caused by the new heat flux values, are as expected. The recovery boilers that were
used in the CFD modelling have some differences in constructions and operation values. This
is one reason why the new heat flux distribution is rather different compared to the old
version. The new heat fluxes are based on heat flux maps that are made with modern CFD
models and the latest knowledge, and thus the values are likely much closer to real values
than never before.
The improvements observed in the water-steam flow were caused by the greater heat flux
values on lower the level of the furnace. This change increased driving force in the circuit,
which grows the flow velocity and mass flow. Especially in upper areas, where thermal
power is commonly quite modest, small changes in the heat flux can cause relatively big
shifts in the flow. In the new model, the heat fluxes are stretched far more smoothly also in
the corner areas. This raises the mass flows notably, for example, in the boiler generating
tubes, where the corner and lower parts get more heat. The differences are not large in
megawatts but measured in relatively it makes a difference.
Inaccuracies in the results are caused by generalizations in property values for Apros and
inaccuracy in average flow results. Configurations parameters of pipes and tanks in Apros do
not always meet the characteristics of actual design and dimensions, and for example, pipe
roughness chances during real operation. Also pressure losses in bull nose and headers is
challenging to model realistically because of the tricky structures. Pipe groups are gathered
together via averages and that causes small errors. Number of pipes in these groups varies but
because of easier way to handle lot of data, flow results are assumed as equals. These errors
are mainly small and do no cause a large overall error, but it is important to be aware of them.
To improve the simulation model to more realistic and accurate, the biggest change could be
made with a more exact CFD model. In this work, the heat flux values where gathered from
two different boilers. The combination works quite well, but the best way to get good heat
flux values would certainly come from a CFD model that is made especially for the targeted
recovery boiler. Each boiler has some special features in construction and air systems that
make it unique. Nowadays CFD models are easier to make and modify, so changes for
example in the air systems, could firstly be tested in the CFD model, and secondly get the

64
heat flux values into the Apros model, and find out the effects in the water-steam circulation.
With the automated heat flux feeding it would be much easier than before. In the upper part
of the boiler, the CFD grid elements were not as accurate as the in furnace area. Smaller
squares would improve the simulation accuracy in those areas.
Reality is always more complex than the computer models. Therefore, the heat flux values
that are received from the CFD models are not absolutely correct. For example deposit layers
do not stay stable during the operation and quality of black liquor can vary. That is why it
would be a great improvement to measure actual heat fluxes of a recovery boiler, and to solve
how the water-steam circulation works in real life. By comparing the measured values to the
CFD results, it would be possible to create even more reliable circulation models in the
future.

65
8. SUMMARY
The aim of this thesis was to develop enhanced methods for heat flux calculations and
transferring the heat flux data to Apros simulation model. Work was based on old Excel
worksheet, APPI, which had been specially created to process data and transfer it to water-
steam circulation and from them. The worksheet had been developed to work with the old
Apros 5 environment. This APPI worksheet, was greatly improved and now it is capable to
take and refine heat flux values that are collected from recovery boiler CFD models.
Simultaneously, it was updated to be well compatible with the new Apros 6 environment.
These changes make the water-circulation studies easier and more accurate.
With the new macros (VBA) it is now possible to handle large amount of data fast, and
accordingly, to get more realistic heat flux values. A major improvement in heat fluxes were
made by using data from CFD models. With the new data it was possible to considerably
improve boiler’s heat flux values. However, the reliability of the water-circulation studies
could still be increased with even more specific CFD models in the future.
In this thesis, the improved APPI was used in an actual water-circulation study. An old Apros
model was updated with the new heat flux data, and the simulation results were compared
with the original version. All data modifications for the Apros model were made using the
SCL command language that is a new feature in Apros 6. It allows fast and easy data transfer
between the APPI tool and Apros. The updated water circulation model was also tested with
115 % fuel capacity and the test results were compared with the 100 % load situation. These
kinds of tests are generally used to study, how the circulation works with greater thermal
power, before any changes are made in real recovery boilers. Test results from the both cases
studied were good and as expected. Also the update to the greater heat fluxes was easy to
fulfill.
The developments made during this thesis help to build water-steam models easier, and more
accurate, and thus, they will help the engineering of the recovery boiler circulation structures.
This enables Andritz to offer its clients better and more reliable recovery boilers than before.

66
REFERENCES
Adams, T. Frederick, W. Grace, T. Hupa, M. Iisa, K. Jones, A. Tran, H. 1997. Kraft
Recovery Boilers. TAPPI press. 381 p. ISBN 0-9625985-9-3.
Andritz internal online material, Recovery boiler emissions, [15.6.2016]
Apros, Apros Combustion, http://www.apros.fi/filebank/193-Apros_Combustion.pdf
[15.6.2016]
Apros, Apros brochure, http://www.apros.fi/filebank/68-Apros_overview.pdf [15.6.2016]
Ansys, Ansys Fluent, Available: http://www.ansys.com/Products/Fluids/ANSYS-Fluent
[15.6.2016]
Collier, J. 1981. Convective boiling and condensation, Second edition, p.435, ISBN 0-07-
011798-5
ERK Eck Rohr Kessel, Available: https://www.eckrohrkessel.com/en/corner-tube-
boiler/water-circulation.html
Grace, T. Recovery boiler equipment and operation, Available:
http://www.tappi.org/content/events/08kros/manuscripts/4-1.pdf [2.3.2016]
Gullichsen, J. & Fogelholm, C. 1999, Chemical Pulping -Papermaking science and
technology. Helsinki: Fapet Oy. 497 p. ISBN 952-5216-06-3.
Henrik, A. 1990, Energiteknik del 2, Studentlitteratur Lund,. ISBN 91-44-31481-7
Huhtinen, M. Kettunen, A. Nurminen, P. Pakkanen, H. 2000. Höyrykattilatekniikka. 5th ed.
Helsinki: Oy Edita Ab. 379 p. ISBN 951-37-3360-2.
Huttunen-Saarivirta, E. & Auerkari, P. FAC risk of downcomers and other boiler
components, 2014, VTT
Incropera F. & DeWitt, D. 1996, Fundamentals of Heat and Mass Transfer. 4th ed. USA, 879
p. ISBN 0-471-30460-3.
KnowPulp, ProwledgeOy, Available: http://www.knowpulp.com/suomi/ [1.6.2016]

67
Maakala, V. 2013, Multi-objective optimization of recovery boiler dimensions using
computational fluid dynamics, Master’s thesis, Aalto University School of engineering
Maakala, V. Miikkulainen, P. 2015, Dimensioning a Recovery Boiler Furnace Using
Mathematical Optimization, TAPPI Journal
Microsoft, Excel, Available: https://msdn.microsoft.com/en-
us/library/office/ee814737%28v=office.14%29.aspx [1.6.2016]
Pentinsaari, V. 2009, Modern recovery boiler design criteria, Master’s thesis, Lappeenranta
University of technology
Reznikov, M. & Lipov, Y. 1985, Steam boilers of thermal power stations, Mir publishers,
341 p
Röppänen, J. Conversation, 7.7.2016
Schneider-Kessel Berlin, Available: http://www.schneider-
kessel.com/products/water_tube_boilers.html [15.6.2016]
Sebastian, T. 2003, Steam boiler technology, 2th edition, Helsinki University of Technology
Department of Mechanical Engineering, 216 p, ISBN 951-22-6759-4
Stultz, S & Kitto, J. 1992, Steam its generation and use, 40th edition, Babcock & Wilcox,
ISBN 0-9634570-0-4
Tran, H. & Vakkilainen, E. The kraft chemical recovery process, Available:
http://www.tappi.org/content/events/08kros/manuscripts/1-1.pdf [1.3.2016]
U.S. Water, Pumps & Systems, Available:
http://www.pumpsandsystems.com/pumps/november-2014-flow-accelerated-corrosion-
damages-plant-systems [2.8.2016]
Vakkilainen, E. 2007. Kraft recovery boilers- Principles and practice. Helsinki University of
technology, Energy engineering and environmental protection. Picaset Oy. Second edition.
246 p. ISBN 952-91-8603-7.

Appendix 1
Steps of creating and using a water-steam circulation model:

Appendix 2
Relative heat flux distributions from front wall:

Appendix 3
Relative flow velocities in the corner tubes. The new model compared to old the model:

Appendix 4
Relative flow velocities in the corner tubes. The new model, 100 % capacity version
compared to 115 % capacity version:

Appendix 5
Relative steam mass flows:
Steam mass flows of the old and the new model
The new model, steam mass flows of 100 % and 115 % capacity

Appendix 6
Relative outlet steam volume fractions:
Outlet steam volume fractions of the old and new the model
The new model, outlet steam volume fractions of 100 % and 115 % capacity

Appendix 7
Relative circulation rations:
Circulation rations of the old and the new model
The new model, circulation rations of 100 % and 115 % capacity
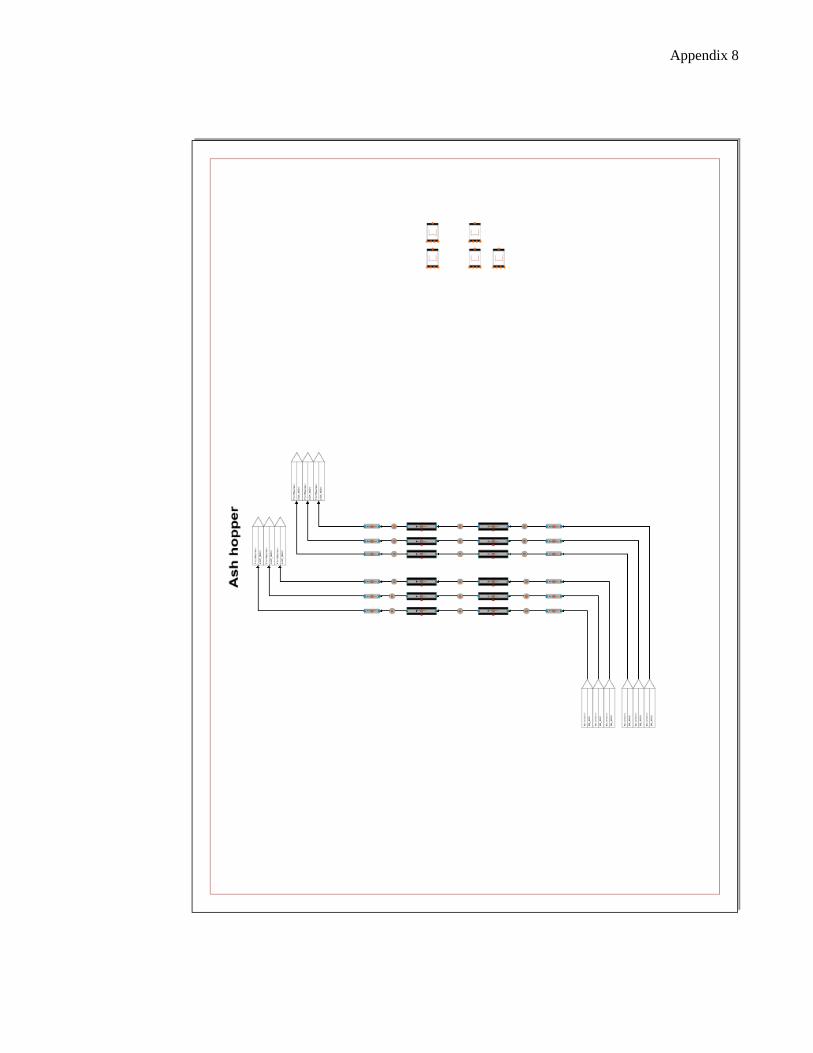
Appendix 8
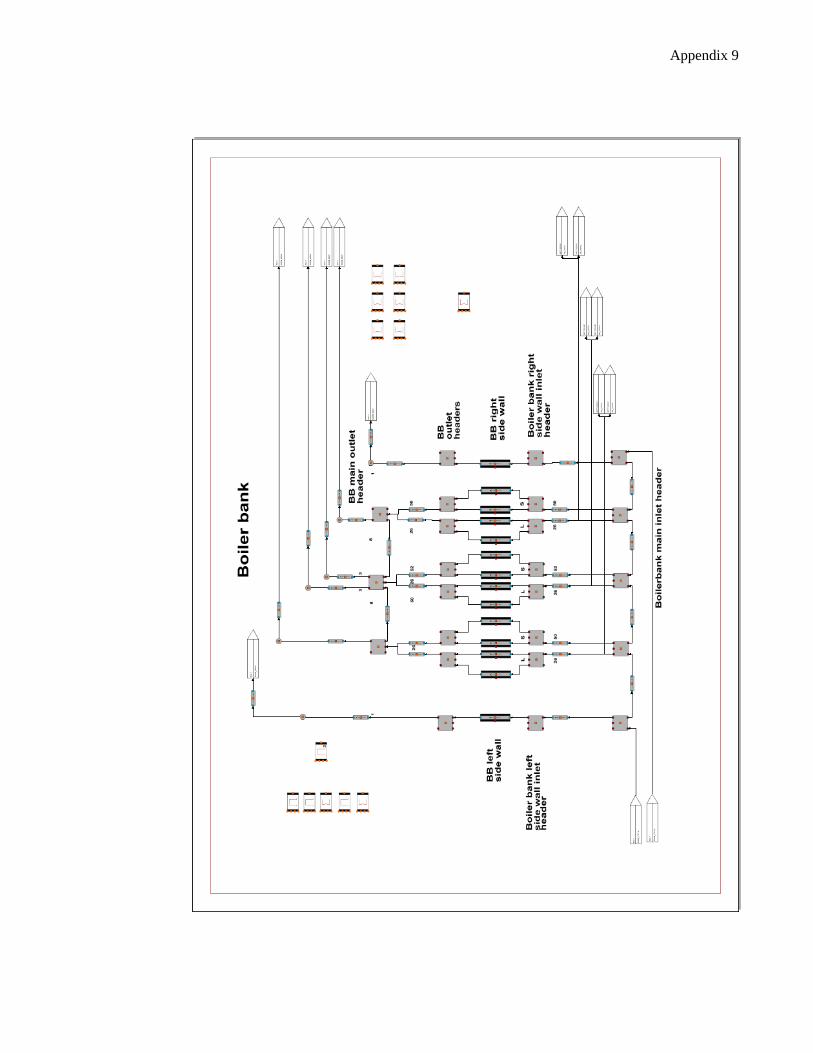
Appendix 9
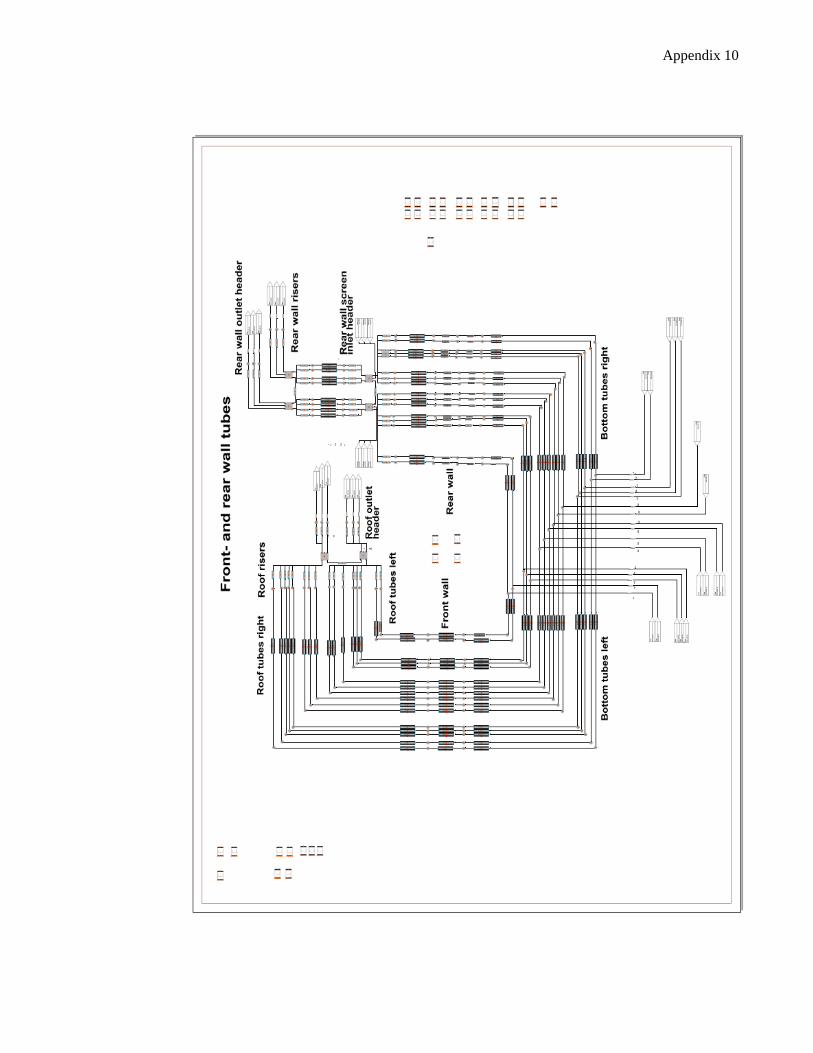
Appendix 10

Appendix 11

Appendix 12

Appendix 13