automation in production of vehicles to improve the
TRANSCRIPT

Automat ion in Product ion o f
Vehic les to Improve the
Sequent ia l Del ivery o f the
Vehic les
A t R o s s l y n P l a n t N i s s a n S A ( N S A )
B y
U l i n d i C l o e t e
2 9 0 4 4 0 9 1
P r o j e c t l e a d e r : M s . G J B o t h a
S u b m i t t e d i n P a r t i a l F u l f i l m e n t o f t h e
R e q u i r e m e n t s f o r t h e D e g r e e o f
B A C H E L O R S O F I N D U S T R I A L E N G I N E E R I N G
i n t h e
F A C U L T Y O F E N G I N E E R I N G , B U I L T
E N V I R O N M N E T A N D I N F O R M A T I O N
T E C H N O L O G Y
U N I V E R S I T Y O F P R E T O R I A
M a y 2 0 1 2

1
EXECUTIVE SUMMARY
The project on sequential building to ensure sequential delivery will be done at the Rosslyn Plant
Nissan SA (NSA).
A production line on building vehicles needs to incorporate or make use of sequential building to
achieve their volume target. Sequential build is achieved by keeping the sequence of units as
close as possible to the original line-up. At present, Nissan is still struggling to minimize the
variation between the original sequence and the sequence that is being delivered in the end, a
relationship referred to as the SSAR (Scheduled Sequence Achievement Ratio). Nissan has to
decide whether to automate a process or processes in order to increase the SSAR.
The following will be done to solve the problem/s identified:
Planning the project accurately will eliminate confusion. The problem is described and
discussed in Chapter 1.
Identifying, studying and implementing industrial methods and techniques such as Just-
in-sequence, automation, simulation, optimisation, AS-IS and TO-BE models that can be
applied to solve the problem or help make a decision. The techniques and methods are
identified and discussed in the Literature Review. The solution approach is determined by
discussing the particular methods that will be used.
Discussing how the data will be gathered and analysed is represented in Chapter 3.
The data gathered will be analysed and used to find possible improvements, as well as the
techniques to implement them in Chapter 4.
Looking into every individual section of the process, may help to identify a gap for
automation.
Generate a model or models to compare results and decide if automation is necessary.

2
TABLE OF CONTENTS
Executive Summary ....................................................................................................................................................... 1
List of Tables .................................................................................................................................................................. 4
List of figures ................................................................................................................................................................. 4
List of Acronyms ............................................................................................................................................................ 5
Chapter 1 - Introduction ................................................................................................................................................ 6
1.1 Introduction and Background ....................................................................................................................... 6
1.2 Problem Statement ...................................................................................................................................... 6
1.3 Project Aim .................................................................................................................................................. 7
1.4 Project Scope ............................................................................................................................................... 8
1.4.1 Project Boundaries ....................................................................................................................................... 8
1.5 Deliverables ................................................................................................................................................. 8
1.6 Project Plan .................................................................................................................................................. 9
1.6.1 Activities and Tasks ....................................................................................................................................... 9
1.6.2 Resources ...................................................................................................................................................... 9
1.6.3 Budget ......................................................................................................................................................... 10
1.7 Research Design ......................................................................................................................................... 10
1.8 Research Methodology .............................................................................................................................. 11
1.9 Chapter Summary ...................................................................................................................................... 11
Chapter 2 – Literature review ...................................................................................................................................... 12
2.1 Overview of the car sequencing problem ................................................................................................... 12
2.1.1 Importance of car sequencing .................................................................................................................... 12
2.1.2 Reasons for vehicles moving out of sequence ............................................................................................ 12
2.1.3 Advantages in sequence delivery ............................................................................................................... 13
2.1.4 Challenges in sequence delivery ................................................................................................................. 13
2.2. Manufacturing Execution Systems ............................................................................................................ 14
2.2.1 Just-in-Sequence ......................................................................................................................................... 14

3
2.3 Labelling ..................................................................................................................................................... 17
2.4 Automation ................................................................................................................................................ 17
2.3.1 Advantages of automation ......................................................................................................................... 19
2.3.2 challenges of automation ........................................................................................................................... 19
2.5 Industrial engineering comparing techniques ............................................................................................. 19
2.5.1 simulation ................................................................................................................................................... 19
2.5.2 optimisation ................................................................................................................................................ 22
2.6 Models ....................................................................................................................................................... 23
2.6.1 As–is and To–be models ............................................................................................................................. 23
2.3 real life Implementations ........................................................................................................................... 23
2.3.1 Toyota ......................................................................................................................................................... 23
2.3.2 General motors ........................................................................................................................................... 24
2.3.3 Maruti suzuki .............................................................................................................................................. 24
2.5 Discussion on Literature review ................................................................................................................. 25
2.5.1 chosen evaluation technique ...................................................................................................................... 26
2.6 Chapter Summary ...................................................................................................................................... 27
Chapter 3 – Data and solution approach ..................................................................................................................... 28
3.1 Data methodologies ................................................................................................................................... 28
3.1.1 Gathering of Data ....................................................................................................................................... 28
3.1.2 Analyzing of Data ........................................................................................................................................ 29
3.2 Chapter Summary ...................................................................................................................................... 30
Chapter 4 – data analysis ............................................................................................................................................. 31
4.1 Main reasons for out of sequence units ..................................................................................................... 31
4.2 Improvements implemented ...................................................................................................................... 31
4.3 SSAR data ................................................................................................................................................... 32
4.3.1 Line one ...................................................................................................................................................... 32
4.3.2 Line 2........................................................................................................................................................... 33

4
4.4 Annual SSAR data ....................................................................................................................................... 34
4.5 Area of automation .................................................................................................................................... 36
4.6 simulation .................................................................................................................................................. 37
4.6.1 As-Is model ................................................................................................................................................. 38
4.6.2 TO-BE model ............................................................................................................................................... 40
4.7 Results ....................................................................................................................................................... 41
4.8 Financial aspects ........................................................................................................................................ 42
Chapter 5 – Conclusion ................................................................................................................................................ 43
5.1 Conclusion .................................................................................................................................................. 43
5.2 Recommendations ..................................................................................................................................... 43
Chapter 6 - References ................................................................................................................................................ 44
Appendices .................................................................................................................................................................. 45
Appendix A: Nissan line map ............................................................................................................................ 45
Appendix B: White body storage map .............................................................................................................. 46
LIST OF TABLES
Table 1: Basic Personal Budget for Project
Table 2: Operation and Implementing Costs
Table 3: Annual Production
LIST OF FIGURES
Figure 1: Changing of SSAR in Production at Nissan
Figure 2: The General Process of Introducing a New Vehicle
Figure 3: Cost vs. Level of Automation Chart
Figure 4: Parts of- and Job Flow in Typical Automotive Assembly Plant
Figure 5: Weekly SSAR of Paint in on Line 1, after improvements made
Figure 6: Weekly SSAR of Trim in on Line 1, after improvements made
Figure 7: Weekly SSAR of Paint in on Line 2, after improvements made
Figure 8: Weekly SSAR of Trim in on Line 2, after improvements made
Figure 9: Annual SSAR on Body-set and in Body Shop.
Figure 10: Annual SSAR when unit leaves the Paint Shop
Figure 11: Annual SSAR when unit enters Trim Line and goes Offline

5
Figure 12: As-is Average SSAR Data and Scan Points
Figure 13: As-is Average SSAR Data
Figure 14: SIMIO Model Results
LIST OF ACRONYMS
AMR Advanced Market Research
CarSP Car Sequencing Problem
CGI Computer Generated Imagery
EDI Electronic Data Interchange
ENP Number of Violations on Non-Priority Options
EP Number of Violations on Priority Options
FIFO First In - First Out
GM General Motors
ILVS In-Line Vehicle Sequencing
JIS Just-in-Sequence
JIT Just-in-Time
MES Manufacturing Execution System
PBS Paint Body Storage
RAF Number of Colour Changes
ROA Return on Assets
SN Supply Network
SPD Sequence Parts Delivery
SSAR Scheduled Sequence Achievement Ratio
TASS Toll Automotive Sequencing System
WIP Work In Progress
WBS Work Body Storage

6
CHAPTER 1 - INTRODUCTION
1.1 INTRODUCTION AND BACKGROUND
The Rosslyn Nissan assembly plant in Pretoria was established during 1963 to 1965. “The Power
is within” is the simple phrase Nissan uses to prepare solutions and create value for their
customers. Nissan has a clear vision for the future and in alliance with their partner, Renault,
they are working with passion to achieve their vision. Their mission is to enrich people’s lives
and win the trust of their customers, partners, employees, shareholders, dealers and on a larger
scale, the world.
A vehicle is produced by a number of processes, the first of which starts at the Body Shop and
ends at the Offline. During production the vehicle will move through a Paint Shop as well. The
production planner works out an original sequence for the units. The planning of the approach on
how to keep these units in their original order at the end of the process by automating an area or
areas, and whether it is worth implementing, will be discussed in the report.
1.2 PROBLEM STATEMENT
At this moment the SSAR (Scheduled Sequence Achievement Ratio) at Nissan SA Automotive
Manufacturer decreases from a 100% to a minimum of 50% at the end. Nissan’s target is to
achieve an SSAR of 98% at the end of production in order to secure continued volume
achievement. The current situation or ratio is not even close to the target ratio, clearly indicating
a problem throughout production that prevents Nissan from achieving their general goal in terms
of sequential building.
Nissan mostly operates manually and are also planning on doubling their production volume in
the next two years. Therefore, Nissan has the current theory that by automating some of the
processes or areas, they will be able to achieve an increase in the SSAR and ultimately be closer
to the SSAR target of 98%.
The question is whether automation is worth implementing and if it will, in fact, make a
difference to the SSAR percentage at the end of production (or at any stage of production, for
that matter). The most feasible and beneficial area or areas for automation should be identified in
order to assist Nissan in deciding whether to implement automation or not.

7
Body Shop Launch 100% SSAR
Each vehicle gets numerically sequence number
Metal finish Some units need more
metal work
Decrease to +/- 90%, when unit gets side tracked
Still acceptable
PBS (Paint Body Shop) Shuffle vehicles to increase SSAR
34 lines (moves in one direction)
Control logic to schedule back in sequence order
SSAR increase up to 50% - 60%
Paint Shop Various factors that have an
impact on the sequence
SSAR drops to +/- 15%
WBS (Work Body Shop) Shuffle vehicles to increase SSAR
14 lines (one direction)
Control logic to schedule back in sequence order
Trim line
SSAR decreases if something unusual happens
Offline Scan point to measure
SSAR
Figure 1: Average Changing of SSAR in Production at Nissan
1.3 PROJECT AIM
The sequential delivery of vehicles is determined through line balancing in the beginning of the
process. The project’s overall aim is to deliver these vehicles at the end of the process as
identical as possible to the original sequential line up, as stated by their target aim, through
automation.
Objectives include:
To determine where automation is possible and if it is worth executing.
To help Nissan make a decision on whether it is necessary to automate or not.
To build a simulation model or relative model to test the impact of automation on the
SSAR outcome of the vehicles.
The goal of the automation is to reduce the difference between the original SSAR and the
final SSAR ratio on the production line.
The implementation of automation should prove to achieve a higher SSAR ratio at the
end of the process.
To achieve an increase in SSAR when vehicles exit the WBS department.

8
1.4 PROJECT SCOPE
A thorough investigation of the departments or areas where automation can be implemented to
increases the SSAR should be done, whether this is when the unit reaches the department, before
the unit reaches the department or after the unit has been to the department in question.
Therefore, a literature review will be generated to identify methods and techniques that can be
applied to compare results after changes have been made to the system. In this case, the change
in question refers to automation on the production line (where it is possible and where it will
make a difference to the SSAR outcome).
1.4.1 PROJECT BOUNDARIES
The project problem boundary is that only the sequence of the units in production will be
inspected and not that of any other parts or activities of the production line, although it
may be inspected in terms of the sequence of the units in the particular department in
question.
Nissan currently has two production lines and it is the specific sequence in which the
vehicles move onto the production line that is the main concern here, instead of the
particular models of the vehicles.
Areas that are being operated manually and influence the SSAR will be inspected to
determine where automation is possible and/or feasible.
The purpose of the project is to help Nissan make an informed decision on automation by
finding a way/technique to indicate the effectiveness of this change in the system.
When comparing the results, all external factors will be excluded. These include machine
breakdowns, cycle times, quantity of customer orders, as well as any irregular or
unforeseen factor that can interrupt the system. Cycle times and the quantity of the
customer orders are excluded due to the fact that only the relationship between SSAR and
automation will be tested. This is done in order to determine whether the outcome of the
order of vehicles is higher than what was stated in the problem statement.
1.5 DELIVERABLES
An illustration of the importance of car sequencing in the motor industry.
A literature review of techniques and methods that can be used to identify a technique to
solve the investigated problem.
Reasons for choosing the specific technique for comparing the impact of automation
when implemented.
Analysis of the data gathered.

9
Area where automation will be tested.
Simulated TO-BE model of the implemented automation.
Evidence that justifies whether or not computerisation should be implemented in the
area/areas in question.
Conclusion of the project.
Recommendations according to the end result of the investigation, as well as any further
work that may be done to increase the SSAR.
1.6 PROJECT PLAN
1.6.1 ACTIVITIES AND TASKS
Visiting the site at Rosslyn Plant Nissan SA (NSA)
Scheduling and attending meetings with mentors at Nissan. They will assist and provide
information and help solve all queries.
Doing research on findings, methods, previous findings etc.
Proper planning of the project is an activity of high importance.
Creating alternatives and solving the problem stated.
To communicate the results of the project in the form of a report and presentation.
1.6.2 RESOURCES
The internet
Nissan website
Employees at Nissan that can provide information
E-mail facilities
Library
Mentor in the Department of Industrial Engineering at the University of Pretoria

10
1.6.3 BUDGET
Budget considerations Average amount (R) /
month
Amount over 10 months
(R)
Petrol to go to Rosslyn for site
visits and meetings
160 1600
Calls that will be made
30 300
Internet access
45 450
Printing
16 160
Total 251 2510
Table 1: Basic Personal Budget for Project
1.7 RESEARCH DESIGN
The aim of this project is to be able to increase the SSAR by automating the car sequencing
processes in the production. The desired result is for the sequence of the cars to remain the same
throughout the production line. The study will be completed in six chapters:
Chapter 1:
Introduction and Background of Nissan and the problem being addressed, as well as a
description of the desired end result.
Chapter 2:
In this chapter the focus moves to the literature review, where various engineering techniques
and models are discussed and existing implementation of techniques are looked at. JIS and
automation strategies are discussed in detail as well. A discussion on the literature review is done
to comment on the current techniques Nissan uses and the chosen techniques. This discussion
describes how the literature review is applicable to Nissan and the project.
Chapter 3:
The solution and data approach states the methodologies that will be followed to gain and
analyse the data that is necessary to improve Nissan’s sequencing problem as well as stating how
it will contribute towards the solution.

11
Chapter 4:
This will involve the module formulation where the actual data is gathered using the
methodology discussed in chapter 3 as well as analysing that data. The results generated by the
comparing model will be available in this chapter as well as a description of this model.
Chapter 5:
This chapter will contain the conclusion and the recommendations. It discusses the possible
changes to be made and the future improvements for Nissan on the car sequencing problem
addressed in this report. The best solution is stated here.
1.8 RESEARCH METHODOLOGY
The research method for this particular project is known as “Action Research”. The data is
gathered and the information is gained through physical data capturing, thus recording and
collecting physical data.
Primarily, visits to Nissan Rosslyn Plant are considered priority. This will give an understanding
of the current situation at Nissan Rosslyn Plant, as well as the day to day operation of the plant.
Physical data is captured and imported in an electronic format in order to be analysed so as to
ensure information gain. Other electronic sources are also pivotal for effective research.
The information from physical studies is gathered in order to analyse the current outcomes of the
sequences and results of the vehicles.
1.9 CHAPTER SUMMARY
In this chapter the problem to be addressed is clearly defined. The methods used to collect
research, and how this research will finally be used in the project, are discussed in short. In the
next chapter a literature review is done to highlight some of the available techniques that can be
used along with a description of it. It also states the importance of car sequencing in the industry.

12
CHAPTER 2 – LITERATURE REVIEW
2.1 OVERVIEW OF THE CAR SEQUENCING PROBLEM
According to Royal 4 Systems (2007), the idea of car sequencing was originally based on the
just-in-time development. It was introduced by the motor manufacturers and their suppliers in the
early 1990's. Car sequencing aims to find the best possible prearrangement of vehicles which has
been ordered along the production line. The main aim of this sequencing is to deliver the
customer’s vehicle in time and in the requested build order. The required sequence of cars varies
for the total required vehicles that need to be produced on the day. The vehicles are also
assembled by various working inlets along the assembly line. The body shop, paint shop, and the
assembly shop are the three workstations whose workload needs to be balanced to guarantee the
desired output.
The frames of the vehicles are manufactured in the body shop and the vehicles are painted by
workers in the paint shop. The diverse options are installed in the assembly shop. These include
extras like sound, air conditioning or the inside lights of a vehicle. The restrictions for the paint
shop are a lot different than the constraints for the body shop and assembly shop. Therefore it is
important to consider these constraints of the different workshops determined by the working
bays in a CarSP (Royal 4 Systems, 2007).
2.1.1 IMPORTANCE OF CAR SEQUENCING
According to AMR research, sequence requirements are increasing. Nowadays, a car’s content is
predicted to be more than 70% sequenced where it previously used to be 40%. The companies
and industries that cannot keep up with these increasing sequence requirements will no longer be
considered as being one of the preferred suppliers. Therefore, it is crucial for suppliers to invest
in sequencing, component traceability, as well as leaning to meet the increasing and awaiting
sequence requirements (Royal 4 Systems, 2007).
2.1.2 REASONS FOR VEHICLES MOVING OUT OF SEQUENCE
Not enough workers are employed, which leads to an increase in costs due to workload
exceeding available man power.
When the production line is operated manually, workers get tired because of the high
work load, leading to human errors or mistakes made by the over worked employees.
The vehicles along the production line are similar to one another but not all of these
require the same components or the same amount of work, leading to an increase in
vehicle production time.

13
Some components or vehicles require extra attention due to individual problems
occurring for a number of vehicles.
Capacity of workstations are being exceeded.
A lack of floor space to store the components is also an area of concern.
(Royal 4 Systems, 2007)
2.1.3 ADVANTAGES IN SEQUENCE DE LIVERY
Sequencing will allow production to be done efficiently.
Decreasing the parts storage space as well as reducing waste.
Customers will receive their orders on time and in the requested sequence.
With Sequence Delivery, a company or supplier becomes more competitive by having the
benefit of gaining new or satisfactory deals and will also be able to implement it
efficiently and fast.
Product agility ensures a quick and accurate adaption when changes are made to the order
process. (RedPrairie, n.d)
Eliminating supply buffers when the quantity within the buffers are reduced to the
absolute minimum.
2.1.4 CHALLENGES IN SEQUENCE DELIVERY
According to (RedPrairie, n.d):
Sequence delivery is highly complex with short lead times.
Various instances of handling of products and components throughout the sequence
delivery process create challenges.
The WIP and operations need to be monitored constantly.
It is a very high competitive environment.
Great product and fulfilment responsibilities.
Managing of interruptions occurring in the production line.

14
2.2. MANUFACTURING E XECUTION SYSTEMS
As established, it is important to meet the sequence requirements of manufacturing. To meet
these requirements a Manufacturing Execution System (MES) needs to be implemented. It
depends on the manufacturer which sequence requirement’s name they prefer. It can be referred
to as Wise Sequencing, In-Line Vehicle Sequencing (ILVS), Sequence Parts Delivery (SPD) and
Just-in-Sequence (JIT). In this report it will be referred to as Just-in-Sequence (JIS).
2.2.1 JUST-IN-SEQUENCE
In order to implement the JIS strategy, also seen as an inventory strategy, a high degree of
capability on the JIT processes should be achieved. JIS is mainly implemented within automobile
manufacturing. Just-in-Time (JIT) is the first step that will be implemented by the organization.
JIT’s aim is to work in partnership with the supplier, sub-contractors and customers to reduce
buffers as much as possible while still maintaining stability if any instabilities should occur. JIT
also synchronizes the manufacturing and material sections and uncovers a lot of major issues.
The JIS strategy only benefits from sequencing if JIT is implemented accurately and the issues
uncovered through JIT are resolved (RedPrairie, n.d).
2.2.1.1 JUST-IN-SEQUENCE PROCEDURE
JIS is an extreme application of the sequencing concept. It is several new requirements on top of
the JIT processes.
The final assembly sequence is shared with the suppliers. Once the actual production
sequence is determined and stable, the final assembly sequence must be “broadcasted” to
all parties involved. This is done to determine the customers’ delivery, according to the
planned output for financial properties.
The components and parts of the vehicles being assembled arrives at the production line
just in time. Each relevant party should take action to make sure the parts are on time
once the sequence has been broadcasted. The time for the arrival of the parts at the
assembling area has been scheduled beforehand.
Transportation is needed to move these components to and from the assembling area. To
coordinate the transportation, the feedback from the production line is used.
When the components arrive at their relevant sections it is sequenced for consumption.
There is little room for mistakes because since, in many cases, the time to complete the
production is two to three hours. The sequence components must match the assembly sequence
perfectly. The implementation of quality inspection and Poka Yoke in the sequencing step will
ensure this. Poka Yoke is the basis for zero quality control (ZQC) approach, which focuses on
15
avoiding and eliminating mistakes. Interrupted sequence problems must be managed by
suppliers. For JIS operations to be successful, the processes managing the periodic sequence
problems should be implemented correctly. Everyone that is involved should be familiar with
and understand the risks (RedPrairie, n.d).
The buffer quantities are moved upward in the flow of material where the components are
supplied. It is an unrealistic assumption that all of the buffers will be eliminated. To eliminate the
buffers through sequencing in the final assembly line, consolidation of all the same parts into
sequence and distribution buffers are pivotal. These parts will partly reside on the lanes of the
transportation to the final assembling area. This strategy has the beneficial result of reducing the
line-side inventory buffers. It is to this strategy’s disadvantage when the transportation pathway
gets blocked and when the sequence is not properly scheduled upwards (RedPrairie, n.d).
For flexible manufacturing lines, the variety is a possibility to manufacture directly according to
the customer orders. As an order arrives at the workstation, the supplier’s orders are distributed
by the scheduler in line with the manufactured sequence of the final production line (RedPrairie,
n.d).
2.2.1.2 ADVANTAGES FOR JUST-IN-SEQUENCE
If implemented successfully,
It will increase the Return on Assets (ROA) of a company
The ROA will improve without any loss in the flexibility
Overall efficiency will improve
An improvement in quality may be seen.
In conclusion, JIS results in a strongly coupled buyer-supplier relationship. It operates with small
reaction times. Characteristics of JIS are minimal buffers and it is highly dependable on time
(RedPrairie, n.d).
2.2.1.3 JUST-IN-SEQUENCE PROCESSES
As soon as the suppliers are informed of the requirements, the manufacturer can manufacture and
deliver the parts in the correct order. There are several processes the manufacturer can practice to
deliver the vehicles in sequence. The process chosen will absolutely depend on the nature of the
product.

16
The JIS processes are as follow:
A. BUILD-IN-SEQUENCE
Items are built according to the required sequence as communicated by the manufacturer to the
suppliers. It decreases the quantity of finished goods in inventory, releasing extra cash and
decreasing the carrying costs. Different variations of building in sequence exist. The nature of
the product as well as how it is packed at the end of the production line needs to be considered.
The method of how the shipping racks are loaded onto the truck needs to be considered as well.
In order to ensure FIFO principles, it is necessary to reverse the build sequence of some of the
parts to accommodate the requirements desired at the end of the production line (Royal 4
Systems, 2007).
A big disruption on the supplier’s production line can cause a major drawback, causing them to
fall behind in manufacturing requirements when building in sequence. For example if a machine
breaks down, the issue needs to be addressed within a specific time otherwise the determined
delivery of the components cannot be delivered to the manufacturer within the correct time
frame. Therefore it is crucial that the supplier plans ahead in case such an occurrence should
arise. It is the supplier’s responsibility to ensure the reliability of the building process (Royal 4
Systems, 2007).
B. BUILD IN BATCH AND PACK
This process is simple to implement and suppliers often use this method. It is also similar to what
Nissan is currently doing, the only difference being the way the products are located on the racks
and transported. More floor space is needed for storage space of the finished goods which is the
biggest concern when implementing this method. The supplier needs to keep good track of the
inventory levels especially for when engineering changes occur (Royal 4 Systems, 2007).
This process can be automated, so can any process, by conveyer lines, pick to light assistance
and Radio Frequency. The afore-mentioned are only some examples (Royal 4 Systems, 2007).
C. THIRD PARTY SEQUENCER
Third parties aim to handle sequencing through receiving the products in a batch from the
supplier, who has minimal resources available or has no intention on implementing sequencing
systems. The third party assembles, pick and pack the products to sequence and then ships them
to the manufacturer (Royal 4 Systems, 2007).

17
D. PICK TO SEQUENCE
The products are picked from an on-site buffer, sequenced and then delivered to manufacturing.
This process has the impact of reducing the buffers in the production area as well improving the
cycle time and WIP (Royal 4 Systems, 2007).
E. SHIP-TO-SEQUENCE THEN RECEIVE-TO-SEQUENCE
Products get sequenced at the supplier, whether it is an internal or external supplier. It is
delivered in sequence and it directly moves to the assembling line. This process has the same
advantages as the Build-in-Sequence process which aims to reduce the amount of finished goods
and carrying costs and freeing up extra cash (Royal 4 Systems, 2007).
2.3 LABELLING
Labelling is an important consideration for sequencing projects. Usually it is required for the
label to be attached to the part or the vehicle getting assembled. These requirements may vary
because manufacturing plants have their own specification and internal initiatives.
The objective of labelling is introduced by Royal 4 Systems. To identify the label specifications,
the supplier needs to work narrowly with the manufacturer. Size and content are examples of
such specifications and there are standard labelling guidelines that manufacturers have to use, but
manufactures are willing to allow minor variations. The positioning of the labels on the parts
needs to be measured to identify alternative labelling procedures if necessary.
2.4 AUTOMATION
It is very important to understand the interrelationships between man and machine before
implementing any sort of automation. For years now, the international automotive industry has
been increasing automation of their production processes to stay ahead of the competition.
Automation can allow a company to become more competitive. Because of this high level of
competition a company has to make a choice of the plant’s location in order to produce certain
models. The allocation of the plant is connected with the level of automation for the reason that it
has an influence on the cost of the product as well as the quality of the product. It is also
dependent on labour availability and the amount of skills accessible in the location of the plant
(Gorlach, I.A. and Wessel, O., 2007).

18
Figure 2: The General Process of Introducing a New Vehicle
The best level of automation has to consider several factors for a specific plant location namely
productivity, cost, flexibility and quality. This best level of automation is not necessarily the
highest level of automation. The higher the level, the more functions are automated in the system
(Gorlach, I.A. and Wessel, O., 2007).
Figure 3: Cost vs. level of Automation Chart
Nowadays it is believed that the automotive industry is the essence of mass production as well as
mass consumption and mass marketing. It becomes more significant because of the constantly
increasing number of competitors and suppliers. The choice of automating a process or processes
in the system is a very important management decision due to the complexity of it (Gorlach, I.A.
and Wessel, O., 2007).

19
2.3.1 ADVANTAGES OF AUTOMATION
Industrial companies become more competitive in the industry.
Better product quality.
Increased productivity (Gorlach, I.A. and Wessel, O., 2007).
2.3.2 CHALLENGES OF AUTOMATION
Some will follow the trend to reduce the level of computerisation for the reasons of
economy.
Less flexibility making it more difficult to modify the products.
The market is an increasingly competitive market.
Plant location plays an important role in the level of automation and needs to be carefully
considered.
Automation is costly, especially if it leads to an exceptionally complex automation
system.
Deployment - can cause strikes (Gorlach, I.A. and Wessel, O., 2007).
2.5 INDUSTRIAL ENGINEERING COMPARING TECHNIQUES
At the end of this report an automotive change will be suggested that may increase the SSAR at
Nissan. These changes can either be worth implementing or not, and need to be evaluated by
comparing it with the current situation.
PC (Computer) simulation, particularly discrete event simulation, is used by industrial engineers.
It is used along with other techniques which include computational approaches for system
analysis, evaluation, optimisation and all-embracing mathematical tools and modelling.
The following techniques may be able to express the effect of the changes on the system of
Nissan’s assembly line or lines and help them to make a decision:
2.5.1 SIMULATION
Many of the note-worthy improvements in this theory of simulation have been driven by
industrial engineering central problems and the systems study methods that were developed to
solve them. These problems include the economic, environmental and social problems that are

20
challenging all of mankind. The utter complexity of these problems will require that system
simulation be implemented in order to solve them. Simulation is one of the most used techniques
in industries and industrial engineers’ overall viewpoint of the system is the key to it (Production
Modelling Corporation and University of Michigan-Dearborn, n.d).
Simulation usually makes use computer program that tries to simulate an intellectual model for a
specific system. It has also become a very valuable part of mathematical programming and is
used in many fields and industries such as service industries, the military, healthcare,
manufacturing and the airline industry. It is characterized by running a model of the system,
where the timeframe used can be in minutes, hours or even days. All aspects of the system are
demonstrated through simulation on a computer illustration. Inputs from the user of the
simulation software program need to be generated, enabling the system model to run successfully
(Production Modelling Corporation and University of Michigan-Dearborn, n.d).
It can be used:
To discover and gain insight on new technologies companies want to implement in their
systems.
To establish the performance of the system simulated, which is generally too complex for
analytical methods to solve.
To answer questions about production feasibility and work-in-progress.
To compare alternative plans, mostly for system scheduling and routing.
To help identify inefficiencies and a way to address them.
To duplicate a specific type of situation so that it can test industrial engineering
programmes through simulations.
To test a range of products by simulating various conditions.
To train someone through a simulated reality rather than by training in the real world
circumstances (Production Modelling Corporation and University of Michigan-Dearborn,
n.d).
Data requirements vary extensively, leading to a variety of specialized simulation languages.
External data requirements also vary widely and the system that receives external data from
external sources should be alert in what they are receiving. It is also necessary and useful to
perform an “error analysis” to ensure that the output values by simulation are accurate and
useful. There are various independent pairs of attributes to which computer models can be
classified. It is as follow: Steady-state or dynamic, Stochastic or deterministic, Local or
distributed, and Continuous or discrete (Algorithms and data structures group, 2006).
Graphs, motion-pictures or moving-images are generated from the data entered and is presented
by Computer Generated Imagery (CGI). Humans are able to observe more efficiently through
looking at data in an animation. The intense visual presentation exceeds the world of formulas
and numbers, but this can lead to output that may lack according to the system simulated. As a
result, it could be seen as drifting too far from numeric data interpretations (Algorithms and data
structures group, 2006).
Simulation has become a relevant and effective tool to support decision making in the industry
along with the integration of other modelling techniques, managers and synthetic intelligence.

21
2.5.1.1 SIMULATION IN AUTOMOBILE INDUSTRY
Ford Motor Company, General Motors Corporation and Chrysler Corporation and most of the
automotive manufactures globally, set the requirement that all the new and improved industrial
system designs must be tested by means of simulation before approval. If approved, the final
equipment purchases can be made (Production Modelling Corporation and University of
Michigan-Dearborn, n.d).
The use of discrete-event simulation is based on the nature of the investigated problem. There are
four main categories to be identified: Layout and equipment design problems, deviation
management related issues, operational problems, and product-mix and sequencing difficulties.
The focus of the project is to increase the sequential outcome of the vehicles and therefore the
product-mix and sequencing difficulties in general are of concern (Production Modelling
Corporation and University of Michigan-Dearborn, n.d).
- The product-mix and sequencing difficulties are related to body shop sequencing as well
as trim line sequencing. It also includes shift scheduling and the trim – and final assembly
line balancing (Production Modelling Corporation and University of Michigan-Dearborn,
n.d).
The following figure shows the typical simulation life cycle for an assembly plant. It usually has
three main sectors: Body Shop, Paint Shop and Trim Shop and then the final assembly, also
called the Offline. All three stages have different processes with unique structures. Each process
or stage has various problems or issues that can effectively be addressed by simulation
(Production Modelling Corporation and University of Michigan-Dearborn, n.d).
Figure 4: Parts of- and Job Flow in a Typical Automotive Assembly Plant

22
2.5.2 OPTIMISATION
Cars need to be sequenced in order to prevent the workstation capacity from being exceeded. The
main concern, however, comes down to what the manufacturer will do when more cars require a
certain option than was originally stipulated by the set capacity constraints. Some constraints
refer to certain features or requirements that need to be met, whereas others, called business
constraints, define the structure of the problem (Cavazzuti, M. and Splendi, L., n.d).
Optimisation in general is a promising technique for a systematic design development, especially
in mechanics. It is, however, not a commonly applied technique within industries.
When an optimisation problem is defined, the definition needs to consist of the following
elements:
- Design space/space for the probable solution.
- Variables
- Objectives
- The constraints
- The method through which the objectives are evaluated with the variables given
- Optimisation algorithm (Cavazzuti, M. and Splendi, L., n.d).
There are several basic optimisation techniques namely:
1. Structural optimisation - An irregular way of applying traditional optimisation processes
to structural issues. This is an approach effective enough to solve large structural issues
easily. There are 5 ways of referring to structural optimisation methods which are:
Topology -, Tonometry -, Topography -, size – and shape optimisation. These structural
optimisation methods vary from one another in terms of the variables chosen (Cavazzuti,
M. and Splendi, L., n.d).
2. Linear programming
3. Integer programming
4. Network models
5. Dynamic programming methods of operations research (Cavazzuti, M. and Splendi, L.,
n.d).
Visual graphics and calculations will show if improvements were successful or not. Thus, a
decision can be made by using optimisation as a technique (Cavazzuti, M. and Splendi, L., n.d)
23
2.6 MODELS
2.6.1 AS–IS AND TO–BE MODELS
When a process needs to be improved or changes should be made, it is necessary to conduct an
AS-IS model to examine several aspects of the current situation. If the necessary changes are
identified, a TO-BE model is constructed to illustrate the changes. A gap analysis is necessary to
determine the transition from the current situation to the new situation. AS-IS and TO-BE are
both regarded as value chains (Modern analyst, 2010).
The purpose of this analysis is to create a visual illustration of the current situation to determine
the areas where improvements or changes are possible and/or necessary.
Various methods or techniques can be used to generate an AS-IS and TO-BE module such as
flowcharting, Business Process Model and Notation (BPMN), the United Modelling Language
(UML), or simulation, as discussed in section 2.5.1 of the literature review. After the AS-IS
model is built using one of these techniques, it needs to be closely examined in order to identify
the necessary areas of improvement. The AS-IS model will support a reliable business case to
validate the implementation of the TO-BE model (Modern analyst, 2010).
The analyses of AS-IS and TO-BE models need to be structured and organised to ensure a
complete study of the models. One method to ensure the comprehensiveness of the study is to
use an iterative version of the fishbone diagram. It is used for root cause analysis to identify the
origin or causes of problems and ultimately identifying the improvement opportunities (Modern
analyst, 2010).
These AS-IS and TO-BE models can then be generated with one or more of the available
techniques to compare the two models or state new adaptive situation (Modern analyst, 2010).
2.3 REAL LIFE IMPLEMENTATIONS
2.3.1 TOYOTA
Toyota Motor North America violated the JIT philosophy by announcing they are going to build
up buffers of important components in the storeroom in the assembly plants. They did this to
protect themselves against possible supply chain disturbances from the non-paying second- and
third-tier suppliers. This is a paradoxical implementation according to the JIT process, where the
goal is to reduce buffers, and sees warehousing inventory as waste. The growing possibility of
not being able to pay the suppliers in Toyota’s supply network (SN), has drastically increased the
risk of them resorting to unorthodox measures because it goes against the moralities of lean

24
manufacturing. The importance of buyer-supplier dependency is illustrated by this incidence.
This dependency is very common in today’s supply networks for automobiles and its occurrence
calls for a complete risk management approach (Wagner and Silveira-Camargos, n.d).
2.3.2 GENERAL MOTORS
General Motors has been the top automobile producer for decades. However, there was a point in
time when GM struggled to secure their dominance. They were under a lot pressure from their
competitor, such as overseas carmakers, as well as from changes in the industry. Roger Smith,
CEO, attempted to cut labour costs. He wanted to compete with the Japanese by automating the
entire factory. A lot of finance was invested in this transformation and a huge hype was made
about Roger Smith wanting to automate the whole factory. Once the hype was over, however, the
market share dropped from 48% to a 36%. This slide in GM’s market share continued to the
present day all because Smith didn’t understand the limitations of automation (Finkelstein, S.,
2003).
It was in the 1980’s when this robotic strategy was first implemented. It was cause for quite a lot
of misinterpretation between competing companies and led to a lot of resources being wasted.
Roger Smith was a very smart man but he did not have enough knowledge of the auto industry
and yet invested billions in it (Finkelstein, S., 2003).
2.3.3 MARUTI SUZUKI
Maruti has two plants and they are planning 99% automation of their Press Shop. They want to
increase their automation to bring their operations on the standard of Japanese plants. The
objective is to achieve constant quality in all their vehicles (Chauhan, C.P. and Bureau, E.T.,
2012).
The biggest difference between GM and Maruti, is that Maruti is steadily increasing automation
at its plants in India, whereas GM approached the matter blindfolded. 50 -100 new robots were
implemented in the older plants which increased the automation level to the current 90%. Maruti
wants to make sure that when the competition strengthens, quality of their product has already
been taken care of. Suzuki has also benefitted from its automation. Popular and quality vehicles
such as the DZire and Swift have been developed with the use of automation (Chauhan, C.P. and
Bureau, E.T., 2012).

25
2.5 DISCUSSION ON LITERATURE REVIEW
It has been established that car sequencing is very important in satisfying the customer’s
requirements. There are various reasons for cars moving out of their sequence, some are more
complex than others.
The reasons mentioned in the literature review, for vehicles moving out of sequence, are
applicable to Nissan. In general, the Nissan Rosslyn Plant is operating manually and also make
use of the Just-in-Sequence strategy. The manual operations can easily deliver mistakes, called
human errors. In the production line and according to the JIS strategy, there is very little room
for mistakes. Operating a vehicle production line is heavy physical work and workers are more
likely to get tired and make mistakes. It leads to vehicles being delivered in the wrong sequence
which is exactly the opposite of what Nissan wants to achieve. After the Body Shop and Paint
Shop, there are several lanes to get the vehicles back into sequence as quickly and effectively
possible. This is a good approach, except that the determination of where the vehicle should go
after leaving the shop, is based on human instinct. Once again, mistakes or judgement errors can
easily be made which may lead to the best selection of vehicles not being made.
There are various JIS processes. Nissan, in particular, uses the Build-in-Sequence process. Using
this process means that when a big interruption occurs, it leads to a major halt of the system.
Since there is a specific timeframe in which such an interruption has to be solve, Nissan may find
that manual operation in such an instance may only prove to be a disadvantage. Companies need
to prepare and cater for disruptive occurrences. An example of such a case may be when
machinery breaks down. In such a case, Nissan should be able to handle it since they are already
operating manually. However, operating manually will still delay the overall processes.
There are also more specific problem factors that come into play when a vehicle moves out of
sequence in the production line. Such factors include the following:
Parts are JIT (Just in Time) supplied. The parts are supplied and delivered in sequence
and organized line-side, a couple of hours before the parts will be used. Parts and
components are organized in the same sequence as the vehicles. If the vehicles are built
out of sequence, the parts will not be line-side. This automatically creates a lot of manual
work that needs to be done in order to ensure that the right parts are supplied for the
vehicles that are out of sequence. The process is delayed as a result, leading to a build-up
of parts which will eventually lead to the client waiting for the vehicle.
The lines in the WBS and PBS section travel in one direction, making it more difficult to
shuffle the vehicles into the correct sequence, because the vehicles cannot be recycled.
The selection of vehicles onto these lines is done manually and thus the best selection is
not necessarily made.
There is a standard cycle time (TACT time) for the different models but variability can
influence this cycle time. Most of the processes are handled manually and therefore
human error plays a big role in the cycle time of a vehicle. When maintenance is needed,
time should be added to the cycle time.
Labelling can influence the ease of operating the production line and keeping the vehicles in
sequence. Nissan labels their vehicles by simply placing a piece of paper with a number on it,

26
indicating the information they need for the production line. Once again, the manual labelling
can easily go wrong or make it difficult to keep track. For example, the paper on the car can fall
off and no one will even notice it. This will develop confusion and influence the sequence of
vehicles negatively.
Nissan wants to automate processes in the system in order to increase the SSAR. If automation is
worth implementing, automation of the labelling process is also highly necessary. The labelling
process should be the first to be considered for automation in order to track the vehicles
automatically.
The degree of automation is constantly being increased in industries. It is a very complex
interrelated process that needs to be properly understood for implementation to be successful.
The challenges, limitations, interrelated relationships and disadvantages of automation should be
understood completely. Thus, before Nissan decides on automation, a study needs to be done on
whether it will increase the SSAR (the desired outcome of automation).
If the entire process of automation is not properly understood, disappointment and financial loss
is almost guaranteed. This, once again, can be proved by the General Motors example in
paragraph 2.3.2. On the other hand, the advantages of automation will be numerous if
implemented correctly. Automating a process or an entire factory, for that matter, requires a
great amount of careful consideration and understanding. It is not an activity to be undertaken
lightly.
Toyota’s solution is to create more buffers to protect them against supply chain disturbances
which are in conflict with the JIS objective of minimizing the buffers. If Nissan keeps operating
manually, the Toyota solution may be an option. Nissan will then at least be prepared, should
interruptions on the production line occur. Nissan will also not benefit from the solution
proposed by Renault (mentioned in the last paragraph of 2.2.3) accept if the computational
studies of the mentioned approaches reach Nissan’s benchmark. Further work on understanding
the approaches needs to be done to generate those studies.
2.5.1 CHOSEN EVALUATION TECHNIQUE
The possibility of an increase in the SSAR due to the elimination of human errors in the
production line, as a result of automation, can only be proven by means of simulation. If there is
an automated system, issues such as tired employees, vehicles that are side tracked and human
error will cause less of a disruption to the production line. The only major interruption will occur
with the breakdown of machinery.
Simulation will visually illustrate the proposed changes and implementations by entering the
necessary variables, data and constraints of those changes into the simulation program. Therefore
the area of automation can be illustrated on the model and the end result, the required SSAR
percentage, will be revealed after simulation of the system is completed. Simulation also delivers
a report at the end of the simulation which enables the user to analyse and compare every aspect
of the simulated model.

27
As seen in 2.5.1 of the literature review, simulation is effective and is a crucial requirement for
decision making in most industries worldwide. It can focus on each department, as well as the
flow between stations and departments.
Optimisation is also a good decision making tool but, when compared to simulation, it is not the
best decision making tool for the purpose of the project. Optimisation is more focussed on
calculations and constraints whereas simulation delivers a visual interpretation and report of the
functioning of the system.
Now that it is clarified that simulation is the best option to evaluate the results, models of the
system need to be generated. There are two models, AS-IS and TO-BE. AS-IS models are used
to determine what improvements need to be made by modelling the current situation. In the case
of this project, Nissan already knows what improvement should be made, namely, automating a
process in order to increase the SSAR. However, the construction of these models should be
specific to the area in which automation is to be implemented. Once this is done, a TO-BE model
can be generated to incorporate the proposed changes and evaluate the results. An informed
decision can then be made by comparing it to the AS-IS model.
2.6 CHAPTER SUMMARY
In this chapter an overview of the car sequence problem, Manufacturing Execution Systems,
Labelling, Automation, comparing techniques, AS-IS and TO-BE models, as well as Real life
implementations are discussed in detail. The challenges of and reasons for out of sequence
manufacturing of vehicles as well as the ultimate effects of the car sequencing problem were
discussed. The MES system is discussed in terms of Just-in-Sequence where the procedure,
advantages and various processes of the JIS strategy is discussed. Real life implementations of
General Motors, Maruti Suzuki and Toyota are highlighted. These techniques were thoroughly
considered from the information gathered in the literature review. A comparing technique was
chosen to generate models to make an informed decision at the end. In the next chapter the data
and solution approach will be discussed.

28
CHAPTER 3 – DATA AND SOLUTION APPROACH
3.1 DATA METHODOLOGIES
3.1.1 GATHERING OF DATA
To be able to indicate that Nissan does, in fact, have an opportunity for improvement on
sequential building and where that gap of opportunity may be, the necessary relevant data had to
be gathered. This data and information was provided by the production planner assisting this
particular project at Nissan Rosslyn.
- After the problem and boundaries were identified in Chapter 1, a literature review was
conducted in Chapter 2, containing relevant information on various kinds of existing
techniques to assist the sequential building problem in the car industry, as well as a
description of Nissan’s current techniques. This information was gathered through use of
the internet. After the data collection, the literature review was discussed and a possible
best technique was chosen, i.e. Simulation.
- In Chapter 4 the actual data provided by the production planner, serves to aid in
discovering the actual reasons for vehicles moving out of sequence at Nissan (as seen in
4.1). Nissan also recently made some improvements to address those specific areas of
concern (seen in 4.2).
- After the WBS and PBS, the vehicles were rearranged again to increase the SSAR.
Therefore, specific data for the Paint in and Trim in will be analysed. This is done with
according to the WBS and PBS respectively. It is a good indication as to the current state
of the SSAR. Only data of these two processes for the past year were closely studied.
This was done in the form of graphs constructed in terms of SSAR. There are 2 lines, the
D22 line and the multi model line (X11 and X90).
- Physical data of the system was gathered from Nissan under the TO-BE model heading to
enter into the TO-BE model.
- A layout and the movement of vehicles on the different lines of each compartment are
given as part of the data (see Appendix A).
- Possible financial figures were provided by Nissan. Due to confidentiality risks, Nissan’s
information in terms of financial data is limited.
With all the gathered data, a proper analysis of the given information can be done. In this way, a
good enough informed decision can be made on automation.
29
3.1.2 ANALYZING OF DATA
Analysing the data gathered from Nissan will lead to the identification of possible problem areas
where automation may be applied. It will ultimately help Nissan to make the decision on whether
to automate the process or not.
- The reason for identifying the specific causes for out of sequence vehicles and the current
improvements are to see if the improvements made a difference or not. If there is no
increase in the SSAR, questions should be asked as to why there was no impact on the
SSAR when improvement was made. By doing this, a gap for automation can be
identified.
- The SSAR data shown in the next chapter give a visual representation of the SSAR
measurements from week 18 to week 28, during which the improvements mentioned
were already implemented. These measures are for lines 1 and 2 by which the vehicles
enter the Paint Shop and the trim line. The SSAR are measured after the shuffling of the
vehicles in the WBS and PBS. This information contributes to finding the solution by
showing whether and where the current improvements made a difference. Knowing
where the problem areas are can help to determine where automation is possible and
worth implementing.
- The annually graphs of SSAR give an overview to the problem indication where line 1
and 2 are on the same graph for each department. Once again the graphs can show where
exactly the problem is and where the focus for solutions should be.
- Current improvements that have already been implemented can show whether it is
working or not. The weekly and monthly SSAR charts in the time period of the
implemented improvements will show a decrease, increase or more or less the same
percentage as before in the SSAR charts. If the line increased and all the other factors
remained the same, the improvement was successful. If not, the implementation of the
improvement influenced the situation negatively and another alternative should be found.
When the chart stays the same the improvement is useless and another alternative should
also be found to solve the problem.
- The simulation data will be entered into a model which will solve the purpose of the
project by determining the answer to the question of automation.
- The layout in appendix A is a layout of the two lines in the production process that shows
the flow of vehicles. It can assist in building the TO-BE model.
- In appendix B the layout of the WBS lanes are given. A decent understanding of those
lanes can help determine a computer system to eliminate human errors on those lanes.
WBS and PBS does not solve the sequencing problem, it only corrects it or manages the
problem temporarily, but by increasing the effectiveness at the WBS and PBS, a higher
SSAR can be achieved.
30
- The financial data will provide a vague understanding to ensure Nissan’s capability to
implement the suggested changes.
3.2 CHAPTER SUMMARY
This chapter discusses the method of gathering the data as well as the method of analysing the
data. All analysed data contributes towards the solution in some way, and contributions of the
data are specified in Chapter 3. The actual gathered data will be available in the next chapter as
well as the actual analysing of that data.

31
CHAPTER 4 – DATA ANALYSIS
4.1 MAIN REASONS FOR OUT OF SEQUENCE UNITS
It was found that the main reasons why the vehicles are out of sequence before improvements
were made at Nissan Rosslyn are:
The vehicles are not scanned in sequence.
There are no parts.
The removal of vehicles out of the building sequence.
There are delayed units from the various shops.
Vehicles are not loaded into sequence into the paint shop and commit line.
There are batch building in X11/X90 Body shops. (See appendix A for X11/X90)
Rear body matching on D22 went out of sync. (See appendix A for position of D22)
The target for WIP on PBS is not maintained due to over-time.
Framework for the Nissan Stamping Plant.
There is no tracking of the units within the Paint shop.
4.2 IMPROVEMENTS IMPLEMENTED
The improvements already made to increase the SSAR are:
No more batch building in X11 Body shop. Only B90’s are batch in X90 Body shop.
Commit and load the vehicles into sequence. Vehicles that are loaded into Paint and
Trim.
Raise awareness in plant with visual graphs.
Predictions for the rest of the financial year are that they will have a 95% and above
SSAR from the Body Shop and Paint in and a constant 40% to 60% SSAR out of the
Paint shop. This will help to increase the Trim-in SSAR to a minimum of 85%.
Improved job observation activities in place at the WBS.

32
4.3 SSAR DATA
4.3.1 LINE ONE
Paint In Paint in is where the vehicle moves into the paint department to undergo the paint process. At
this stage it has already gone through the Body shop and the WBS where the vehicles were
shuffled into sequence again.
Figure 5: Weekly SSAR in Paint in on Line 1, after improvements made.
In this graphs it is clear that the SSAR on Line 1 reached a point where the vehicles weren’t
delivered in sequence. The SSAR on Line 1 picked up again and reached a SSAR beyond the
target at week 28 with a percentage of 92. The major increase in the SSAR started on week 24
where the SSAR increased to 72% from a 47% sequence delivery. From there on the SSAR is
relatively constant up to week 28 where the target is reached.
Trim In
Trim in is when the units exit the PBS where they have once again been shuffled to increase the
SSAR.
The Paint Shop is where the SSAR decreases the most. When the vehicles are released to the
Paint Shop from the WBS, there are various factors that can mix up the order of the sequence,
due to the different areas that the vehicles need to move through eg. the sealer line, Underbody
waxing, Flatting deck as well as Rectification line. Therefore the target of the SSAR will be
lower after the PBS than after the WBS because a lot more shuffling needs to be done.
33
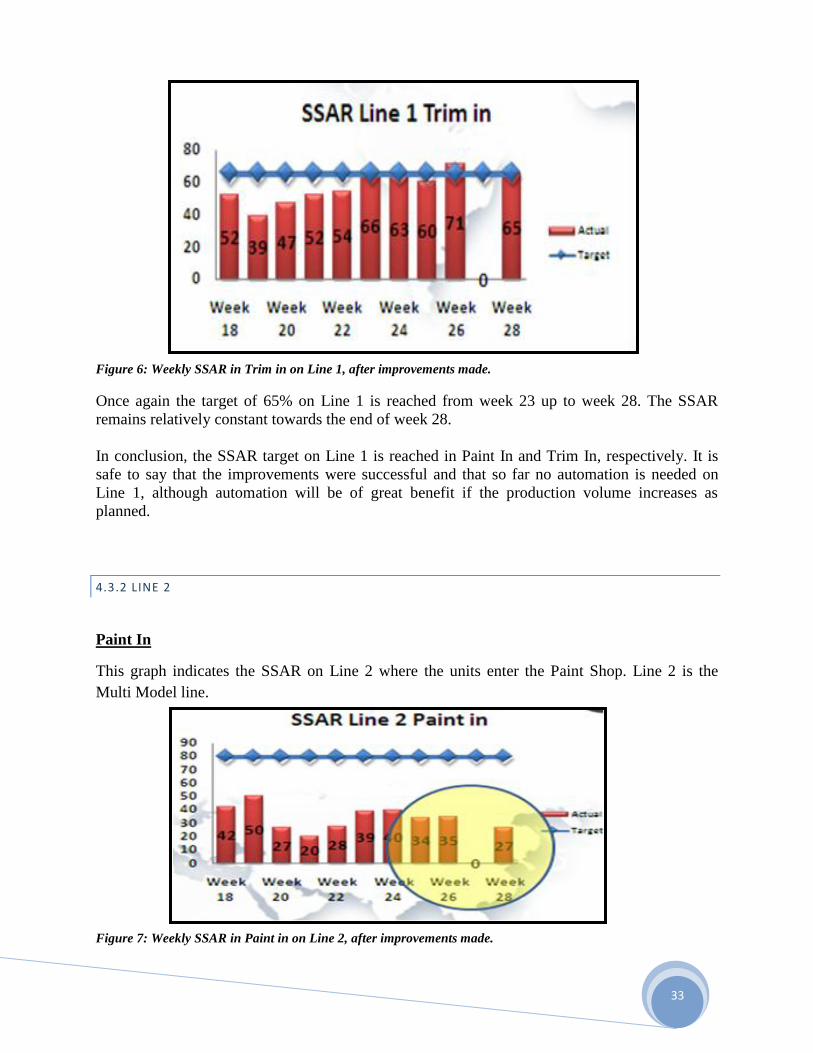
Figure 6: Weekly SSAR in Trim in on Line 1, after improvements made.
Once again the target of 65% on Line 1 is reached from week 23 up to week 28. The SSAR
remains relatively constant towards the end of week 28.
In conclusion, the SSAR target on Line 1 is reached in Paint In and Trim In, respectively. It is
safe to say that the improvements were successful and that so far no automation is needed on
Line 1, although automation will be of great benefit if the production volume increases as
planned.
4.3.2 LINE 2
Paint In
This graph indicates the SSAR on Line 2 where the units enter the Paint Shop. Line 2 is the
Multi Model line.
Figure 7: Weekly SSAR in Paint in on Line 2, after improvements made.

34
In 28 weeks the SSAR never comes close to reaching the target of 80%. Where Line 1 increased
at week 24, Line 2 continued to decrease. The improvements were not successful.
Trim In
Figure 8: Weekly SSAR in Trim in on Line 2, after improvements made.
The SSAR on Line 2 is very low upon entering the trim line. Line 2, multi model line, never
shows any signs of possibly reaching the target. This can be seen in the graph above for the
period week 18 to week 28.
These figures are unacceptable and evidently point out a problem that needs to be solved, either
after the PBS or in the Paint Shop itself.
In conclusion it is very clear that the main focus should be on Line 2 when the units exit the
WBS and enter the Paint shop or when they exit the PBS and enter onto the Trim line. No
vehicles can overtake each other on the Trim line. If automation is to be implemented it will
clearly be necessary for Line 2, the multi model line, in order to increase the SSAR. It seems as
though this is where the problem occur or where the room for improvements are.
4.4 ANNUAL SSAR DATA
The following data from Nissan contains the information on the SSAR throughout the year. The
improvements have been implemented sometime during August. Nothing was done to increase
the outcome of the sequence in the months before that.
It is also clear in the following charts that Line 1 has a continuously good SSAR percentage, but
at some point (indicated in figure 7 and 8) experiences a significant drop. The reason for this
may be that a machine broke down or that major technical difficulties arose. Whatever it may

35
have been, the SSAR numbers for Line 1 increased again after the incident and delivered the
same promising SSAR figures as before.
This once more proves that the problem is not on Line 1 and that automation will not necessarily
be necessary for Line 1.
Figure 9: Annual SSAR on Body-set and in Body Shop.
- Line 1 and Line 2 almost reaches a 100% SSAR in the Body-set which is the first
physical point of a vehicle getting build. Thus, there is no difficulty within the Body-set.
- In the Body Shop the SSAR for Line 1 increases again after the improvements, but Line 2
is still constantly struggling to obtain an appropriate SSAR.
- The drop in SSAR in the Body Shop can be attributed to vehicles not being scanned in
sequence, the unavailability of parts when the original line up is not 100%, vehicles being
removed out of the building sequence, delayed units not moved in time and body
matching that went out of sync.
Figure 10: Annual SSAR when unit leaves the Paint Shop

36
- The Paint shop is the department where things are most likely to go wrong, as well as
where the likelihood of vehicles moving out of sequence is the greatest. This is illustrated
in the above charts.
- Line 1 and Line 2 has more or less the same SSAR number at the end.
- Causes identified for a low SSAR in the paint in and paint out are delayed units and
delayed units not moved in time, The target of WIP on the PBS is not maintained and
there is no tracking in the Paint shop.
Figure 11: Annual SSAR when unit enter Trim line and goes Offline
- Low SSAR on Trim line is caused by not scanning the vehicles in sequence and no parts
being available.
- At the Offline is what the sequence end result (SSAR) will be after the vehicles went
through all the stages of production. A decrease in SSAR at Offline happens if the
inspector at the end of the line does not scan the vehicles in sequence.
- Line 1 has a higher SSAR than Line 2 on the Trim line and at Offline.
- Vehicles move from the PBS onto the Trim line. The charts show that the PBS does in
fact increase the SSAR after the large drop in sequence when exiting the Paint Shop.
- Line 1 may have a higher SSAR but it still doesn’t reach Nissan’s aim of achieving a
SSAR of 98% at the end of the production.
4.5 AREA OF AUTOMATION
The above data reveal the following overall main problem areas:
- On Line 2, the multi model line with models X11 and X90.
- In the Paint Shop.
- At Paint In, after the vehicles were in the WBS where the SSAR should have increased.
As seen in figures 7 – 11, the SSAR on Line 2 never increases by enough to allow a definite
distinction to be made. Even with the current improvements, no change is visible.
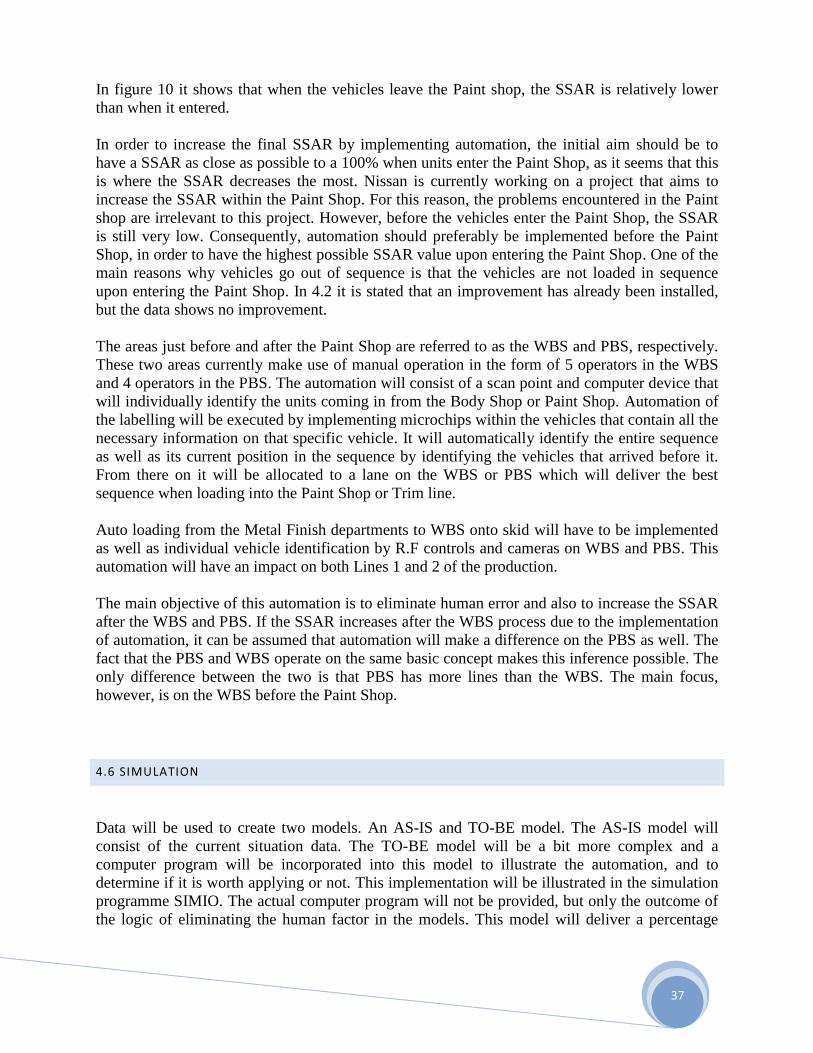
37
In figure 10 it shows that when the vehicles leave the Paint shop, the SSAR is relatively lower
than when it entered.
In order to increase the final SSAR by implementing automation, the initial aim should be to
have a SSAR as close as possible to a 100% when units enter the Paint Shop, as it seems that this
is where the SSAR decreases the most. Nissan is currently working on a project that aims to
increase the SSAR within the Paint Shop. For this reason, the problems encountered in the Paint
shop are irrelevant to this project. However, before the vehicles enter the Paint Shop, the SSAR
is still very low. Consequently, automation should preferably be implemented before the Paint
Shop, in order to have the highest possible SSAR value upon entering the Paint Shop. One of the
main reasons why vehicles go out of sequence is that the vehicles are not loaded in sequence
upon entering the Paint Shop. In 4.2 it is stated that an improvement has already been installed,
but the data shows no improvement.
The areas just before and after the Paint Shop are referred to as the WBS and PBS, respectively.
These two areas currently make use of manual operation in the form of 5 operators in the WBS
and 4 operators in the PBS. The automation will consist of a scan point and computer device that
will individually identify the units coming in from the Body Shop or Paint Shop. Automation of
the labelling will be executed by implementing microchips within the vehicles that contain all the
necessary information on that specific vehicle. It will automatically identify the entire sequence
as well as its current position in the sequence by identifying the vehicles that arrived before it.
From there on it will be allocated to a lane on the WBS or PBS which will deliver the best
sequence when loading into the Paint Shop or Trim line.
Auto loading from the Metal Finish departments to WBS onto skid will have to be implemented
as well as individual vehicle identification by R.F controls and cameras on WBS and PBS. This
automation will have an impact on both Lines 1 and 2 of the production.
The main objective of this automation is to eliminate human error and also to increase the SSAR
after the WBS and PBS. If the SSAR increases after the WBS process due to the implementation
of automation, it can be assumed that automation will make a difference on the PBS as well. The
fact that the PBS and WBS operate on the same basic concept makes this inference possible. The
only difference between the two is that PBS has more lines than the WBS. The main focus,
however, is on the WBS before the Paint Shop.
4.6 SIMULATION
Data will be used to create two models. An AS-IS and TO-BE model. The AS-IS model will
consist of the current situation data. The TO-BE model will be a bit more complex and a
computer program will be incorporated into this model to illustrate the automation, and to
determine if it is worth applying or not. This implementation will be illustrated in the simulation
programme SIMIO. The actual computer program will not be provided, but only the outcome of
the logic of eliminating the human factor in the models. This model will deliver a percentage

38
number which will be the SSAR character. The SSAR will be the key comparison factor as well
as the final deal breaker.
An evaluation of the results needs to be done in order to make a decision on whether to
implement automation or not. This conclusion will be discussed in Chapter 5.
The vehicle enters the production line four months after the order has been placed by the
customer. These four months are simply used for planning the necessary steps for a vehicle to go
offline. It takes about six days to physically complete the vehicle: one day in the Body Shop, two
days in the Paint Shop, one day on the trim line, one day on the tester line and the sixth day to
relocate it to the stock yard. Therefore one week’s data will be used on both the models in order
to compare them in the same timeframe.
4.6.1 AS-IS MODEL
The AS-IS model will use a week’s data in the current situation at Nissan to compare it with the
TO-BE model. The current SSAR data already exist and therefore there is no need to run a
simulation model for the current situation.
Figure 12: AS-IS average SSAR data and scan points

39
Figure 13: AS-IS average SSAR data
The TO-BE simulation model will be a visually illustrated model of automation at the WBS
only. In the first image above it is indicated as the scan point A030. The SSAR is determined at
each scan point. The WBS is the process between the Body OK where the vehicles enter the
WBS and the Paint In where they exit the WBS.
The SSAR drops from 91.3% to 82.57% during the process in the WBS in figure 12. The other 3
weeks’ data of SSAR shows the same results as in figure 12 where the SSAR decreased with
29%, 30% and 29.4%, respectively. The main purpose of the WBS is to shuffle the vehicles back
into sequence or to get the SSAR as high as possible at the end of the WBS process, preferably
higher than what the SSAR was when the vehicles entered into the WBS.
The WBS doesn’t achieve its goal at the moment as proven in figure 12 and 13. The goal of the
TO-BE model is to prove that the automation programme will in fact increase the SSAR from
Body OK to Paint In. Therefore, it should give an idea as to whether it is worth eliminating the
human factor or not. Ideally the SSAR should go up to a 100% before entering the Paint Shop.
If the TO-BE model gives a satisfactory solution, it will be assumed that the same logic will
increase the SSAR at the PBS as well. Thus, the elimination of the human error makes a
difference. The WBS and PBS work on the same concept and the PBS has thus far already
achieved its goal of increasing the SSAR from the Paint OK (figure 12 and 13), but not the target
of 98%.

40
4.6.2 TO-BE MODEL
The TO-BE model is a simulation model generated by the programme SIMIO. It illustrates the
movement of the vehicles where they exit the Body Shop out of sequence and moves onto the
WBS lines up to the point where they enter the Paint Shop. The logical thinking of the worker is
then incorporated into the programme to allow it to decide which line the vehicle must go to in
order to ensure the best possible sequence at the end of the WBS without the possibility of
human error.
There are 14 lines. The function and the movement of each line in the WBS are shown in the
figure in Appendix B. The fast lane is for a vehicle that is far behind and that needs to get ahead
in order to resume its place in the original sequence. The “Marabastad” lines on the other hand
are the lines where vehicles park when they are too far ahead and need to wait for the vehicles
that are supposed to be in front of them.
4.6.2.1 SIMIO MODEL
Two model entities: D22 for line 1 and X11_X90 for line 2 (multi-model line)
Line 1
Arrival rate of vehicles: 15.75 vehicles per hour
Vehicles per day/stopping condition: 126 vehicles per shift (8 hours)
Inter-arrival time: 3.81 minutes exponentially
Vehicles getting side tracked in Body Shop: 15%
Line 2
Arrival rate of vehicles: 14.38 vehicles per hour
Vehicles per day/stopping condition: 115 vehicles per shift (8 hours)
Inter-arrival time: 4.17 minutes exponentially
Vehicles getting side tracked in Body Shop: 60%
Vehicles get side tracked on each of the lines on the model. As the vehicles are finished in the
Body Shop, they arrive at one gathering point on a First in First out (FIFO) basis. From there on
they split into the three models (D22, X11 and X90) where they go to their specified line,
“Marabastad” line or Fast lane depending on their sequence number. The logic behind the
selection is as follows:
- If vehicle X arrives, the program needs to determine whether any other vehicles in its
sequence are already there.
- If there are no vehicles it will go to the first available line that’s allocated to that vehicle
model, provided there are no other vehicles before it.
- If there is a vehicle in front of it, vehicle Y, the system will check whether the arriving
vehicle has a numerical value that is one greater than that of vehicle Y (Vehicle Y
sequence number + 1).

41
a. If it is only one value larger, vehicle X will fall in the line behind vehicle Y
b. If the difference is larger than one, vehicle X will fall into the next available (empty)
line.
c. If no lines are empty, the system will determine which line has the greatest gap in
numbers between that of vehicle X and the vehicle already in the line. Vehicle X will
then be allocated to this line.
d. The numerical gap between the two vehicles on any line are not allowed to be larger
than 5. If this is the case, it means that the vehicle is too far ahead and will then move
to its allocated “Marabastad” line, where it will wait for the other vehicles to arrive.
e. If vehicle X arrives and the number of vehicle Y is greater than that of the arriving
vehicle, vehicle X, the arriving vehicle will go to the fast lane (lane 5) where it can
get ahead and be placed before the vehicle that differs from it by one value by matter
of the Transfer Line (see Appendix B).
- The vehicles then move out of the WBS into the Paint Shop, where two vehicles get
painted at a time. According to this queue, the SSAR will be continuously calculated until
an 8-hour production period is completed. The SSAR is calculated where the number of
vehicles in sequence at the scan point, are divided by the total number of vehicles that go
through the scan point at any one moment.
- The SSAR values are visually shown at both the beginning and end of the WBS on the
simulation model.
4.7 RESULTS
Figure 14: SIMIO model results
The D22 line (line 1) increased from 84,375% to 85, 71%.
The multi-model line (line 2) increased from 69,02% to 72,72%
Average SSAR at the beginning of the WBS is 76,698%
Average SSAR at the end of the WBS is 79,215%

42
There is an average increase in SSAR of 2.517% at the end of the WBS.
The model is based on the principle of the automation computer programme and
therefore the increase in figures from the beginning of the WBS to the end of the WBS
shows a positive outcome.
Before the implementation of the automatic allocating program, the SSAR decreased
with an average of 29.5% from Body OK to Paint In. See on figures 12 and 13.
The 2.517% may be a small increase, but when we consider the average increase of the
32.017% in the case of the WBS being manually operated, it is clear that there was quite
a large increase in SSAR after implementing automation.
In the current situation at Nissan, the SSAR decreases after the WBS. With automation at the
WBS, the SSAR does in fact increase and thus achieves the aim of the WBS.
4.8 FINANCIAL ASPECTS
The purchase, developing, implementing and integrating of this computer programme into the
system will more or less cost:
WBS PBS
Overall implementing cost of automation R 9500 000 R 12 700 000
Number of operators 5 4
Operator salary expenses @ R10 000 per month R50 000 R40 000
Annual operator salary expense R600 000 R480 000
Table 2: Operation and implementing costs
Line 1 Line 2
Annually production of vehicles 27029 vehicles 26029 vehicles
Intended annually production of vehicles in two years 60 000 vehicles 40 000 vehicles
Ratio on increase of production volume 2.22 1.54
Table 3: Annually production
When the automation system is implemented the operator expense will decrease. Nissan will
save up to a maximum of R600 000 on the WBS and R480 000 on the PBS per year. An operator
to control the system will still be necessary at first but when the system is up and going and
implemented successfully the need for an operator will no longer be essential.
The implementation costs of R9 500 000 and R12 700 000 will be paid off over a period of time,
especially since Nissan is planning on increasing their volume production (Table 3). Therefore
more profit will be available.

43
CHAPTER 5 – CONCLUSION
5.1 CONCLUSION
The project scope was to help Nissan make a decision on whether automation is worth
implementing. To implement a computer programme that operates the WBS and PBS
automatically will be beneficial to Nissan SA Rosslyn as shown in the results (4.7):
The SSAR yields a higher percentage at the end of the WBS according to the simulation
model shown in figure 14. In the AS-IS data, the WBS delivers a SSAR lower than the
SSAR entering the WBS. Therefore the SSAR moving into the Paint Shop will be higher
and ultimately will deliver a higher SSAR at the end of production.
According to the project aim, the goal is to see if there is an area where automation can
be implemented which will help increase the SSAR of the production and to prove that
automation will be beneficial. The best area found, with reasons stated in the heading
Area of automation (4.5), is the WBS. The benefit of the automation is proven through a
simulation model of the WBS built on SIMIO.
Automation is very important for a higher volume of production because it eliminates the
human factor and Nissan Rosslyn is planning on doubling their production in the next
two years, shown in table 3. Therefore the SSAR will just keep decreasing at the end of
the WBS over the next two years if automation is not implemented.
Nissan is financially capable of implementing this programme but they wish not to
further elaborate on profits and budget due to confidentiality risks.
5.2 RECOMMENDATIONS
The automation system still doesn’t deliver the ideal goal of 100% at Paint In but it is a lot closer
than it was when operators managed the WBS.
Some suggestions in terms of the automation are:
- To save money now, only implement the automation programme at the WBS at first at a
cost of more or less R9500 000. Currently the manually operated PBS system maintains
its purpose by increasing the SSAR where the WBS doesn’t maintain that purpose.
Therefore the primary focus is on the WBS. Refer to figures 12 and 13.
- Further research on the physical computer programme could help to enhance the
probability of SSAR to deliver a 100% at Paint In.

44
CHAPTER 6 - REFERENCES
Stephan M. Wagner and Victor Silveira-Camargos, 2009, Decision model for the
application of just-in-sequence, in: Decision Sciences Institute Proceedings of the 40th
annual conference, New Orleans, USA.
RedPrairie, n.d, Sequence delivery for logistics service providers [pdf] Available
at:<http://www.redprairie.co.za/uploadedFiles/RedPrairieWorld/Library/Solution_Industr
y_Literature/BTO_SeqDelService_PS.pdf> [Accessed 1 May 2012]
Royal 4 Systems, n.d, Royal 4 Sequencing [online] Available
at:<http://www.royal4.com/wms_Sequencing.cfm> [Accessed 1 May 2012]
Algorithms and data structures group, 2006, Car Sequencing [online] Available at:
<https://www.ads.tuwien.ac.at/w/Research/Car_Sequencing > [Accessed 1 May 2012]
Wagner, S.M. and Silveira-Camargos, V., n.d, Managing Risks in Just-In-Sequence
Supply Networks, Exploratory Evidence from Automakers [online] Available at:
<http://www.scm.ethz.ch/publications/Academic_publications/Wagner_Silveira-
Camargos_InPress_Managing_risks_in_just-in-sequence_supply_networks.pdf >
[Accessed by 2 May 2012]
Gorlach, I.A. and Wessel, O., 2007, Automation Strategies at Volkswagen [pdf]
Available at:
<www.iaeng.org/publication/WCE2007/WCE2007_pp1062-1067.pdf> [Accessed
3September 2012]
Finkelstein, S., 2003, why smart executives fail. [online] Available at:
< mba.tuck.dartmouth.edu/pages/faculty/syd.finkelstein/case.../01.html> [Accessed 3
September 2012]
Modern analyst, 2010, business analysis and system analysis. [online] Available at:
<http://www.modernanalyst.com/Resources/Articles/tabid/115/Default.aspx?ArticleType
=ArticleView&ArticleID=1562> [Accessed 3 September 2012]
Chauhan, C.P. and Bureau, E.T., 2012. Maruti Suzuki to increase automation brings
Manesar operations on par with Japan plants. The economic times Online, [Online] n.d.
Available at:
< http://articles.economictimes.indiatimes.com/2012-09-03/news/33563177_1_manesar-
plant-manesar-operations-automation> [Accessed 3 September 2012]
Production Modelling Corporation and University of Michigan-Dearborn, n.d, Simulation
in the Automobile Industry [pdf] Available at:
<http://www.google.co.za/search?q=Simulation%20in%20the%20Automobile%20Indust
ry&ie=utf-8&oe=utf-8&aq=t&rls=org.mozilla:en-GB:official&client=firefox-
a&source=hp&channel=np> [Accessed 3 September 2012]
Cavazzuti, M. and Splendi, L., n.d, structural optimization of automotive chassis: theory,
set up, design [pdf] Available at:
< http://www.cmap.polytechnique.fr/picof/Symposia/77e1640c.pdf> [Accessed 3
September 2012]

45
APPENDICES
APPENDIX A: NISSAN LINE MAP

46
APPENDIX B: WHITE BODY STORAGE MAP