automatic linear modeling (linear) in spssdev1.education.uconn.edu/m3c/assets/file/automatic linear...
TRANSCRIPT

AUTOMATIC LINEAR MODELING (LINEAR) in SPSS
Hongwei ”Patrick” Yang, PhD
Assistant ProfessorDepartment of Educational Policy Studies & Evaluation
College of EducationUniversity of Kentucky
Lexington, KY 40506-0001E-mail: [email protected]
Presented at the 2014 Modern Modeling Methods (M3) ConferenceNeag School of Education, University of Connecticut
Storrs, CT 06269-3064
May 16, 2014
Hongwei ”Patrick” Yang, PhD (UKY) SPSS LINEAR May 16, 2014 1 / 38

Background
Traditionally, linear regression modeling in SPSS Statistics is carriedout using the REGRESSION procedure which is capable of fittinglinear models and computing a variety of model fit statistics
Limitations of the REGRESSION procedure include
Limited to the stepwise method only with no capability of conductingall-possible-subsets regressionLimited in terms of optimality statistics for variable selection, andexisting criteria are in the form of significance tests prone to Type I/IIerrorsUnable to automatically identify and handle outlying casesUnable to conduct model ensemble to improve predictionsUnable to interact with the SPSS Server program to work with verylarge data
Hongwei ”Patrick” Yang, PhD (UKY) SPSS LINEAR May 16, 2014 2 / 38

Background
Given the limitations of the traditional REGRESSION procedure, thispresentation here introduces the new development in SPSS on linearmodeling: The LINEAR procedure (available since version 19)
The LINEAR procedure accelerates the data analysis process throughseveral automatic mechanismsThe LINEAR procedure improves over the traditional REGRESSIONprocedure in the limitations outlined above. Two of the majorimprovements are discussed here:
Automatic variable selectionAutomatic data preparation
Hongwei ”Patrick” Yang, PhD (UKY) SPSS LINEAR May 16, 2014 3 / 38

Two Major Improvements Automatic Variable Selection
Two Major Improvements: Automatic Variable Selection
In regression modeling, variable selection methods are used very oftenand they are also known as subset selection method, orfeature/attribute selection method as in the field of data mining[2, 25, 30, 31, 49, 53]
We typically want to choose, at least, one small subset from the poolof candidate predictors that gives adequate prediction accuracy for areasonable cost of measurement [39]
Hongwei ”Patrick” Yang, PhD (UKY) SPSS LINEAR May 16, 2014 4 / 38

Two Major Improvements Automatic Variable Selection
Two Major Improvements: Automatic Variable Selection
Among many variable selection methods, the stepwise method andthe all-possible-subsets (a.k.a., best-subsets) method remain to bepopular thanks to their availability in major statistics computerprograms
This is changing because certain regularization methods like the LeastAbsolute Shrinkage Selection Operator or LASSO by Tibshirani [51]are gradually taking over as alternative variable selection methodsThe regularization methods are also available in SPSS Statisticsthrough its categorical regression procedure (CATREG)
Ridge regressionLASSOElastic net that combines ridge regression and LASSO
Hongwei ”Patrick” Yang, PhD (UKY) SPSS LINEAR May 16, 2014 5 / 38

Two Major Improvements Automatic Variable Selection
Two Major Improvements: Automatic Variable Selection
Stepwise method: This approach enters or removes predictors one ata time, after taking into account the marginal contribution of apredictor controlling for other variables already in the model
All-possible-subsets method: Compared with the stepwise approachthat economizes on computational efforts by exploring only a certainpart of the model space, the all-possible-subsets approach conducts acomputationally intensive search of a much larger model space byconsidering all possible regression models from the pool of potentialpredictors
Given that the approach is computationally intensive, it works betterwhen the number of potential predictors is not too large, say 20 orfewer [39, 54]
Hongwei ”Patrick” Yang, PhD (UKY) SPSS LINEAR May 16, 2014 6 / 38
Two Major Improvements Automatic Variable Selection
Two Major Improvements: Automatic Variable Selection
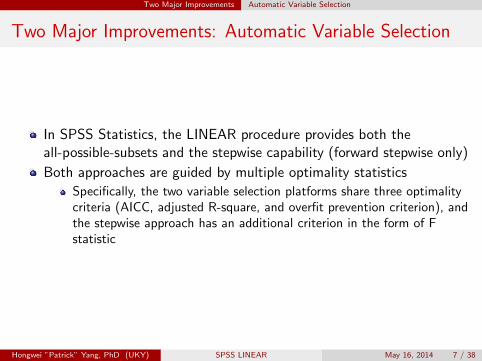
In SPSS Statistics, the LINEAR procedure provides both theall-possible-subsets and the stepwise capability (forward stepwise only)
Both approaches are guided by multiple optimality statistics
Specifically, the two variable selection platforms share three optimalitycriteria (AICC, adjusted R-square, and overfit prevention criterion), andthe stepwise approach has an additional criterion in the form of Fstatistic
Hongwei ”Patrick” Yang, PhD (UKY) SPSS LINEAR May 16, 2014 7 / 38

Two Major Improvements Automatic Data Preparation
Two Major Improvements: Automatic Data Preparation
Before any linear modeling is conducted, the data have to be readyfor use: 1) Missing values replaced, 2) date/month/hour dataconverted to duration data, 3) categorical predictors specified, 4)outliers identified and handled properly, etc.
To that end, the LINEAR procedure provides an automatic datapreparation (ADP) platform to perform many of the above tasks
Here, we examine its ability to identify and handle outliers
Hongwei ”Patrick” Yang, PhD (UKY) SPSS LINEAR May 16, 2014 8 / 38

Two Major Improvements Automatic Data Preparation
Two Major Improvements: Automatic Data Preparation
In the LINEAR procedure, values of continuous predictors that liebeyond a cutoff value (three standard deviations from the mean) aretreated as outliers
Once the ADP option is selected, identified outliers are set to thecutoff value of three standard deviations from the mean [29]
Given that many outliers, individually or collectively, have a stronginfluence on the fitted regression model, a.k.a., influentialobservations, the LINEAR procedure also provides a diagnosticstatistic (Cook’s Distance) that measures the impact of each of theidentified outliers on the fitted model
Hongwei ”Patrick” Yang, PhD (UKY) SPSS LINEAR May 16, 2014 9 / 38

Two Major Improvements Automatic Data Preparation
Two Major Improvements: Automatic Data Preparation
To measure the influence of outlying cases on the fitted model, theLINEAR procedure institutes the measure of Cook’s Distance whichtakes into account the impact of both the predictor (leverage) andthe DV (discrepancy) data on the estimates of model parameters
The LINEAR procedure bases the determination of an influential caseon a rule of thumb from Fox [16]. Once an outlying observationsatisfies this rule, it is automatically displayed in the output as aninfluential case
Hongwei ”Patrick” Yang, PhD (UKY) SPSS LINEAR May 16, 2014 10 / 38

Two Major Improvements Two Numerical Examples
Example One: Automatic Data Preparation
The first example is based on a re-analysis of two benchmark datasets: One used in Belsley et al. [5] and the other from Chatterjee andHadi [9]
Both works provide a dedicated coverage on the issue of influentialcases in linear regression. For the first study, Belsley et al. use theoriginal ”Boston Housing” data. Then, data for the present studywere obtained from the UC Irvine (UCI) Machine Learning Repository[3]
When analyzing each data set, we fit that same model as is presentedin the original study
Hongwei ”Patrick” Yang, PhD (UKY) SPSS LINEAR May 16, 2014 11 / 38

Two Major Improvements Two Numerical Examples
Example One: Automatic Data Preparation
After running the LINEAR analysis with the Belsey et al., data, atotal of 30 outlying cases are identified as influential and they aregraphically presented in the top part of Figure 1: 1) The plot (left) isa plot of Cook’s Distances on record ID as provided by the LINEARprocedure, and 2) the plot (right) is a boxplot of values of Cook’sDistance of those 30 outlying cases
By contrast, with the help of as many as four diagnostic measures,Belsley et al. (1980, p. 238-239) identify 67 cases as abnormalities:1) Outlying only (3 cases), 2) influential only (39 cases), and 3)outlying plus influential (25 cases)
Out of those 30 influential cases detected by the LINEAR procedure,26 of them are endorsed by at least one diagnostic measure in Belsleyet al as influential (short of cases 469, 375, 470, and 480)
Hongwei ”Patrick” Yang, PhD (UKY) SPSS LINEAR May 16, 2014 12 / 38

Two Major Improvements Two Numerical Examples
Example One: Automatic Data Preparation
Although the number of influential cases found by the LINEARprocedure is smaller, it should be noted that the procedure uses just asingle diagnostic criterion to evaluate the impact of each observationthat has already been identified as outlying whereas Belsley at al. useas many as four different measures on all observations in the originaldata regardless of whether any one is already identified as outlying
So, it is not surprising that the latter comes up with more influentialcases because of two things: 1) Each diagnostic measure evaluatesthe data from its own perspective under the context of the fittedmodel: Leverage only, leverage plus discrepancy without row deletion,leverage plus discrepancy with row deletion, etc., and 2) influentialobservations identified by Belsley at al. include those that are notconsidered to be outlying (say, observations 124, 127, 143, 144, 148,and many more)
Hongwei ”Patrick” Yang, PhD (UKY) SPSS LINEAR May 16, 2014 13 / 38

Two Major Improvements Two Numerical Examples
Example One: Automatic Data Preparation
After running the LINEAR analysis with the Chatterjee and Hadidata, a total of four outlying cases are identified as having aninfluential impact on the parameter estimates of the model: Cases 28,23, 30, and 8. This same set of cases is also selected by Chatterjeeand Hadi (1988, p. 134) as influential when they use Cook’sDistance, despite minor differences in rank ordering of the impact
Further, both studies agree that observation 28 is the most influentialcase out of the four. In the bottom part of Figure 1, these fourinfluential cases are presented graphically in two plots in a mannersimilar to those for the first data set
Hongwei ”Patrick” Yang, PhD (UKY) SPSS LINEAR May 16, 2014 14 / 38

Two Major Improvements Two Numerical Examples
Example One: Automatic Data Preparation
Figure 1: Automatic data preparation: Cook’s Distance values from two analyses.
490 372 491 375 408 161
0.01
0.03
0.05
0.07
Boston Housing
Record ID
Coo
k's
Dis
tanc
e
0.01
0.03
0.05
0.07
Boston Housing
Cook's Distance
Ran
ge o
f Val
ues
28 23 30 8
0.20
0.30
0.40
Health Club
Record ID
Coo
k's
Dis
tanc
e
0.20
0.30
0.40
Health Club
Cook's Distance
Ran
ge o
f Val
ues
Hongwei ”Patrick” Yang, PhD (UKY) SPSS LINEAR May 16, 2014 15 / 38

Two Major Improvements Two Numerical Examples
Example One: Automatic Data Preparation
Given that, with just a single criterion (Cook’s Distance), the LINEARprocedure is able to identify about 40% of the influential cases foundby Belsley et al. [5] using as many as four criteria, and detect 100%of the influential cases found by Chatterjee and Hadi [9] using thesame criterion, we may say that certain supportive evidence has beenfound on the effectiveness of the procedure in finding abnormalities inthe data
This feature is very useful in initial data preparation, particularly whenthe dimension of the data is so large that manually identifyingabnormal cases is too time-consuming to be accomplished in areasonable amount of time
Hongwei ”Patrick” Yang, PhD (UKY) SPSS LINEAR May 16, 2014 16 / 38

Two Major Improvements Two Numerical Examples
Example Two: Automatic Data Preparation
For the second example, we select a total of 10 benchmarkapplications for assessing the subset selection capability of theLINEAR procedure
The 10 data sets are retrieved separately from three sources: 1) theUCI Machine Learning Repository by Bache and Lichman [3], 2) theR package mlbench by Leisch and Dimitriadou [34], and 3) the Rpackage ElemStatLearn by Halvorsen [21]
A brief summary of the 10 benchmark applications is found in Table 1
Hongwei ”Patrick” Yang, PhD (UKY) SPSS LINEAR May 16, 2014 17 / 38

Two Major Improvements Two Numerical Examples
Example Two: Automatic Data Preparation
Table 1: Data Sets and Correlations Between Observed and Predicted
Dataset Samplesize
Number ofpredictors
Correlation:Stepwise
Correlation:All possi-ble subsets
Finalmodelidentical
Source
Bodyfat 252 14 .988 .988 N UCIBone 485 02 .510 .510 Y ElemStatLearnBostonHousing 506 13 .868 .868 Y mlbenchCPUPerformance 209 06 .847 .847 Y UCIGalaxy 323 04 .948 .948 Y ElemStatLearnOzone 366 09 .811 .811 Y mlbenchProstate 097 08 .816 .816 Y ElemStatLearnServo 167 04 .847 .847 Y mlbenchRedWine 1,599 11 .608 .608 Y UCIWhiteWine 4,898 11 .537 .537 Y UCI
Hongwei ”Patrick” Yang, PhD (UKY) SPSS LINEAR May 16, 2014 18 / 38

Two Major Improvements Two Numerical Examples
Example Two: Automatic Data Preparation
Given multiple predictors from each application, we subject themseparately to the forward stepwise and the all-possible-subsets(best-subsets) method: AICC statistic as the entry/removal criterion
When the optimal model from each variable selection method isfinally identified and estimated, we evaluate the degree of model fitusing the correlation coefficient between the observed and predictedvalues of the DV, an approach adopted by similar studies on subsetselection/feature selection, such as Karagiannopoulos, et al. [31]
A summary of the model search/evaluation process is also found inTable 1
Hongwei ”Patrick” Yang, PhD (UKY) SPSS LINEAR May 16, 2014 19 / 38

Two Major Improvements Two Numerical Examples
Example Two: Automatic Data Preparation
Under each variable selection method, the correlations between theobserved and predicted values of the DV are generally high (above.80) with only two exceptions (about .51 and .54), which suggeststhat the patterns of the two sets of values are relatively consistentwith each other in almost all 10 benchmark applications. Thisprovides support for the finally fitted model from each variableselection method provided in the LINEAR procedure
The all-possible-subsets method provides us with a set of (up to) 10best models that we can treat as more promising subsets and examinemore closely by factoring in additional considerations beyond solelystatistical ones, a recommended approach in the literature [32, 39, 50]
Hongwei ”Patrick” Yang, PhD (UKY) SPSS LINEAR May 16, 2014 20 / 38

Two Major Improvements Discussions
Discussions
Through the two examples, we may say that the LINEAR procedureprovides an effective, new solution to linear regression modeling inSPSS. Compared with the traditional REGRESSION procedure, theLINEAR procedure functions well as its substitute: It provides almosteverything found in the traditional procedure, but it also offersadditional, typically more advanced features not available in thetraditional procedure
Here, we would like to discuss several additional issues regarding theprocedure with the hope to address some philosophical concerns,suggest several possible improvements, and advance new research
Hongwei ”Patrick” Yang, PhD (UKY) SPSS LINEAR May 16, 2014 21 / 38

Two Major Improvements Discussions
Discussions: Automation versus Human Input
There are mixed feelings about the LINEAR procedure whichautomates many aspects of linear regression modeling, a fundamentalpredictive data mining (DM) tool that serves as the building block ofmore complex DM algorithms: Some people hate the procedure, likeField [15], whereas others disagree and argue the procedure is a greatidea [36]
People who hate it:http://www.youtube.com/watch?v=pltr74IlxOg
People who like it:http://www.youtube.com/watch?v=JIs4sMxAFg0
Hongwei ”Patrick” Yang, PhD (UKY) SPSS LINEAR May 16, 2014 22 / 38

Two Major Improvements Discussions
Discussions: Automation versus Human Input
We argue that at least the point of being automatic is well justified inthe literature (say, in data mining), particularly when the data arehuge:
Big data are an outgrowth of today’s digital environment whichgenerates data flowing continuously at unprecedented speed andvolumeThis explosive growth in data has generated an urgent need forautomated tools that can intelligently assist us in transforming the vastamounts of data into useful information
Automatically analyze the data, automatically classify it, automaticallysummarize it, automatically discover and characterize trends in it,automatically flag anomalies, among other things [22, 42, 53]
Hongwei ”Patrick” Yang, PhD (UKY) SPSS LINEAR May 16, 2014 23 / 38

Two Major Improvements Discussions
Discussions: Automation versus Human Input
Given huge data, knowledge discovery has to be a cooperative effortof humans and computers through automatic as well as manualmethods. Best results are achieved by balancing the knowledge ofhuman experts in describing problems and goals with the searchcapabilities of computers [30, 55]
The LINEAR procedure represents an important move in the directionof automating the data analysis process, and this move is furtherenhanced by the procedure’s ability to communicate with the SPSSServer program designed to improve the efficiency and productivity ofanalyzing very large data sets
Hongwei ”Patrick” Yang, PhD (UKY) SPSS LINEAR May 16, 2014 24 / 38

Two Major Improvements Discussions
Discussions: Automation versus Human Input
On the other hand, despite the need for automation in data mining,we also argue that automation is no substitute for human input [1, 33]
Under the LINEAR procedure, human participation is also needed:
Before the analysis, the researcher needs to review the literatureextensively to decide how to phrase the question(s) correctly and whatvariables should be measured to collect data that could be used toanswer the question(s)During the analysis, human input is needed to examine the context ofany problematic cases identified by the LINEAR procedure to figure outwhy a particular case is abnormalAfter the analysis, given multiply selected models from subset selection,the researcher needs to factor in theoretical considerations beforemaking the decision on the choice of the very final model
Hongwei ”Patrick” Yang, PhD (UKY) SPSS LINEAR May 16, 2014 25 / 38

Grounds for Improvements
Grounds for Improvements
There is currently only a single diagnostic statistic built in foridentifying and flagging influential cases, which is insufficient becauseresearchers tend to use multiple criteria for that purpose [5]
Consider at least one measure from each of the groups of diagnosticstatistics as recommended by Chatterjee and Hadi [9]
The procedure currently does not make available many of the detailsof the linear modeling process. Because the researcher may have theneed to explore the data/model(s) further beyond what the programprovides, it would be helpful for the procedure to make accessiblemany of the currently hidden statistics
We would have assessed the model ensemble features of the procedureto see if they are truly able to improve predictions, had certainstatistics (analysis weights, model weight, and residuals at each basemodel, etc.) been available
Hongwei ”Patrick” Yang, PhD (UKY) SPSS LINEAR May 16, 2014 26 / 38

Grounds for Improvements
Grounds for Improvements
Two other features that we believe should be added to the LINEARprocedure are data partitioning/splitting and forced entry of variables(terms). These two procedures are readily available in otherstatistics/data mining programs
The partitioning of data capability splits the data into two or three setsfor model training, model validation, and sometimes, model testingThe forced entry capability is useful for a hierarchical approach toregression modeling
Hongwei ”Patrick” Yang, PhD (UKY) SPSS LINEAR May 16, 2014 27 / 38

Future Research: Model Ensemble
Grounds for Improvements
The procedure primarily offers two ensemble methods: 1) Bootstrapaggregating or bagging by Breiman [6], and 2) adaptive boosting orAdaBoost by Drucker [13], and Freund and Schapire [18, 19]
The ensemble techniques are designed to create a modelensemble/committee containing multiple component/base modelswhich are averaged in a certain manner to improve thestability/accuracy of predictions; and the techniques can beincorporated into a common variable selection method (geneticalgorithm, stepwise method, all-possible-subsets method, etc.)
Hongwei ”Patrick” Yang, PhD (UKY) SPSS LINEAR May 16, 2014 28 / 38

Future Research: Model Ensemble
Grounds for Improvements
The ensemble capability of the LINEAR procedure can be used incombination with each of its two subset selection methods to improvethe performance of individual component/base models
This combination of subset selection and machine learning algorithmshas recently become popular. For example, Liu, Cui, Jiang, and Ma[35] apply the ensemble neural networks with combinational featureselection to the microarray experiments for tumor classification andthey have obtained remarkably improved results [2]
Hongwei ”Patrick” Yang, PhD (UKY) SPSS LINEAR May 16, 2014 29 / 38

Future Research: Model Ensemble
Grounds for Improvements
The comparison of ensemble methods in terms of improving theaccuracy/stability of individual models (with/without simultaneoussubset selection) is an active area of research [4, 6, 12, 13, 19, 35, 46]
Therefore, it would also be interesting to assess the performance ofthe ensemble capability of the LINEAR procedure with/without alsoconducting subset selection of variables in terms of improving thepredictions
Hongwei ”Patrick” Yang, PhD (UKY) SPSS LINEAR May 16, 2014 30 / 38
Conclusions
Conclusions
The study demonstrates the effectiveness of two features of theLINEAR procedure in SPSS Statistics using benchmark applications
Through the demonstration, the study argues for the use of theLINEAR program as a substitute for the traditional REGRESSIONprocedure
In the end, the study also discusses philosophical issues related to thenew procedure, aspects of this procedure where improvements can bemade, and its ensemble capability as a topic for future research
Hongwei ”Patrick” Yang, PhD (UKY) SPSS LINEAR May 16, 2014 31 / 38

References
References I
Ankerst, M. (2003). The perfect data mining tool: Interactive or automation - Report on the SIGKDD-2002 Panel.
SIGKDD Explorations, 5(1), 110-111.
Ao, S. (2008). Data mining and applications in Genomics. Berlin, Heidelberg, Germany: Springer Science+Business
Media.
Bache, K. & Lichman, M. (2013). UCI Machine Learning Repository [http://archive.ics.uci.edu/ml]. Irvine, CA:
University of California, School of Information and Computer Science.
Barutcuoglu, Z., & Alpaydin, E. (2003). A comparison of model aggregation methods for regression. In O. Kaynak, E.
Alpaydin, E. Oja, & L. Xu. (Eds.), Artificial Neural Networks and Neural Information Processing - ICANN/ICONIP 2003(pp. 76-83). NYC, NY: Springer.
Belsley, D. A., Kuh, E., & Welsch, R. E. (1980). Regression diagnostics: Identifying influential data and sources of
collinearity. New York: John Wiley & Sons, Inc.
Breiman, L. (1996). Bagging predictors. Machine Learning, 24, 123-140.
Buhlmann, P., & Hothorn, T. (2007). Boosting algorithms: Regularization, prediction and model fitting (with
discussion). Statistical Science, 22, 477-505.
Cerrito, P. B. (2006). Introduction to data mining: Using SAS Enterprise Miner. Cary, NC: SAS Institute Inc.
Chatterjee, S., & Hadi, A. S. (1988). Sensitivity analysis: Linear regression. New York: John Wiley & Sons, Inc.
Cios, K., Pedrycz, W., Swiniarski, R. W. & Kurgan, L. A. (2007). Data mining: A knowledge discovery approach. NYC,
NY: Springer.
Hongwei ”Patrick” Yang, PhD (UKY) SPSS LINEAR May 16, 2014 32 / 38

References
References II
Cook, R. D. (1977). Detection of influential observation in linear regression. Technometrics, 19(1), 15-18.
Cortez, P., Cerdeira, A., Almeida, F., Matos, T., & Reis, J. (2009). Modeling wine preferences by data mining from
physicochemical properties. Decision Support Systems, 47, 547-553.
Drucker, H. (1997). Improving regressor using boosting techniques. Proceedings of the 14th International Conferences on
Machine Learning, 107-115.
Efroymson, M. A. (1960). Multiple regression analysis. In A. Ralston & H. S. Wilf (Eds.), Mathematical methods for
digital computers (pp. 191-203). NYC, NY: Wiley.
Field, A. (2013, March 12). SPSS Automatic Linear Modeling. Retrieved May 12, 2013, from
http://www.youtube.com/watch?v=pltr74IlxOg
Fox, J. (1997). Applied regression analysis, linear models, and related methods. Thousand Oaks, CA: Sage Publications,
Inc.
Freund, Y. (1995). Boosting a weak learning algorithm by majority. Information and Computation, 121, 256-285.
Freund, Y., & Schapire, R. E. (1996). Experiments with a new boosting algorithm. Machine Learning: Proceedings of the
Thirteenth International Conference, 148-156.
Freund, Y., & Schapire, R. E. (1997). A decision-theoretic generalization of online learning and an application to
boosting. Journal of Computer and System Sciences, 55, 119-139.
Furnival, G. M., & Wilson, R. W. (1974). Regression by leaps and bounds. Technometrics, 16(4), 499-511.
Hongwei ”Patrick” Yang, PhD (UKY) SPSS LINEAR May 16, 2014 33 / 38

References
References III
Halvorsen, K. (2013). ElemStatLearn: Data sets, functions and examples from the book: “The Elements of Statistical
Learning, Data Mining, Inference, and Prediction” by Trevor Hastie, Robert Tibshirani and Jerome Friedman [Computersoftware manual]. Retrieved from http://cran.r-project.org/web/packages/ElemStatLearn/index.html (Rpackage version 2012.04-0)
Han, J., & Kamber, M. (2006). Data mining: Concepts and techniques (2nd ed.). San Francisco, CA: Morgan Kaufmann
Publisher.
Harrison, D., & Rubinfeld, D. L. (1978). Hedonic prices and the demand for clean air. Journal of Environmental
Economics and Management, 5, 81-102.
Hastie, T., Tibshirani, R., & Friedman, J. (2001). The elements of statistical learning: Data mining, inference, and
prediction. NYC, NY: Springer.
Hastie, T., Tibshirani, R., & Friedman, J. (2011). The elements of statistical learning: Data mining, inference, and
prediction (2nd ed.). NYC, NY: Springer.
Hill, C. M., Malone, L. C., & Trocine, L. (2004). Data mining and traditional regression. In H. Bozdogan (Ed.),
Statistical data mining and knowledge discovery (pp. 233-249). Boca Raton, FL: CRC Press LLC.
Hothorn, T., Buhlmann, P., Kneib, T., Schmid, M., & Hofner, B. (2010). Model-based boosting 2.0. Journal of Machine
Learning Research, 11, 2109-2113.
Hurvich, C. M., & Tsai, C. L. (1989). Regression and time series model selection in small samples. Biometrika, 76,
297-307.
IBM SPSS Inc. (2012). IBM SPSS Statistics 21 Algorithms. Chicago, IL: SPSS, Inc.
Hongwei ”Patrick” Yang, PhD (UKY) SPSS LINEAR May 16, 2014 34 / 38

References
References IV
Kantardzic, M. (2011). Data mining: Concepts, models, methods, and algorithms (2nd ed.). Hoboken, NJ: John Wiley &
Sons, Inc.
Karagiannopoulos, M., Anyfantis, D., Kotsiantis, S. B., & Pintelas, P. E. (2007). Feature selection for regression
problems. Proceedings of the 8th Hellenic European Research on Computer Mathematics and Its Applications(HERCMA), Athens, Greece.
Kutner, M. H., Nachtsheim, C. J., & Neter, J. (2004). Applied linear regression models (4th ed.). New York:
McGraw-Hill/Irwin.
Larose, D. T. (2005). Discovering knowledge in data: An introduction to data mining. Hoboken, NJ: John Wiley & Sons,
Inc.
Leisch, F., & Dimitriadou, E. (2013). mlbench: Machine learning benchmark problems [Computer software manual].
Retrieved from http://cran.r-project.org/web/packages/mlbench/index.html (R package version 2.1-1)
Liu, B., Cui, Q., Jiang, T., & Ma, S. (2004). A combinational feature selection and ensemble neural network method for
classification of gene expression data. BMC Bioinformatics, 5, 136.
Lynda Pod Cast. (2011, August 22). How to use automatic linear modeling. Retrieved May 12, 2013, from
http://www.youtube.com/watch?v=JIs4sMxAFg0
Mendenhall, W., & Sincich, T. (2003). A second course in statistics: Regression analysis (6th ed.). Upper Saddle River,
NJ: Prentice Hall.
Mevik, B., Segtnan, V. H., & Nes, T. (2005). Ensemble methods and partial least squares regression. Journal of
Chemometrics, 18(11), 498-507.
Hongwei ”Patrick” Yang, PhD (UKY) SPSS LINEAR May 16, 2014 35 / 38

References
References V
Miller, A. J. (2002). Subset selection in regression (2nd ed.). NYC, NY: CRC.
Oza, N. C. (2005). Ensemble Data Mining Methods. In J. Wang (Ed.), Encyclopedia of Data Warehousing and Mining
(pp. 448-453). Hershey, PA: Information Science Reference.
Ratner, B. (2012). Statistical and machine-learning data mining: Techniques for better predictive modeling and analysis
of big data (2nd ed.). Boca Raton, FL: Taylor & Francis Group.
Rubenking, N. J. (2001). Hidden messages. Retrieved June 08, 2013, from
http://www.pcmag.com/article2/0,2817,8637,00.asp
SAS Institute, Inc. (2011a). Getting started with SAS Enterprise Miner 7.1. Cary, NC: SAS Institute, Inc.
SAS Institute, Inc. (2011b). SAS Enterprise Miner 7.1 extension nodes: Developer’s guide. Cary, NC: SAS Institute, Inc.
Schapire, R. E. (1990). The strength of weak learnability. Machine Learning, 5, 197-227.
Schapire, R. E.. (2002). The boosting approach to machine learning: An overview. In D. D. Denison, M. H. Hansen, C.
C. Holmes, B. Mallick, & B. Yu (Eds.), MSRI workshop on nonlinear estimation and classification. NYC, NY: Springer.
Schonlau, M. (2005). Boosted regression (boosting): An introductory tutorial and a STATA plugin. The STATA Journal,
5(3), 330-354.
StackExchange. (2011). Is automatic linear modelling in SPSS a good or bad thing? Retrieved May 12, 2013, from http:
//stats.stackexchange.com/questions/7432/is-automatic-linear-modelling-in-spss-a-good-or-bad-thing
Hongwei ”Patrick” Yang, PhD (UKY) SPSS LINEAR May 16, 2014 36 / 38

References
References VI
Stine, R. A. (2005). Feature selection for models in data mining. Paper presented at the data mining conference at The
College of New Jersey (TCNJ), Ewing, NJ.
Tamhane, A. C., & Dunlop, D. D. (2000). Statistics and data analysis: From elementary to intermediate. Upper Saddle
River, NJ: Prentice Hall.
Tibshirani, R. (1996). Regression shrinkage and selection via the Lasso. Journal of the Royal Statistical Society, Series B,
58(1), 267-288.
Weisberg, S. (2005). Applied linear regression (3rd ed.). Hoboken, NJ: John Wiley & Sons, Inc.
Witten, I. H., Frank, E., & Hall, M. A. (2011). Data mining: Practical machine learning tools and techniques (3rd ed.).
Burlington, MA: Elsevier Inc.
Yan, X., & Su, X. G. (2009). Linear regression analysis: Theory and computing. Singapore: World Scienti?c.
Yao, Y., Zhong, N., & Zhao, Y. (2008). A conceptual framework of data mining. Studies in Computational Intelligence,
118, 501-515.
Hongwei ”Patrick” Yang, PhD (UKY) SPSS LINEAR May 16, 2014 37 / 38

Questions & Answers
Questions & Answers
THANK YOU!Questions?
Hongwei ”Patrick” Yang, PhD (UKY) SPSS LINEAR May 16, 2014 38 / 38