automatic detection and localization of surface cracks in ... · pdf fileautomatic detection...
TRANSCRIPT
International Journal of ISSI, Vol.9 (2012), No.1, pp.30-40
Automatic Detection and Localization of Surface Cracks in Continuously Cast Hot Steel Slabs Using Digital Image Analysis Techniques
V. Malekian1*, R. Amirfattahi2, M. Rezaeian3, A. Aghaei4 and P. Rahimi5
1 Department of Biomedical Engineering, Amirkabir University of Technology, Tehran, 15875-4413, Iran2,3 Digital Signal Processing Research Lab., Department of Electrical and Computer Engineering, Isfahan
University of Technology, Isfahan, 84156-83111, Iran4 Department of Computer Engineering, Islamic Azad University, Najafabad Branch, Iran
5 Department of Biomedical Engineering, Islamic Azad University, Khomeinishahr Branch, Iran
-------------------------------------------------------------------------------------------------------------------------------------------------------------------------------------------------AbstractQuality inspection is an indispensable part of modern industrial manufacturing. Steel as a major industry requires constant surveillance and supervision through its various stages of production. Continuous casting is a critical step in the steel manufacturing process in which molten steel is solidified into a semi-finished product called slab. Once the slab is released from the casting unit, the surface often has longitudinal or transverse cracks. Being exposed to air, the crack surfaces oxidize and do not weld during rolling. The early detection of these defects on the slab saves significant time, effort and production expense, reduces costs, and prevents wasted processing steps and rolling mill faults. Traditionally, the inspection process has been carried out visually through human inspectors. However, human inspection is subjective, error-prone, tedious and time consuming. This paper presents an initial study to validate the feasibility of automated inspection of continuously cast hot slabs using computer vision techniques. An automated inspection system such as the one described in this paper can inspect a slab coming out of a caster while it is still hot. The image processing techniques applied in this work including wavelet transform, morphological operations, edge detection and clustering are time-efficient and simply applicable in industrial applications which demand online computations. The experimental results with 97.0% sensitivity and 96.0% specificity demonstrated that the proposed algorithm was effective and reliable. To the best of our knowledge, this is the first time that such a computerized algorithm has been applied in Iran’s steel industry for quality inspection of continuously cast hot slabs.
Keywords: Automatic inspection, Continuously cast slabs, Surface crack, Morphological operations, Edge detection, Color clustering, Neural network.-------------------------------------------------------------------------------------------------------------------------------------------------------------------------------------------------
1. Introduction1
Continuous casting is an established technology used to solidify molten steel. In this process, molten steel flows from the tundish in the water cool open-ended mold. Partially solidified slab is continuously withdrawn from the bottom of the mold into water spray. Heat is extracted and metal exits the mold as a solid fabricated sheet. Figure 1 shows part of a continuous casting unit in Esfahan’s Mobarakeh Steel Company.
* Corresponding author:Tel: +98 913 2260326 Fax: +98 21 66468186Email: [email protected]: Department of Biomedical Engineering, Amirkabir University of Technology, Tehran, 15875-4413, Iran1. Ph.D. Student2. Associate Professor3. M.Sc.4. B.Sc.5. B.Sc.
The steel slabs produced in a continuous caster are susceptible to a variety of surface imperfections including: longitudinal face cracks, transverse face cracks, frontal cracks, collar, corner and edge tears, scum patch, scum pits, scum tear, bleeder and rapeseed scab 1). These defects have to be detected before the subsequent rolling process in the finishing mills. So, an inspection stage between casting and hot-rolling is needed to detect and remove injured slabs.
Currently, the surface quality of continuously cast slabs is visually observed using binoculars which tend to be error-prone, slow, tiresome and even dangerous. The use of human workers in routine tasks like this should be avoided if possible, because the performance of a human inspector has a strong tendency to drop drastically in tedious jobs. Besides, harsh ambient condition in steel mills such as high temperature, air and sound pollution can potentially impair human efficiency and also general health.

International Journal of ISSI, Vol.9 (2012), No.1
31
Fig. 1. Continuous casting unit in Mobarakeh Steel Company.
Among all possible defects, surface cracks are the ones most likely to occur. According to statistics reported by Mobarakeh Steel Complex 2), these cracks account for almost 80% of the slab surface defects in the first six months of 2011. Being exposed to air, the crack surfaces oxidize and do not weld during rolling. This work focused on detecting and classifying surface cracks of hot slabs which can be very harmful when slabs are rolled to the thick plate. There exist techniques in the literature for defect detection in steel industry. Conventional crack inspection can be classified as:• Radiological methods: X-rays 3), gamma rays and
neutron beams 4)
• Electrical and magnetic methods: eddy current 5), magnetic flux leakage 6) and microwave testing 7)
• Vibration and acoustic measurement methods 8): ultrasonic and mechanical impedance measurements
• Visual and optical methods: holographic interferometry 9) and dye penetrants 10)
• Thermal methods 11): infrared radiation and temperature differenceIn this work, we aimed to assess the operational
feasibility and effectiveness of computer vision and image processing techniques for automated detection of surface cracks in continuously cast hot slabs. To the best of our knowledge, this is the first time that a computerized algorithm has been applied to detect and classify surface cracks of continuously cast hot slabs in Iran’s steel industry.
Automatic inspection is now increasingly being used for quality control in different industries. The incentive to use automatic inspection techniques is to achieve a reliable homogenous assessment beyond human limits even under harsh conditions. The traditional manual inspection is cumbersome, subjective and prone to discrepancies. The automation of the inspection process saves companies a lot of time and money and enhances their products quality and competitiveness.
To study the feasibility of computer vision-based check of hot slab surface, we gathered a database consisting of 400 images from hot slabs. These images
were captured using a Charge-Coupled Device (CCD) camera immediately after slabs were released from the casting unit. We propose two methods based on morphological operations and color clustering in combination with a neural network classifier.
The rest of the paper is organized as follows: Method describes the major steps of our proposed method that includes preprocessing, binary segmentation and color clustering. Edge enhancement and noise reduction section describes the three stages of the preprocessing phase. After that, the Binary segmentation algorithm is presented. Next, Color segmentation and Crack localization are explained respectively. Then, Results are presented and finally, a conclusion is drawn.
2. Method
In this paper, we aimed to develop an automated algorithm for discerning longitudinal and transverse cracks in the surface of continuously cast hot steel slabs. The challenges of crack detection in optical images lied in the strong noisy background, irregularity of crack patterns, and significant false positives. After casting, the surface of the slabs was scaled. The scale-covered background camouflaged the damages on the slab and created surface structures easily confusable with cracks.
In order to remove the background noise and reduce false positive, we applied a three-stage selective sharpening method on the images. This included image reconstruction by interpolating adaptively-amplified Wavelet coefficients, anisotropic diffusion and finally, adaptive Gaussian filtering. Two distinct algorithms for the detection of surface cracks were proposed. The first algorithm employed a non-derivative edge detection followed by several morphological operations. The second algorithm was based on color clustering in combination with a supervised classifier. After detecting defects on the slab surface, the position and size of the crack were determined using Hough transform. Figure 2 depicts the block diagram of the overall system. The detailed information and parameter selection for each block have been presented in the following sections.
Fig. 2. Block diagram of the proposed system.

International Journal of ISSI, Vol.9 (2012), No.1
32
3. Edge enhancement and noise reduction
As mentioned before, one of the major challenges in crack detection is the inhomogeneous background. The surface of a hot slab is covered in scale (Figure 3) which makes the detection of cracks troublesome. Before any further processing, the background noise must be suppressed. For this, a three-stage preprocessing chain was proposed as follows:
Fig. 3. Sample image of the slab surface: scales covered most parts of slab surface.
3.1. Wavelet transform
Wavelet transform is used to sharpen the crack edges while weakening noise 12). Wavelets are waveforms which are generated from single function φ by dilations and translations. The basic idea of the wavelet transform is to decompose the given function as a superposition of wavelets in different levels. Two-level decomposition of a two-dimensional wavelet transforms is shown in Figure 4. At each level, 2D wavelet coefficients are divided into four sub-blocks. The sub-blocks labeled ‘H’, ‘V’ and ‘D’ correspond to Horizontal, Vertical and Diagonal coefficients respectively, representing the detailed images, while the sub-block ‘A’ corresponds to coefficients representing the approximation image. A vertical line in the image produces large wavelet coefficients along a vertical line in the ‘V’ band, whereas the coefficients away from the line remain small. Similarly, a horizontal line produces large wavelet coefficients along a horizontal line in the ‘H’ band.
Fig. 4. Two-level decomposition structure of a 2D-Wavelet transform.
Although the mentioned approach is applicable to any wavelet function, 2D discrete Haar wavelet transform was used because of its simplicity and fast computation. First, the gray image was decomposed in two levels. In order to detect longitudinal cracks, vertical coefficients were strengthened whilst for transverse cracks, horizontal coefficients were amplified. Figure 5 shows the reconstructed image obtained after attenuating horizontal and diagonal coefficients by a factor of 0.5 and amplifying vertical coefficients by a factor of 4.
As can be seen, the inverse wavelet transform gives an image with vertical edges sharpened, but it is still full of redundant edges. To smooth the remaining background noise and eliminate unwanted edges, non-linear Diffusion filtering was applied on the reconstructed image.
Fig. 5. Reconstructed image after amplifying vertical coefficient and attenuating horizontal and diagonal coefficients.
3.2. Anisotropic diffusionNonlinear diffusion filter, originally formulated
by Perona and Malik in 1987 13), can reduce the noise without distorting or changing the location of
International Journal of ISSI, Vol.9 (2012), No.1
33
the edges. The basic idea can be summarized by the following equation:
))()((. ,, tttI Ic yxyx ∇∇=∂∂
(1)
where .∇ is the divergence operator which essentially measures how the density changes within a region and c yx,
is the diffusivity function. The
diffusion coefficient is applied to the local change in the image )(, tI yx∇ in different directions, indicating how much importance we give to the local change. A constant c leads to a linear diffusion equation, with a homogeneous diffusivity. In this case, all locations in the image, including the edges smoothed equally, are undesirable. If the function c be image dependent, then the linear diffusion equation will become a non-linear diffusion equation. For example, Perona and Malik used image derivatives
))((, Igc yx ∇= to control
the diffusion near the edges. The function g can be chosen as follows:
1))(
1(
1))((+∇
+=∇
α
kI
Ig (2)
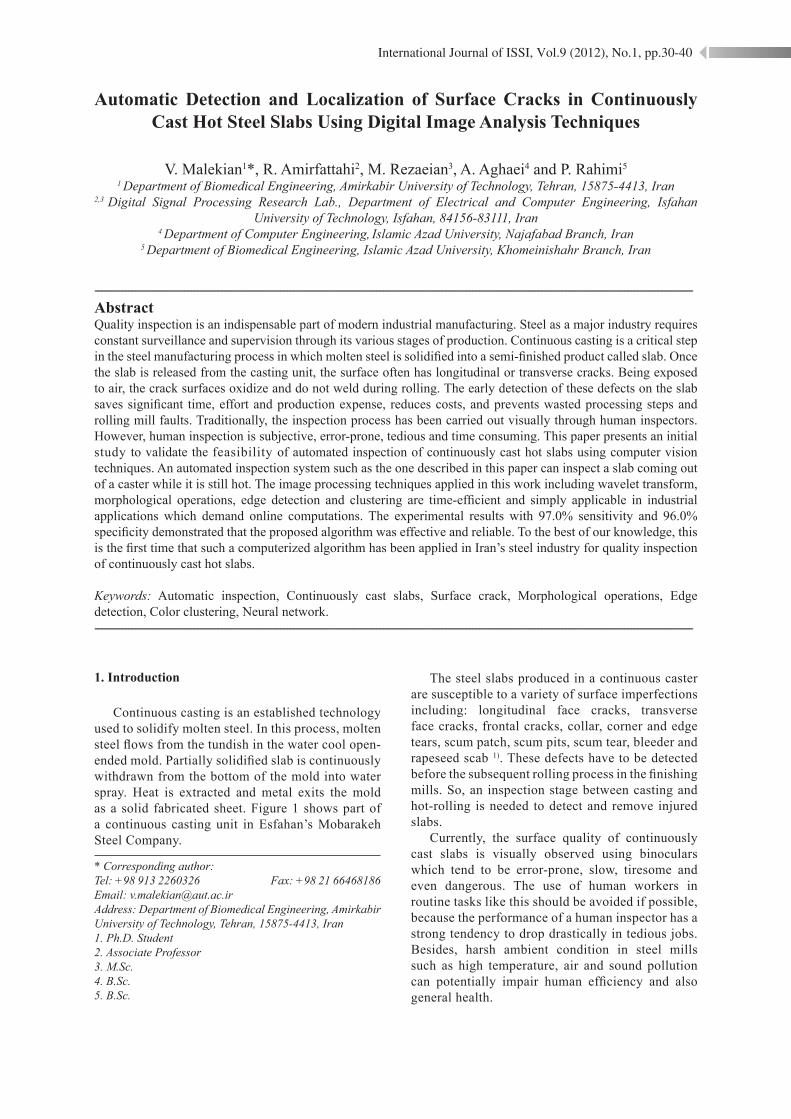
The result is illustrated in Figure 6.As depicted in Figure 6, the vertical crack in the
smoothed image is apparent while the background is more matt in appearance.
Fig. 6. Result of filtering by anisotropic diffusion ( 005.0,2 == kα ).
3.3. Adaptive Gaussian filtering
As the last preprocessing step, a discrete Gaussian filter was applied to the image. The Gaussian operator has been considered to be optimal for image smoothing 14):
)2
(
22
22
21),,( σ
σπσ
yxeyxG
+−
= (3)
where )
2(
22
22
21),,( σ
σπσ
yxeyxG
+−
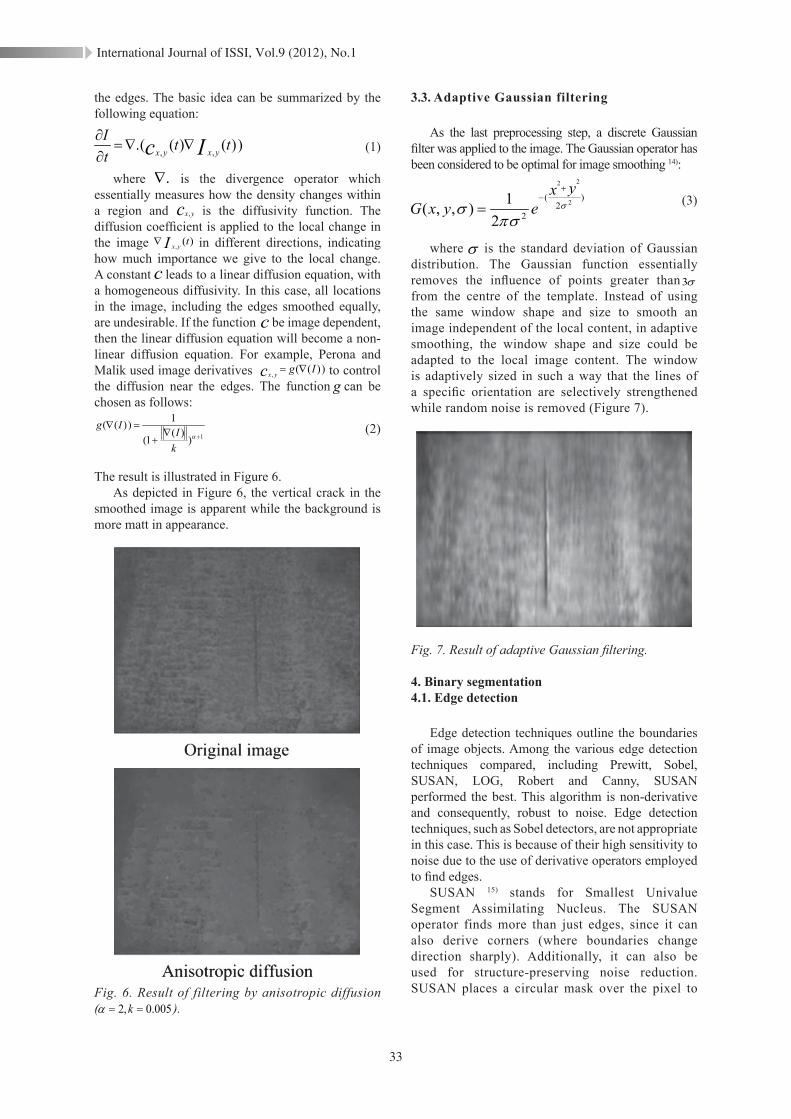
= is the standard deviation of Gaussian distribution. The Gaussian function essentially removes the influence of points greater than σ3from the centre of the template. Instead of using the same window shape and size to smooth an image independent of the local content, in adaptive smoothing, the window shape and size could be adapted to the local image content. The window is adaptively sized in such a way that the lines of a specific orientation are selectively strengthened while random noise is removed (Figure 7).
Fig. 7. Result of adaptive Gaussian filtering.
4. Binary segmentation4.1. Edge detection
Edge detection techniques outline the boundaries of image objects. Among the various edge detection techniques compared, including Prewitt, Sobel, SUSAN, LOG, Robert and Canny, SUSAN performed the best. This algorithm is non-derivative and consequently, robust to noise. Edge detection techniques, such as Sobel detectors, are not appropriate in this case. This is because of their high sensitivity to noise due to the use of derivative operators employed to find edges.
SUSAN 15) stands for Smallest Univalue Segment Assimilating Nucleus. The SUSAN operator finds more than just edges, since it can also derive corners (where boundaries change direction sharply). Additionally, it can also be used for structure-preserving noise reduction. SUSAN places a circular mask over the pixel to
International Journal of ISSI, Vol.9 (2012), No.1
34
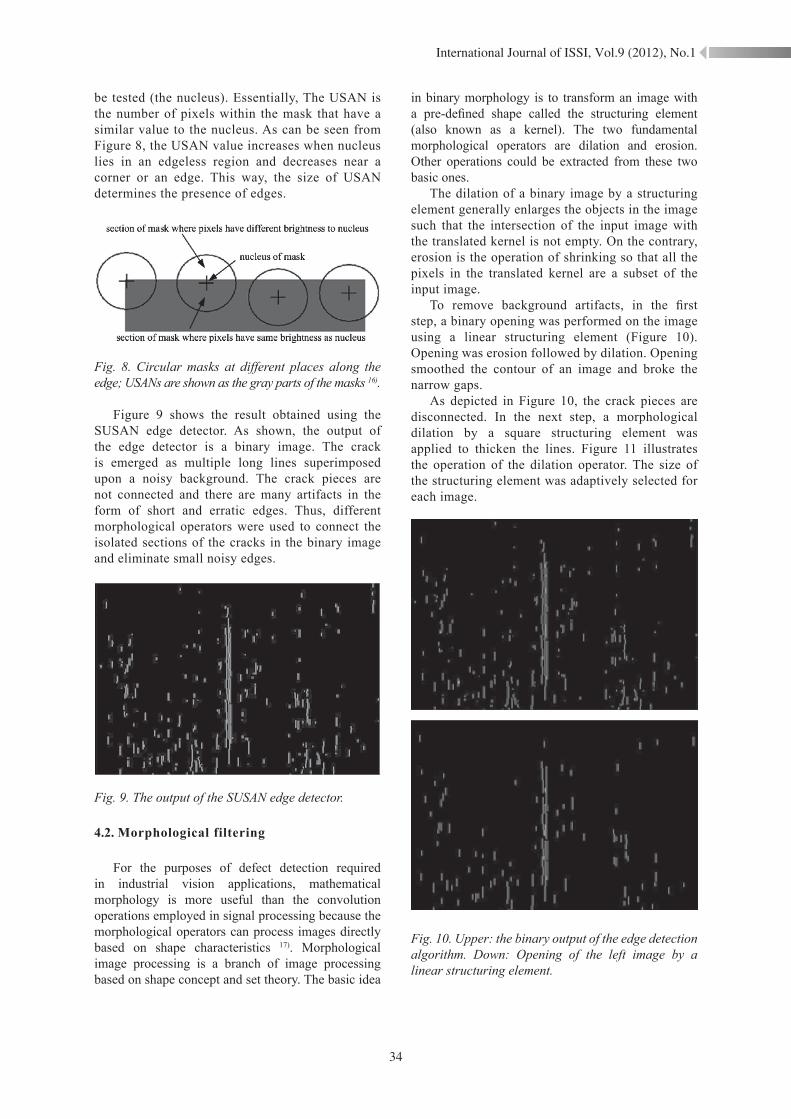
be tested (the nucleus). Essentially, The USAN is the number of pixels within the mask that have a similar value to the nucleus. As can be seen from Figure 8, the USAN value increases when nucleus lies in an edgeless region and decreases near a corner or an edge. This way, the size of USAN determines the presence of edges.
Fig. 8. Circular masks at different places along the edge; USANs are shown as the gray parts of the masks 16).
Figure 9 shows the result obtained using the SUSAN edge detector. As shown, the output of the edge detector is a binary image. The crack is emerged as multiple long lines superimposed upon a noisy background. The crack pieces are not connected and there are many artifacts in the form of short and erratic edges. Thus, different morphological operators were used to connect the isolated sections of the cracks in the binary image and eliminate small noisy edges.
Fig. 9. The output of the SUSAN edge detector.
4.2. Morphological filtering
For the purposes of defect detection required in industrial vision applications, mathematical morphology is more useful than the convolution operations employed in signal processing because the morphological operators can process images directly based on shape characteristics 17). Morphological image processing is a branch of image processing based on shape concept and set theory. The basic idea
in binary morphology is to transform an image with a pre-defined shape called the structuring element (also known as a kernel). The two fundamental morphological operators are dilation and erosion. Other operations could be extracted from these two basic ones.
The dilation of a binary image by a structuring element generally enlarges the objects in the image such that the intersection of the input image with the translated kernel is not empty. On the contrary, erosion is the operation of shrinking so that all the pixels in the translated kernel are a subset of the input image.
To remove background artifacts, in the first step, a binary opening was performed on the image using a linear structuring element (Figure 10). Opening was erosion followed by dilation. Opening smoothed the contour of an image and broke the narrow gaps.
As depicted in Figure 10, the crack pieces are disconnected. In the next step, a morphological dilation by a square structuring element was applied to thicken the lines. Figure 11 illustrates the operation of the dilation operator. The size of the structuring element was adaptively selected for each image.
Fig. 10. Upper: the binary output of the edge detection algorithm. Down: Opening of the left image by a linear structuring element.
International Journal of ISSI, Vol.9 (2012), No.1
35
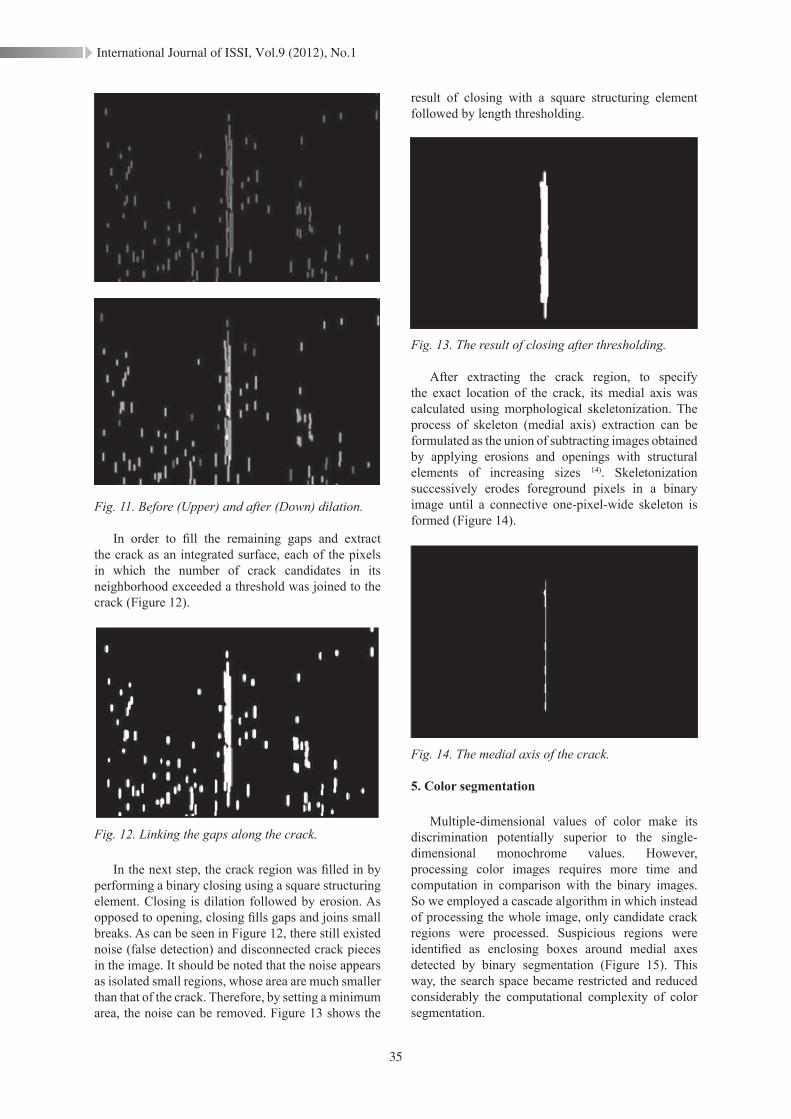
Fig. 11. Before (Upper) and after (Down) dilation.
In order to fill the remaining gaps and extract the crack as an integrated surface, each of the pixels in which the number of crack candidates in its neighborhood exceeded a threshold was joined to the crack (Figure 12).
Fig. 12. Linking the gaps along the crack.
In the next step, the crack region was filled in by performing a binary closing using a square structuring element. Closing is dilation followed by erosion. As opposed to opening, closing fills gaps and joins small breaks. As can be seen in Figure 12, there still existed noise (false detection) and disconnected crack pieces in the image. It should be noted that the noise appears as isolated small regions, whose area are much smaller than that of the crack. Therefore, by setting a minimum area, the noise can be removed. Figure 13 shows the
result of closing with a square structuring element followed by length thresholding.
Fig. 13. The result of closing after thresholding.
After extracting the crack region, to specify the exact location of the crack, its medial axis was calculated using morphological skeletonization. The process of skeleton (medial axis) extraction can be formulated as the union of subtracting images obtained by applying erosions and openings with structural elements of increasing sizes 14). Skeletonization successively erodes foreground pixels in a binary image until a connective one-pixel-wide skeleton is formed (Figure 14).
Fig. 14. The medial axis of the crack.
5. Color segmentation
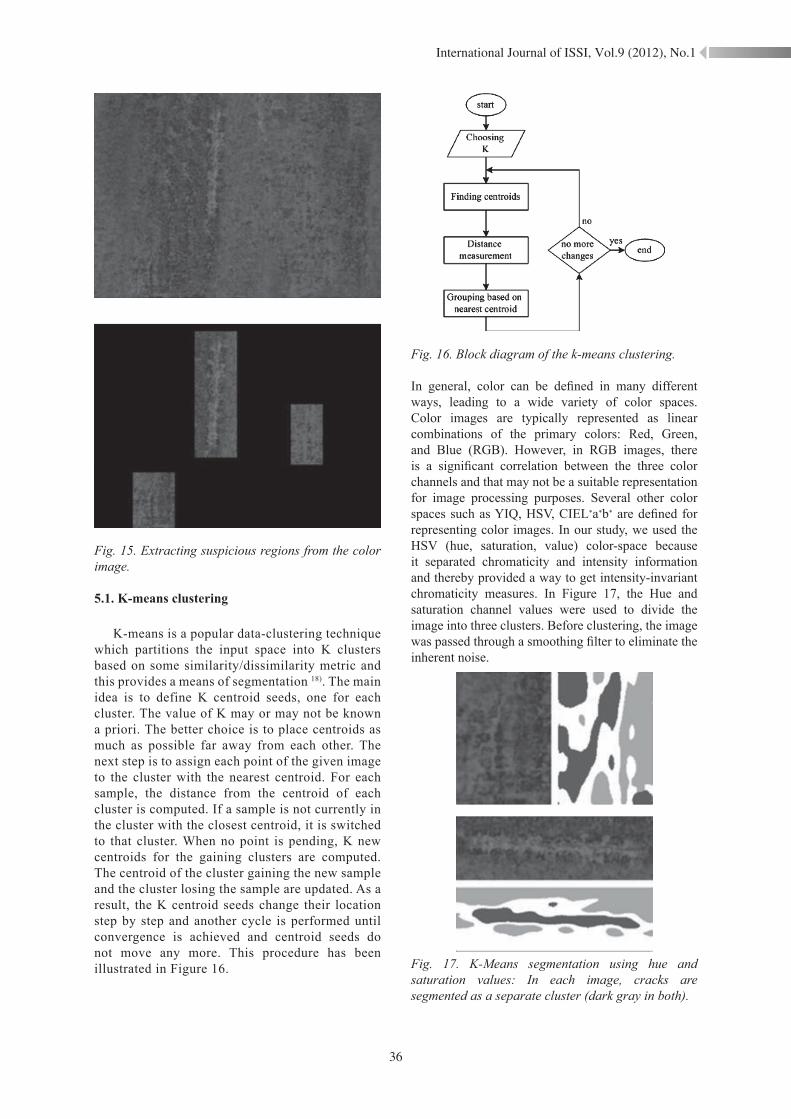
Multiple-dimensional values of color make its discrimination potentially superior to the single-dimensional monochrome values. However, processing color images requires more time and computation in comparison with the binary images. So we employed a cascade algorithm in which instead of processing the whole image, only candidate crack regions were processed. Suspicious regions were identified as enclosing boxes around medial axes detected by binary segmentation (Figure 15). This way, the search space became restricted and reduced considerably the computational complexity of color segmentation.
International Journal of ISSI, Vol.9 (2012), No.1
36
Fig. 15. Extracting suspicious regions from the color image.
5.1. K-means clustering
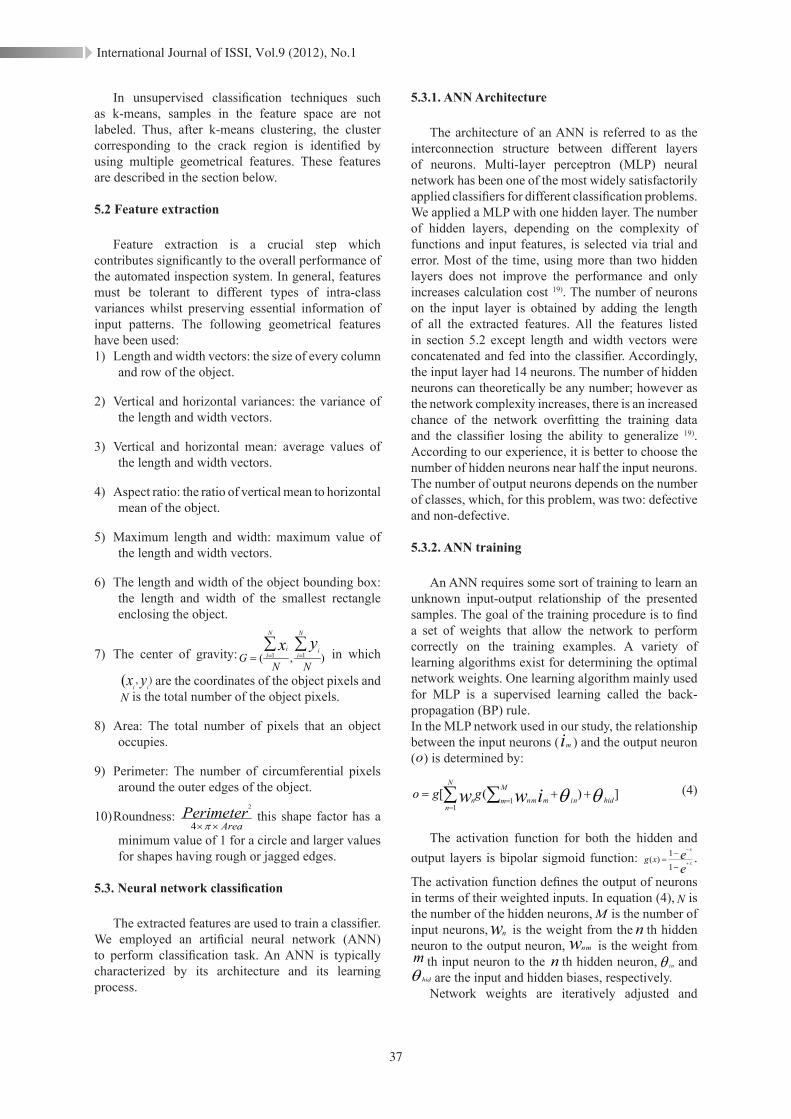
K-means is a popular data-clustering technique which partitions the input space into K clusters based on some similarity/dissimilarity metric and this provides a means of segmentation 18). The main idea is to define K centroid seeds, one for each cluster. The value of K may or may not be known a priori. The better choice is to place centroids as much as possible far away from each other. The next step is to assign each point of the given image to the cluster with the nearest centroid. For each sample, the distance from the centroid of each cluster is computed. If a sample is not currently in the cluster with the closest centroid, it is switched to that cluster. When no point is pending, K new centroids for the gaining clusters are computed. The centroid of the cluster gaining the new sample and the cluster losing the sample are updated. As a result, the K centroid seeds change their location step by step and another cycle is performed until convergence is achieved and centroid seeds do not move any more. This procedure has been illustrated in Figure 16.
Fig. 16. Block diagram of the k-means clustering.
In general, color can be defined in many different ways, leading to a wide variety of color spaces. Color images are typically represented as linear combinations of the primary colors: Red, Green, and Blue (RGB). However, in RGB images, there is a significant correlation between the three color channels and that may not be a suitable representation for image processing purposes. Several other color spaces such as YIQ, HSV, CIEL∗a∗b∗ are defined for representing color images. In our study, we used the HSV (hue, saturation, value) color-space because it separated chromaticity and intensity information and thereby provided a way to get intensity-invariant chromaticity measures. In Figure 17, the Hue and saturation channel values were used to divide the image into three clusters. Before clustering, the image was passed through a smoothing filter to eliminate the inherent noise.
Fig. 17. K-Means segmentation using hue and saturation values: In each image, cracks are segmented as a separate cluster (dark gray in both).
International Journal of ISSI, Vol.9 (2012), No.1
37
In unsupervised classification techniques such as k-means, samples in the feature space are not labeled. Thus, after k-means clustering, the cluster corresponding to the crack region is identified by using multiple geometrical features. These features are described in the section below.
5.2 Feature extraction
Feature extraction is a crucial step which contributes significantly to the overall performance of the automated inspection system. In general, features must be tolerant to different types of intra-class variances whilst preserving essential information of input patterns. The following geometrical features have been used: 1) Length and width vectors: the size of every column
and row of the object.
2) Vertical and horizontal variances: the variance of the length and width vectors.
3) Vertical and horizontal mean: average values of the length and width vectors.
4) Aspect ratio: the ratio of vertical mean to horizontal mean of the object.
5) Maximum length and width: maximum value of the length and width vectors.
6) The length and width of the object bounding box: the length and width of the smallest rectangle enclosing the object.
7) The center of gravity: ),( 11
NNG
N
ii
N
ii yx ∑∑
=== in which
),( yx iiare the coordinates of the object pixels and
N is the total number of the object pixels.
8) Area: The total number of pixels that an object occupies.
9) Perimeter: The number of circumferential pixels around the outer edges of the object.
10) Roundness:Area
Perimeter××π4
2
this shape factor has a
minimum value of 1 for a circle and larger values for shapes having rough or jagged edges.
5.3. Neural network classification
The extracted features are used to train a classifier. We employed an artificial neural network (ANN) to perform classification task. An ANN is typically characterized by its architecture and its learning process.
5.3.1. ANN Architecture
The architecture of an ANN is referred to as the interconnection structure between different layers of neurons. Multi-layer perceptron (MLP) neural network has been one of the most widely satisfactorily applied classifiers for different classification problems. We applied a MLP with one hidden layer. The number of hidden layers, depending on the complexity of functions and input features, is selected via trial and error. Most of the time, using more than two hidden layers does not improve the performance and only increases calculation cost 19). The number of neurons on the input layer is obtained by adding the length of all the extracted features. All the features listed in section 5.2 except length and width vectors were concatenated and fed into the classifier. Accordingly, the input layer had 14 neurons. The number of hidden neurons can theoretically be any number; however as the network complexity increases, there is an increased chance of the network overfitting the training data and the classifier losing the ability to generalize 19). According to our experience, it is better to choose the number of hidden neurons near half the input neurons. The number of output neurons depends on the number of classes, which, for this problem, was two: defective and non-defective.
5.3.2. ANN training
An ANN requires some sort of training to learn an unknown input-output relationship of the presented samples. The goal of the training procedure is to find a set of weights that allow the network to perform correctly on the training examples. A variety of learning algorithms exist for determining the optimal network weights. One learning algorithm mainly used for MLP is a supervised learning called the back-propagation (BP) rule. In the MLP network used in our study, the relationship between the input neurons (im ) and the output neuron (o) is determined by:
])([1
1θθ hidnim
M
m mn
N
nn iww ggo ++= ∑∑ =
=
(4)
The activation function for both the hidden and output layers is bipolar sigmoid function:
ee
x
x
xg +
−
−
−=
11
)( .
The activation function defines the output of neurons in terms of their weighted inputs. In equation (4), N is the number of the hidden neurons, M is the number of input neurons, wn is the weight from the n th hidden neuron to the output neuron, w mn is the weight from m th input neuron to the n th hidden neuron, θ ni and θ hid are the input and hidden biases, respectively.
Network weights are iteratively adjusted and

International Journal of ISSI, Vol.9 (2012), No.1
38
computed based on back-propagation with momentum terms, as follows:
)()1( tt wZw kjjkkj ∆+=+∆ µαδ (5)
Where )( ∑+=k
kkjjj xwZ g θ , xk is the activity level of the k th neuron in the previous layer, and w kj
is the weight of the connection between the j th
and k th neurons. δ k is the error between the desired and the actual ANN output value. α is the learning rate, µ is the momentum, and t is the number of iterations. The momentum term determines the effect of past weight changes on the current weight update. BP is a gradient descent method that can get stuck in local minima. The momentum term prevents the network from being trapped into local minima and speeds up the convergence of the network. In this study, the learning rate and momentum were set at 0.05 and 0.8 respectively and weights were randomly initialized within [-1,1].
Training occurred through an appropriate database of samples. The dataset consisted of features extracted from 400 images including 200 defective and 200 non-defective samples. 100 defective and 100 non-defective samples were used to train the classifier and the remaining unseen samples were used to test the generalization capability of the network. Among the objects shown in Figure 18, only the object 2 is classified as a crack.
6. Calculating Crack Size and Position
The Hough transform (HT) is a technique that locates shapes in images 20). In particular, it has been used to extract lines, circles and ellipses. In the case of lines, its mathematical definition is equivalent to the Radon transform 21). The Hough transform of a binary image ),( yxI is defined as 20):
∫ ∫∞
∞−
∞
∞−
−−= dxdyyxyxIH )sincos(),(),( θθρδρθ (6)
whereδ is the Dirac delta-function. The Hough transform maps each point ),( yx in the original image to a sinusoid θθρ sincos yx += , where ρ is the perpendicular distance from the origin and θ is the angle with the normal. As illustrated in Figure 19, a set of image points which lie on a straight line produce sinusoids that all cross at a single point in the Hough transform.
For the inverse transform, each point in the Hough domain is transformed into a straight line in the image. By using the inverse Hough function and setting a threshold T for the total number of sinusoids that cross at the specific point, it is possible to filter the image to keep only lines that contain at least T points. This property of the Hough transform is used for exact localization of the extracted cracks. The line reconstructed by inverse Hough transform is used to obtain the size and spatial localization of the crack. The position of the crack is measured from the top left corner of the image.
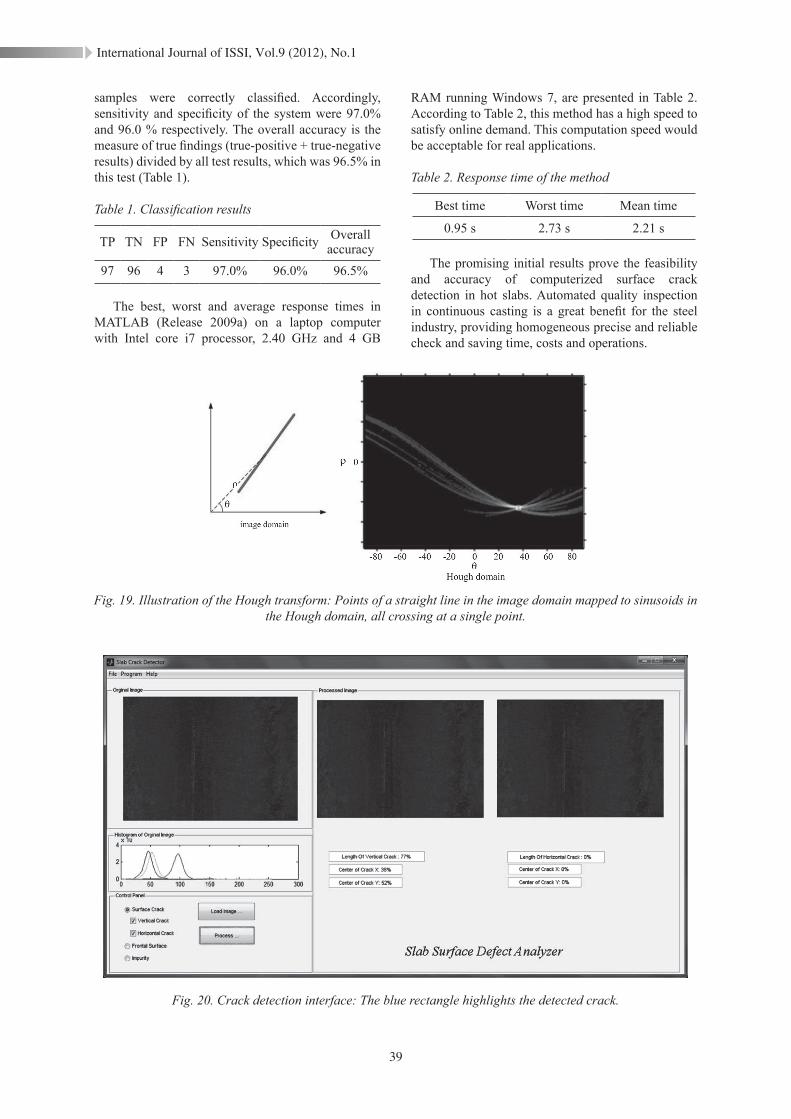
Figure 20 shows the Graphical User Interface (GUI) of the crack detection system which is designed in MATLAB®.
7. Experimental results
For a binary classifier, there can be four possible outcomes: true positives (TP), true negatives (TN), false positives (FP), and false negatives (FN). The accuracy of the classification is measured using sensitivity and specificity metrics 22):
PFNTNTySpecificit
NFPTPTySensitivit
+=
+=
(6)
The sensitivity is the proportion of correctly detected cracks to all samples where a defect truly occurs. The specificity is the proportion of undetected defect cases to the number of samples where defects do not occur truly.
Among 200 test samples presented to the algorithm, 193 (97 defective and 96 non-defective)
Fig. 18. Obtained clusters by K-means color clustering are classified using a neural network. Only object2 is labeled as a crack.
International Journal of ISSI, Vol.9 (2012), No.1
39
Fig. 19. Illustration of the Hough transform: Points of a straight line in the image domain mapped to sinusoids in the Hough domain, all crossing at a single point.
Fig. 20. Crack detection interface: The blue rectangle highlights the detected crack.
samples were correctly classified. Accordingly, sensitivity and specificity of the system were 97.0% and 96.0 % respectively. The overall accuracy is the measure of true findings (true-positive + true-negative results) divided by all test results, which was 96.5% in this test (Table 1).
Table 1. Classification results
TP TN FP FN Sensitivity Specificity Overall accuracy
97 96 4 3 97.0% 96.0% 96.5%
The best, worst and average response times in MATLAB (Release 2009a) on a laptop computer with Intel core i7 processor, 2.40 GHz and 4 GB
RAM running Windows 7, are presented in Table 2. According to Table 2, this method has a high speed to satisfy online demand. This computation speed would be acceptable for real applications.
Table 2. Response time of the method
Best time Worst time Mean time
0.95 s 2.73 s 2.21 s
The promising initial results prove the feasibility and accuracy of computerized surface crack detection in hot slabs. Automated quality inspection in continuous casting is a great benefit for the steel industry, providing homogeneous precise and reliable check and saving time, costs and operations.

International Journal of ISSI, Vol.9 (2012), No.1
40
8. Conclusion
This paper presented a new automated approach for crack detection and localization in hot steel slab surface images. In the first step, a three-stage preprocessing was performed to enhance cracks and remove unwanted edges. Then we used a binary segmentation algorithm based on edge detection and morphological filtering. For more precise crack detection, a color segmentation scheme based on clustering in combination with a neural network classifier was proposed. This algorithm allowed reliable detection of cracks in the surface of hot slabs without removing the surface scale. Low over- and under-detection rate of the algorithm (false positive and false negative, respectively) obtained over hundreds of samples (Table 1) along with its flexibility in adapting to the needs of other steel plants were the remarkable features of the proposed method. Furthermore, in addition to detecting and classifying surface cracks, the system also determined the location of the cracks and their size, providing the possibility of indicating the origin of the formation of cracks and consequently, reducing them.
We expect the implementation of the whole automated surface inspection system including multiple cameras for continuous comprehensive surface monitoring to provide the following benefits:• 50% improvement in inspection• 65% time saving• 25% reduction in expenses• 45% improvement in products quality
With these characteristics, the system provides not only direct economic benefits, but also offers the possibility of implementing “hot charge”, resulting in significant energy saving and higher throughput. The automatic crack detection tool is still in progress for detecting other types of slab imperfections. We also intend to investigate the use of infrared images in our future work.
Acknowledgments
We would like to thank the Steel making and continuous casting unit of Mobarakeh Steel Company, Isfahan for their support.
References
[1] B.R. Suresh, R.A. Fundakowski, T.S. Levitt and J.E. Overland: IEEE Trans. Pattern Anal. Mach. Intell., 5(1983), 563. [2] http://www.msc.ir/news/11/6/16/1. Accessed 16 June 2011.[3] N. Limodin, J. Rethore, J.Y. Buffiere, A. Gravouil, F. Hild and S. Roux: Acta Mater., 57(2009), 4090.[4] A. Agrawal, Y. Kashyap, P.S. Sarkar, A.N. Behra, M. Shukla, R.N. Singh, A. Sinha and J.K. Chakravartty: J. Nucl. Mater., 421(2012) 47.[5] Y. He, F. Luo, M. Pan, F. Weng, X. Hu, J. Gao and B. Liu: NDT & E Int., 43(2010), 176.[6] T. Nara, Y. Takanashi and M. Mizuide: J. Appl. Phys., 109(2010), 773.[7] K. Vijayakumar, S.R. Wylie, J.D. Cullen, C.C. Wright and A.I. Ai-Shamma’a: J. Phys. Conf. Ser., 178(2009), 695.[8] D. Dutta, H. Sohn, K.A. Harries and P. Rizzo: Struct. Health Monit., 8(2009), 251.[9] M. Karray, C. Poilane, D. Mounier, and P. Picart: in Biomedical Optics and 3-D Imaging, OSA Technical Digest, (2012), paper DW1C.4.[10] K. Daneshvar and B. Dogan: Mater. High Temp., 27(2010), 179.[11] S.E. Burrows, S. Dixon, S.G. Pickering, T. Li and D.P. Almond: NDT & E Int., 44(2011), 589.[12] A.V. Ovanesova and L.E. Suarez: Eng. Struct., 26(2004), 39.[13] P. Perona and J. Malik: Proc. of IEEE Computer Society workshop on Computer Vision, Miami, (1987), 16.[14] M.S. Nixon and A.S. Aguado: Feature Extraction and Image Processing, Academic Press, Elsevier Ltd, Oxford, (2008).[15] M. Siyah Mansoory, M. Ashtiyani and H. Sarabadani: Mod. Appl. Sci., 5(2011), 117.[16] M.S. Smith and J.M. Brady: Int. J Comput. Vis., 23(1997), 45. [17] R. Gonzalez and R. Woods: Digital Image Processing, Prentice Hall, New Jersey, (2008).[18] A.K. Jain: Data clustering: Pattern Recogn. Lett., 31(2010), 651.[19] S.S. Haykin: Neural networks and learning machines, Prentice Hall, New York, (2009).[20] P.E. Hart: IEEE Signal Process. Mag., 26(2009), 18.[21] S.R. Deans: Hough Transform from the Radon Transform. IEEE Trans. Pattern Anal. Mach. Intell., 3(1981), 185.[22] M. Haindl, J. Kittler and F. Roli: Multiple Classifier Systems, Springer-Verlag, Berlin Heidelberg, (2007).