automatic data acquisition
TRANSCRIPT

Chapter: 6
Automatic Data Acquisition Page No.: 1
Number of Pages: 4
Date: 2004-05-25 Geotechnisches Ingenieurbüro
Just a few years ago it was still customary to collect geotechnical data by hand. The introduction of automatic data acquisition has led to a major revolution in metrology, to its advantage certainly but also to its disadvantage in some respects. When using these technologies we should always remain aware of their limits while appreciating their benefits: No automatic measuring system is able to replace an engineer's power of judgement. The above remarks should not be interpreted as a vote against the use of automatic data acquisition systems. Rather, they reflect the belief that the suitability of such sys-tems should be subjected to honest assessment before they are put into service. The advantages and disadvantages of automatic data acquisition are listed in Tab. 1.
Advantages Disadvantages • Reduced personnel costs
• Replacement of a knowledgable geo-
technical engineer by a machine • Any number of measurements
• Data acquisition at inaccessible places • Blind acceptance of data that may or may not be correct
• Fast transmission of data over large distances
• Monitoring of dynamic processes • Generation of a flood of data that tempts you to put off evaluation and interpretation instead of reacting im-mediately to important changes
• Data collected in a computer-compatible form
• Higher measuring accuracy because the sensors are firmly connected with the measuring instrument
• High installation costs and often considerable maintenance costs
Tab. 1 List of the advantages and disadvantages of automatic data acquisition
(according to DUNNICLIFF, 1988)
Prof. Fecker & Partner GmbH Am Reutgraben 9 Fon: ++7243/5983-7 D-76275 Ettlingen Fax: ++7243/5983-97
Chapter: 6
Automatic Data Acquisition Page No.: 2
Number of Pages: 4
Date: 2004-05-25 Geotechnisches Ingenieurbüro
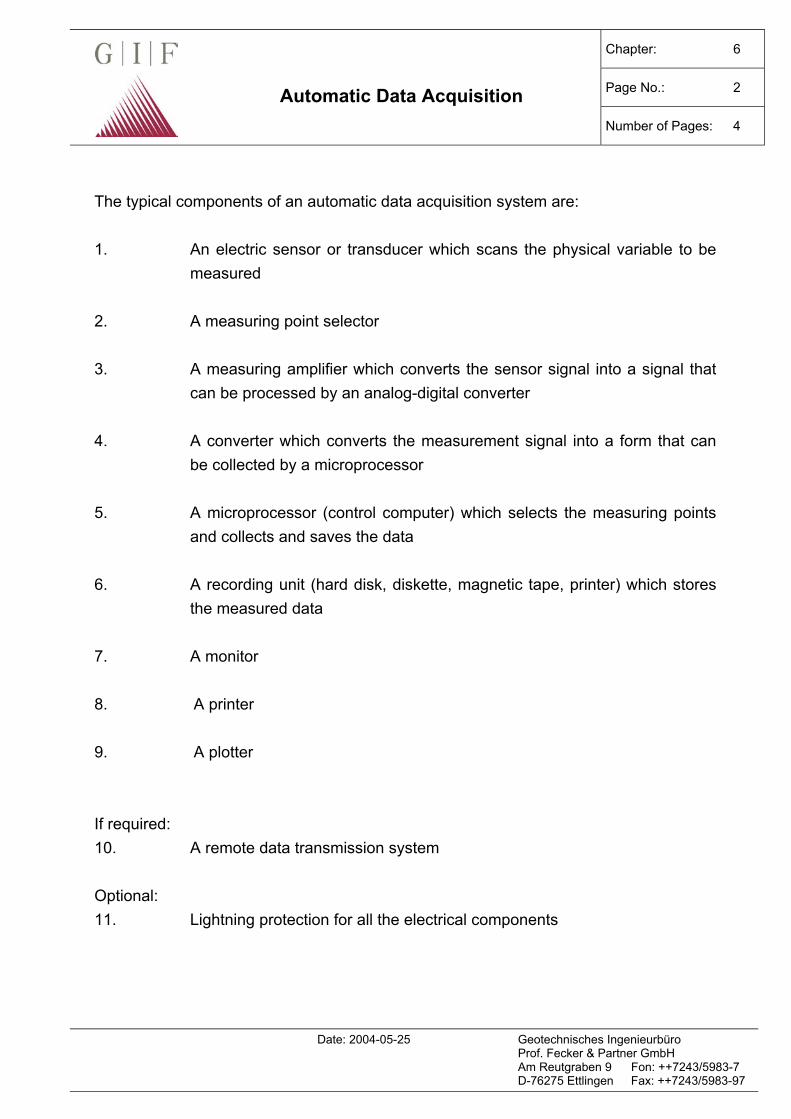
The typical components of an automatic data acquisition system are: 1. An electric sensor or transducer which scans the physical variable to be
measured 2. A measuring point selector 3. A measuring amplifier which converts the sensor signal into a signal that
can be processed by an analog-digital converter 4. A converter which converts the measurement signal into a form that can
be collected by a microprocessor 5. A microprocessor (control computer) which selects the measuring points
and collects and saves the data 6. A recording unit (hard disk, diskette, magnetic tape, printer) which stores
the measured data 7. A monitor 8. A printer 9. A plotter If required: 10. A remote data transmission system Optional: 11. Lightning protection for all the electrical components
Prof. Fecker & Partner GmbH Am Reutgraben 9 Fon: ++7243/5983-7 D-76275 Ettlingen Fax: ++7243/5983-97

Chapter: 6
Automatic Data Acquisition Page No.: 3
Number of Pages: 4
Date: 2004-05-25 Geotechnisches Ingenieurbüro
The range of data acquisition solutions available from gif can be divided into three sys-tems, albeit the boundaries between each are blurred:
1. Standalone system 2. Master-slave system 3. Online system
Standalone system The standalone system is used to collect data from a small number of locally grouped sensors over the medium to long term. The measured data is scanned and saved, and it is collected by remote data transmission or cable. See Section 6.1 Decentral data ac-quisition. Master-slave system Master-slave systems are used for a larger number of sensors and/or great distances between the sensors. Communication between the master and slaves takes place via a 2- to 6-wire line, depending on the transmission standard and whether the voltage is supplied through the same line. Remote data transmission, e. g. via radio or optical ca-bles, is also possible.
Fig. 1 Example of a master-slave system setup
Prof. Fecker & Partner GmbH Am Reutgraben 9 Fon: ++7243/5983-7 D-76275 Ettlingen Fax: ++7243/5983-97
Chapter: 6
Automatic Data Acquisition Page No.: 4
Number of Pages: 4
Date: 2004-05-25 Geotechnisches Ingenieurbüro
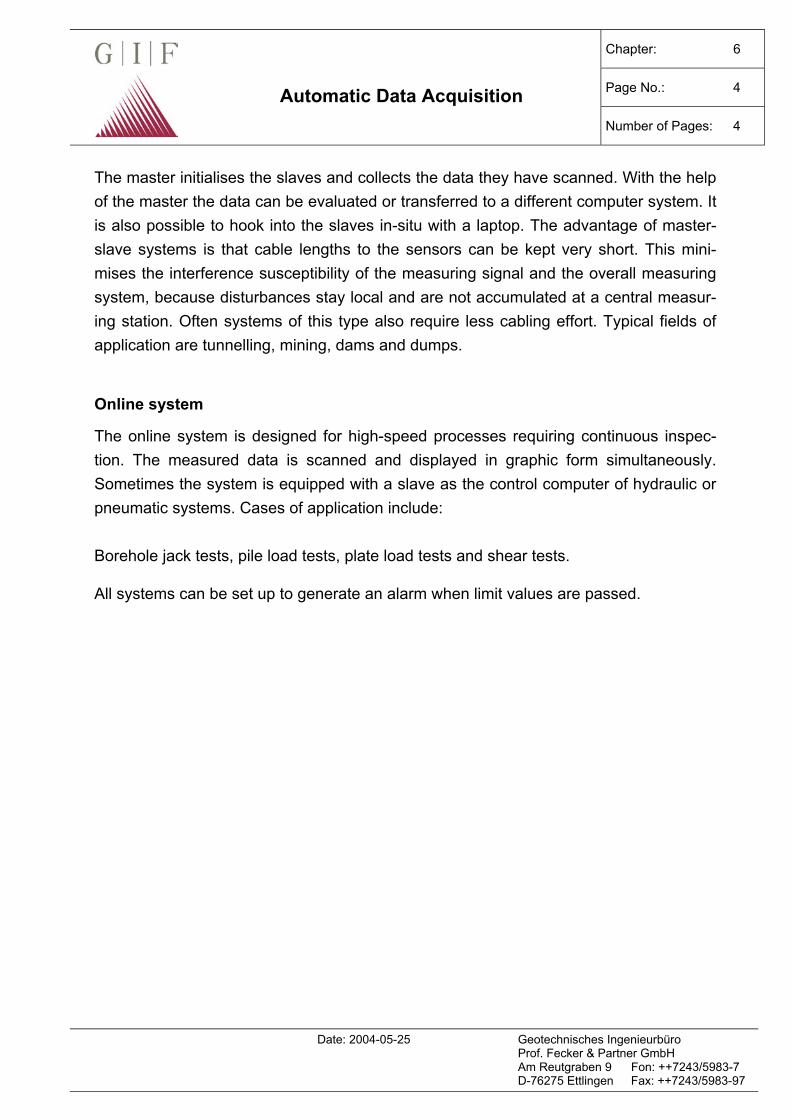
The master initialises the slaves and collects the data they have scanned. With the help of the master the data can be evaluated or transferred to a different computer system. It is also possible to hook into the slaves in-situ with a laptop. The advantage of master-slave systems is that cable lengths to the sensors can be kept very short. This mini-mises the interference susceptibility of the measuring signal and the overall measuring system, because disturbances stay local and are not accumulated at a central measur-ing station. Often systems of this type also require less cabling effort. Typical fields of application are tunnelling, mining, dams and dumps. Online system
The online system is designed for high-speed processes requiring continuous inspec-tion. The measured data is scanned and displayed in graphic form simultaneously. Sometimes the system is equipped with a slave as the control computer of hydraulic or pneumatic systems. Cases of application include: Borehole jack tests, pile load tests, plate load tests and shear tests. All systems can be set up to generate an alarm when limit values are passed.
Prof. Fecker & Partner GmbH Am Reutgraben 9 Fon: ++7243/5983-7 D-76275 Ettlingen Fax: ++7243/5983-97

Decentral Measuring Value and Chapter: 6.1
Data AcquisitionSystem Page No.: 1
DDA_MW2E Number of Pages: 4
Date: 2004-05-25 Geotechnisches Ingenieurbüro
Short description The data loggers of the series DA_MW2E are used for the high-precise, automatic data recording for longer periods of time. Different types of these instruments are available, equipped with 8 up to 16 measuring channels. Most of all current sensors can be di-rectly connected to each measuring channel: Load cells, deformation transducers, sen-sors for pH-value and oxidation-reduction potential, temperature sensors, electrical cur-rent and voltmeters, etc. The measuring procedure is controlled by a microprocessor, together with a real-time clock. The measuring values are held in a permanent memory and can be transferred, if desired, by a serial interface to a (portable) personal computer. The processing, visuali-zation and evaluation of the data can be done with nearly all current standard programs (spread sheet calculation, data bases, etc.). Design The data logger consists on principle of three function blocks (Fig. 1). 1. Analog/digital-converter block This block delivers the raw measuring data. The sensor of a measuring channel can deliver a signal referring to mass or differential signal. Differential means that the signal must not have a reference to mass, but that the measuring value can be seen as a dif-ference between both conductors. Differential signals are often produced by strain foil gauges, for example. This signal is pre-amplified by an „instrument amplifier“ and led to the A/D-converter, which turns an electrical value to a digital value with a resolution of +/- 18 bit in this case. This corresponds to an accuracy of 0,0004 %! In practice each signal has a certain random noise that corrupts the measuring value in case of indi-vidual measurements. To reduce this statistical effect a programmable number of measuring values can be averaged.
Prof. Fecker & Partner GmbH Am Reutgraben 9 Fon: ++7243/5983-7 D-76275 Ettlingen Fax: ++7243/5983-97
Decentral Measuring Value and Chapter: 6.1
Data AcquisitionSystem Page No.: 2
DDA_MW2E Number of Pages: 4
Date: 2004-05-25 Geotechnisches Ingenieurbüro
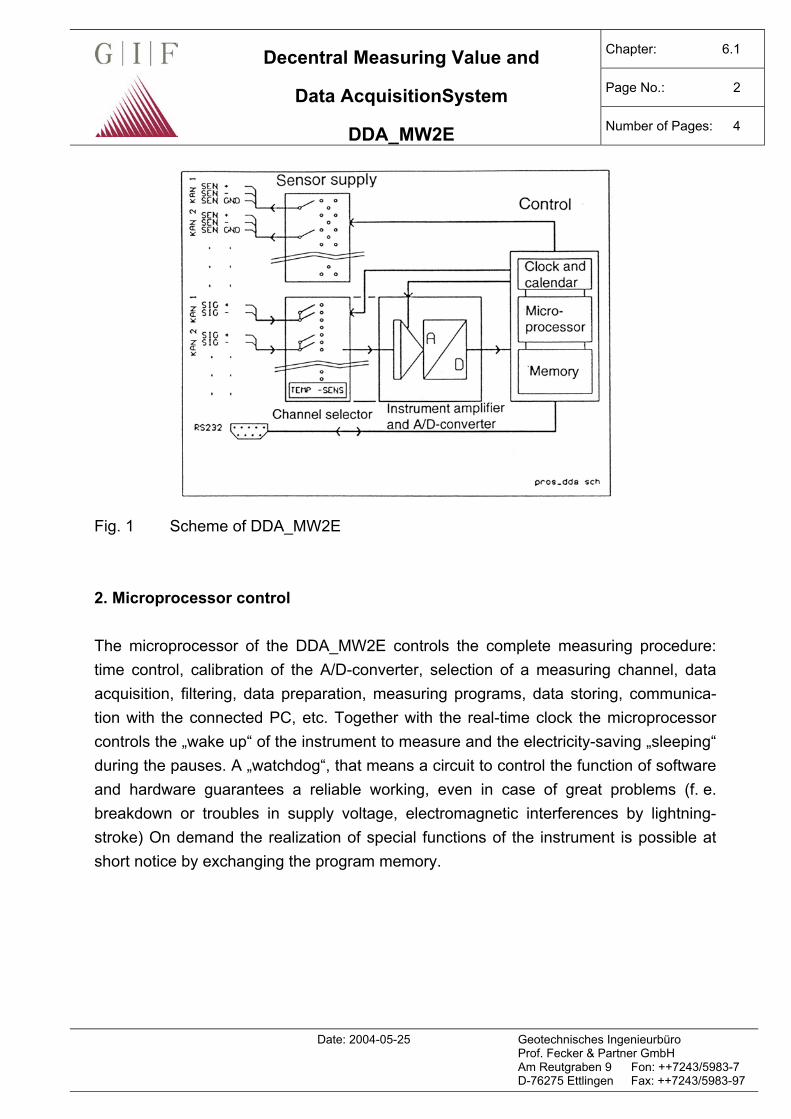
Fig. 1 Scheme of DDA_MW2E 2. Microprocessor control The microprocessor of the DDA_MW2E controls the complete measuring procedure: time control, calibration of the A/D-converter, selection of a measuring channel, data acquisition, filtering, data preparation, measuring programs, data storing, communica-tion with the connected PC, etc. Together with the real-time clock the microprocessor controls the „wake up“ of the instrument to measure and the electricity-saving „sleeping“ during the pauses. A „watchdog“, that means a circuit to control the function of software and hardware guarantees a reliable working, even in case of great problems (f. e. breakdown or troubles in supply voltage, electromagnetic interferences by lightning-stroke) On demand the realization of special functions of the instrument is possible at short notice by exchanging the program memory.
Prof. Fecker & Partner GmbH Am Reutgraben 9 Fon: ++7243/5983-7 D-76275 Ettlingen Fax: ++7243/5983-97
Decentral Measuring Value and Chapter: 6.1
Data AcquisitionSystem Page No.: 3
DDA_MW2E Number of Pages: 4
Date: 2004-05-25 Geotechnisches Ingenieurbüro
3. Terminal block with sensor supply All sensor connections are at a central printed circuit board. By a flat cable this printed circuit board is connected with the other two function blocks (A/D-converter and micro-processor control), which are in a separate housing. For each measuring channel a switchable sensor supply is available. The sensor supply is possibly necessary to supply active sensors with energy or to feed passive sensors (f. e. strain foil gauges) with reference current. Each measuring channel can be individually adjusted. The mi-croprocessor controls the sensor supply. Temperature sensor Normally the surrounding temperature is very important for data recordings. Therefore the standard instruments are equipped with a temperature sensor. When using the tem-perature sensor one measuring channel is occupied. Programs for PC Together with the instrument we deliver programs to adjust the parameters of the DDA_MW2E and to read-out measuring values. The data files prepared with these pro-grams can be imported without problems with all standard data bases and spread sheet calculations. The following example has been prepared with the spread sheet calcula-tion „Excel“ (Fig. 2).
Prof. Fecker & Partner GmbH Am Reutgraben 9 Fon: ++7243/5983-7 D-76275 Ettlingen Fax: ++7243/5983-97

Decentral Measuring Value and Chapter: 6.1
Data AcquisitionSystem Page No.: 4
DDA_MW2E Number of Pages: 4
Date: 2004-05-25 Geotechnisches Ingenieurbüro
Fig. 2 Example of a graphical evaluation with „Excel“
Prof. Fecker & Partner GmbH Am Reutgraben 9 Fon: ++7243/5983-7 D-76275 Ettlingen Fax: ++7243/5983-97

Software for Online Data Acquisition Chapter: 6.2
Program “MEDUSA” Page No.: 1
Number of Pages: 1
Date: 2004-05-26 Geotechnisches Ingenieurbüro
The program „MEDUSA“ is used to measure, to record, to visualise and to selectively store electric measuring values. The electric measuring values can be converted into each physical unit and if necessary linearised. The program can be adapted to different A/D-converter systems. The standard version runs with the DDA-board (see Chap-ter 6.1). The measuring data are stored in an ASCII-file. Program Design
The program is divided in projects, measuring points and tests. When setting up a pro-ject, a sub-directory for this project is always set up, too. Within a project measuring points can be set up (see scheme).On principle you can distinguish between measuring points where the data are put in by the keyboard (manual measuring points) and those where the data are electrically recorded (automatic measuring points). The maximum of measuring points is 20. When calling or storing a project all measuring points of the project are loaded or stored. Within a project the number of set up tests is only limited by the operating system.
The measuring data can be shown on the display (max. 14 measuring points). The data of two given measuring points can be visualised online („real time“) as well as offline in a X-Y graph. In addition it is possible to put out the data during the measurement on a printer or on a floppy. System Conditions
Necessary are: An IBM-compatible computer with a processor 8088 or higher, an operation system MSDOS 3.3 or higher, hard disk and a memory of 640 KB.
Prof. Fecker & Partner GmbH Am Reutgraben 9 Fon: ++7243/5983-7 D-76275 Ettlingen Fax: ++7243/5983-97
Chapter: 6.3
Temperature Logger Page No.: 1
Number of Pages: 1
Date: 2004-05-26 Geotechnisches Ingenieurbüro
The temperature logger is a small, battery-operated and computer-independent mini data logger. It can record the measured data of one temperature sensor which is placed together with the data logger in a protective housing. According to its configuration it records measured values totally autonomously at specified intervals.
The measurement is either finished after a fixed time, when the data memory is full, or - also possible - the old data are continuously superscribed. The measured data can be read out at any time by a laptop and can be graphically presented f. e. with Excel.
Technical Data
Memory: 8 kByte
in measured values: 7800
Measuring interval: 1 sec. - 10 days
Battery: about 3 years
Housing: IP 68, 35 mm rectangular
Service temperature: - 40 ° - + 75 ° C
Available temperature measuring ranges:
Range Measuring accuracy
- 10 to + 40 ° C ± 0.2 ° C
- 30 to + 30 ° C ± 0.2 ° C
- 40 to + 75 ° C ± 0.3 ° C
Prof. Fecker & Partner GmbH Am Reutgraben 9 Fon: ++7243/5983-7 D-76275 Ettlingen Fax: ++7243/5983-97

Data Logger Chapter: 6.4
Hydrolog Type SoLo Page No.: 1
Number of Pages: 2
Date: 2004-05-26 Geotechnisches Ingenieurbüro
The data logger Hydrolog is used for self-supporting logging of water levels in selectable intervals.
5
4
3
2
1
The data logger Hydrolog type SoLo is very well suited for measuring water levels in open gauges. It has an integrated electric pressure sensor and is suspended at the cable, that the data logger with sensor is under the water level. At the top of the gauge is only a plug to read out the recorded data. The data are read out via an interface cable by means of a notebook. Our delivery includes a simple read-out program for the operating systems DOS and Windows. The data are saved in ASCII form and can thus be transformed with each standard software (f. e. Excel). 6 The Hydrolog type SoLo is equipped with lithium batteries which have a useful life of more than five years in case of every hour measurements. This long useful life of the bat-teries enables a considerably reduced effort for maintenance.
Sketch: Typical application 1 Gauge tube cap 2 Plug 3 Suspending device 4 Measuring cable 5 Water level 6 Hydrolog type SoLo
Prof. Fecker & Partner GmbH Am Reutgraben 9 Fon: ++7243/5983-7 D-76275 Ettlingen Fax: ++7243/5983-97

Data Logger Chapter: 6.4
Hydrolog Type SoLo Page No.: 2
Number of Pages: 2
Date: 2004-05-26 Geotechnisches Ingenieurbüro
Technical Data Housing: Special steel V4A, diameter 27 mm
Length Sensor about 240 mm Data logger 196 mm Power supply: Lithium batteries Service life: about 5 years (in case of one sensor and every hour
measurement) Memory: 130.000 measuring values, corresponds to a capacity for
about 2.5 years (in case of one sensor and every hour measurement). Even in case of a voltage loss the data do not get lost.
System accuracy: typ. 0.25 % of measuring range at 1..5 mWs typ. 0.1 % of measuring range in case of higher pressure
ranges Available measuring 1.0 mWs; 1.6 mWs; 2.5 mWs; 4 mWs; 6 mWs; 10 mWs; ranges: 16 mWs, 25 mWs; 40 mWs; 60 mWs
(others on demand) Technical modifications reserved
Prof. Fecker & Partner GmbH Am Reutgraben 9 Fon: ++7243/5983-7 D-76275 Ettlingen Fax: ++7243/5983-97