deepschema: automatic schema acquisition from wearable
TRANSCRIPT

DeepSchema: Automatic Schema Acquisitionfrom Wearable Sensor Data in Restaurant Situations
Eun-Sol Kim, Kyoung-Woon On and Byoung-Tak ZhangDepartment of Computer Science and Engineering
Cognitive Robotics Artificial Intelligence Center (CRAIC)Seoul National University
Seoul 151-744, Korea
AbstractWe explore the possibility of automatically con-structing hierarchical schemas from low-level sen-sory data. Here we suggest a hierarchical eventnetwork to build the hierarchical schemas and de-scribe a novel machine learning method to learnthe network from the data. The traditional meth-ods for describing schemas define the primitivesand the relationships between them in advance.Therefore it is difficult to adapt the constructedschemas in new situations. However, the proposedmethod constructs the schemas automatically fromthe data. Therefore, it has a novelty that the con-structed schemas can be applied to new and un-expected situations flexibly. The key idea of con-structing the hierarchical schema is selecting infor-mative sensory data,integrating them sequentiallyand extracting high-level information. For the ex-periments, we collected sensory data using multiplewearable devices in restaurant situations. The ex-perimental results demonstrate the real hierarchicalschemas, which are probabilistic scripts and actionprimitives, constructed from the methods. Also, weshow the constructed schemas can be used to pre-dict the corresponding event to the low-level sensordata. Moreover, we show the prediction accuracyoutperforms the conventional method significantly.
1 IntroductionFrom the early years of artificial intelligence research, repre-senting human knowledge to make machines and agents un-derstand that knowledge has been a critical research topic.From weak problem-solving methods of Newell and Simonin 1950s [Newell et al., 1956; 1957], there have been vari-ous researches to find the regularity of the human knowledgeand to represent the knowledge structure in formal language.The main idea of these researches is to define primitives ofthe knowledge structure and relationships between them inadvance. As an illustrative example, we can think about theSCRIPT [Abelson and Schank, 1977]. The SCRIPT, which isdesigned by Schank et al. in 1977, is a structured represen-tation describing a stereotyped sequence of events in a par-ticular context. The primitives of the SCRIPT is conceptual
Figure 1: An example of the SCRIPT
dependency theory which models the semantic of natural lan-guage in formal language. The conceptual dependency theoryhas four primitives where the meaning of world is built fromand the conceptual dependency relationships between theseprimitives to describe the grammar of meaningful semanticrelationships. Based on the conceptual dependency theory,human knowledge about the restaurant situations can be de-scribed as in Figure 1. For the sake of the predefined struc-ture, conventional methods can reduce ambiguity and capturethe high-level knowledge structures, thus can infer richer in-terpretations. Nevertheless, as the primitives and the relation-ships between the primitives should be defined by a human inadvance, the conventional knowledge representation systemscould not avoid significant drawbacks. First, when facing anew situation and knowledge, it could not process the newknowledge as it was discordant with the existing structure.Second, it is hard to apply conventional systems to real situ-
Proceedings of the Twenty-Fifth International Joint Conference on Artificial Intelligence (IJCAI-16)
834
ations because the real situations could be more complicatedrather than expected.
To resolve these problems, we suggest a machine learn-ing method which automatically constructs the hierarchicalschema for restaurant situations from low-level sensory data.The hierarchical schema consists of a three-layer hierarchy:action primitives, events and probabilistic scripts. Actionprimitives combine the low-level sensory data which has mul-tiple streams. The event is a spatio-temporal combinationof the action primitives. Finally, the probabilistic script de-scribes a whole situation with the sequence of events.
To construct the hierarchical schema, a new machine learn-ing algorithm is suggested: Hierarchical event network.Above all, the network constructs the action primitives. Thekey idea of this step is to selectively integrate the informa-tive sensor streams. This idea is inspired by the sensory cueintegration mechanism of humans [Kording and Tenenbaum,2006; Trommershauser et al., 2011]. Following the mecha-nism, the human gives attention to specific sensory informa-tion and combines them. After obtaining the action primi-tives, the event is constructed with the spatio-temporal com-bination of the primitives. The probabilistic scripts are thesequence of the events.
For the experiments, we collected multi-modal sensorydata while having dinner at a restaurant. To obtain these sen-sory data, two kinds of wearable devices are used: one is aneye tracker which collects the first-person video and audiosignal. The other is a watch-type wearable sensor which col-lects the users electrodermal activity, blood volume pulse andmovement of wrist.
The experimental results mainly show three kinds of re-sults. First, we predict the corresponding event of the in-put sensor data using action primitives. Second, we showthe action primitives constructed from the real data. Lastly,a probabilistic script which is a framework representing theorganized patterns of human behavior in restaurant is newlysuggested.
The remainder of the paper is organized as follows. In thenext section, we describe the restaurant behavior dataset col-lected from wearable devices in restaurant situations. Then,the hierarchical event network model is suggested in section3. In the following section, three kinds of experimental re-sults are shown. Finally, in section 5, we conclude with adiscussion of future work and possible extensions.
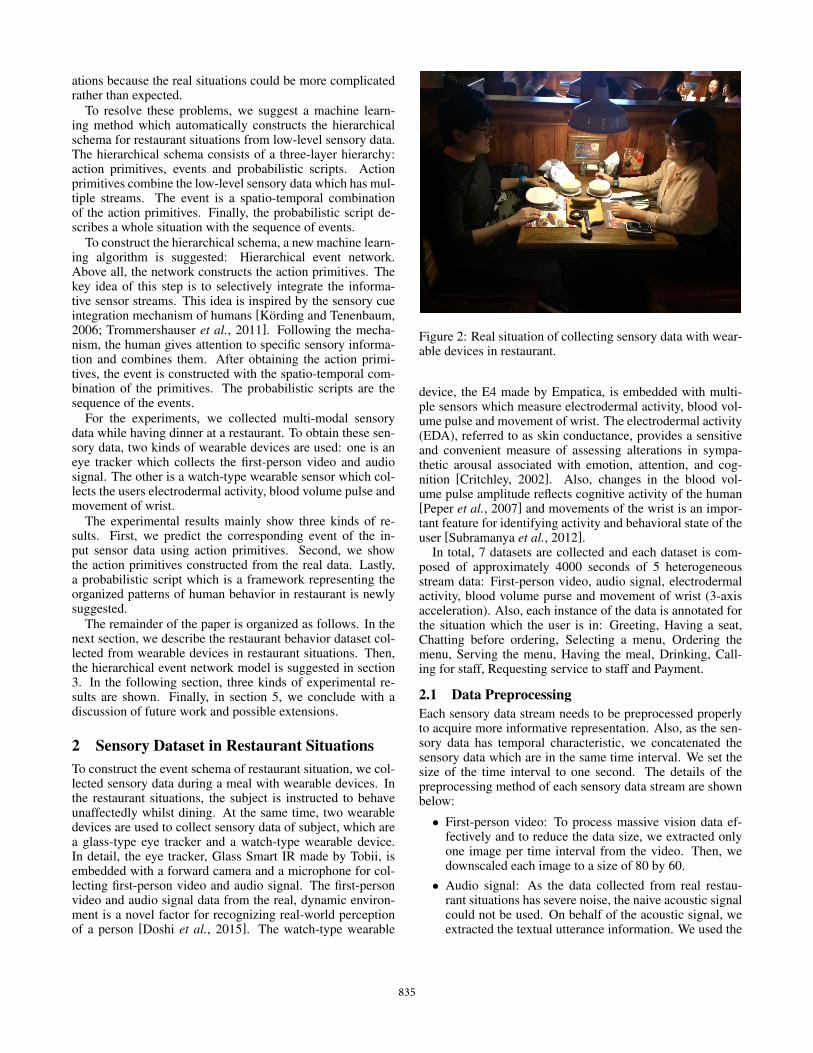
2 Sensory Dataset in Restaurant SituationsTo construct the event schema of restaurant situation, we col-lected sensory data during a meal with wearable devices. Inthe restaurant situations, the subject is instructed to behaveunaffectedly whilst dining. At the same time, two wearabledevices are used to collect sensory data of subject, which area glass-type eye tracker and a watch-type wearable device.In detail, the eye tracker, Glass Smart IR made by Tobii, isembedded with a forward camera and a microphone for col-lecting first-person video and audio signal. The first-personvideo and audio signal data from the real, dynamic environ-ment is a novel factor for recognizing real-world perceptionof a person [Doshi et al., 2015]. The watch-type wearable
Figure 2: Real situation of collecting sensory data with wear-able devices in restaurant.
device, the E4 made by Empatica, is embedded with multi-ple sensors which measure electrodermal activity, blood vol-ume pulse and movement of wrist. The electrodermal activity(EDA), referred to as skin conductance, provides a sensitiveand convenient measure of assessing alterations in sympa-thetic arousal associated with emotion, attention, and cog-nition [Critchley, 2002]. Also, changes in the blood vol-ume pulse amplitude reflects cognitive activity of the human[Peper et al., 2007] and movements of the wrist is an impor-tant feature for identifying activity and behavioral state of theuser [Subramanya et al., 2012].
In total, 7 datasets are collected and each dataset is com-posed of approximately 4000 seconds of 5 heterogeneousstream data: First-person video, audio signal, electrodermalactivity, blood volume purse and movement of wrist (3-axisacceleration). Also, each instance of the data is annotated forthe situation which the user is in: Greeting, Having a seat,Chatting before ordering, Selecting a menu, Ordering themenu, Serving the menu, Having the meal, Drinking, Call-ing for staff, Requesting service to staff and Payment.
2.1 Data PreprocessingEach sensory data stream needs to be preprocessed properlyto acquire more informative representation. Also, as the sen-sory data has temporal characteristic, we concatenated thesensory data which are in the same time interval. We set thesize of the time interval to one second. The details of thepreprocessing method of each sensory data stream are shownbelow:
• First-person video: To process massive vision data ef-fectively and to reduce the data size, we extracted onlyone image per time interval from the video. Then, wedownscaled each image to a size of 80 by 60.
• Audio signal: As the data collected from real restau-rant situations has severe noise, the naive acoustic signalcould not be used. On behalf of the acoustic signal, weextracted the textual utterance information. We used the
835

Figure 3: Explanation about the sensory data in detail. Twowearable devices, which are an eye tracker and a watch-typedevice, are used for collecting sensory data. From the twodevices, five kinds of sensory data are collected. The featuresextracted from each sensory data as preprocessing and theexmaple of data are described.
annotated text as the input of the audio modality and alsoused the time information of the start and end of eachutterance. So each 1 second window contains utterancesproduced in that time interval. Next, the Bag-of-words(BoW) model was used for feature extraction of the ut-terances and the 4924 dimensions of BoW vectors wereacquired.Even though the annotation work is tiresome, we ex-pect this step could be replaced by denoising and speechrecognition techniques.
• 3-axis acceleration: Because of the robustness of fre-quency domain features of the accelerometer measure-ment [Dargie, 2009], we used the short time fouriertransform (STFT), which is computed by dividing thesensor measurements into several overlapping windowsand applying fourier transform to each windows. Thesquared length of acceleration vector is used to STFTand to maximize the frequency resolution, we carriedout frequency normalization using a hamming window.The final extracted feature vector is a 129 dimensionsmagnitude vector of normalized coefficient of STFT.
• Electrodermal activity: The key information of the elec-trodermal activity is a fast increasing step, which is af-fected by emotional impact [Fleureau et al., 2013]. So,we first normalized the amplitude of the EDA by di-viding all values by the maximum amplitude, obtainedthe first derivative of the normalized EDA, then deter-mined where the slope has positive value. Using this,we counted the positive values in the window and alsocomputed the mean, standard deviation and median of
the normalized EDA amplitude.[Sano and Picard, 2013]
• Blood volume pulse: As we described above, changes ofthe amplitude of the blood volume pulse is the meaning-ful value for representation. Also, it could be a conve-nient measure of hear rate variability, which is a largepart of heart rate analysis. To acquire a more infor-mative representation, we calculated the average, max-imum, minimum and standard deviation values of nor-malized amplitudes of Blood volume pulse in windowand also obtained frequency domain with STFT to implythe property of heart rate variability. The final extractedfeature vector is an 133 dimensions vector composed ofthe average, maximum, minimum, standard deviation ofthe amplitudes and magnitudes of the normalized coef-ficients of STFT.
3 Model: Hierarchical Event NetworkIn this section, we describe the hierarchical event networkwhich construct hierarchical schemas.
The hierarchical event network has a three-layer structure,which consists of the multi-modal sensory data (input), actionunits, and event. The lowest layer represents the five kinds ofsensory data of each time step (a second) as described in theprevious section. In the above layer, the multi-modal sen-sory data streams are integrated into action units. Finally, inthe highest layer, the spatio-temporal combination of actionsunits forms an event. The overall architecture of the model isdescribed in Figure 4.
3.1 Lower Layer: Extracting the Action UnitsAs the sensory data is from the real environment, it couldcontain unexpected noise and to get more abstract infor-mation from low-level sensor data, we extracted charac-teristic feature vectors of each modality respectively. Todo this, one more layer, which has an RBM structure, isadded to the input (the sensory data). From the single layerRBMs, each feature vectors are learned to represent the ab-stract information of the data [Freund and Haussler, 1994;Hinton, 2010].
Let us define the five kinds of low-level sensory data, whichare the first-person video signal, auditorial signal, accelerom-eter signal, electrodermal signal and blood volume pulse sig-nal in a time step, as V, T, A, E and B respectively. Eachdimension of the sensory data is nv , nt, na, ne and nb respec-tively.
After learning the single layer RBMs, we can obtain theabstracted feature vectors of the low-level sensor data. Wedefine the abstracted vectors as xv , xt, xa, xe and xb.
The main idea of integrating the feature vectors to get theaction units is selecting a small number of feature vectors ac-cording to the correlation. After selecting essential modali-ties, only the selected feature vectors are integrated into ac-tion units.
This idea is inspired by the sensory cue integration frame-work [Kording and Tenenbaum, 2006; Trommershauser etal., 2011]. Sensory cue integration framework mimics theway humans perceives multi-modal sensory signals and inte-grates the signal selectively. This approach has the advantage
836

Figure 4: Overall architecture of the hierarchical event network.
of not only reducing computational complexity, but ignor-ing unrelated sensory signal or noisy signal. The suggestedmodel in this paper applies the idea of selecting small num-ber of modalities and integrating only those data by imposingswitch units between input layer and action unit layers.
Each feature vector is connected to a switch which deter-mines whether the vector would be combined to construct anaction unit or not. If the vector is determined to be combined,the switch values for the units would be (almost) 1. Thenthe selected feature vectors are linearly summed according tothe weight values. There are two groups of parameters of themodel. One is the parameters for the switches which are theweight values wsw,m and the bias bsw,m determining the ac-tivation of the switch. The other one is weight values w
km
for combining the selected feature vectors and the bias bkm forthis.
3.2 Upper Layer: Sequential IntegrationThe upper layer, the action units are temporally combined toform an event. To resolve this, we simply adopt a new weightmatrix w
out
which combines action units in time interval tw.
3.3 Learning MethodsEven though there are many notations for describing themodel, the main idea is quite simple. The feature vectors areselectively combined by the values of the switch connectedto the vectors. At this point, the switch values are determinedby the overall combinations of the feature vectors X. (Thatmeans, a X is a concatenated vector of the feature vectors,xv , xt, xa, xe and xh.) After determining the switch values,a small number of the feature vectors xm are selected andcombined by corresponding weight values wm.
To make the explanation clear, here, we describe the learn-ing rule of the lower layer.
The objective function of the learning is reducing the crossentropy between the output of the model and the label. As thesensory data is annotated with event class labels, the outputof the model can be compared with the event label.
Let us define the output of the models as y, and the labelas t. As the number of labels are 11, y and t are designed as11-dimensional binary vectors.
The output value of the k-th element of y of n-th datumyn,k is defined by Equation 1. In this equation, sm is a switchof the action unit m, wk
m is a weight vector connecting theaction unit xm to yk and bkm is a bias term. Also, sm is deter-mined by Equation 2 and um is a weight vector connectingoverall combinations of the action values X and switch sm.And am is a bias term.
yn,k = �
MX
m=1
sm(wkm)>xn
m + bkm
!(1)
sm = ��(um)>X+ am
�(2)
With these definitions, the cross entropy between the outputof the model and the label are defined as (Eqation 3).
lnE = �NX
n=1
KX
k=1
{tn,klnyn,k + (1� tn,k)ln(1� yn,k)}
(3)Using Chain rule, the gradient for parameters, wk
m, um, bkmand am, can be calculated as below.@lnE
@wkm
=@lnE
@yn,k
@yn,k@wk
m
=
✓� tn,kyn,k
+1� tn,k1� yn,k
◆(yn,k(1� yn,k)smx
nm)
= (�tn,k(1� yn,k) + (1� tn,k)yn,k) smx
nm
= (yn,k � tn,k)smx
nm
(4)
@lnE
@um=
@lnE
@yn,k
@yn,k@sm
@sm@um
= (yn,k � tn,k)sm(1� sm)XKX
k=1
(wkm)>xn
m
(5)
837
@lnE
@bkm=
@lnE
@yn,k
@yn,k@bkm
= (yn,k � tn,k)
(6)
@lnE
@am=
@lnE
@yn,k
@yn,k@sm
@sm@am
= (yn,k � tn,k)sm(1� sm)KX
k=1
(wkm)>xn
m
(7)
Using these gradients, the parameters w
km, um, bkm and am
are updated as follow.
w
km w
km � � · @lnE
@wkm
(8)
um um � � · @lnE@um
(9)
bkm bkm � � · @lnE@bkm
(10)
am am � � · @lnE@am
(11)
4 Experimental ResultsIn this section, we show three kinds of experimental results.First of all, the constructed event schemas are used to pre-dict the corresponding events. From the prediction accuracy,the usefulness of the high-level knowledge representation, i.e.event schemas, is verified. For the second experiments, therepresentative event schemas of each event class are shown.Lastly, a probabilistic script which is a framework represent-ing the organized patterns of human behavior in restaurant isnewly suggested.
The suggested model is implemented with Theano frame-work [Bastien et al., 2012].
4.1 Event Prediction with SchemasFirst, we tried to verify whether the schemas have discrimina-tive power to classify the corresponding event. After learningthe hierarchical event network with separated training data,the corresponding events of the test data are predicted withthe output value of the network.
It is important to emphasize that all of the experiments weconducted were based on real data collected in actual restau-rant situations. In addition, all of the prediction accuracieswe presented are results from the test data set which was notused in the training phase. Due to the huge size of the data set,we did not used cross validation but instead randomly dividedand assigned the data set into training or test set.
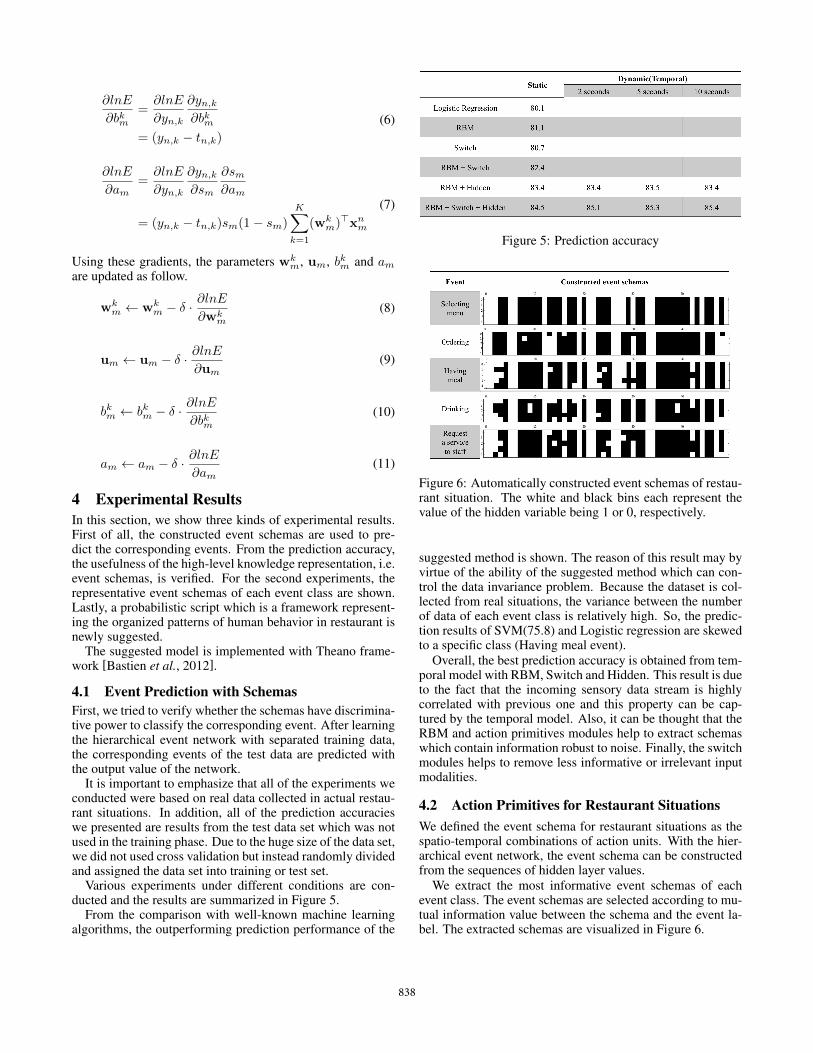
Various experiments under different conditions are con-ducted and the results are summarized in Figure 5.
From the comparison with well-known machine learningalgorithms, the outperforming prediction performance of the
Figure 5: Prediction accuracy
Figure 6: Automatically constructed event schemas of restau-rant situation. The white and black bins each represent thevalue of the hidden variable being 1 or 0, respectively.
suggested method is shown. The reason of this result may byvirtue of the ability of the suggested method which can con-trol the data invariance problem. Because the dataset is col-lected from real situations, the variance between the numberof data of each event class is relatively high. So, the predic-tion results of SVM(75.8) and Logistic regression are skewedto a specific class (Having meal event).
Overall, the best prediction accuracy is obtained from tem-poral model with RBM, Switch and Hidden. This result is dueto the fact that the incoming sensory data stream is highlycorrelated with previous one and this property can be cap-tured by the temporal model. Also, it can be thought that theRBM and action primitives modules help to extract schemaswhich contain information robust to noise. Finally, the switchmodules helps to remove less informative or irrelevant inputmodalities.
4.2 Action Primitives for Restaurant SituationsWe defined the event schema for restaurant situations as thespatio-temporal combinations of action units. With the hier-archical event network, the event schema can be constructedfrom the sequences of hidden layer values.
We extract the most informative event schemas of eachevent class. The event schemas are selected according to mu-tual information value between the schema and the event la-bel. The extracted schemas are visualized in Figure 6.
838

Figure 7: An example of the probabilistic script constructed from the hierarchical event network automatically.
As the network takes five different signals as input andonly a small number of signals among the five are selectedby switch values, useful features change over time or eventtypes. For example, in Figure 6, hand movement featuresare more useful for Having meal, Request a service to staffclasses. And visual features are useful for most of the eventtypes.
4.3 Probabilistic Scripts for Restaurant SituationsAs a rediscovery of the traditional artificial intelligence, anew SCRIPT is defined using the hierarchical event network.
Event sequences of restaurant situations can be generatedusing the output of the hierarchical event network as the low-level sensory data stream comes in. From these generatedevent sequences, the state transition diagram can be con-structed (Fig 7). This diagram represents the organized pat-tern of the human behavior in restaurant situations. We de-fined this diagram as a probabilistic script.
There is a thread of connections between the flows of theprobabilistic script and the traditional SCRIPTs (Fig 1). Fromboth of the scripts, we can see the general patterns which of-ten occur in real restaurant situation. Interestingly, we can no-tice that the probabilistic scripts are automatically constructedfrom data. Also, compared with the SCRIPT, the proposedmethod can generate various SCRIPT based on the currentsensor data of the user.
5 ConclusionWe have presented a DeepSchema which consists of threekinds of schemas.
As the primitives, we extracted action primitives from thesensor data. Then, we temporally combined the action prim-itives to form the event. Finally, as the highest-level schema,the probabilistic scripts are shown and compared with the tra-ditional knowledge representation algorithm, SCRIPTs.
The main contribution of this paper is that the hierarchicalschemas, i.e. DeepSchema, are acquired automatically using
the hierarchical event network model. As the schemas areconstructed automatically from data, there is novelty that theschemas can be easily applied to a new situation or data.
Furthermore, there is an interesting point that the resultfrom the suggested method, which uses recent machine learn-ing algorithms, is analogous to traditional methods.
By taking the advantages of the suggested methods, we areconsidering to construct the event schemas for other situa-tions with the same model. We expect that these schemas canhelp to understand the human behavior, in context with thesituations.
AcknowledgmentsThe authors thank Jiseob Kim for insightful comments anddiscussion. This work was partly supported by the Institutefor Information & Communications Technology Promotion(R0126-16-1072-SW.StarLab) and Korea Evaluation Instituteof Industrial Technology (10044009-HRI.MESSI, 10060086-RISF) grant funded by the Korea government (MSIP).
References[Abelson and Schank, 1977] Robert Abelson and Roger C
Schank. Scripts, plans, goals and understanding. An in-quiry into human knowledge structures New Jersey, 10,1977.
[Bastien et al., 2012] Frederic Bastien, Pascal Lamblin, Raz-van Pascanu, James Bergstra, Ian J. Goodfellow, ArnaudBergeron, Nicolas Bouchard, and Yoshua Bengio. Theano:new features and speed improvements. Deep Learningand Unsupervised Feature Learning NIPS 2012 Workshop,2012.
[Critchley, 2002] Hugo D Critchley. Book review: electro-dermal responses: what happens in the brain. The Neuro-scientist, 8(2):132–142, 2002.
839
[Dargie, 2009] Waltenegus Dargie. Analysis of time and fre-quency domain features of accelerometer measurements.In Computer Communications and Networks, 2009. IC-CCN 2009. Proceedings of 18th Internatonal Conferenceon, pages 1–6. IEEE, 2009.
[Doshi et al., 2015] Jigar Doshi, Zsolt Kira, and Alan Wag-ner. From deep learning to episodic memories: Creatingcategories of visual experiences. In Proceedings of theThird Annual Conference on Advances in Cognitive Sys-tems ACS, page 15, 2015.
[Fleureau et al., 2013] Julien Fleureau, Philippe Guillotel,and Izabela Orlac. Affective benchmarking of moviesbased on the physiological responses of a real audience.In Affective Computing and Intelligent Interaction (ACII),2013 Humaine Association Conference on, pages 73–78.IEEE, 2013.
[Freund and Haussler, 1994] Yoav Freund and David Haus-sler. Unsupervised learning of distributions of binary vec-tors using two layer networks. Computer Research Labo-ratory [University of California, Santa Cruz], 1994.
[Hinton, 2010] Geoffrey Hinton. A practical guide to train-ing restricted boltzmann machines. Momentum, 9(1):926,2010.
[Kording and Tenenbaum, 2006] Konrad P Kording andJoshua B Tenenbaum. Causal inference in sensorimotorintegration. In Advances in neural information processingsystems, pages 737–744, 2006.
[Newell et al., 1956] Allen Newell, Herbert Simon, et al.The logic theory machine–a complex information process-ing system. Information Theory, IRE Transactions on,2(3):61–79, 1956.
[Newell et al., 1957] Allen Newell, John Clark Shaw, andHerbert Alexander Simon. Empirical explorations of thelogic theory machine: a case study in heuristic. In Paperspresented at the February 26-28, 1957, western joint com-puter conference: Techniques for reliability, pages 218–230. ACM, 1957.
[Peper et al., 2007] Erik Peper, Rick Harvey, I-Mei Lin,Hana Tylova, and Donald Moss. Is there more to bloodvolume pulse than heart rate variability, respiratory sinusarrhythmia, and cardiorespiratory synchrony? Biofeed-back, 35(2), 2007.
[Sano and Picard, 2013] Akane Sano and Rosalind W Pi-card. Recognition of sleep dependent memory consol-idation with multi-modal sensor data. In Body SensorNetworks (BSN), 2013 IEEE International Conference on,pages 1–4. IEEE, 2013.
[Subramanya et al., 2012] Amarnag Subramanya, Alvin Raj,Jeff A Bilmes, and Dieter Fox. Recognizing activitiesand spatial context using wearable sensors. arXiv preprintarXiv:1206.6869, 2012.
[Trommershauser et al., 2011] Julia Trommershauser, Kon-rad Kording, and Michael S Landy. Sensory cue integra-tion. Oxford University Press, USA, 2011.
840