automatic anatomical segmentation of the liver by
TRANSCRIPT

HAL Id: hal-01694978https://hal.univ-reims.fr/hal-01694978
Submitted on 26 Feb 2018
HAL is a multi-disciplinary open accessarchive for the deposit and dissemination of sci-entific research documents, whether they are pub-lished or not. The documents may come fromteaching and research institutions in France orabroad, or from public or private research centers.
L’archive ouverte pluridisciplinaire HAL, estdestinée au dépôt et à la diffusion de documentsscientifiques de niveau recherche, publiés ou non,émanant des établissements d’enseignement et derecherche français ou étrangers, des laboratoirespublics ou privés.
Automatic anatomical segmentation of the liver byseparation planes
Dobrina Boltcheva, Nicolas Passat, Vincent Agnus, Marie-Andrée Jacob-daCol, Christian Ronse, Luc Soler
To cite this version:Dobrina Boltcheva, Nicolas Passat, Vincent Agnus, Marie-Andrée Jacob-da Col, Christian Ronse, etal.. Automatic anatomical segmentation of the liver by separation planes. Medical Imaging, 2006,San Diego, CA, United States. pp.298-309, �10.1117/12.649747�. �hal-01694978�

Automatic anatomical segmentation of the
liver by separation planes
D. Boltcheva a,b,∗, N. Passat b,c,V. Agnus a, M.-A. Jacob-Da Col b, C. Ronse b, L. Soler a
aIRCAD, Virtuals, 1 place de l’Hopital, 67091 Strasbourg, France
bLSIIT, UMR 7005 CNRS-ULP, Strasbourg I University, France
cIPB, UMR 7004 CNRS-ULP, Strasbourg I University, France
Abstract
Surgical planning in oncological liver surgery is based on the location of the liversegments and tumours inside these structures. The detection of the boundaries be-tween the segments is then the first step of the preoperative planning. The proposedmethod, devoted to binary images of livers segmented from CT-scans, has been de-signed to delineate these segments. It automatically detects a set of landmarks usinga priori anatomical knowledge and differential geometry criteria. These landmarksare then used to position planes delineating the 8 liver anatomical segments accord-ing to Couinaud’s definition. The results of validations on 7 clinical cases tend toprove that the method is reliable for most of these separation planes.
Key words: computer assisted surgery, delineation planes, landmark detection,discrete differential geometry, operation planning.
1 Introduction
In the field of liver surgery, 3D visualization of the anatomical liver segmentsand their relationship to tumours are of major interest for the preoperativeplanning. For patients suffering from a malignant liver disease, tumour resec-tion provides the best survival rate. To carry out this resection, surgeons usetwo operative methods: tumorectomy and segmentectomy. Tumorectomy isonly used for so called peripheral tumours (located less than 5 mm away from
∗ Corresponding author.Email address: [email protected] (D. Boltcheva).
Preprint submitted to Elsevier Science 16 December 2004
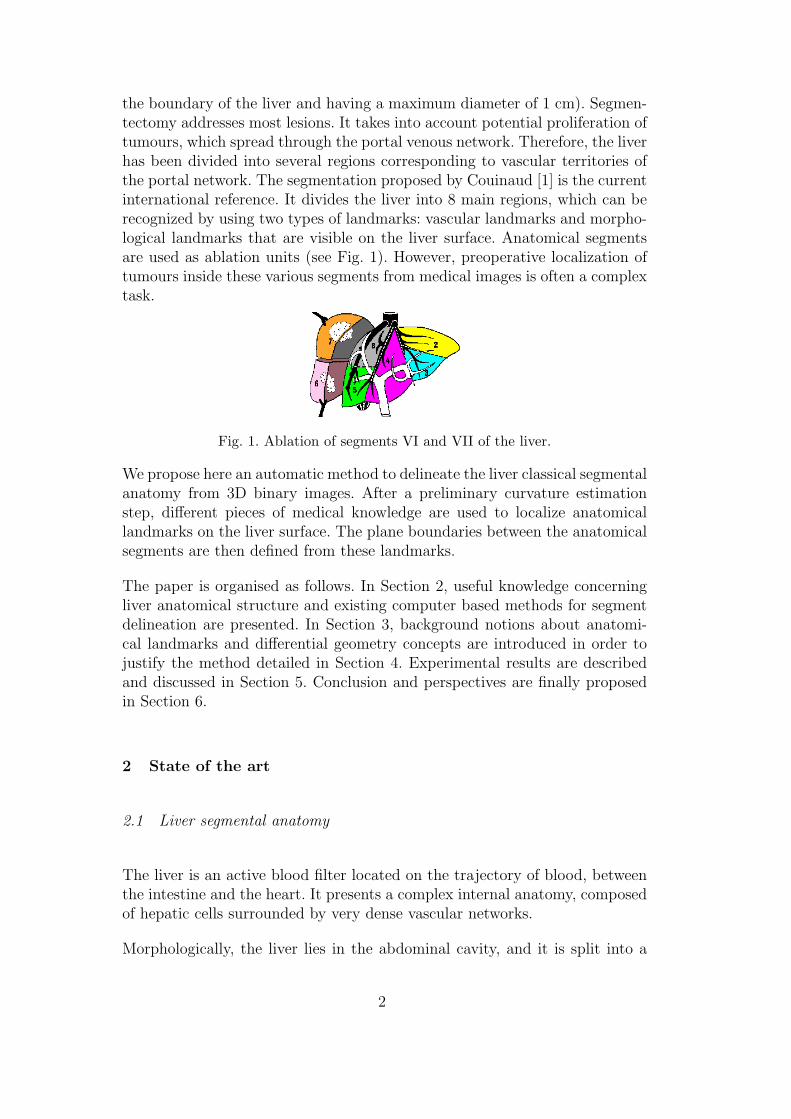
the boundary of the liver and having a maximum diameter of 1 cm). Segmen-tectomy addresses most lesions. It takes into account potential proliferation oftumours, which spread through the portal venous network. Therefore, the liverhas been divided into several regions corresponding to vascular territories ofthe portal network. The segmentation proposed by Couinaud [1] is the currentinternational reference. It divides the liver into 8 main regions, which can berecognized by using two types of landmarks: vascular landmarks and morpho-logical landmarks that are visible on the liver surface. Anatomical segmentsare used as ablation units (see Fig. 1). However, preoperative localization oftumours inside these various segments from medical images is often a complextask.
Fig. 1. Ablation of segments VI and VII of the liver.
We propose here an automatic method to delineate the liver classical segmentalanatomy from 3D binary images. After a preliminary curvature estimationstep, different pieces of medical knowledge are used to localize anatomicallandmarks on the liver surface. The plane boundaries between the anatomicalsegments are then defined from these landmarks.
The paper is organised as follows. In Section 2, useful knowledge concerningliver anatomical structure and existing computer based methods for segmentdelineation are presented. In Section 3, background notions about anatomi-cal landmarks and differential geometry concepts are introduced in order tojustify the method detailed in Section 4. Experimental results are describedand discussed in Section 5. Conclusion and perspectives are finally proposedin Section 6.
2 State of the art
2.1 Liver segmental anatomy
The liver is an active blood filter located on the trajectory of blood, betweenthe intestine and the heart. It presents a complex internal anatomy, composedof hepatic cells surrounded by very dense vascular networks.
Morphologically, the liver lies in the abdominal cavity, and it is split into a
2
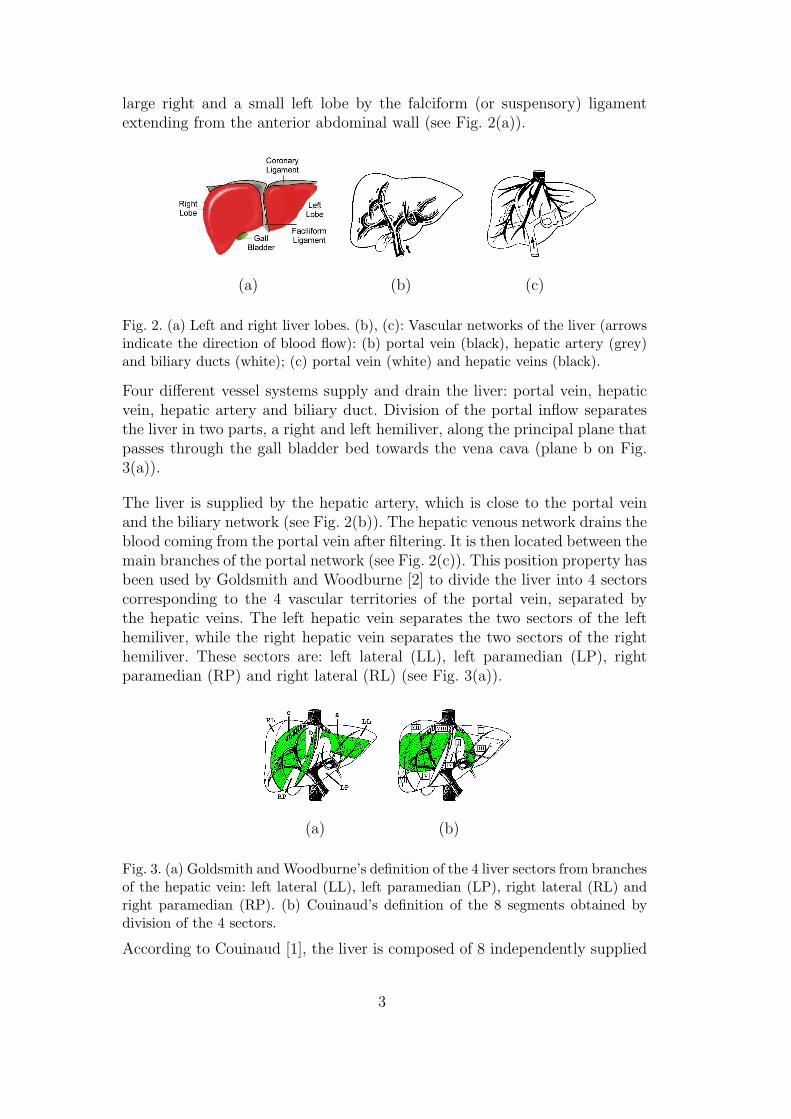
large right and a small left lobe by the falciform (or suspensory) ligamentextending from the anterior abdominal wall (see Fig. 2(a)).
(a) (b) (c)
Fig. 2. (a) Left and right liver lobes. (b), (c): Vascular networks of the liver (arrowsindicate the direction of blood flow): (b) portal vein (black), hepatic artery (grey)and biliary ducts (white); (c) portal vein (white) and hepatic veins (black).
Four different vessel systems supply and drain the liver: portal vein, hepaticvein, hepatic artery and biliary duct. Division of the portal inflow separatesthe liver in two parts, a right and left hemiliver, along the principal plane thatpasses through the gall bladder bed towards the vena cava (plane b on Fig.3(a)).
The liver is supplied by the hepatic artery, which is close to the portal veinand the biliary network (see Fig. 2(b)). The hepatic venous network drains theblood coming from the portal vein after filtering. It is then located between themain branches of the portal network (see Fig. 2(c)). This position property hasbeen used by Goldsmith and Woodburne [2] to divide the liver into 4 sectorscorresponding to the 4 vascular territories of the portal vein, separated bythe hepatic veins. The left hepatic vein separates the two sectors of the lefthemiliver, while the right hepatic vein separates the two sectors of the righthemiliver. These sectors are: left lateral (LL), left paramedian (LP), rightparamedian (RP) and right lateral (RL) (see Fig. 3(a)).
(a) (b)
Fig. 3. (a) Goldsmith and Woodburne’s definition of the 4 liver sectors from branchesof the hepatic vein: left lateral (LL), left paramedian (LP), right lateral (RL) andright paramedian (RP). (b) Couinaud’s definition of the 8 segments obtained bydivision of the 4 sectors.
According to Couinaud [1], the liver is composed of 8 independently supplied
3

segments, representing the dispersion of the portal vein branches inside the4 sectors (see Fig. 3(b)). Sectors of the right hemiliver are transversally splitinto segments by a plane passing through the axis of the portal vein rightbranch. The RP sector is subdivided into segment V (inferior) and segmentVIII (superior) and the RL sector is subdivided into segment VI (inferior) andsegment VII (superior). The LP sector is divided into two segments, III andIV, by a vertical plane that passes through the trace of the falciform ligamenton the inferior border (or the umbilical fissure) towards the vena cava. TheLL sector is the only one containing one segment, segment II. The spigelianlobe is a distinct anatomical segment and is labelled segment I. It receivesbranches of the portal network from the right and the left liver and drainsindependently into the vena cava.
It has to be noticed that the radiological delineation procedures are essentiallybased on the concept of three vertical planes that divide the liver into fourmain regions and of a transverse scissura that further subdivides the segmentsinto two subsegments each (see Fig. 4). Moreover according to the previousdefinitions, most separation planes can be defined using external landmarks.These landmarks (vena cava, gall bladder bed, umbilical fissure or trace ofthe suspensory ligament on the inferior liver border) are generally used bysurgeons to define segments before carrying out a surgical intervention.
Fig. 4. Liver segments, according to Couinaud. Left: anterior view. Right: posteriorview.
2.2 Computer aided methods for segment delineation
Several works have dealt with the development of software tools allowing todelineate the anatomical segments of the liver.
Two different approaches have been proposed. The first one consists in posi-tioning planes that separate segments. To the best of our knowledge, there doesnot exist fully automated method enabling to place these planes since land-marks localization is a difficult task. Meinzer et al. [3] improve the computer-based preoperative planning system developed in Heidelberg [4] and proposea module for manual positioning of 10 landmarks on specific regions of theliver, such as the hepatic vein trunk (vena cava) and the main branches ofthe portal vein. These landmarks are then used to compute 3 vertical planes
4

and 4 horizontal triangles. After positioning, the planes are manually adjustedin order to correctly fit the patient’s 3D model. Osorio et al. [5] propose tomanually place 8 landmarks on the scanner of the patient. These landmarksare localized on the left, right and median hepatic veins, on the inferior venacava, on the bifurcation of the right portal vein, and at the boundary of theleft liver. Boundaries between segments are then computed, and the varioussegments are identified and named.
The second approach proposes to compute vascular territories using the func-tional definition of the liver segments. It consists in labelling the portal veinbranches and computing their influence regions. Meinzer et al. [3] also proposea module based on this strategy. However the labelling of branches remainsinteractive. Selle et al. [6,7] have developed a similar approach including auto-mated labelling, taking bifurcation angles and vessel size into account. Never-theless this labelling is not totally correlated with the conventional anatomicaldefinition. Thus the resulting segments (and for instance the segment I) do notmatch the ones in anatomical atlases. Furthermore, the method only takes intoaccount the bifurcations of the venous network, and does not use the globalliver volumetry, which can induce errors that have to be manually corrected.
To meet both limitations, Soler et al. [8,9] propose to take global volumetryinto account for labelling, and to confront an anatomical atlas of liver segmentswith the segments that have been computed. During the segmentation and thelabelling step the method generates more segments than the reference atlas.These segments are then merged during the confrontation step which allowsan automatic correction. However, the confrontation can fail if the 3D modelof the patient is too different from the atlas. Moreover the method does notuse characteristic landmarks on the liver surface, which would enable to avoidthe correlation errors.
We finally point out that all these methods use the liver venous network, andcould thus fail if vein branches are not visible on the processed images. Forinstance if the images is acquired at the portal time, only the major branchesof the portal vein can be extracted from the 3D enhanced helical CT-scans.
The method proposed in this paper consists in automating the plane place-ment method of Meinzer et al. and could also be used as a complement tothe method of Soler et al. to take the patient’s anatomy into account. More-over, the automation is allowed by using surface mean curvature analysis forlandmark localization.
5

3 Background
This section presents the anatomical and theoretical background necessary tounderstand and justify the method described hereafter.
3.1 Definition of anatomical landmarks
The proposed method is based on the detection of six anatomical landmarksessentially located on the liver surface, and on the construction of five delin-eation planes between the liver segments. These landmarks, illustrated in Fig.5 are defined as follows:
• A: superior part of the hepatic vena cava;• B: inferior part of the hepatic vena cava;• C: bed of the gall bladder;• D: trace of the suspensory ligament;• E: middle of the left lobe curve;• F: centre of mass of the right liver.
Fig. 5. Points used as landmarks (vena cava in white and liver in grey).
These points are chosen so that the anatomical definition of the followingsegments can be found.
• The AB axis represents the vena cava axis, while the point C is located onthe gall bladder bed. Thus, the ABC plane splits the liver into left and righthemilivers.
• The point D is located on the inferior liver border and represents the passageof the suspensory ligament. Therefore, the ABD plane splits the liver intoleft and right liver lobes according to the morphological definition. Moreover,this plane delineates the segment IV inside the left hemiliver.
• The point E is located on the left liver lobe border and is used to dividethe left hemiliver into sectors (LP and LL) according to the Goldsmith and
6

Woodburne’s definition. This enables the delineation of segment II fromsegment III inside the left hemiliver.
• The point F represents the centre of mass of the right hemiliver. This pointis used to define two delineating planes. The first one passes through thispoint towards the vena cava axis and corresponds to the separation betweenthe RP and the RL sectors, while the second one is located at the level ofthe right branch of the portal vein and transversally splits the sectors intoupper (VII and VIII) and lower (V and VI) segments.
In order to detect these landmarks, the proposed strategy is based on dif-ferential geometry criteria (mean surfacic curvature and 2D curvature of theliver).
3.2 Curvature computation
The mean surfacic curvature provides a characterization of the convexity orthe concavity of a shape. In [10], Bullard et al. propose a method to assess, ineach voxel of the surface of a discrete object, the value of its mean curvature.This method consists in computing the ratio of voxels belonging to the objectwithin the neighbourhood of each voxel of its surface. The justification of themethod lies in the fact that there exists an affine relation between the meancurvature of a point of the surface and the volume located inside the surfaceof a spherical sampling element centred in this point (see Fig. 6):
H ≈4V
πb4−
8
3b, (1)
where H is the mean curvature, b is the radius of the spherical neighbourhoodof the point and V the volume of the neighbourhood located inside the surface.
V
b
Fig. 6. Volume of the neighbourhood of a point of a surface located inside the latter.This volume (V ) is represented in grey. The radius of the spherical neighbourhoodis denoted by b.
Fig. 7 illustrates the result of this approach applied on a binary liver image:dark areas are convex regions (i.e. negative mean curvature regions), while
7

(a) (b)
Fig. 7. Example of results obtained after applying the mean curvature estimationmethod on a discretized liver. (a) View of the inferior side. (b) View of the posteriorside of the liver.
light areas correspond to concave regions (i.e. positive mean curvature re-gions). It has been experimentally observed that sampling elements with 3 cmradius provide satisfactory curvature estimations.
(a) (b) (c)
Fig. 8. Results of 2D curvature estimation. (a) Frontal view of the curvature obtainedwith the axial disk. The top and the bottom regions can be detected. (b) Top viewof the curvature obtained with the coronal disk. The most convex region on theposterior liver border can be detected. (c) Frontal view of the curvature obtainedwith the sagittal disk. The left lobe and the right extremity can be localized.
However, the mean surfacic curvature information, computed with a sphericalsampling element, can be insufficient to detect landmarks, since it only pro-vides the overall shape of the liver surface. In order to obtain supplementarycurvature information, a solution can consist in applying a similar method for2D curvature estimation of curves obtained by intersecting the liver surfaceand each one of the three orthotropic planes (Oyz, Oxy and Oxz planes re-spectively represent the sagittal, axial and coronal planes). In this case, theconsidered sampling element is no longer a sphere but a disk. These new sam-pling elements allow a fast detection of some particular regions on the liversurface, such as the left lobe and the borders, thanks to their shape and specificlocalization (see Fig. 8).
The method used to successively position the landmarks and the separationplanes is detailed in the following section.
8

4 Segment computation method
4.1 Input and output
The method takes as input two isotropic binary images containing respectivelythe liver and the hepatic vein (which have to be correctly superimposed) and2D and 3D liver curvature images computed with the previously describedmethod. It provides as output a labelled image of the liver, each label corre-sponding to a segment according to the Couinaud’s definition.
4.2 ABC plane: separation of left and right hemiliver
To divide the left hemiliver from the right hemiliver during a surgical inter-vention, surgeons use a vertical plane located in the axis of the trunk of thevena cava and passing through the bed of the gall bladder. The left hemiliveris composed of segments II, III and IV, whereas the right hemiliver containssegments V, VI, VII and VIII.
(a) (b) (c)
Fig. 9. (a) Hepatic vein. (b) Trunk of the vena cava. (c) Inferior view of the liver.In white, the trace of the gall bladder. Localization of the C point.
To compute this plane, called ABC, it is necessary to first localize the land-mark points A, B and C (see Fig. 5).
In order to detect the trunk of the vena cava, a binary opening with a verticaland cylindrical structuring element is performed on the image of the hepaticvein. The radius of this structuring element has been fixed to 1 voxel whereasits height is adaptive to the shape size and varies from 50 to 10 voxels. Thismathematical morphology operation enables to isolate the trunk of vena cava.Then, points A and B respectively correspond to the upper and lower part of
9

this trunk.
The detection of the point C requires the localization of the gall bladder whichpresents a very high positive mean curvature. The curvature computed withthe sagittal disc enables to detect it using a thresholding of the highest greylevels of the voxels on this face. The thresholding operation selects all points q
of the face such as Intensity(q) ∈ [0.9×gmax, gmax], where gmax is the maximalcurvature value of the face. The point C is then chosen as the closest point tothe liver border, as illustrated in Fig. 9. The ABC plane finally built delineatesboth left and right hemilivers (see Fig. 10).
(a) (b)
Fig. 10. Delineation of left and right liver. (a) Top view; (b) bottom view.
4.3 ABD plane: delineation of segment IV
From an anatomical point of view, segment IV is located in the left hemiliverand can be delineated by a vertical plane passing through the falciform lig-ament towards the vena cava (ABD plane). The point D corresponds to thetrace of the suspensory ligament on the inferior liver border and has then tobe detected (see Fig. 5).
The inferior border presents a very marked ridge interrupted in two points: onthe left, by the suspensory ligament, and on the right, by the impression of thegall bladder. Therefore, it has a high negative mean curvature correspondingto a very convex shape, which is interrupted in two points where the meancurvature increases.
A preliminary step to the localization of the point D is the detection of theinferior border. This is done by scanning the mean curvature image coronalslices (in the Ox direction) to detect the point presenting the minimal cur-vature (see Fig.11(a)). In order to reduce the research area, the curvature isonly computed in the region defined by:
z ≤ dimZ −dimZ
dimY× y,∀x (2)
10
where the inferior anterior border is necessarily located.
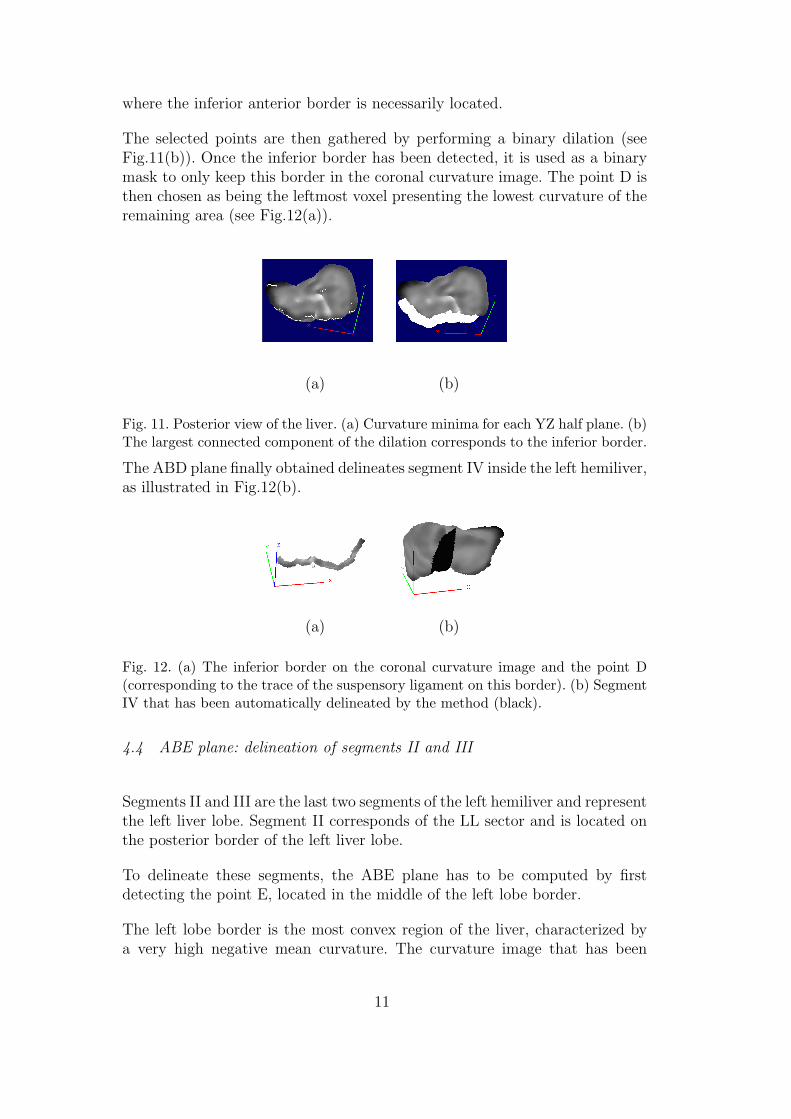
The selected points are then gathered by performing a binary dilation (seeFig.11(b)). Once the inferior border has been detected, it is used as a binarymask to only keep this border in the coronal curvature image. The point D isthen chosen as being the leftmost voxel presenting the lowest curvature of theremaining area (see Fig.12(a)).
(a) (b)
Fig. 11. Posterior view of the liver. (a) Curvature minima for each YZ half plane. (b)The largest connected component of the dilation corresponds to the inferior border.
The ABD plane finally obtained delineates segment IV inside the left hemiliver,as illustrated in Fig.12(b).
(a) (b)
Fig. 12. (a) The inferior border on the coronal curvature image and the point D(corresponding to the trace of the suspensory ligament on this border). (b) SegmentIV that has been automatically delineated by the method (black).
4.4 ABE plane: delineation of segments II and III
Segments II and III are the last two segments of the left hemiliver and representthe left liver lobe. Segment II corresponds of the LL sector and is located onthe posterior border of the left liver lobe.
To delineate these segments, the ABE plane has to be computed by firstdetecting the point E, located in the middle of the left lobe border.
The left lobe border is the most convex region of the liver, characterized bya very high negative mean curvature. The curvature image that has been
11

computed with the sagittal disk enables to detect it by thresholding. Thisthresholding operation consists in selecting all voxels q, such as Intensity(q) ∈[gmin, gmin + 0.2× (gmax − gmin)] where gmin and gmax respectively correspondto the lowest and the highest curvature of the image. If several connectedcomponents are detected, the leftmost one is considered as being the searchedcomponent (see Fig. 13(a)).
(a) (b)
Fig. 13. (a) Anterior view of the thresholding result: the left liver lobe (white) is theleftmost connected component. (b) Location of the point E on the left liver lobe.
The centre of mass of the left lobe component finally provides the point E.Indeed, this point is located at the leftmost intersection of the parallel to theOx axis starting from the centre of mass and the connected component of theleft lobe (see Fig. 13(b)).
The resulting ABE plane which passes through the point E towards the venacava separates segments II and III, as illustrated in Fig. 14(a). However, sincethe volume of the obtained segment II is generally smaller than the expectedone, the separation is adjusted by moving the plane towards the liver center.This improvement consists in no longer considering points A and B on the venacava, but the middle point of segments AD and BD, respectively denoted byA’ and B’. An example of such a delineation is illustrated in Fig. 14(b).
4.5 ABF and HH’F planes: delineation of right hemiliver segments
The right hemiliver is composed of segments V, VI, VII and VIII. From ananatomical point of view, there are no external landmarks enabling to delineatethem. As a consequence, we propose to consider the centre of mass (point F),since its use ensures that the delineation will be performed through the middleof the right liver, where portal vein branches supplying each segment usuallyseparate.
The method builds two planes from this point. The first one is the verticalplane, ABF generated by point F and AB. The second one contains the pointF and is normal to AB. This transversal plane is called HH’F.
12

(a) (b)
Fig. 14. Top view of left liver. (a) Before adjustment. (b) After adjustment of theABE plane.
The vertical plane ABF separates both right hemiliver sectors according tothe Goldsmith and Woodburne’s definition, as illustrated in Fig. 15(a), whilethe transversal plane splits segments in each sector according to Couinaud’sdefinition (see Fig. 15(b)).
(a) (b)
Fig. 15. (a) Vertical separation plane delimiting segments V and VIII from segmentsVI and VII. (b) Horizontal separation plane enabling to locate the 4 segments ofthe right liver.
4.6 Delineation of segment I
As segment I is part of both right and left hemilivers, it has to be treatedseparately from the other segments. It can be determined using two previ-ously defined planes: ABD and ABF. By respectively prolonging the ABDplane in the right hemiliver and the ABF plane in the left hemiliver, partsof segments previously assumed to belong to segments II, VI and VII are la-belled as parts of segment I. An example of such a delineation is illustrated inFig. 16. However, it has to be noticed that this approach can be inaccurate.Indeed, although the anatomical definition of this segment is only based oninternal vascular landmarks, the proposed strategy only relies on knowledgeconcerning its position and adjacency according to its neighbours.
13

(a) (b)
Fig. 16. (a) Part of segment I contained in the right liver (black). (b) Part of segmentI contained in the left liver (black).
5 Experimental Results
In this section, results obtained by applying the proposed method on 7 clinicalcases are presented and analysed.
5.1 Data set and computation time
The 3D binary images of the proposed database have been acquired from CT-scans and segmented using the the method of Soler et al. [9]. These imagespresent a size varying from 5122 × 100 to 5122 × 140 voxels. Voxel spatialdimensions are usually about 0.5 mm, whereas inter-slices separation is about2 mm. In order to increase the method accuracy and reduce the computationtime, the database has been processed to obtain isotropic data composed of2 mm edge voxels. On average, liver surfaces are then composed of 21 000voxels.
The computer used for validations was composed of a AMD Athlon(TM)XP1700+, 1.4 GHz processor and 512 MB of memory. The computation ofcurvature images from the binary liver image requires less than 1 minute.Moreover, this time can be reduced by using the “sliding window” technique[11], which consists in handling the in-going and out-going voxels of the struc-turing element during the computation. The computation time of the liversegment delineation process requires less than 6 minutes.
5.2 Results and discussion
Measuring the relevance of results of the proposed method is not a trivialtask, since it is impossible to compare the resulting segments with the realanatomical ones. Indeed, the methods of plane placement only provide an
14

approximation of the real liver segmental structure [12]. Furthermore the realsegments for each clinical case of the database are not available. The onlypossible measure consists then in evaluating the position of the automaticallycomputed planes in comparison with human manual positioning, but evenin this field, different experts do not necessarily agree. Hence, to estimatethe accuracy of automatic plane placement, the following protocol is used.Two experts have interactively placed 5 planes according to the portal andhepatic venous distribution patterns using the 3D Virtual Surgery Planning
software [13]. The position of the automatic computed planes and the positionof the planes chosen by the experts have been compared. A comparison of thedifference between the results of both experts also provides an approximationof the relevance of their positioning.
The error metrics are composed of distances and volume difference ratios whichhave been computed from the 7 clinical cases. The distance between planes iscomputed, using pseudo-metrics [14], as follows. For each point within a plane,the distance to the nearest point in the other plane is computed. The posi-tion of a plane is then quantified by a set of minimal and maximal distances.The maximum of these distances is the Hausdorff distance. To complete thesemetrics, the volume of error between each couple of planes which correspondsto the number of voxels attributed to different segments is also computed.For plane ABC, which delineates the left and the right hemiliver, the error ismeasured by dividing the number of miss-classified voxels by the total livervolume (see Fig. 17(a)). The same parameter is used for plane ABD, whichdelineates the left from the right liver lobe. For plane A’B’E splitting segmentII from segment III, the error is only measured on the common area composedof segment II and segment III. In this case, the number of voxels of the com-mon area attributed to different segments is divided by the volume of this area(see Fig.17(b)). This restriction is useful because it avoids the accumulationof errors. Otherwise the error involving planes ABC and ABE would be mea-sured. The same restricted metrics are used for planes ABF and HH’F in theright hemiliver.
The mean error values between each expert and the method, and betweenboth experts are summarized in Table 1. One can observe that the valuesfor planes ABC and ABD are relatively correct in comparison to the errorsbetween both experts (Exp1-Exp2 column). This can be explained by thefact that the construction of these planes is based on 3 external anatomicallandmarks which are efficiently detected by the method. In fact, points Aand B have been chosen on the cave trunk which is a very reliable landmark.Furthermore, the point C is on the bed of the gall bladder and the point D ison the trace of the suspensory ligament, which are the only external landmarksstrongly correlated with reliable internal vascular landmarks. Values obtainedfor plane ABF are also good. One can consider that this plane is acceptablein comparison to the values between both experts. The results are a little less
15

LL’R’ R
(a) (b)
Fig. 17. Principle involved in the measurement of volume errors between two planes.(a) The dashed area is the volume of miss-classified voxels. (b) For plane ABE, onlythe volume errors between planes in the common subsegmental area composed ofsegment II and segment III (vertical dashes) is considered. The error is representedby the area with slanted dashes.
satisfactory since this plane is built from 2 reliable points (A and B) and pointF, which is only a geometrical landmark.
It has to be noticed that these 3 planes are the 3 vertical separation planesaccording to the guidelines currently used in radiological practice. The errorinduced by these 3 planes on segment evaluation by comparison to the realsegmental structure has been studied by Fasel et al. in [12]. By computing theerror ratio between flat radiological planes and real boundaries, they obtaineda mean error value for 5 clinical cases of 34% with a minimum of 5.6% anda maximum of 86%. By using the same evaluation approach concerning the3 planes, the obtained average difference between the proposed method andthe 2 experts is respectively 17% and 28%. However, it is impossible to affirmthat these results are more satisfactory than those proposed in [12], since theexpert plane positions can not be considered as the anatomical reality. Thisassumption is strengthened by the 23% difference between both expert results.
Values obtained for planes A’B’E and HHF present errors. Indeed, for theseplanes, the difference between the method and each expert is higher than pre-viously, while the evaluations of both experts are similar. This can be explainedby the fact that experts use vessels of portal network for the definition of theseplanes, whereas the automatic method only uses geometrical criteria. It seemsnecessary to improve the method in further works in order to automaticallydetect the same internal landmarks as experts. For A’B’E the median point lo-cated between the separation of PR and LL veins and the Rex’s recessus couldbe used. Then, it could be possible to build a plane passing through that pointand being parallel to the coronal plane. The HH’F transversal plane placementcould be improved by passing through the separation point between the PRvein and the LR vein and parallel to the axial plane.
16

Errors
Plane Exp1-Auto Exp2-Auto Exp1-Exp2
ABC min 0.37 ± 0.64 0.38 ± 0.99 0.79 ± 2.09
max 24.60 ± 22.62 32.22 ± 20.04 24.66 ± 14.82
%vol 3 ± 2 7 ± 4 5 ± 3
ABD min 10.25 ± 17.51 5.04 ± 7.52 7.89 ± 15.81
max 30.03 ± 27.11 42.02 ± 19.95 52.11 ± 35.15
%vol 4 ± 6 8 ± 5 8 ± 5
ABF min 0.00 0.00 0.7 ± 1.85
max 53.74 ± 14.91 55.5 ± 13.29 50.69 ± 27.11
%vol† 17 ± 2 23 ± 8 17 ± 8
A’B’E min 7.45 ± 7.26 9.68 ± 16.89 0.27 ± 0.70
max 41.67 ± 34.47 44.17 ± 16.26 46.57 ± 24.23
%vol∗ 18 ± 8 24 ± 9 13 ± 1.5
HH’F min 4.33 ± 4.16 3.14 ± 5.84 0.00
max 53.27 ± 7.59 57.99 ± 7.83 47.14 ± 18.67
%vol† 18 ± 8 18 ± 4 11 ± 4
Table 1For each plane and each couple of positioning proposal, the error is characterized bythe minimum and maximum distances (in mm) and by the ratio of miss-classifiedvoxels (%vol = ratio over the total liver volume; %vol† = ratio over the commonliver right volume; %vol∗= ratio over the common volume of segments II and III).The errors are presented by the mean value over 7 clinical cases ± the standarddeviation.
6 Conclusion and perspectives
In this paper, we have presented a fully automatic method enabling the ap-proximation of anatomical segments of the liver, according to Couinaud’snomenclature, within a short computation time (about 6 minutes). Basedon the patient’s anatomy, the automated method simulates the strategy ofthe surgeon. Result evaluations demonstrate its efficiency for the delineationof four liver regions, which results in automatically placing 3 vertical planesaccording to the radiological guidelines. However, it seems to be less accuratefor the placement of the 2 remaining planes. These errors can be explainedby the poor correlation between the used geometrical landmarks and the realanatomical ones. Indeed, even though the method by section plane is used
17

(a) (b) (c) (d)
(e) (f) (g) (h)
Fig. 18. Automatically detected liver segments. (a),(c),(e),(g): Top view.(b),(d),(f),(h): Bottom view.
in clinical routine, it remains approximate, as demonstrated in [12]. To im-prove the segment delineation, it could be useful to complete this computationmethod based on external landmarks with a method using internal landmarks,i.e. to label the portal vein branches. A first approach could consist in replac-ing the anatomical atlas in the method of Soler et al. [8] by the resultingsegmental model of the proposed method. In particular, if the influence regionmerging step is guided by the plane localizations the improved method couldprovide the real segments. We point out that methods by separation planesapproximate the anatomical reality, whereas methods based on the study ofthe vascular network tree are limited by the quality of its reconstruction. Ourfuture research work will then aim at finding a mixed method correlating bothapproaches of segment computation to use their advantages and to reduce theirweaknesses.
Moreover, the promising results obtained on the 3 vertical planes, which aregenerally defined by hepatic veins, could be used to improve vascular networkssegmentation procedures. Indeed, since most scan images are obtained in por-tal time, hepatic veins are generally difficult to detect. Anatomical knowledgesuch as the one obtained in the proposed method could then be used forguidance of vessel segmentation.
18

References
[1] C. Couinaud, Le foie, etudes anatomiques et chirurgicales, Masson, 1957.
[2] N. Goldsmith, R. Woodburne, The surgical anatomy pertaining to liverresection, Surg Gynecol Obstet 105 (3) (1957) 310–318.
[3] H.-P. Meinzer, M. Thorn, C. C. S., Computerized planning of liver surgery -An overview, Computers & Graphics 26 (4) (2002) 569–576.
[4] G. Glombitza, W. Lamade, A. M. Demiris, M.-R. Gpfert, A. Mayer, M. L.Bahner, H.-P. Meinzer, G. Richter, T. Lehnert, C. Herfarth, Virtual planningof liver resections: image processing, visualization and volumetric evaluation,International Journal of Medical Informatics 53 (2-3) (1999) 225–237.
[5] A. Osorio, P.-J. Valette, A. Mihalcea, J. Atif, X. Ripoche, A new PC basedsoftware to perform semi-automatic hepatic segmentation using CT or MRimages, in: InfoRAD RSNA 2002, 88th Annual Meeting of the RadiologicalSociety of North America, Chicago, USA, November 13-December 6, 2002,Proceedings, 2002.
[6] D. Selle, B. Preim, A. Schenk, H.-O. Peitgen, Analysis of vasculature for liversurgery planning, IEEE Transactions on Medical Imaging 21 (11) (2002) 1344–1357.
[7] D. Selle, W. Spindler, B. Preim, H.-O. Peitgen, Mathematical methods inmedical imaging: analysis of vascular structures for liver surgery planning, in:B. Enquist, W. Schmid (Eds.), Mathematics Unlimited - 2001 and Beyond,Springer, 2000, pp. 1039–1059.
[8] L. Soler, Une nouvelle methode de segmentation des structures anatomiques etpathologiques : application aux angioscanners 3d du foie pour la planificationchirurgicale, Ph.D. thesis, universite de Paris XI, Orsay (1998).
[9] L. Soler, H. Delingette, G. Malandain, J. Montagnat, N. Ayache, C. Koehl,O. Dourthe, B. Malassagne, M. Smith, D. Mutter, J. Marescaux, Fullyautomatic anatomical, pathological, and functional segmentation from CT scansfor hepatic surgery, Computer Aided Surgery 6 (3) (2001) 131–142.
[10] J. Bullard, E. Garboczi, W. Carter, E. Fuller, Numerical methods for computinginterfacial mean curvature, Computational Materials Science 4 (2) (1995) 103–116.
[11] M. Van Droogenbroeck, H. Talbot, Fast computation of morphologicaloperations with arbitrary structuring elements, Pattern Recognition Letters17 (14) (1996) 1451–1460.
[12] J. Fasel, D. Selle, C. Evertsz, F. Terrier, H.-O. Peitgen, P. Gailloud, Segmentalanatomy of the liver: poor correlation with CT, Radiology 206 (1) (1998) 151–156.
19

[13] C. Koehl, L. Soler, J. Marescaux, A PACS based interface for 3D anatomicalstructures visualization and surgical planing, in: S. Mun (Ed.), Medical Imaging2002: Visualization, Image-Guided Procedures, and Display, San Diego, CAUSA, February 23-March 1, 2002, Vol. 4681, SPIE, 2002, pp. 17–24.
[14] V. Chalana, Y. Kim, A methodology for evaluation of boundary detectionalgorithms on medical images, IEEE Transactions on Medical Imaging 16 (5)(1997) 642–652.
20