authorship and contribution disclosures - science...
TRANSCRIPT

SC I ENCE ADVANCES | R E S EARCH ART I C L E
SC I ENT I F I C COMMUN ITY
1ESMT Berlin, Berlin 10178, Germany. 2Georgia Institute of Technology, Atlanta, GA30332, USA. 3National Bureau of Economic Research, Cambridge, MA 02138, USA.4University of Passau, Passau, Germany.*Corresponding author. Email: [email protected]
Sauermann and Haeussler, Sci. Adv. 2017;3 : e1700404 15 November 2017
Copyright © 2017
The Authors, some
rights reserved;
exclusive licensee
American Association
for the Advancement
of Science. No claim to
original U.S. Government
Works. Distributed
under a Creative
Commons Attribution
NonCommercial
License 4.0 (CC BY-NC).
Dow
nloa
Authorship and contribution disclosuresHenry Sauermann1,2,3* and Carolin Haeussler4
Most scientific research is performed by teams, and for a long time, observers have inferred individual teammembers’contributions by interpreting author order on published articles. In response to increasing concerns about this ap-proach, journals are adopting policies that require the disclosure of individual authors’ contributions. However, it isnot clear whether and how these disclosures improve upon the conventional approach. Moreover, there is little evi-dence on how contribution statements are written and how they are used by readers. We begin to address thesequestions in two studies. Guided by a conceptual model, Study 1 examines the relationship between author orderand contribution statements on more than 12,000 articles to understand what information is provided by each. Thisanalysis quantifies the risk of error when inferring contributions from author order and shows how this risk increaseswith team size and for certain types of authors. At the same time, the analysis suggests that some components of thevalue of contributions are reflected in author order but not in currently used contribution statements. Complementingthe bibliometric analysis, Study 2 analyzes survey data frommore than 6000 corresponding authors to examine howcontribution statements are written and used. This analysis highlights important differences between fields and be-tween senior versus junior scientists, as well as strongly diverging views about the benefits and limitations of contri-bution statements. On the basis of both studies, we highlight important avenues for future research and considerimplications for a broad range of stakeholders.
ded
on June 9, 2018http://advances.sciencemag.org/
from
INTRODUCTIONScientific research has become the domain of teams, yet rewards andsanctions are still directed at individual scientists (1–4). Therefore, ex-ternal stakeholders such as scientific peers, potential collaborators, ten-ure committees, and funding agencies need information on who didwhat and which team member deserves how much of the credit. His-torically, the primarymechanism to obtain this information has been toinfer contributions from authors’ presence and position on the byline(5, 6). However, there are widespread concerns that authorship conveysinsufficient information, especially given the increasing size of teamsand specialization of team members (6–9). In response to theseconcerns, a growing number of journals now require that teams disclosewhichauthorsmadewhichcontributions (Table 1).Yet,many stakeholderscontinue to use authorship order as the primary proxy for authors’ con-tributions, raising the question of how the information content of con-tribution disclosures compares to that of authorship order. Moreover,we need a better understanding of how authors decide on contributionstatements and how authors as well as readers think about the value—and limitations—of these statements. In addition to being of interest intheir own right, these insightsmay point toward important implicationsfor using and improving contribution disclosures.
Here, we first conceptualize the total value of a teammember’s sub-stantive contributions to a project as consisting of various components.By comparing author order and contribution disclosures on more than12,000 articles in the biological and life sciences, we then show whatinformation about these components can be inferred from authorshiporder and from currently used contribution disclosures. We also quan-tify the risk of errorwhenusing conventional approaches to interpretingauthor order and show how this risk increases with team size and forcertain types of authors. Although explicit contribution statements pro-vide important complementary information, they cannot—in their cur-rent form—substitute for author order. We complement this analysiswith insights from a large-scale survey of more than 6000 authors on
papers that include contribution statements across a broader rangeof fields. The survey data support many of the findings from ourbibliometric analysis. Moreover, they provide additional quantitativeand qualitative evidence on the process bywhich contribution statementsare written and used. Both studies highlight important challenges andconcerns regarding contribution statements. They also suggest a numberof improvements to journal policies as well as the need for future researchand discussions about the use and impact of contribution disclosures.
CONCEPTUAL MODELAuthorship as an aggregate indicatorScientists consider multiple factors when deciding which individuals toinclude as co-authors andwhere to place them on the byline (6). Hence,authorship aggregates information on a number of different aspects,and different types of external observers face the challenge of extractingthe particular information they need. Some observers seek informationon the specific types of contributionsmade by a co-author (for example,conceptualization versus data analysis), which is helpful when searchingfor collaborators with particular competences or investigating thesource of problems and misconduct (8). Others are interested in theoverall “value” of an author’s contributions and the resulting share ofcredit and recognition this author should receive (2, 10). As described inmore detail in the SupplementaryMaterials, we conceptualize the over-all value of an author’s contributions as reflecting four components:(i) the count or breadth of contributions made, (ii) the particular typesof contributions, (iii) the level of involvement in particular contribu-tions, and (iv) the importance of different contributions for achievingproject objectives (fig. S1). Author order may allow partial inferencesabout all four components; currently used contribution statementsprovide explicit information primarily on the first two. Although mostreaders are interested in authors’ substantive contributions, authorshipdecisions are also influenced by social dynamics that exacerbate the chal-lenge of inferring actual contributions (7, 8).
In the following Study 1, we examine howwell author order predictsthe number and types of contributions made by co-authors—the twoelements typically captured in explicit contribution statements. This
1 of 13

SC I ENCE ADVANCES | R E S EARCH ART I C L E
analysis reveals what information about these aspects of contributionscan be inferred from author order, what errors are likely when makingthese inferences, and how much additional information is provided byexplicit contribution statements. At the same time, the analysis maypoint toward important components of the value of contributions thatare reflected in author order but not in currently used contributionstatements, such as the level of an author’s involvement in a particulartype of contribution.
Dow
nloaded fro
STUDY 1: RESULTS FROM BIBLIOMETRIC ANALYSISMeasuring contributionsWe analyze data from articles published in PLOS ONE between 2007and 2011. PLOS ONE is considered by some to be a leader in requiringcontribution disclosures (11) and has an impact factor in the top quar-tile in its field. The journal publishes research primarily in the biologicaland life sciences, the domain in which discussions around authorshipand contribution disclosures are most active (6, 8, 12). To address theconcern that PLOS ONE publishes a smaller share of high-impactpapers than more selective journals such as Science or Proceedings ofthe National Academy of Sciences (PNAS), we also performed our analy-ses using the top 10% of papers in terms of average annual citations,with very similar results (see the Supplementary Materials). Because
Sauermann and Haeussler, Sci. Adv. 2017;3 : e1700404 15 November 2017
the division of labor in very large teams may not be comparable to thatin typical teams and to facilitate the analysis, we focus on papers with 2to 14 authors.
PLOS ONE data provide a novel opportunity for quantitative anal-ysis because the journal requires that articles disclose the types of con-tributions made by each co-author using predefined categories (conceivedthe idea, performed experiments, contributed reagents/materials/analysistools, analyzed data, and wrote the paper), as well as an open-ended fieldfor “other” contributions. For comparison, Table 1 provides an overview ofthe top 15 interdisciplinary sciences journals and their respectiveapproaches to contribution disclosures. Eleven of the journals requirecontribution statements.PLOSONE,PeerJ, and Science collect informationusing predefined categories of contributions, although Science does notdisclose these data routinely. Other journals use open-entry fields butoften mention in their instructions contributions similar to those usedby PLOS ONE. All journals with contribution disclosures focus onwhether or not individual authors were involved in different types ofcontributions [components (i) and (ii) in our conceptual model], andno journal systematically discloses the level of authors’ involvement in aparticular contribution or the importance of contributions for projectsuccess [components (iii) and (iv)].
Although contribution statements published on papers may also beshaped by factors other than actual contributions, Study 1 is based on
http://advances.sm
Table 1. Top 15 journals in the multidisciplinary sciences and their approaches to contribution disclosures. Journals with the 15 highest 2014 impactfactors in the category “multidisciplinary sciences” (source: Journal Citation Reports/Web of Science). Journal policies current as of publication.
cience
Journalrank
Journal title
Impactfactormag.
Statements“required,”
“encouraged,”or no policy
Contributionsstandardized/offers
template
Asks for level ofcontributions
Information madepublic in paper
org/
1 Nature 41.456 Required No No Yeso
n Ju 2 Science 33.611 Required Yes Yes Optionalne 9
3 Nature Communications 11.470 Required No No Yes,
20 4 PNAS 9.674 Required No No Yes1
85
Scientific Reports 5.578 Required No No Yes6
Annals of the New York Academy of Sciences 4.383 Required No No Yes7
Journal of the Royal Society Interface 3.917 Required No No Yes8
Research Synthesis Methods 3.898 No policy — — —9
PLOS ONE 3.234 Required Yes No Yes10
Proceedings of the Japan Academy Series B:Physical and Biological Sciences2.652
No policy — — —11 P
roceedings of the Royal Society A: MathematicalPhysical and Engineering Sciences2.192
Required No No Yes12 P
hilosophical Transactions of the Royal Society A:Mathematical Physical and Engineering Sciences2.147
Required No No Yes13
PeerJ 2.112 Required Yes No Yes14
Naturwissenschaften 2.098 No policy — — —15 P
roceedings of the Romanian Academy Series A:Mathematics Physics Technical Sciences1.658
No policy — — —2 of 13

SC I ENCE ADVANCES | R E S EARCH ART I C L E
on Juhttp://advances.sciencem
ag.org/D
ownloaded from
the premise that contribution statements are highly correlated with ac-tual contributions and can thus serve as a meaningful proxy (8, 12, 13).Study 2 generally supports this view while also providing novel insightsinto potential social dynamics.We partly address confounding effects ofsocial factors using controls and robustness checks discussed below.
Author order and contributionsTable S1 shows summary statistics. Figure 1 visualizes the shares ofauthors in a particular author position whomade a particular contribu-tion, focusing on teams with six members (the median team size). Firstauthors made the broadest range of different contributions (average,3.77), followed by last authors (3.03) andmiddle authors (ranging from2.50 to 1.80). Figure 1 also shows differences in the particular contribu-tions made. For example, 94% of first authors in teams of six wereinvolved in analyzing data, 87% in performing experiments, 86% inwriting the paper, and 78% in conceiving the study. In contrast, 89%of last authors conceived the study, 85% wrote the paper, 64% analyzeddata, and 23% performed experiments. Middle authors listed earlier(that is, second or third position) tend to be more involved in empiricalactivities than those listed later (that is, fourth or fifth position), but theyare similarly likely to be involved in conception or writing. Regressionmodels that use teams of all sizes and control for detailed scientific fieldaswell as affiliation in single versusmultiple laboratories (table S2) showthat the differences between first, last, and middle authors are qualita-tively the same as in Fig. 1. At the same time, these differences partly de-pend on the size of the team, highlighting the need to take team size intoaccount when interpreting author positions (table S3). Expanding on theanalysis of individual contributions,wealso examinedwhichcombinationsof contributions tend to bemade by authors in different positions.We findthat first authors are more likely to have conceived&written&analyzedaswell as performed&analyzed thanmiddle and last authors. Last authorsare more likely to have conceived&written than first or middle authors(table S2, models 8 to 10).
The information content of authorship order may be different whenauthors are listed alphabetically (14).Only 7.04%of papers in our sampleuse alphabetical authorship, consistent with the notion that alphabetical
Sauermann and Haeussler, Sci. Adv. 2017;3 : e1700404 15 November 2017
ne 9, 2018
authorship is the exception in the biological and life sciences. Even theobserved cases of alphabetical authorship may reflect a contribution-based assignment, where alphabetical order emerges by chance (thatis, an author has made the most contributions and also happens to havethe name with the earliest letter in the alphabet). Consistent with thisidea, table S4 shows that the rate of alphabetical order declinesmarkedlywith team size and does not differ from what would be expected if al-phabetical order emerged simply by chance from a contribution-basedassignment of positions (the number of possible permutations of x dif-ferent names is x!). For example, 50.58% of articles with two authors usealphabetical authorship, which is not significantly different from the50%predicted by chance.Models 11 and 12 in table S2 show that papersusing alphabetical and non-alphabetical author order show similar dif-ferences in the count of contributions between first, middle, and lastauthors. These regressions are estimated using only articles with fewerthan six authors because alphabetical authorship is virtually nonexistentin larger teams (table S4). Together, author order provides similarinformation on contributions in the biological and life sciences evenwhen authors are listed alphabetically.
Authors can also be designated as “corresponding author.”We findthat 32%of corresponding authorswere also first authors, 9%weremid-dle authors, and 59% were last authors (table S5). Correspondingauthors made an average of 3.47 contributions, significantly (P <0.01)more than noncorresponding authors (2.28). This higher contri-bution count largely reflects greater involvement in conceiving thestudy and in writing the paper (table S6). Being designated as corre-sponding author is associatedwith a significantly greater count of con-tributions even for a given author position, and this effect is mostpronounced for corresponding authors who are also middle authors(table S6, models 8 to 10).
Reliability of author order as indicator of contributionsThe previous analysis suggests that author position allows useful infer-ences about author contributions, consistent with common practice.However, these inferences are only probabilistic and will often bewrong. This is most obvious with respect to the types of contributions:Assuming that contribution statements are a reasonable proxy for ac-tual contributions, our observation that 80%of first authors are reportedto have conceived the study (table S1) suggests that inferring this con-tribution from first authorshipwill be incorrect roughly 20%of the time.The error rate will be lowest when inferring contributions that are typ-ically made by a very large (or very small) share of the authors in a par-ticular position.The error ratewill behighestwhen inferring contributionsthat aremade by roughly half of the authors in a particular position. Forexample, 49% of middle authors are involved in data analysis, andinferring that a middle author was involved in data analysis will be cor-rect only about half the time. Although this example uses raw samplemeans, the implied error rates are largely the same if we use predictedprobabilities of having made particular contributions from regressionsthat control for field and other factors (table S7).
To explore how reliably author order informs about the breadth ofauthors’ involvement in the project, fig. S2 shows the distribution of thecount of different contributions for first, last, and middle authors inteams of six. We find considerable heterogeneity even for the same au-thor position. For example, although 22.69% of first authors make fiveor six contributions, 45.44%make four contributions and 31.88%makeonly three or fewer contributions.
Finally, we examine how reliably author position informs aboutauthors’ contributions relative to each other.We start from two empirical
01
23
4S
hare
of a
utho
rs p
erfo
rmin
g co
ntrib
utio
n
1 2 3 4 5 6Author position
OtherWroteAnalyzedMaterialsPerformedConceived
Fig. 1. Share of authors performing a particular contribution; stacked for eachauthor position. Teams with six authors. For example, 78% of first authors conceived(blue segment), 87% performed (brown), 27% providedmaterials (green), 94% analyzed(orange), 86% wrote (turquoise), and 5% contributed “other” (red). Summing these per-centages (377%) shows that the average first author made 3.77 different contributions.
3 of 13

SC I ENCE ADVANCES | R E S EARCH ART I C L E
http://advances.sciencD
ownloaded from
“conventions” observed earlier (Fig. 1 and table S2): First authorstypically have broader involvement in the study than last authors,and last authors have broader involvement than middle authors. Wethen examine howmany papers with at least three authors deviate fromthese conventions. We find that 45.59% of papers deviate from at leastone of the two conventions, whereby 15.94%deviate in that first authorshave a lower count of contributions than last authors, and 30.32% de-viate in that last authors have a lower contribution count than at leastone middle author.
Taken together, authorship order provides some information aboutthe underlying number and types of scientists’ contributions. However,the required inferences will often be wrong, suggesting that explicit con-tribution disclosures provide important additional information. In thenext analysis, we examine whether the correspondence between authororder and stated contributions differs by team size, possibly reflectingdifferences in teams’ organization but also the increasing complexityof aggregating different aspects of individuals’ contributions into uni-dimensional authorship order (fig. S1).
Team sizeFigure S3 shows that the count of contributions decreaseswith team sizefor first and middle authors but remains largely stable for last authors.This result holds when we control for detailed scientific field and otherproject attributes (tables S8 and S9). The lower contribution count offirst authors in larger teams reflects a lower likelihood of being involvedin all of the different activities. For middle authors, the lower count ofcontributions in larger teams reflects that they are less likely to beinvolved in conception, analysis, and writing; their likelihood ofperforming experiments remains stable across team size (table S8).
Team size also has implications for the reliability of author order asan indicator of contributions. Figure 2A shows that the SD of the con-
Sauermann and Haeussler, Sci. Adv. 2017;3 : e1700404 15 November 2017
tribution count increases with team size for first authors, suggestingmore error when estimating the breadth of first authors’ contributionsin larger teams. This measure is more stable across team size for middleand last authors. Figure 2B shows the share of teams deviating from the“convention” that first authors have a higher count of contributionsthan last authors and last authors have a higher count of contributionsthan middle authors. This share increases from 31.66% in teams of 3 to57.87% in teams of 14, largely reflecting an increasing likelihood thatone of the middle authors made a broader set of contributions thanthe last author. Overall, author order is less reliable as an indicator ofthe breadth of authors’ contributions in larger teams.
Inclusion as an authorWhat contributions can be inferred from the fact that a person is listedas an author on the paper at all? The submission instructions of manyjournals, including Science and PLOS ONE, refer to the authorship re-quirements established by the International Committee of MedicalJournal Editors (ICMJE) (15). The ICMJE was founded in 1978 by edi-tors of leading medical journals to develop guidelines for the conduct,reporting, editing, and publication of scholarly work. It is also intendedto establish best practices and ethical standards. According to theICMJE, authorship requires that an individual fulfills all four of thefollowing criteria: (i) substantial contribution to conception and design,acquisition of data, or analysis and interpretation of data; (ii) draftingthe article or revising it critically for important intellectual content;(iii) final approval of the version to be published; and (iv) agreementto be accountable for all aspects of the work in ensuring that questionsrelated to the accuracy or integrity of any part of the work are appro-priately investigated and resolved. Although we cannot explore the lasttwo requirements, we can explore whether authorship at least reflectsthe contributions highlighted in requirements (i) and (ii) (see Materials
on June 9, 2018em
ag.org/
.81
1.2
Sta
ndar
d de
viat
ion
of c
ount
of c
ontr
ibut
ions
2 4 6 8 10 12 14Team size
First author
Middle author
Last author
Corresp. author
A SD of contribution count
0.2
.4.6
.81
Sha
re o
f art
icle
s de
viat
ing
from
con
vent
ion
2 4 6 8 10 12 14Team size
First < Last
Last < Middle
First < Last and/or Last < Middle
B Deviations from conventions
Fig. 2. Variation in author contributions by team size. (A) SD of the count of contributions, by position and team size. (B) Share of articles deviating fromconventions regarding count of contributions, by position and team size.
4 of 13

SC I ENCE ADVANCES | R E S EARCH ART I C L E
and Methods for details). Consistent with previous work using smallersamples (6, 12), we find that for a large share of authors (47.66%),authorship does not reflect the contributions stated in the ICMJEguidelines, primarily because they were not involved in writing. Thisshare is highest among middle authors (64.5%) but is nontrivial alsoamong first authors (11.6%) and last authors (12.3%). Moreover, thisshare is higher in larger teams (Fig. 3, fig. S4, and table S10).
on June 9,http://advances.sciencem
ag.org/D
ownloaded from
STUDY 2: RESULTS FROM AUTHOR SURVEYStudy 1 provides insights into the relationship between author orderand contribution statements and highlights potential errors when usingthe former to infer the latter. However, bibliometric data provide littleinsight into how contribution statements are written, what benefits andchallenges scientists see, and how statements might be improved. Togain deeper insights into these issues, we analyze more than 6000responses from a survey of corresponding authors on papers publishedin two journals that require contribution disclosures: PLOS ONE andPNAS. Details on the sampling and survey methodology are providedin Materials and Methods.
One part of the survey was designed to gather information onrespondents’ opinions about contribution statements, as well as theirimpression of common practices in their fields. In a second part ofthe survey, we asked specifically about the paper on which therespondent was a corresponding author, andwe included the paper titleand publication date in the survey to facilitate respondents’ recall. Wefirst provide descriptive results, supplemented by an econometric anal-ysis that examines the statistical significance of observed differences in amultivariate regression context. We then draw on open-ended re-sponses to provide additional insights into perceived benefits and chal-lenges of contribution statements, as well as potential improvements.We note that all survey responses are from corresponding authorsand are thus not necessarily representative of teammembers in general.
Quantitative AnalysisPerceived informational value of contribution statementsStudy 1 suggests that contribution statements provide importantinformation that cannot be inferred from author order. To assess
Sauermann and Haeussler, Sci. Adv. 2017;3 : e1700404 15 November 2017
2018
whether this claim is consistent with scientists’ perceptions, we askedrespondents “Compared to author order, how much information doyou feel contribution statements give to readers about the following,”specifying four aspects: “The particular types of contributions madeby a co-author (e.g., author contributed to experiments and writing),”“A co-author’s share of effort toward particular contributions relative toother co-authors (e.g., author did 80% of the writing),” “How importanta co-author’s contributions were for the success of the project,” and“The share of ‘credit’ the co-author should get for the paper.” Respon-dents answered on a three-point scale anchored by “Less informationthan author order” (coded as 1), “About the same” (2), and “Moreinformation than author order” (3).
Means greater than two indicate that respondents perceive contribu-tion statements to be more informative with respect to these aspects ofcontributions (table S11). Consistent with our earlier conjectures, how-ever, the extent of this advantage depends on the particular type ofinformation: Although a large majority of respondents felt that contri-bution statements provide more information than author order aboutthe types of contributions made (60.71% versus 23.36% who saw nodifference and 15.93% who perceived author order to be more inform-ative), only 33.87%of respondents felt that contribution statements pro-vide more information about deserved credit (versus 40.55% who sawno difference and 25.59% who perceived author order to be more in-formative). Figure 4 shows that these qualitative patterns hold acrossfields. At the same time, regressions show that perceived informationaladvantages of contribution statements tend to be higher in the physicaland social sciences than in the bio/life sciences, perhaps reflecting thatthe norms regarding the “meaning” of author positions are less definedin the former fields, making explicit contribution statements relativelymore informative (table S12, models 1 to 4).
In a related question, we asked “Overall, how much information doyou feel typical contribution statements provide readers above and be-yond the information provided by author order?,” with responsesscored on a four-point scale ranging from “No additional information”to “A lot of additional information.” More than 90% of respondentsperceived at least some additional information, with roughly 40% seeingconsiderable or a lot of additional information. The regressions shownosignificant field differences (table S12, model 5) but significantly highervalue perceived by junior compared to senior scientists.Perceived value of additional detailOur conceptual discussion and Fig. 4 suggested that although contribu-tion statements provide explicit information about the types of contribu-tions made, they are less informative about individuals’ level ofinvolvement in particular contributions or about the importance of thecontributions made. We explored how useful this information would beby asking respondents “In addition to knowing whether a co-author hasmade a particular contribution at all, how useful would you find knowing‘What share of each contributionwasmade by the co-author (e.g., 80%ofwriting)’ and ‘How important different types of contributionswere for thesuccess of theproject.’”Respondents ratedboth itemson four-point scalesranging from “Not useful” to “Extremely useful.”Whereas 20.68% of re-spondents would find information on shares of effort not useful, 46%would find it somewhat useful, 27.46% very useful, and 5.87% extremelyuseful. The results for additional information on the importance of con-tributions are quite similar, with 20.32% finding it not useful, 42.79%somewhat useful, 29.53% very useful, and 7.35% extremely useful. Theregressions show few field differences, but junior scientists would findboth types of information significantly more useful than senior scientists(table S12, models 6 and 7).
Fig. 3. Share of authors in each position thatmeet criteria (i) and (ii) of the ICMJErequirements for authorship (in their less strict interpretation, see Materials andMethods for details).
5 of 13

SC I ENCE ADVANCES | R E S EARCH ART I C L E
http://advances.scieD
ownloaded from
Who decides and agrees on contribution statements?The informational value of contribution statements depends not onlyon their format but also on the process by which they are decided. Al-though a large body of previous work has examined the determinants ofauthorship decisions (6), little is known about how contribution statementsare written. Hence, we asked respondents to think specifically about thefocal paper on which they were a corresponding author.We then asked“Which co-authors were involved in discussing the final contributionstatements?,”with options involving “All co-authors discussed,” “Somebut not all co-authors discussed (please specify who),” “No discussion(corresponding author just submitted),” and “I don’t remember.” In asecond question, we asked “Which co-authors explicitly approved thefinal contribution statements (e.g., verbally or by email)?,” providingequivalent response options.
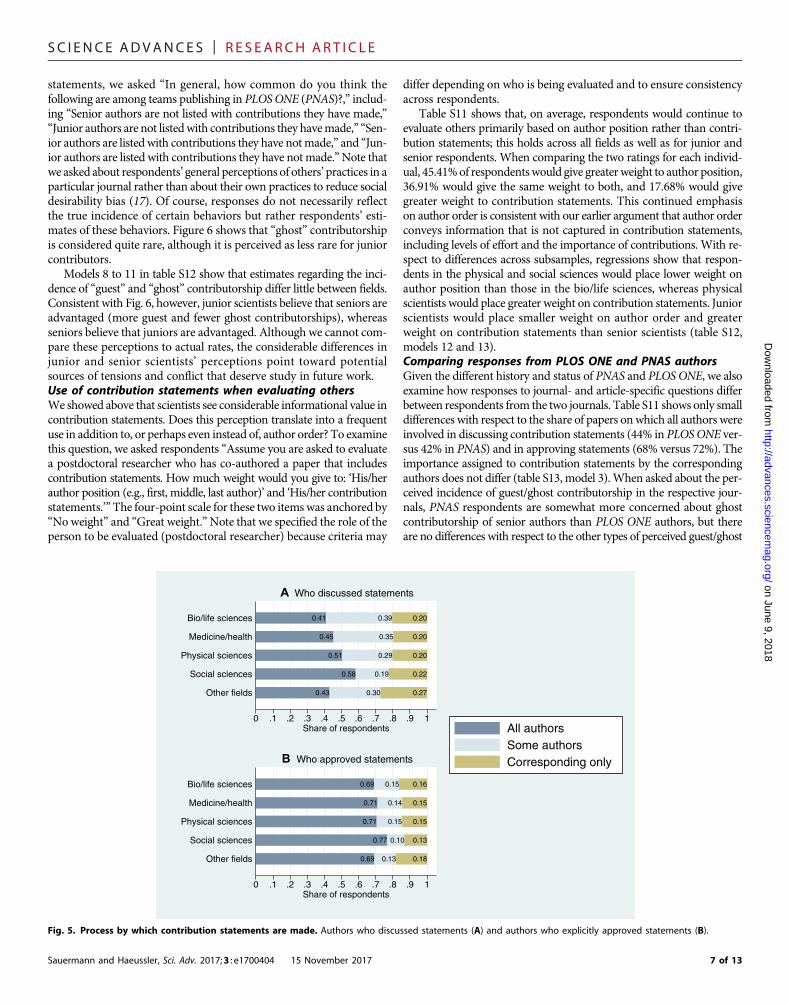
The results suggest that 43.47% of papers had all authors involved indiscussing contribution statements, whereas 35.59% of papers had sev-eral but not all authors involved (Fig. 5). The open-ended entries suggestthat these were primarily first and last authors. In 20.94% of papers, thecorresponding author decided on the contribution statements alone.Rates of explicit approval are significantly higher: All authors approvedstatements on 69.85% of papers, some authors approved on 14.25% ofpapers, whereas no other team members approved statements on15.90% of the papers (that is, the corresponding author submitted with-out others’ explicit approval).
We estimate multinomial logit regressions for these two variables,with “All co-authors” as the omitted category of the dependent variable.These regressions show that compared to the bio/life sciences, papers inthe other major fields are significantly more likely to have all authorsinvolved in thediscussion (table S13,model 1).However, the involvementin the form of explicit approval differs little between fields (table S13,
Sauermann and Haeussler, Sci. Adv. 2017;3 : e1700404 15 November 2017
model 2). We find strong differences by team size: The larger the team,the higher the likelihood that not all team members were involved indiscussing and approving the contribution statements.Importance of contribution statementsA potential concern when interpreting contribution statements is thatthey do not “matter” as much as authorship and are completed withoutmuch thought by corresponding authors just to fulfill journal require-ments. Somewhatmitigating this concern, the previous analyses suggestthat respondents do see considerable value in contribution statementsand that statements reflect discussions between, and approval by, largeshares of the team members. To further examine this issue, we alsoasked respondents “How important was it for you where you appearon the contribution statements?” using a four-point scale ranging from“Not at all important” to “Extremely important” as well as the option “Idon’t remember.” Among those respondents who did remember(98.86%), only a smallminority (13.87%) indicated that their statementswere not at all important to them, 34.29% found them somewhat im-portant, 32.29% found them very important, and 19.54% found themextremely important. Thus, most corresponding authors seem to takecontribution statements quite seriously.
Model 3 of table S13 shows that contribution statements were lessimportant for corresponding authors in the physical sciences than forthose in the other fields. We also find large differences by status of therespondent: Junior scientists assign significantly higher importance totheir contribution statements than senior scientists.Guest and ghost contributorshipThe literature on authorship has highlighted undeserved authorship(“guest authorship”) or unjustified exclusion of individuals whocontributed to a project (“ghost authorship”) as important problems(16). To explore howmuch a similar concernmay apply to contribution
on June 9, 2018ncem
ag.org/
0.15 0.21 0.64
0.12 0.18 0.71
0.12 0.20 0.68
0.19 0.27 0.54
0.17 0.24 0.59
0 .1 .2 .3 .4 .5 .6 .7 .8 .9 1Share of respondents
Other fieldsSocial sciences
Physical sciencesMedicine/healthBio/life sciences
A Types of contributions
0.19 0.33 0.48
0.21 0.32 0.47
0.19 0.39 0.42
0.23 0.38 0.38
0.23 0.37 0.40
0 .1 .2 .3 .4 .5 .6 .7 .8 .9 1Share of respondents
Other fieldsSocial sciences
Physical sciencesMedicine/healthBio/life sciences
B Share of effort
0.19 0.43 0.37
0.21 0.46 0.33
0.20 0.41 0.40
0.25 0.40 0.34
0.25 0.42 0.33
0 .1 .2 .3 .4 .5 .6 .7 .8 .9 1Share of respondents
Other fieldsSocial sciences
Physical sciencesMedicine/healthBio/life sciences
C Importance of contributions
0.20 0.42 0.37
0.23 0.37 0.40
0.20 0.43 0.37
0.28 0.40 0.31
0.27 0.40 0.33
0 .1 .2 .3 .4 .5 .6 .7 .8 .9 1Share of respondents
Other fieldsSocial sciences
Physical sciencesMedicine/healthBio/life sciences
D Share of credit
Author order more informativeNo differenceContribution statements more informative
Fig. 4. Informational advantages of author order and contribution statements. Ratings with respect to types of contributions (A), share of effort (B), importance ofcontributions (C), and share of credit (D).
6 of 13
SC I ENCE ADVANCES | R E S EARCH ART I C L E
http://advances.sciencemD
ownloaded from
statements, we asked “In general, how common do you think thefollowing are among teams publishing in PLOSONE (PNAS)?,” includ-ing “Senior authors are not listed with contributions they have made,”“Junior authors are not listedwith contributions they havemade,” “Sen-ior authors are listed with contributions they have notmade,” and “Jun-ior authors are listed with contributions they have notmade.”Note thatwe asked about respondents’ general perceptions of others’practices in aparticular journal rather than about their own practices to reduce socialdesirability bias (17). Of course, responses do not necessarily reflectthe true incidence of certain behaviors but rather respondents’ esti-mates of these behaviors. Figure 6 shows that “ghost” contributorshipis considered quite rare, although it is perceived as less rare for juniorcontributors.
Models 8 to 11 in table S12 show that estimates regarding the inci-dence of “guest” and “ghost” contributorship differ little between fields.Consistent with Fig. 6, however, junior scientists believe that seniors areadvantaged (more guest and fewer ghost contributorships), whereasseniors believe that juniors are advantaged. Although we cannot com-pare these perceptions to actual rates, the considerable differences injunior and senior scientists’ perceptions point toward potentialsources of tensions and conflict that deserve study in future work.Use of contribution statements when evaluating othersWeshowed above that scientists see considerable informational value incontribution statements. Does this perception translate into a frequentuse in addition to, or perhaps even instead of, author order? To examinethis question, we asked respondents “Assume you are asked to evaluatea postdoctoral researcher who has co-authored a paper that includescontribution statements. How much weight would you give to: ‘His/herauthor position (e.g., first, middle, last author)’ and ‘His/her contributionstatements.’”The four-point scale for these two itemswas anchored by“Noweight” and “Great weight.”Note that we specified the role of theperson to be evaluated (postdoctoral researcher) because criteria may
Sauermann and Haeussler, Sci. Adv. 2017;3 : e1700404 15 November 2017
differ depending on who is being evaluated and to ensure consistencyacross respondents.
Table S11 shows that, on average, respondents would continue toevaluate others primarily based on author position rather than contri-bution statements; this holds across all fields as well as for junior andsenior respondents. When comparing the two ratings for each individ-ual, 45.41%of respondentswould give greaterweight to author position,36.91% would give the same weight to both, and 17.68% would givegreater weight to contribution statements. This continued emphasison author order is consistent with our earlier argument that author orderconveys information that is not captured in contribution statements,including levels of effort and the importance of contributions. With re-spect to differences across subsamples, regressions show that respon-dents in the physical and social sciences would place lower weight onauthor position than those in the bio/life sciences, whereas physicalscientists would place greater weight on contribution statements. Juniorscientists would place smaller weight on author order and greaterweight on contribution statements than senior scientists (table S12,models 12 and 13).Comparing responses from PLOS ONE and PNAS authorsGiven the different history and status of PNAS and PLOS ONE, we alsoexamine how responses to journal- and article-specific questions differbetween respondents from the two journals. Table S11 shows only smalldifferences with respect to the share of papers onwhich all authors wereinvolved in discussing contribution statements (44% in PLOSONE ver-sus 42% in PNAS) and in approving statements (68% versus 72%). Theimportance assigned to contribution statements by the correspondingauthors does not differ (table S13, model 3).When asked about the per-ceived incidence of guest/ghost contributorship in the respective jour-nals, PNAS respondents are somewhat more concerned about ghostcontributorship of senior authors than PLOS ONE authors, but thereare no differences with respect to the other types of perceived guest/ghost
on June 9, 2018ag.org/
0.43 0.30 0.27
0.58 0.19 0.22
0.51 0.29 0.20
0.45 0.35 0.20
0.41 0.39 0.20
0 .1 .2 .3 .4 .5 .6 .7 .8 .9 1Share of respondents
Other fields
Social sciences
Physical sciences
Medicine/health
Bio/life sciences
A Who discussed statements
0.69 0.13 0.18
0.77 0.10 0.13
0.71 0.15 0.15
0.71 0.14 0.15
0.69 0.15 0.16
0 .1 .2 .3 .4 .5 .6 .7 .8 .9 1Share of respondents
Other fields
Social sciences
Physical sciences
Medicine/health
Bio/life sciences
B Who approved statements
All authorsSome authorsCorresponding only
Fig. 5. Process by which contribution statements are made. Authors who discussed statements (A) and authors who explicitly approved statements (B).
7 of 13

SC I ENCE ADVANCES | R E S EARCH ART I C L E
http://advances.scieD
ownloaded from
contributorship in the two journals (table S12, models 8 to 11).Together, these comparisons raise our confidence in the results fromStudy 1: Although Study 1 is based on data from PLOS ONE only,the survey gives no indication that contribution statements play a sig-nificantly different role—or are less reliable—in PLOS ONE than inhigher status journals, such as PNAS. Nevertheless, future work that di-rectly replicates Study 1 using data from other journals would be highlydesirable.
Qualitative insights: Open-ended questionsTo supplement the quantitative measures, we also asked respondentstwo open-ended questions that provide additional qualitative insights.A first question was directed only at respondents who indicated thatthey would give no or only some weight to contribution statementswhen evaluating a postdoctoral researcher (see above). This question asked“Why would you not pay more attention to contribution statements?”More than 2000 respondents answered this question. All respondentsreceived a second question at the end of the survey: “Do you have anyother comments on this topic that youwould like to share? How do youthink contribution statements could be improved?”More than 1400 re-spondents provided additional comments in response to this question.Although a formal analysis of these data is beyond the scope of this pa-per, we list a number of illustrative responses in tables S14 and S15. Weselected responses pertaining to areas or ideas that appeared particularlysalient in the body of responses, but we emphasize that the listed re-sponses are not necessarily representative and should not be interpretedin a quantitative way. In addition to revealing fascinating insights intoscientists’ experiences with contribution statements, the responseshighlight how diverse—and often conflicting—opinions about thesestatements are.
Sauermann and Haeussler, Sci. Adv. 2017;3 : e1700404 15 November 2017
DISCUSSIONSummaryThe bibliometric analysis in Study 1 shows significant relationships be-tween author order and contribution statements, consistent with theview that authorship and author order can allow readers to infer co-authors’ individual contributions. However, author order and contribu-tion statements are not always aligned, suggesting that they also providedifferent—and complementary—information. The key advantage ofcontribution disclosures is that they provide more information aboutthe breadth and types of authors’ contributions, reducing the risk of er-roneous inferences regarding these aspects based on author order,which is especially useful for middle authors and in larger teams. Yet,contribution statements provide little information about two other im-portant aspects. First, they do not inform about an author’s level of in-volvement in particular contributions, which is particularly problematicwhen several authors are listed with the same contributions. Second,they provide little information on the importance of different contribu-tions to project success. Differences in the importance of particular con-tributions across projects may explain, for example, why some teamsassign prominent author positions to individuals who made primarilyempirical contributions, whereas others assign these positions to mem-bers whose contributions were conceptual.
Survey responses from corresponding authors in Study 2 providefurther insights into the informational value of contribution statements:A large majority of respondents indicates that contribution statementsprovide themwith information above and beyond that provided by au-thorship order. Consistent with our conceptualmodel, however, contri-bution statements are considered to bemore informative about types ofcontributions made than about shares of effort or the overall credit anauthor should receive. The survey also provides insights into the process
on June 9, 2018ncem
ag.org/
0.27 0.49 0.210.03
0.31 0.51 0.150.03
0 .1 .2 .3 .4 .5 .6 .7 .8 .9 1Share of respondents
Faculty
PhDs/postdocs
A Senior ghost contributors
0.19 0.47 0.300.04
0.12 0.44 0.360.08
0 .1 .2 .3 .4 .5 .6 .7 .8 .9 1Share of respondents
Faculty
PhDs/postdocs
B Junior ghost contributors
0.12 0.33 0.43 0.12
0.06 0.22 0.49 0.24
0 .1 .2 .3 .4 .5 .6 .7 .8 .9 1Share of respondents
Faculty
PhDs/postdocs
C Senior guest contributors
0.25 0.53 0.200.02
0.29 0.54 0.150.02
0 .1 .2 .3 .4 .5 .6 .7 .8 .9 1Share of respondents
Faculty
PhDs/postdocs
D Junior guest contributors
Never happensRarely happensOccasionally happensFrequently happens
Fig. 6. Perceived incidence of ghost and guest contributorship. Incidence of ghost contributorship (authors not listed with contributions they have made) by seniorauthors (A) and junior authors (B). Incidence of guest contributorship (authors listed with contributions not made) by senior authors (C) and junior authors (D). By seniorityof respondent.
8 of 13
SC I ENCE ADVANCES | R E S EARCH ART I C L E
on June 9, 2018http://advances.sciencem
ag.org/D
ownloaded from
by which contribution statements are made, suggesting that manyrespondents—especially those who are more junior—care stronglyabout where they appear in contribution statements and suggestingbroad participation in discussing and approving these statements.Despite the high perceived informational value, however, most re-spondents pay more attention to author order than contributionstatements when evaluating others. Reasons include, among others,concerns about biases due to social influence and lack of attention,greater difficulty of accessing and processing contribution statementscompared to authorship information, as well as the lack of detail andthe inability of standardized contribution statements to reflect thecomplexity of teamwork.
Future researchBefore we turn to implications of the findings, we highlight three fun-damental issues that emerged fromour analyses and that suggest impor-tant avenues for future research. First, contribution statements are basedon the premise that scientific projects involve different types of tasks andactivities, and that teammembers’ contributions can at least, to some ex-tent, be differentiated and assessed relative to each other. However, thereare strong complementarities between contributions, and even seem-ingly minor aspects may ultimately be essential for project success. Asillustrated in the open responses to our survey, some scientists believethat efforts to differentiate author contributions are therefore futile andmay even be detrimental to collaborative efforts. This tension suggeststhe need for future conceptual and empirical work on the division of la-bor in teams, the degree to which contributions can and should bemod-ularized, and on how we can compare the value of contributions thatcritically depend upon each other. This work should also theorize andempirically evaluate potential differences across fields. Research in otherdomains such as organizational theory, the economics of bargaining, andthe sociology of teamsmay be useful for studies on these issues (18–21).
Second, it is clear that authorship andcontributiondisclosuresnotonlyreflect objective contributions but also are shaped by important social dy-namics. Although a considerable body of work has examined these issuesfor authorship (6, 7, 22), our understanding of the role of social factors inshaping contribution statements remains limited. Similarly, future work isneeded on the social dynamics that influence the adoption anduse of con-tribution statements by journals and the broader scientific community.Descriptive work such as our survey will be an important step, but futureworkmay also usefully draw on related literature on the role of status andsocial norms, cognitive biases in estimating one’s own contributions, orthe diffusion of innovations (23–26). Insights from these literaturesmay also help understand how social biases can be reduced, how con-tribution statements can bemademore informative, and how the adop-tion of improved contribution disclosures can be accelerated.
Third, although contribution disclosures report on the past, the pres-ence and design of these statements are likely to affect scientists’ futurebehaviors. For example, contribution disclosures not only convey creditfor work well done but also assign responsibility for errors and potentialmisconduct.Hence, theymay encourage greater effort to avoidmistakesand reduce the incentives for misconduct (8). However, explicit contri-bution statements may also lead scientists to crowd into activities thatare perceived to be valuedmore highly while avoiding activities that areconsidered less important or expose them to greater risks of errors.Understanding any such longer-term effects seems particularly impor-tant to gain a more holistic view of the benefits and challenges of con-tribution statements and of opportunities for improvements. Economicframeworks can be used to study these issues, but research in other
Sauermann and Haeussler, Sci. Adv. 2017;3 : e1700404 15 November 2017
areas, such as the psychology of accountability and blame,may also pro-vide useful guidance (27–30).
Implications and recommendationsNotwithstanding the need for future research on several fundamentalissues, our results suggest opportunities for improvements of contribu-tion disclosures as well as the need for discussion around specific designparameters. First, the results from both studies point to merits of a con-tributorship system that discloses information not only on the types ofcontributionsmade but also on the level of authors’ involvement in eachcontribution. Science already asks what share of a particular contribu-tion was made by each co-author (ranging from 0 to 100%), althoughthe resulting information is not publicly disclosed (Table 1). Of course,reporting this detailed information requires additional effort and mayexpose disagreements among co-authors, and reported contributionsmaynot always be accurate (see table S15).Without this detail, however,evaluators are forced to infer important aspects of the value of authors’contributions from author order, despite the considerable risk of errors.As noted in some open-ended responses to the survey, detailed contri-bution statements may also encourage more explicit discussions aboutteam members’ contributions, potentially leading to more accurate as-sessments, more transparency, and less influence of implicit assump-tions and social norms that hamper the traditional authorship system(8, 13). This may ultimately increase the likelihood that all individualteammembers—not just first and last authors—receive adequate recog-nition for their respective contributions.
Second, public discussions are needed on whether and how contri-bution disclosures can be standardized. Some journals currently askauthors to use predefined categories of contributions, but differentjournals use different categories. Other journals ask for open-endedstatements (Table 1). A standardized approach may increase theconsistency of disclosures and facilitate comparisons across journals(13, 31). It may also allow aggregation and the development ofcontribution-based indices to complement authorship-based indices(32). At the same time, a standardized approach would have to provideenough flexibility to accommodate heterogeneity across projects andfields. It should also anticipate changes to scientific activity, such asgrowing team size and specialization, automation and commoditizationof certain research activities, as well as broader participation by non-professional scientists (1, 33, 34).
Finally, several of our respondents indicated that—in their role as eva-luators—theypaid little attention to contribution statements because thesestatements are not provided in all journals, are difficult to find, and are notaggregated in mechanisms such as resumés or publication databases.Hence, editors, funding agencies, administrators, and database providersshould consider how the visibility of contribution statements can beincreased andusers’ costs of accessing andprocessing thisnew informationcan be reduced. Of course, readers may also find it easier to access andprocess contribution information as their experiencewith this relative-ly new mechanism accumulates. However, lower costs of access andinformation processingmay not increase the use of contribution state-ments significantly unless some of themore fundamental hurdles suchas a perceived lack of detail or concerns about accuracy can be addressed.
MATERIALS AND METHODS: STUDY 1DataWe analyzed data from articles published in PLOS ONE. This largeOpen Access peer-reviewed journal was started in 2006 by the Public
9 of 13

SC I ENCE ADVANCES | R E S EARCH ART I C L E
on June 9, 2018http://advances.sciencem
ag.org/D
ownloaded from
Library of Science. We obtained data for 14,602 research articles pub-lished from February 2007 to September 2011 by downloading articlexml files available on the PLOS ONE website. Because we are interestedin the relationships between contributions and author order, wedropped 233 single-authored papers, 169 papers that did not disclosethe contributions of one or more authors, 54 papers that did not use thestandard classification of contributions or listed only “other contribu-tions,” and 61 papers that did not list any authors as having “written”(because each paper needs to be written, the contribution statementsof these papers are likely incomplete). We excluded papers with morethan 14 authors (the 95th percentile) because the organization ofknowledge production may be qualitatively different in big scienceprojects (2) and because small cell sizes make analyses of very largeteams difficult. Because authorship norms may differ across fields(5, 14), we also excluded a small share of papers that do not have atleast one field categorization (see below) in the biological or lifesciences. Although Study 1 focuses on data from the biological and lifesciences, we examined potential field differences using a different dataset in Study 2 below. Overall, Study 1 analyzes data from 12,772 articlesthat list 79,776 authors.
MeasuresWe used a number of individual-level (i_) and team/article-level (t_)variables. Summary statistics are reported in table S1.Measures of contributionsWhen submitting a manuscript to PLOS ONE, authors state the partic-ular contributions made by each individual author. The journal offers atemplate with five predefined types of contributions: (i) conceived anddesigned the study (i_conceived), (ii) performed the experiments(i_performed), (iii) analyzed the data (i_analyzed), (iv) contributedreagents/materials/analysis tools (i_materials), and (v) wrote the paper(i_wrote). An open-text field “other” allows authors to list additionalcontributions that may not fall in the five predefined types. We createda dummy variable, indicating whether a particular individual was listedas havingmade some other contribution (i_other). Other contributionswere manually checked and recoded if they fell in one of the five pre-defined categories. We also created the variable i_countcontributions,which captures the total count of contributions for each author and thusthe breadth of his or her involvement in the project.
We recognize that listed contributions are imperfect measures ofthe activities performed by project participants. In particular, they donot capture work done by any “ghost authors,” individuals who madesignificant contributions but are not listed as authors (7, 22). This lim-itation also applies to authorship order and thus should not affect ourcomparisons between the two. More importantly, the listing of authorcontributions may reflect not only objective contributions but also a so-cial process of negotiation among team members, with more powerfulor accomplished team members potentially negotiating to be listed ashaving made contributions they did not actually make (there may alsobe reasons to inflate the contributions of junior members, althoughFig. 6 suggests that this is less common). Assuming that in the biologicaland life sciences, senior authors tend to be the last authors on papers(table S1), inflated contribution statements for senior authors maymean that differences in the actual contributions of first and last authorsare even greater than estimated in our analyses (whereas differences inthe actual contributions of last and middle authors may be smaller).These biases should be less problematic for our analyses of errors wheninterpreting author order because these analyses primarily focus on thedistribution of contributions for a given author position (for example,
Sauermann and Haeussler, Sci. Adv. 2017;3 : e1700404 15 November 2017
Fig. 2). Similarly, they shouldnothave a significant impact onour analysesof the relationships between contributions and team size. Nevertheless,a clearer understanding of the potential role of social factors in shapingcontribution statements will be critical for future research using thesestatements and for their actual use in the scientific community. Al-though Study 2 suggests that some of our respondents are concernedabout social influences, it also shows that contribution statements aregenerally perceived to be quite informative about actual contributions.We seek to partly address social factors through control variables as wellas additional analyses reported in the Supplementary Materials.
Despite their limitations, the contribution measures have key advan-tages over available alternatives. Most importantly, they allow insightsinto a large sample of projects, complementing previous qualitative workusing small numbers of cases (23). By using predefined categories, we ob-tained measures that are easily compared across teams while relying onthe scientists themselves (rather than less knowledgeable coders) todecidewhich categories best fit the contributions made by the various teammembers. Finally, although information about author contributionscan also be obtained through surveys distributed to individual authors,individuals may overestimate their contributions to a team effort (25).The contributions listed on published papers should be less affected bythese biases to the extent that they reflect a collective assessment by teammembers. Study 2 suggests that contribution statements tend to be col-lective decisions and approved by all authors on the majority of papers.Author positionDepending on the order of authorship, each author is coded as first, last,or middle author. Because we analyzed papers with 2 to 14 authors, allpapers have a first author and a last author, and the number of middleauthors per paper ranges from 0 to 12.Corresponding authorWe created an indicator variable that takes on the value of one if theauthor is designated as the corresponding author. Nine percent ofpapers list more than one corresponding author.ICMJE criteria fulfilledWe coded two binary variables reflecting the fulfillment of ICMJE au-thorship criteria (i_ icmjefulfilled_weak and i_ icmjefulfilled_strong).These variables are explained in more detail below.Team sizet_teamsize is a count of the number of authors on the paper.Alphabetical author orderThe indicator variable t_alphaorder equals one if the authors are listedin alphabetical order.ControlsTo account for the fact that not all papers list all six types of contribu-tions, we created the variable t_totalactivitieslisted, which indicates howmany of the six possible contributions are listed on the paper at all. Eacharticle is classified by the authors using field classifications provided byPLOS ONE, whereby an article can be classified under multiple fields.We used 34 indicator variables to control for these fields of research (forexample, f_biochemistry and f_biophysics; see table S1). We alsocontrolled for the paper’s publication date (t_published).
Social dynamics may be particularly relevant if all authors are fromthe same laboratory, potentially giving the laboratory head particularlygreat power in deciding contribution statements. Hence, we included adummy variable (t_affiliations_d), indicating whether all authors onthe paper share the same affiliation (coded as 0; 25% of the sample) ornot (coded as 1). In a robustness check reported in the SupplementaryMaterials, we also control for the quantity and quality of co-authors’prior publications.
10 of 13

SC I ENCE ADVANCES | R E S EARCH ART I C L E
on June 9, 2018http://advances.sciencem
ag.org/D
ownloaded from
Statistical analysesAuthor order and contributionsFigure 1 visualizes the relationships between author position and con-tributions for teams of six co-authors. For each author position, wecomputed the share of individuals who made a particular type of con-tribution and visualized the result by stacking the shares for all con-tribution types. For example, 94% of first authors were involved inanalyzing data, 86% were involved in performing experiments, 88%were involved in writing the paper, 80% were involved in conceivingthe study, 28% supplied materials, and 5% made other contributions.The total height of the bar is 381%, which means that the average firstauthor made 3.81 different contributions.
In table S2, we examined the correspondence between author posi-tion and contributions using the full sample by regression analysis. SEsare clustered at the level of the article. All regressions include a numberof control variables, such as team size and detailed field fixed effects.Note that these and subsequent regressions examine differences inthe contributions made by authors listed in different positions andare purely correlational in nature. The objective is to explore the degreeto which author position allows observers to infer or “predict” the num-ber or types of authors’ contributions. These regressions are not de-signed to examine the causal nature of any observed relationships; inparticular, we donot seek to determinewhether particular contributions“cause” individuals to be placed in particular positions on the byline.
We also explored to what extent author order informs about certaincombinations of contributions. In a first step, we performed a factoranalysis (using promax rotation) to examine which contributions tendto co-occur as sets. This approach shows two factors. The contributionsthat clearly load on factor one are conceived (rotated factor loading,0.81), wrote (0.85), and—less strongly—analyzed (0.57). Factor twoconsists of performed (0.79) and analyzed (0.37). In a second step, weestimated three additional regression models using these commoncombinations of contributions as dependent variables (table S2, models8 to 10). Model 8 shows whether an author conceived&wrote (the de-pendent variable is one for authors who have made at least these twocontributions and is zero for authors without this combination of con-tributions),model 9 uses conceived&wrote&analyzed, andmodel 10usesperformed&analyzed. Last authorship ismost strongly associated withconceived&wrote, whereas first authorship is most strongly associatedwith conceived&wrote&analyzed. The latter finding is consistent withour earlier observation that first authors typically have the highest countof contributions (table S2, model 1).Corresponding authorsTable S5 shows the relationshipsbetweenauthorpositionandcorrespond-ing author status. Corresponding authors are more likely to also be lastauthors (59%) or first authors (32%) than middle authors (9%).
Regressions reported in table S6 examine how corresponding author-ship is related to the count of contributions (model 1) and to the likeli-hood that an author made particular contributions (models 2 to 7). Evencontrolling for author order (first, middle, and last), correspondingauthors are involved in a broader range of activities, particularlyconceptual activities and writing.Models 8 to 10 show that the additionalcontribution count for corresponding authors is particularly large amongmiddle authors (who are generally less likely to be corresponding authors;see table S5).Deviations from conventionsWe examined how reliably author position informs about authors’ con-tributions relative to each other. We started from two empiricalconventions observed in table S2: First authors tend to have broader
Sauermann and Haeussler, Sci. Adv. 2017;3 : e1700404 15 November 2017
involvement in the project (higher contribution count) than lastauthors, and last authors have broader involvement than middleauthors. We then examined how many papers with at least threeauthors deviate from these conventions in that first authors have a lowercontribution count than last authors or that last authors have a lowercontribution count than at least one of the middle authors. Results arediscussed in the main text.Contributions and team sizeWe regressed the count of contributions and individual contributionmeasures on a series of team size dummies as well as article controls.These regressions were estimated separately for first, middle, last, andcorresponding authors (tables S8 and S9). We see that authors in largerteams tend to have a lower count of contributions, consistent withincreasing specialization in larger teams. Similarly, the likelihood thatfirst, middle, and last authors have made particular contributions alsodepends on the size of the team.Reliability of inferences by team sizeFigure 2A plots for each author position the SD of individuals’ count ofcontributions against team size, showing an increase with team size es-pecially for first authors. Figure 2B shows the share of papers deviatingfrom the conventions that first authors have a higher contribution countthan last authors and last authors have a higher contribution count thanmiddle authors by team size. The share of papers deviating from theconventions increases with team size. Both panels highlight that infer-ences about the breadth of authors’ contributions based on author po-sition will have a higher error rate in larger teams.Fulfillment of ICMJE authorship criteriaAccording to the ICMJE, authorship requires that an individual fulfill allfour of the following criteria: (i) substantial contribution to conceptionand design, acquisition of data, or analysis and interpretation of data;(ii) drafting the article or revising it critically for important intellectualcontent; (iii) final approval of the version to be published; and (iv) agree-ment to be accountable for all aspects of the work in ensuring thatquestions related to the accuracy or integrity of any part of the workare appropriately investigated and resolved. Because criteria (iii) and(iv) are not observed in the data, we focused on criteria (i) and (ii).
On the basis of each author’s stated contributions, we coded twobinary variables indicating whether the ICMJE criteria for authorshipare fulfilled. The first variable—i_icmjefulfilled _strong—uses a strictinterpretation and is coded as 1 if an author was involved in writingthe paper and at least one of the following: conceived, performed, ana-lyzed. The second variable—i_icmjefulfilled _weak—is coded as 1 if anauthor was involved in writing the paper and at least one of thefollowing: conceived, performed, analyzed, materials. It is also codedas 1 if an author is listed with an “other” contribution because thismay include aspects that satisfy the ICMJE criteria. The share of authorsfulfilling the requirements in the strong interpretation is 44%and that inthe weak interpretation is 52%.
Figure 3 shows the share of authors in each position who fulfill theICMJE criteria using the weak (that is, more permissive) interpretationby team size. Table S10 shows regressions of the two variables on authorposition and team size.
MATERIALS AND METHODS: STUDY 2Sample and survey developmentWe surveyed corresponding authors on recent papers in PLOS ONEand PNAS. PNAS provides a useful complement to PLOS ONE becauseit is a traditional journal (started in 1915) that consistently publishes
11 of 13

SC I ENCE ADVANCES | R E S EARCH ART I C L E
on June 9, 2018http://advances.sciencem
ag.org/D
ownloaded from
high-impact work and ranks in the top 5 of interdisciplinary sciencesjournals (Table 1).Moreover, PNAS publishes research across a broaderrange of fields than PLOS ONE, allowing us to explore potential differ-ences across fields. Unlike Science or Nature, PNAS makes article andauthor information publicly available, allowing us to use this journal inthe current study. Because PNAS does not use standardized contribu-tion statements, we were not able to replicate Study 1 using PNAS data.The survey was approved by the Georgia Institute of Technology Insti-tutional Review Board (IRB #H17208).
To obtain the initial sample of PLOSONE authors, we scraped thePLOSONEwebsite anddownloaded article information andcorrespond-ing author names and email addresses for all articles published betweenJanuary 2016 andApril 2017.After removingduplicate contacts, we ran-domly selected 17,000 of these corresponding authors for our survey.ForPNAS (which publishes fewer papers thanPLOSONE), we collectedcontact information for papers published between January 2014 andApril 2017 and randomly selected 10,000 corresponding authors for thisstudy.
We pretested the survey in direct interactions with individual scientistsand revised according to their feedback.We then piloted the surveywith4000 of thePLOSONE corresponding authors. The pilot survey resultedin the addition and removal of some questions but is otherwise identicalwith the main survey; we used the combined data where possible.
We invited the corresponding authors to participate in an onlinesurvey implemented using the software suite Qualtrics between Mayand July 2017. Respondents were offered to be entered into a drawingof Amazon gift certificates and received a personalized invitation as wellas up to three reminders.We received 3980 usable responses fromPLOSONE authors and 2448 from PNAS authors, which correspond to re-sponse rates of 23.41 and 24.48%, respectively (not adjusting for un-deliverable emails). These response rates are comparable to otherrecent online survey efforts (35). To analyze nonresponse, we examinedthe relationships between response status and key variables coded fromthe original articles (see thenext section).Compared to authors onarticlesin the biological/life sciences, we found significantly higher response ratesamong social scientists and in “other” fields. Corresponding authors fromsmaller teams are more likely to respond than those from larger teams.The response rate is lower for authors on older articles, likely reflectingthat contact information on older articles is more likely to be outdated.Corresponding authors who are first authors on the focal paper were sig-nificantly more likely to respond than those who are second or last au-thor. Finally, PNAS authors weremore likely to respond than PLOSONEauthors. To address these differences in response rates, we reporteddescriptive statistics separately by field and author status in table S11,and we additionally estimated regression models with the relevant con-trol variables.
For this study, we dropped responses from corresponding authorsonsingle-authoredpapers (n=64)andonpaperswithmore than14authors(n = 362), leaving a final sample of 6002 responses. The sample size forsome questions is smaller because not all respondents answered eachquestion, and the respondents to the pilot did not receive some of thequestions included in the final survey. Table S11 shows descriptive sta-tistics for all variables for the full sample, as well as by major field, byjunior versus senior status of the respondent, and by journal.
Measures (if not discussed in the results section)FieldPNAS papers list up to two field classifications using the major fields ofbiological sciences, physical sciences, and social sciences as well as more
Sauermann and Haeussler, Sci. Adv. 2017;3 : e1700404 15 November 2017
detailed subfieldswithin. For our analyses, we classified papers using thefirst listed broad field. More than 85% of PNAS respondents were onpapers that were classified using only one of the broad field classifica-tions. PLOS ONE papers include a list of very specific “subject areas.”Using a classification tree available on the PLOS ONE website, we re-lated these subject areas back to their major “root” fields, includingbiological/life sciences, medical/health sciences, physical sciences, socialsciences, as well as “other” fields (for example, earth sciences, engineer-ing and technology, and research methods). For this study, we used themajor root field of the first listed subject area.Junior versus senior statusIn the module that asked respondents about the particular paper fromwhich their contact information was obtained, we asked “At the time ofthe publication of this paper (date of publication), which of thefollowing best describes your position?,” with options including “PhDor undergraduate student,” “Postdoc,” “Faculty member but not labhead,” “Faculty member and lab head,” and “Other (please specify).”For some comparisons, we collapsed PhDs and Postdocs into thecategory “Junior scientist” andboth types of facultymembers into “Seniorscientist.”Team sizeTeam size is the number of authors listed on the focal publication.Article ageArticle age is computed as the difference between the publication date ofthe youngest article included in the data set (published on 12 April2017) and the publication date of the focal article, in days.Remember this paperIn the module that asked respondents about the particular paper fromwhich their contact information was obtained, we asked “How well doyou remember your work on this paper?,” with options including “Notat all,” “Somewhat,” “Quite well,” and “Very well.”
Regression analysesOur regressions include full sets of controls as shown in tables S12 andS13. Regressions were estimated using either ordered logit or multino-mial logit regressions, as indicated in the table headings. SEs are robustto heteroscedasticity.
SUPPLEMENTARY MATERIALSSupplementary material for this article is available at http://advances.sciencemag.org/cgi/content/full/3/11/e1700404/DC1Supplementary Textfig. S1. Team members and their respective contributions (schematic).fig. S2. Distribution of the count of contributions by position (teams of six).fig. S3. Count of contributions by team size.fig. S4. Share of authors who fulfill ICMJE authorship criteria.table S1. Summary statistics for Study 1.table S2. Authorship positions and contributions.table S3. Authorship and contributions for teams with 2, 6, and 10 authors.table S4. Incidence of alphabetical authorship.table S5. Authorship position and corresponding author status.table S6. Corresponding author status and contributions.table S7. Predicted likelihood of particular contributions and predicted contribution counts.table S8. Author contributions by position and team size.table S9. Types of contributions by position and team size.table S10. ICMJE authorship criteria fulfilled by position and team size.table S11. Summary statistics for Study 2.table S12. Regression analyses of survey responses on general opinions regarding contributionstatements.table S13. Regression analyses of survey responses on specific articles.table S14. Illustrative responses to the question “Why would you not pay more attention tocontribution statements?”
12 of 13

SC I ENCE ADVANCES | R E S EARCH ART I C L E
table S15. Illustrative responses to the question “Do you have any other comments on thistopic that you would like to share? How do you think contribution statements could beimproved?”table S16. Authorship positions and contributions controlling for quantity and quality ofprevious publications.table S17. Authorship positions and contributions using data from papers in the top 10% ofarticle impact (citations).References (36–38)
on June 9, 2018http://advances.sciencem
ag.org/D
ownloaded from
REFERENCES AND NOTES1. S. Wuchty, B. F. Jones, B. Uzzi, The increasing dominance of teams in the production of
knowledge. Science 316, 1036–1039 (2007).2. P. Stephan, How Economics Shapes Science (Harvard University Press, 2012).3. S. M. Fiore, Interdisciplinarity as teamwork: How the science of teams can inform team
science. Small Group Res. 39, 251–277 (2008).4. B. A. Weinberg, J. Owen-Smith, R. F. Rosen, L. Schwarz, B. M. Allen, R. E. Weiss, J. Lane,
Science funding and short-term economic activity. Science 344, 41–43 (2014).5. B. Maciejovsky, D. V. Budescu, D. Ariely, The researcher as a consumer of scientific
publications: How do name-ordering conventions affect inferences about contributioncredits? Market. Sci. 28, 589–598 (2009).
6. A. Marušić, L. Bošnjak, A. Jerončić, A systematic review of research on the meaning, ethicsand practices of authorship across scholarly disciplines. PLOS ONE 6, e23477 (2011).
7. C. Haeussler, H. Sauermann, Credit where credit is due? The impact of project contributionsand social factors on authorship and inventorship. Res. Policy 42, 688–703 (2013).
8. D. Rennie, V. Yank, L. Emanuel, When authorship fails: A proposal to make contributorsaccountable. JAMA 278, 579–585 (1997).
9. T. Bates, A. Anić, M. Marušić, A. Marušić, Authorship criteria and disclosure ofcontributions: Comparison of 3 general medical journals with different authorcontribution forms. JAMA 292, 86–88 (2004).
10. M. Biagioli, in Scientific Authorship—Credit and Intellectual Property in Science, M. Biagioli,P. Galison, Eds. (Routledge, 2003), pp. 253–279.
11. J. Bohannon, Who’s afraid of peer review? Science 342, 60–65 (2013).12. V. Yank, D. Rennie, Disclosure of researcher contributions: A study of original research
articles in The Lancet. Ann. Intern. Med. 130, 661–670 (1999).13. L. Allen, J. Scott, A. Brand, M. Hlava, M. Altman, Publishing: Credit where credit is due.
Nature 508, 312–313 (2014).14. M. Engers, J. S. Gans, S. Grant, S. P. King, First-author conditions. J. Polit. Econ. 107,
859–883 (1999).15. ICMJE, http://www.icmje.org/recommendations/browse/roles-and-responsibilities/
defining-the-role-of-authors-and-contributors.html (Archived prior versions: http://www.icmje.org/recommendations/archives/) (2010), vol. 2010.
16. S. Wood, in Heartwire News, https://www.medscape.com/viewarticle/708781 (2009).17. R. H. Moorman, P. M. Podsakoff, A meta-analytic review and empirical test of the
potential confounding effects of social desirability response sets in organizationalbehavior research. J. Occup. Organ. Psychol. 65, 131–149 (1992).
18. E. von Hippel, Task partitioning: An innovation process variable. Res. Policy 19, 407–418(1990).
19. S. Shibayama, Y. Baba, J. P. Walsh, Organizational design of university laboratories: Taskallocation and lab performance in Japanese bioscience laboratories. Res. Policy 44,610–622 (2015).
20. B. H. Hamilton, J. A. Nickerson, H. Owan, Team incentives and worker heterogeneity: Anempirical analysis of the impact of teams on productivity and participation. J. Polit. Econ.111, 465–497 (2003).
21. C. Haeussler, L. Jiang, J. Thursby, M. Thursby, Specific and general information sharingamong competing academic researchers. Res. Policy 43, 465–475 (2014).
Sauermann and Haeussler, Sci. Adv. 2017;3 : e1700404 15 November 2017
22. F. Lissoni, F. Montobbio, L. Zirulia, Inventorship and authorship as attribution rights:An enquiry into the economics of scientific credit. J. Econ. Behav. Organ. 95, 49–69(2013).
23. J. Owen-Smith, Managing laboratory work through skepticism: Processes of evaluationand control. Am. Sociol. Rev. 66, 427–452 (2001).
24. R. K. Merton, The Sociology of Science: Theoretical and Empirical Investigations (Universityof Chicago Press, 1973).
25. M. Ross, F. Sicoly, Egocentric biases in availability and attribution. J. Pers. Soc. Psychol. 37,322–336 (1979).
26. E. M. Rogers, Diffusion of Innovations (Free Press, ed. 5, 2003).27. N. Lacetera, L. Zirulia, The economics of scientific misconduct. J. Law Econ. 27, 568–603
(2011).28. C. Prendergast, The provision of incentives in firms. J. Econ. Lit. 37, 7–63 (1999).29. J. S. Lerner, P. E. Tetlock, Accounting for the effects of accountability. Psychol. Bull. 125,
255–275 (1999).30. M. D. Alicke, Culpable control and the psychology of blame. Psychol. Bull. 126, 556–574
(2000).31. A. Marušić, T. Bates, A. Anić, M. Marušić, How the structure of contribution disclosure
statements affects validity of authorship: A randomized study in a general medicaljournal. Curr. Med. Res. Opin. 22, 1035–1044 (2006).
32. J. E. Hirsch, An index to quantify an individual’s scientific research output. Proc. Natl. Acad.Sci. U.S.A. 102, 16569–16572 (2005).
33. R. Bonney, J. L. Shirk, T. B. Phillips, A. Wiggins, H. L. Ballard, A. J. Miller-Rushing, J. K. Parrish,Next steps for citizen science. Science 343, 1436–1437 (2014).
34. J. N. Cummings, S. Kiesler, Organization theory and the changing nature of science.J. Organ. Des. 3, 1–16 (2014).
35. H. Sauermann, M. Roach, Increasing web survey response rates in innovation research: Anexperimental study of static and dynamic contact design features. Res. Policy 42, 273–286(2013).
36. G. Laudel, Collaboration and reward: What do we measure by co-authorships? Res. Eval.11, 3–15 (2002).
37. M. K. Wagner, A. Dodds, M. B. Bundy, Psychology of the Scientist: LXVII. Assignment ofauthorship credit in psychological research. Psychol. Rep. 74, 179–187 (1994).
38. B. Latour, S. Woolgar, Laboratory Life: The Social Construction of Scientific Facts (Sage,1979).
AcknowledgmentsFunding: The authors acknowledge that they received no external funding in support of thisresearch. Author contributions: Conceived the study: H.S. (50%) and C.H. (50%); collectedPLOS ONE article data: H.S. (100%); collected Scopus data on authors’ previous publications:C.H. (100%); analyzed PLOS ONE data: H.S. (50%) and C.H. (50%); developed and implementedsurvey: H.S. (70%) and C.H. (30%); analyzed survey data: H.S. (100%); wrote the paper: H.S.(70%) and C.H. (30%). Competing interests: The authors declare that they have no competinginterests. Data and materials availability: The data needed to evaluate the conclusions in thepaper are presented in the paper and the Supplementary Materials. IRB protocol requiredparticipant confidentiality and nondisclosure of individual-level data. Scopus data can beobtained under the same conditions and as described by authors for this study. Interestedreaders should direct questions regarding the data to the corresponding author.
Submitted 7 February 2017Accepted 18 October 2017Published 15 November 201710.1126/sciadv.1700404
Citation: H. Sauermann, C. Haeussler, Authorship and contribution disclosures. Sci. Adv. 3,e1700404 (2017).
13 of 13
Authorship and contribution disclosuresHenry Sauermann and Carolin Haeussler
DOI: 10.1126/sciadv.1700404 (11), e1700404.3Sci Adv
ARTICLE TOOLS http://advances.sciencemag.org/content/3/11/e1700404
MATERIALSSUPPLEMENTARY http://advances.sciencemag.org/content/suppl/2017/11/06/3.11.e1700404.DC1
REFERENCES
http://advances.sciencemag.org/content/3/11/e1700404#BIBLThis article cites 31 articles, 5 of which you can access for free
PERMISSIONS http://www.sciencemag.org/help/reprints-and-permissions
Terms of ServiceUse of this article is subject to the
registered trademark of AAAS.is aScience Advances Association for the Advancement of Science. No claim to original U.S. Government Works. The title
York Avenue NW, Washington, DC 20005. 2017 © The Authors, some rights reserved; exclusive licensee American (ISSN 2375-2548) is published by the American Association for the Advancement of Science, 1200 NewScience Advances
on June 9, 2018http://advances.sciencem
ag.org/D
ownloaded from