authors: anton bekkerman, assistant professor of...
TRANSCRIPT
Title: A Bayesian Learning Approach to Estimating Unbalanced Spatial Panel Models
Authors:
Anton Bekkerman, Assistant Professor of Economics, Dept of Agricultural Economics and Economics, Montana State University, PO Box 172920, Bozeman, MT 59717-2920. Mykel Taylor, Assistant Professor of Economics, Dept of Agricultural Economics, Kansas State University, 342 Waters Hall, Manhattan, KS 66506-4011
Selected Paper prepared for presentation for the 2015 Agricultural & Applied Economics Association and Western Agricultural Economics Association Annual Meeting, San Francisco, CA, July 26-28.
Copyright 2015 by Bekkerman and Taylor. All rights reserved. Readers may make verbatim copies of this document for non-commercial purposes by any means, provided this copyright notice appears on all such copies.
1
A Bayesian Learning Approach to Estimating Unbalanced Spatial Panel Models
Highly competitive grain commodity markets create incentives for agribusinesses handling grain
to use a variety of strategies for reducing variable cost margins. Shuttle train-loading elevators—
high-capacity, high-speed grain loading facilities—are a recent example of agribusinesses
adopting technologies that improve efficiency and attempt to capture market share. These
facilities provide improved rail rates, guaranteed railcar availability, and attract grain from
further distances, which has spurred agribusinesses to upgrade existing elevators and build new
shuttle-loading facilities across the Great Plains (Bekkerman 2013; Kowalski 2014).
If shuttle-loading facilities reduce the marginal costs of handling a bushel of grain and
grain elevators operate in a competitive market, then it seems plausible that some portion of
those savings will be passed on to grain producers in the form of stronger basis bids (i.e., higher
cash prices). A quantitative test of the level of cost savings pass-through to farmers requires cash
bid data from elevators across both space and time. Grain elevators compete for grain in space,
but must also adjust their pricing strategies across time if competition from other elevators
changes. The amount of any change in basis bids to farmers from reduced transportation costs
incurred by elevators will be a function of both the amount of the transportation cost savings and
the level of competition faced by new entrants in the grain handling industry.
This study measures the systematic impacts of shuttle-loading elevators on local wheat
basis in Kansas and Montana. These states were selected because they are large wheat producing
areas, there has been substantial recent growth in the number of shuttle-loading elevators in both
states, and agribusinesses continue to explore building additional high-speed grain handling
facilities. To identify differences that can be attributed to alternative loading technologies, we

2
model daily nearby basis bid data between January 2004 and July 2013 (2,554 time periods) for
267 Kansas and 30 Montana locations. Due to unsystematic missing observations and/or entry or
exit of elevators throughout the time window, these data represent a large unbalanced spatial
panel. Existing spatial panel estimation methods are mostly intended for balanced panel data, but
are not effective for unbalanced panel because of the computational burden associated with
inverting a large spatial weighting matrix.
We propose an alternative approach that provides an efficient, computationally tractable
method for estimating unbalanced spatial panel models. Using a dynamic Bayesian network
method, we develop an iterative process by which large, unbalanced spatial panel models can be
estimated. Preliminary results indicate that shuttle-loading facilities command a small price
premium in Kansas and a slightly larger premium in Montana. The estimation also helps glean
insights about spatio-temporal responses to market shocks across space and time, helping
provide inferences about the breadth and speed of market information transfer.
Background on Basis and Shuttle-Loaders
Knowledge about basis is important to both farmers and grain merchandizers, helping inform
them of market information regarding returns to storage, local and downstream demand, and
changing costs of transportation. Accurately predicting basis can, therefore, help reduce risk
exposure, develop efficient marketing strategies, and hedge variability in grain prices. Many
previous studies of basis behavior have focused on two related areas—improving basis
prediction and determining factors that help explain variation in basis—but have not explored the
empirical effects of grain handling technologies on observed basis values.
3
Local basis behavior has typically been categorized as having intertemporal and spatial
determinants as well as being affected by changes in public policy and the marketing
environment. Intertemporal costs are comprised of the carrying costs of storing grain, which
include storage costs (on-farm and commercial), demand for grain (e.g. flow), and interest costs
of holding grain rather than selling it. Garcia and Good (1983) provide a thorough review of the
theory underlying the intertemporal impacts on basis. In addition to analyzing intertemporal
relationships, a number of studies demonstrate that wheat basis can be affected by changes in the
market structure, including adjustments to loan deficiency payments, introduction of ethanol
plants, unanticipated variation in protein content of grain produced in a particular region, and
increased transportation costs (Dykema, Klein, and Taylor 2002; Martin, Groenewegen, and
Pigeon 1980; Jiang and Hayenga 1997).
The literature has paid less attention, however, to the theory of spatial factors, which is
likely due to the general consensus that spatial differences in basis are driven by variation in
transportation costs (Strobl, Fortenbery, and Fackler 1992). However, other research suggests
that there may be significant impacts on basis from local demand centers, such as ethanol plants
in certain areas of the country (McNew and Griffith 2005). This more recent research suggests
that demand-side factors associated with differences in grain delivery facilities could also be
important determinants of spatial variation in basis bids.
Fortenbery, Zapata, and Kunda (1993) found that shuttle-loading facilities did not pass
through the transportation cost savings to farmers. The authors used corn basis levels from 1980
to 1992. This time period is very important because it followed the 1980 Staggers Act, which
deregulated the rail road industry and greatly impacted grain shipping through changes in freight
rates. One result of the deregulation was an increase in the number of shuttle-loader facilities,
4
which could now take advantage of lower freight rates. Using harvest time basis levels at 16
Corn Belt locations, the authors estimated a spatio-temporal error component model that used
elevator concentration measures to determine whether grain companies were able to capture
decreased transportation savings rather than passing them on to farmers. The study found no
adverse price impacts from deregulation, with basis improvements (i.e., higher cash prices to
farmers) more common for locations with less elevator concentration prior to deregulation.
Hauser, Jeffrey, and Baumel (1984) similarly analyzed the period following the Staggers
Act, with a focus on shuttle-loading facilities in Iowa and Nebraska. In Iowa, the marketing
landscape was relatively saturated with large capacity 25- and 50-car loading facilities prior to
the Staggers Act deregulation, while Nebraska had relatively few of these facilities and presented
greater entry opportunities. Using a mathematical programming model to estimate the implicit
(shadow) prices of shuttle-loader facilities, the author estimated larger shadow prices for
Nebraska than Iowa, suggesting possible improvements in local basis were likely to occur in
areas with fewer existing shuttle-loading facilities.
The majority of shuttle-loading elevators were built in the largest grain production states
of Illinois and Iowa following the Staggers Act. Expansion into the wheat-production regions did
not begin until the 2000’s when a combination of higher wheat yields and faster harvest times
translated to greater demand for efficiency at elevators (Kowalski 2014). Shuttle-loaders have
also expanded into the northern Great Plains and Pacific Northwest as international agribusiness
firms continue to invest in facilities to assure a steady supply of grain to Asian markets
(Bekkerman 2013). The present study contributes to the existing literature by measuring direct
impacts of transportation cost savings of shuttle-loaders on local basis bids, and therefore prices

5
received by farmers, giving a more complete picture of the effects of grain handling technology
investments by agribusinesses.
Data Description
To quantify the impacts of shuttle-loader elevators on winter wheat basis levels, a panel dataset
of daily cash and futures prices was assembled for 297 locations in Kansas and Montana over the
2005 to 2013 period. Cash prices were obtained from the DTN historical database for all Kansas
elevators and for the majority of elevators and days in Montana. The remaining prices for
Montana were obtained from Cash Grain Bids, Inc. Cash prices represent hard red winter wheat
with a protein content of 11% for Kansas and ordinary (10% or less), 11%, 12%, and 13%
protein content for Montana wheat. Montana grain prices were averaged across the protein levels
to calculate a single winter wheat price for each day and elevator.1 Futures prices for the nearby
(closest contract to expiration at a given point in time) and harvest (July) hard red winter wheat
contracts traded on the Kansas City Board of Trade (KCBT), as well as implied volatilities for
the nearby contracts, were collected from Bloomberg.2 Using the cash and futures prices, the
nearby basis levels were calculated by subtracting the futures price from the cash price.3
Additional information about the elevators in the panel dataset was gathered from a
variety of sources. The ability of an elevator to load shuttle trains was determined by directly
1 While DTN historical databases only report prices for 11%, 12%, and 13% protein level winter wheat marketed in Montana, Cash Grain Bids, Inc. report prices for these protein levels and the ordinary protein level. Because elevators discount lower protein content wheat, the average price is expected to be higher when the ordinary protein level wheat price is excluded. However, the difference is expected to be relatively constant across time and elevators within a common marketing environment (Bekkerman, unpublished data representing Montana elevator protein discount schedules for 22 locations between 2011 and 2013) and can be accounted for using an indicator variable in an empirical specification. 2 The rollover date for the nearby contract was defined as the first day of the month that the nearby contract was due to expire. 3 It should be noted that cash bids collected in this manner represent offer prices to buy grain and do not necessarily imply that grain was transacted at these prices for every elevator on every day.

6
contacting individual elevators and from state and federal elevator licensing records, railroad
websites, news releases, and the Kansas Grain and Feed Association’s Annual Directory. For
each elevator reported to be a shuttle-loader, the year in which they began loading shuttle trains
was also recorded. Other elevator characteristics were similarly collected and include
information about rail line access, business structure (cooperative or investor-owned firm), and
licensed grain holding capacity.
Table 1 provides the descriptive statistics of select variables by state and shuttle-loading
capability. The descriptive statistics show that Montana has fewer elevators than Kansas, but the
proportion of shuttle-loaders to conventional elevators is higher in Montana than in Kansas. The
average capacity of Kansas elevators is approximately 2.5 times larger than the capacity of
Montana elevators, but in both states, the grain storage capacity of shuttle-loaders averages five
times more than conventional elevators. Interestingly, shuttle-loading facilities in both states are
largely privately owned, while conventional elevators are more likely to be operated by a
cooperative. The differences between types of grain handling facilities and markets across the
two states suggests possible variation in the marketing strategies of elevators in the data, which is
likely to be reflected by differences in observed basis.
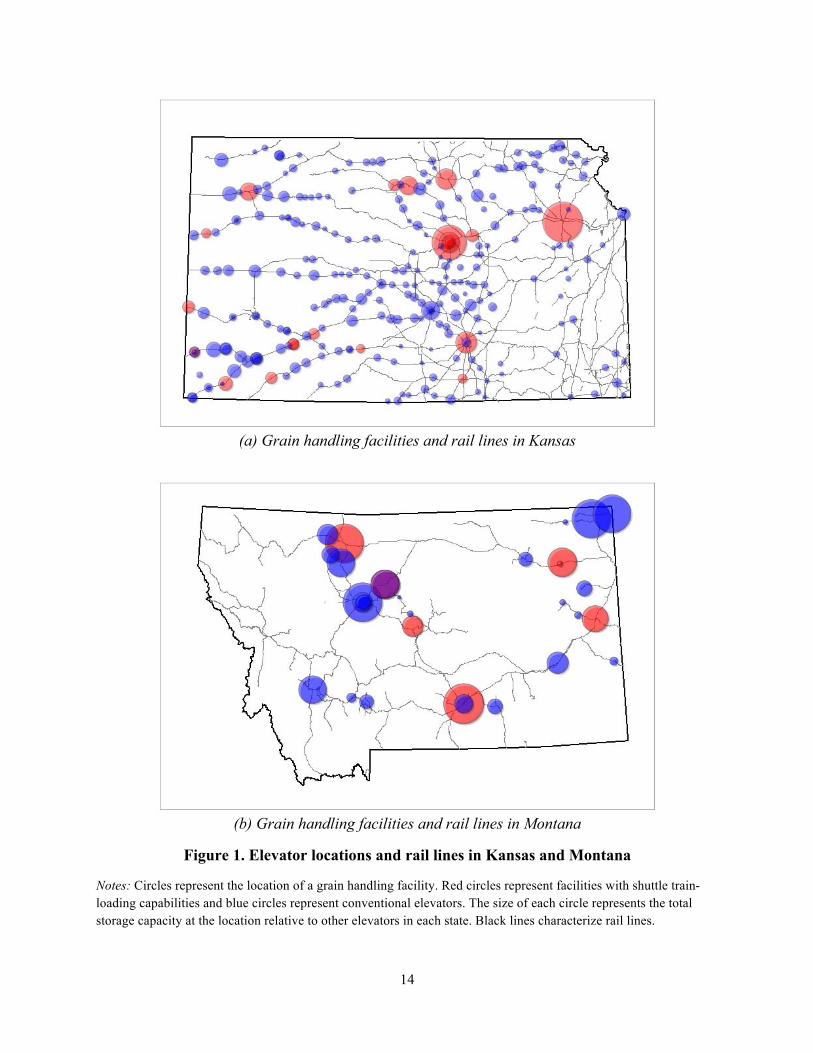
Figure 1 provides a visual representation of all the Kansas and Montana elevators in the
in the data. Shuttle-loader elevators are represented by red circles and conventional elevators are
blue. The size of each circle corresponds to an elevator's licensed grain storage capacity, with
larger circles representing greater capacity relative to other elevators in the state (not across
states). The lines on the map represent rail lines in each state. While all the elevators are located

7
near the rail lines, not every elevator is built close enough to have rail-side access.4 A visual
comparison of the two maps indicates that Kansas has many elevators that are densely clustered
as well as an expansive railroad network. Montana has a sparser rail line distribution and fewer
facilities. However, many of these facilities have relatively large storage capacities.
Modeling Strategy
We follow Anselin, Le Gallo, and Jayet (2008) in specifying a spatial panel data model that
accommodates interactions among spatial units across time. Within this structure, we model
variation in nearby basis as
𝒃 = 𝜆 𝑰! ⊗𝑾! 𝒃+ 𝑿𝜷+ 𝜾𝒕⊗ 𝑰𝒏 𝝅+ 𝝆 𝑰𝒕⊗𝑾𝒏 𝝂+ 𝒖, (1)
where the term 𝒃 represents an 𝑁𝑇×1 vector of nearby basis observations; 𝑿 is a matrix of
explanatory variables, including a binary indicator that indicates whether an elevator has shuttle-
loading capabilities, observed basis from the preceding week, observed basis from the
corresponding weekday of the preceding year, implied volatility of the nearby Kansas city Board
of Trade winter wheat futures contract, and a binary variable indicating whether the cash price
data were obtained from the DTN historical database or Cash Grain Bids, Inc.; 𝑰 is an identity
matrix; 𝑾𝒏 is a spatial weights matrix in which the weights are represented by the inverse
distance between location i and j, and 𝜆 is a vector of spatial autoregressive parameters. The term
𝜺 in equation (1) is specified as a combination of, 𝜾𝒕⊗ 𝑰𝒏 𝝅, a matrix of time-invariant effects
where 𝜾𝒕 is a vector ones and 𝝅 is a vector of elevator-specific indicators; a spatial error
component, 𝝆 𝑰𝒕⊗𝑾𝒏 𝝂, where 𝜌 < 1 is a spatial error autoregressive parameter and 𝜈 is
spatially correlated error term; and 𝒖, an i.i.d. white noise term.
4 Rail-side access refers to an elevator built close enough to the rail line that grain can be loaded directly from storage into a rail car.

8
In a random effects model, for example, 𝜋! ∼ 𝐼𝐼𝐷 0,𝜎!! and Mutl and Pfaffermayr
(2011) derive the covariance matrix for the spatially correlated disturbance term 𝜀 to be
𝜴𝜺 = 𝑰𝒕⊗ 𝑰𝒏 − 𝝆𝑾𝒏!! 𝜴𝝂 𝑰𝒕⊗ 𝑰𝒏 − 𝝆𝑾𝒏
!! , (2)
where 𝜴𝝂 = 𝜎!! 𝑰𝒕 −𝜾𝒕𝜾𝒕!𝒕
⊗ 𝐼! + 𝜎!! + 𝑡𝜎!!𝜾𝒕𝜾𝒕!𝒕⊗ 𝑰𝒏 . Anselin’s (1988) general formula for
deriving the log-likelihood function for this estimator is used to determine the specific log-
likelihood function for the random effects spatial panel model. Millo and Piras (2012) describe
the method for estimating the parameters 𝜆, 𝜌, 𝜎!!, 𝜎!!, 𝜎!!, and 𝛽 by iterating between
generalized least squares and concentrated likelihood procedures until a convergence criteria is
satisfied.
Equation (2) shows that the spatial weighting matrix has a key role in estimating the
covariance matrix for a spatial panel model. When data represent a balanced panel, the same
spatial relationship among locations exists in each period, which allows the weighting matrix to
be simplified to 𝑁×𝑁 dimensions. In this case, even with a relatively large number of cross
sections, the computational burden for inverting the matrix 𝑰𝒏 − 𝝆𝑾𝒏 is relatively small. To
our knowledge, these panel data structures represent the empirical applications of spatial panel
estimators in the literature.
In an unbalanced panel, however, there is a different spatial relationship for each time
period, requiring the weighting matrix to have dimensions 𝑛𝑡×𝑛𝑡. The covariance matrix 𝜴𝜺
becomes
𝜴𝜺 = 𝑰𝒏𝒕 − 𝝆𝑾𝒏𝒕!! 𝜴𝝂 𝑰𝒏𝒕 − 𝝆𝑾𝒏𝒕
!! . (3)
With a very small number of cross sections and time periods, this may not present many
computational issues. When there are many cross-section units and time periods (e.g., in higher
frequency data), however, the computational burden becomes excessive and the estimation
9
frequently fails. In this study, using daily data requires inverting a 629,586×629,586 matrix for
Kansas and a 70,740×70,740 matrix for Montana.
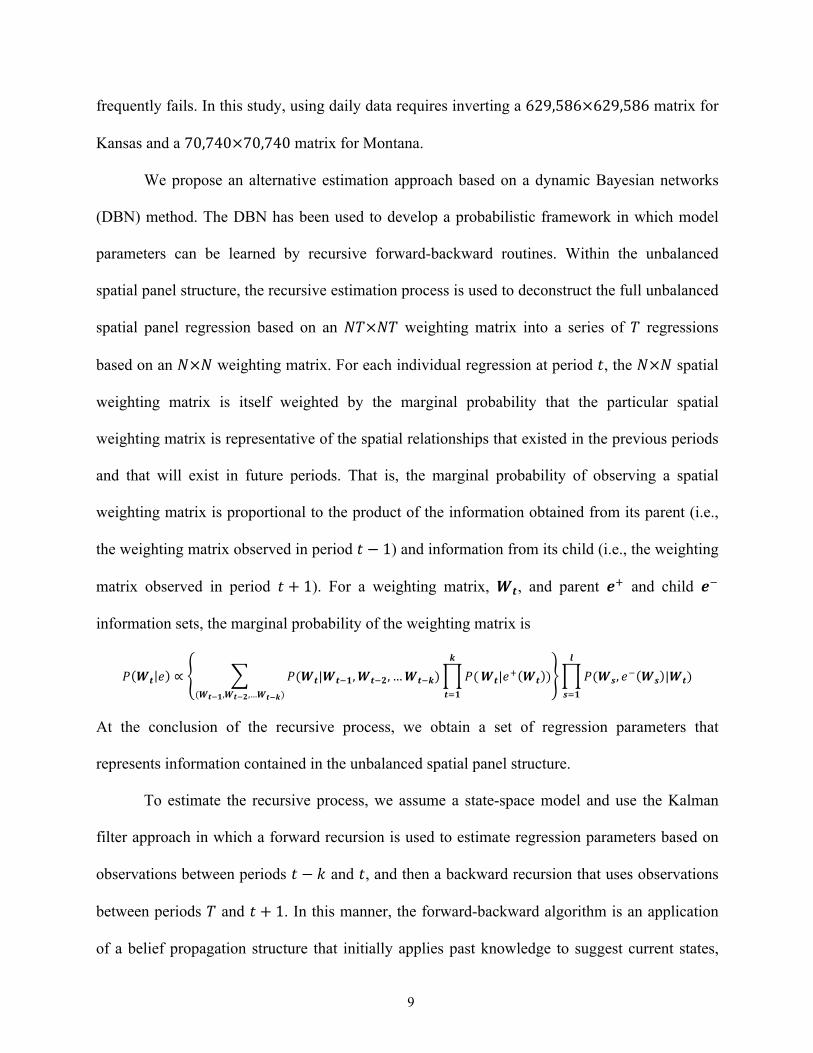
We propose an alternative estimation approach based on a dynamic Bayesian networks
(DBN) method. The DBN has been used to develop a probabilistic framework in which model
parameters can be learned by recursive forward-backward routines. Within the unbalanced
spatial panel structure, the recursive estimation process is used to deconstruct the full unbalanced
spatial panel regression based on an 𝑁𝑇×𝑁𝑇 weighting matrix into a series of 𝑇 regressions
based on an 𝑁×𝑁 weighting matrix. For each individual regression at period 𝑡, the 𝑁×𝑁 spatial
weighting matrix is itself weighted by the marginal probability that the particular spatial
weighting matrix is representative of the spatial relationships that existed in the previous periods
and that will exist in future periods. That is, the marginal probability of observing a spatial
weighting matrix is proportional to the product of the information obtained from its parent (i.e.,
the weighting matrix observed in period 𝑡 − 1) and information from its child (i.e., the weighting
matrix observed in period 𝑡 + 1). For a weighting matrix, 𝑾𝒕, and parent 𝒆! and child 𝒆!
information sets, the marginal probability of the weighting matrix is
𝑃 𝑾𝒕 𝑒 ∝ 𝑃(𝑾𝒕|𝑾𝒕!𝟏,𝑾𝒕!𝟐,…𝑾𝒕!𝒌) 𝑃(𝒌
𝒕!𝟏(𝑾𝒕!𝟏,𝑾𝒕!𝟐,…𝑾𝒕!𝒌)
𝑾𝒕|𝑒! 𝑾𝒕 ) 𝑃(𝑾𝒔, 𝑒! 𝑾𝒔 |𝑾𝒕)𝒍
𝒔!𝟏
At the conclusion of the recursive process, we obtain a set of regression parameters that
represents information contained in the unbalanced spatial panel structure.
To estimate the recursive process, we assume a state-space model and use the Kalman
filter approach in which a forward recursion is used to estimate regression parameters based on
observations between periods 𝑡 − 𝑘 and 𝑡, and then a backward recursion that uses observations
between periods 𝑇 and 𝑡 + 1. In this manner, the forward-backward algorithm is an application
of a belief propagation structure that initially applies past knowledge to suggest current states,

10
and then further informs the current state information by incorporating the influence of future
observations.
Empirical Results
Forthcoming
Conclusions
While having access to large, information-rich datasets is often a "good" problem to have, it can
lead to empirical "too-much-of-a-good-thing" roadblocks. As high-frequency, large dimension
spatial panel data continue to become more readily available to agricultural economists, these
roadblocks are likely to become more apparent. We develop one method for overcoming the
dimensionality constraint in large, unbalanced panel regression estimations. Application of this
and similar methods is likely to be relevant to studies of agricultural marketing, land and water
uses, environmental issues, and other topics that take into account spatial and temporal
dependencies.
11
References
Bekkerman, A. 2013. “The Changing Landscape of Northern Great Plains Wheat Markets.”
Choices, 28:1-6.
Kowalski, D. 2014. “Shuttle Loaders Approaching the Saturation Point.” CoBank Knowledge
Exchange Division. June.
Garcia, P., and D. Good. 1983. “An Analysis of the Factors Influencing the Illinois Corn Basis,
1971-1981.” Applied Commodity Price Analysis, Forecasting, and Market Risk Management.
Proceedings of the NCR-134 Conference.
Dykema, A., N. Klein, and G. Taylor. 2002. “The Widening Corn Basis in South Dakota: Factors
Affecting and the Impact of the Loan Deficiency Payment.” Paper presented at WAEA
annual meeting, Long Beach, California.
Martin, L., J. Groenewegen, and E. Pidgeon. 1980. “Factors Affecting Corn Basis in
Southwestern Ontario.” American Journal of Agricultural Economics, 62:107-112.
Jiang, B., and M. Hayenga. 1997. “Corn and Soybean Basis Behavior and Forecasting:
Fundamental and Alternative Approaches.” Applied Commodity Price Analysis, Forecasting,
and Market Risk Management. Proceedings of the NCR-134 Conference.
Strobl, M., T. Fortenbery, and P. Fackler. 1992. “An Examination of the Spatial and
Intertemporal Aspects of Basis Determination.” Applied Commodity Price Analysis,
Forecasting, and Market Risk Management. Proceedings of the NCR-134 Conference.
McNew, K., and D. Griffith. 2005. "Measuring the Impact of Ethanol Plants on Local Grain
Prices." Review of Agricultural Economics, 27:164-180.

12
Fortenbery, T., H. Zapata, and E. Kunda. 1993. “Impacts of Elevator Concentration on Local
Basis.” Applied Commodity Price Analysis, Forecasting, and Market Risk Management.
Proceedings of the NCR-134 Conference.
Hauser, R., B. Jeffrey, and C. Baumel. 1984. “Implicit Values of Multiple Car Grain-Loading
Facilities in Iowa and Nebraska.” North Central Journal of Agricultural Economics, 6:80-90.

13
Table 1. Summary Statistics of Select Variables by State and Shuttle-Loading Features
Variable Mean Standard Deviation Kansas
Proportion elevators in state 0.899 — Proportion shuttle-loaders 0.087 — Proportion with rail access 0.693 — Proportion owned by co-operative 0.640 — Storage capacity (thousand bu) 1,817.124 3,529.250 Nearby basis (dollars per bu) -0.594 0.359
Montana Proportion elevators in state 0.101 —
Proportion shuttle-loaders 0.256 — Proportion with rail access 0.800 — Proportion owned by co-operative 0.570 — Storage capacity (thousand bu) 715.866 471.562 Nearby basis (dollars per bu) -0.658 0.590
Shuttle-Loader Elevators Proportion with rail access 1.000 —
Proportion owned by co-operative 0.103 — Storage capacity (thousand bu) 6,126.703 9,151.526 Nearby basis (dollars per bu) -0.509 0.391
Non-Shuttle-Loader Elevators Proportion with rail access 0.672 —
Proportion owned by co-operative 0.627 — Storage capacity (thousand bu) 1,227.643 1,073.664 Nearby basis (dollars per bu) -0.608 0.380
KCBT HRWW futures contract implied volatility 32.890 7.790 Total observations 690,525 Total elevator locations 297
Notes: Standard errors are presented only for continuous variables. KCBT denotes the Kansas City Board of Trade and HRWW denotes hard red winter wheat.
14
(a) Grain handling facilities and rail lines in Kansas
(b) Grain handling facilities and rail lines in Montana
Figure 1. Elevator locations and rail lines in Kansas and Montana
Notes: Circles represent the location of a grain handling facility. Red circles represent facilities with shuttle train-loading capabilities and blue circles represent conventional elevators. The size of each circle represents the total storage capacity at the location relative to other elevators in each state. Black lines characterize rail lines.