authenticity of milk fat by fast analysis of triacylglycerols: application to the detection of...
TRANSCRIPT

A
saTtlCpowUaccaif©
K
1
mrhfA
s
0d
Journal of Chromatography A, 1131 (2006) 227–234
Authenticity of milk fat by fast analysis of triacylglycerolsApplication to the detection of partially hydrogenated vegetable oils
Frederic Destaillats a,∗, Maureen de Wispelaere a, Florent Joffre b, Pierre-Alain Golay a,Bernadette Hug a, Francesca Giuffrida a, Laetitia Fauconnot a, Fabiola Dionisi a
a Nestle Research Center, Vers-chez-les-Blanc, Lausanne, Switzerlandb Omega 21, 10 route de Flacey, 21380 Marsannay le Bois, France
Received 26 June 2006; received in revised form 14 July 2006; accepted 17 July 2006Available online 7 August 2006
bstract
Detection of foreign fat in milk fat can be performed by analyzing triacylglycerols (TAGs) by gas–liquid chromatography (GLC) using thetandardized methodology. The standard methodology recommends the use of a packed column, which allows the separation of milk TAGsccording to their chain length (total carbon number). This procedure is not widely applied because these columns are not commercially available.his study describes a fast methodology by using a short apolar open-tubular capillary column. The developed experimental conditions can be used
o obtain the chromatographic resolution required in the standardized procedure, and the separation of milk fat TAGs (C24 to C54) is achieved iness than 4 min. As indicated by the standardized method, the quantification was performed by calibration using the certified reference materialRM-519 butterfat as standard substance. The methodology was fully validated and relative repeatability values were compared with the valuesrovided in the standardized procedure. The developed method was applied to detect adulteration of milk fat with partially hydrogenated vegetableils (PHVOs). PHVOs contain variable amount of trans-18:1 acids and two different PHVOs having different trans-18:1 acid levels (13 and 38%)ere added to milk fat at levels ranging from 5 to 30%. The obtained mixtures were analyzed by GLC and formulas established by the Europeannion were applied. Calculated S values indicated that PHVOs in milk fat could be analyzed at these levels. Approximate amounts of PHVOs
dded to the composite samples could be calculated using the standardized formula. The impact of adulteration of milk fat with PHVOs, whichontains an important amount of trans-9 and trans-10 18:1 acid isomers, was investigated as a complementary analytical criteria. We showed in
omposite samples, that the trans-18:1 acid isomeric distributions are distinct when referenced to the original milk fat profile and that trans-9 18:1cid isomer is a good indicator of the occurrence of PHVOs in milk fat. Our results showed clearly that a short apolar capillary column can be usednstead of a packed-column and that the mathematical model developed for the detection of foreign fat was suitable to detect adulteration of milkat with PHVOs.2006 Elsevier B.V. All rights reserved.
genat
wT(ba
eywords: Adulteration; Gas–liquid chromatography; Milk fat; Partially hydro
. Introduction
Milk fat is one of the most expensive commodity fats on thearket; therefore, the detection of foreign fat in milk fat is a
eal issue. Milk fat can be adulterated by different ways such as
omogenization of skimmed milk with less expensive foreignat or by direct incorporation of foreign fat in butter or butter fat.n accurate methodology suitable for detection of these frauds∗ Corresponding author at: Vers-chez-les-Blanc, P.O. Box 44, CH-1000 Lau-anne 26, Switzerland. Tel.: +41 21 785 8937; fax: +41 21 785 8553.
E-mail address: [email protected] (F. Destaillats).
(oydTc
c
021-9673/$ – see front matter © 2006 Elsevier B.V. All rights reserved.oi:10.1016/j.chroma.2006.07.040
ed vegetable oils; Trans fatty acid; Triacylglycerol
as developed in the eighties [1–6] and was standardized [7].his methodology consists to separate milk fat triacylglycerols
TAGs) according to their chain length (total carbon number)y gas–liquid chromatography (GLC). TAG analysis is usu-lly achieved either by high-performance liquid chromatographyHPLC), hyphenated with evaporative light-scattering detectionr by GLC using both packed and capillary columns. HPLC anal-sis does not require temperature and prevent, therefore, thermalegradation of lipids. However, the quantification of various
AG species with evaporative light-scattering detector could behallenging due to the limited linearity range of this detector.The standardized method had been developed using packedolumn. TAG formulas have been developed for both the

2 mato
dACcfms[rm
py[lata(bfdeipi[(tarrbrtPotetaw
trma
2
2
fsS
2(
lwtwSa1u1
2
flm(citttrssts
2c
nsaaaopatfasAa
2
28 F. Destaillats et al. / J. Chro
etection and quantification of possible foreign fat in milk fat.s a prerequisite step, calibration of the system using certifiedRM-519 reference material should be carried out [7]. Packedolumns are not commercially available and the methodologyor their preparation is also described in the standardizedethod [7]. Alternatively to the use of packed column, it is pos-
ible to obtain good results with open-tubular capillary column8–12] and experimental conditions required to obtain similaresults with capillary column are provided in the standardizedethod.Detection and quantification of adulteration of milk fat with
artially hydrogenated vegetable oils (PHVOs) by TAG anal-sis has not been considered in the standardized methodology7]. The level of PHVOs in milk fat can be approximate by ana-yzing butyric acid content by GLC as described by Molkentinnd Precht [23]. PHVOs are obtained by catalytic hydrogena-ion of vegetable oils such as soybean canola or corn oils, andre characterized by substantial amounts of trans fatty acidsTFAs) formed from linoleic and �-linolenic acids [13]. It haseen demonstrated that consumption of monounsaturated TFAsrom PHVOs is positively correlated with the increase of car-iovascular disease (CVD) risk [14]. To date, evidence is wellstablished to indicate trans-9 (elaidic) 18:1 acid as a factor toncrease CVD risk [14–16]. In milk fat, TFAs are formed fromolyunsaturated FAs, mainly linoleic and �-linolenic acids, dur-ng the biohydrogenation process of anaerobic rumen bacteria17]. The main trans-18:1 isomer in milk fat is the trans-11 18:1vaccenic) acid isomer which represents about 45–50% of totalrans isomers [16–21]. In PHVOs, the major 18:1 TFA isomersre trans-9 (elaidic) and trans-10 18:1 acid isomers [22]. Noeliable data are available on the effect of the naturally occur-ing trans-11 18:1 acid isomer [15]. An important differenceetween these two dietary sources of trans-18:1 acids is thatuminant (milk) fat contains a low level of trans-18:1 acid (4o 6 g/100 g of fatty acid), while the trans-18:1 acid level inHVOs could vary from 10 to 60 g/100 g of FA. [22]. In spitef the lack of scientific evidence, it is very well possible thathe natural TFAs from ruminant fats has different biologicalffects than the TFAs from PHVOs. Therefore, it is impor-ant to develop analytical methodologies suitable for detectingdulteration of milk fat and dairy products containing milk fatith PHVOs.The present study describes suitable experimental condi-
ions to obtain rapid resolution between individual TAG classesequired by the standardized procedure [7] but with a com-ercial capillary column. The methodology was validated and
pplies to detect adulteration of milk fat with PHVOs.
. Materials and methods
.1. Standards and materials
Certified reference material CRM-519 butterfat was obtainedrom EU community bureau of reference (BCR). The PHVOamples were obtained from local suppliers (Lausanne,witzerland).
fe%fi
gr. A 1131 (2006) 227–234
.2. Triacylglycerols profile by gas–liquid chromatographyGLC)
Fat samples were diluted in n-hexane (1 mg/mL) and ana-yzed using an Agilent 6890 N (Palo Alto, CA, USA) equippedith a DB-5HT capillary column (4.0 m × 0.25 mm I.D., film
hickness 0.10 �m; J&W, Palo Alto, CA, USA). This columnas prepared from a 15 m commercially available DB-5HT.plit injection (50:1) and flame-ionization detection (FID) werechieved at 380 ◦C. Initial oven temperature programming was50 ◦C, increased to 350 ◦C at 50 ◦C/min. Carrier gas (H2) wassed in constant flow mode. The initial pressure was 50 kPa at50 ◦C.
.3. Fatty acid methyl esters (FAMEs) sample preparation
A mixture of internal standards was prepared in a volumetricask (100 ml) by dissolving equal amounts of tritridecanoin andethyl undecanoate (200 ± 0.1 mg) in methyl tert-butyl ether
MTBE). The sample was weighed (to the nearest 0.1 mg) into aentrifuge tube (25 ml) with a screw cap in order to have approx-mately 50 mg of fat. The derivatization was conducted at roomemperature for 3.5–4.0 min after adding internal standard solu-ion (5 ml), methanolic sodium methoxide (5% solution, 5 ml)o the sample and shaking continuously for 10 seconds. Theeaction was stopped by adding n-hexane (2 ml), an aqueousolution (10 ml) of disodium hydrogen citrate (0.1 g/ml) andodium chloride (0.15 g/ml). To prevent hydrolysis of FAMEs,he transesterification time should not exceed 240 s. After phaseeparation, the supernatant was diluted before GLC analysis.
.4. Fractionation of FAMEs by argentation thin-layerhromatography (Ag-TLC)
FAMEs were fractionated by TLC on silica gel plates impreg-ated with silver nitrate. The plates were immerged in a 5%ilver nitrate solution in acetonitrile for 15 min in the dark, andctivated at 100 ◦C for 1 h [21]. Fractionation was performedccording to number and configuration of double bonds, usingmixture of hexane and diethyl ether (90:10, v/v) as devel-
ping solution. At the end of the chromatographic runs, thelates were sprayed with a solution of 2′,7′-dichlorofluorescein,nd viewed/imaged under UV light. Bands corresponding torans and cis monounsaturated FAs, were scraped off and trans-erred into a test tube. Methanol (1.5 mL), hexane (2 mL) andn aqueous solution of sodium chloride (5% w/v, 1.5 mL) wereuccessively added with thorough mixing after each addition.fter standing for ca. 1 min, the hexane phase was withdrawn,
nd the sample was concentrated prior to GLC analysis.
.5. GLC analysis of FAMEs
Analysis of total FAMEs and Ag-TLC fractions were per-
ormed on a gas chromatograph (Carlo-Erba, Milan, Italy),quipped with a fused-silica CP-Sill 88 capillary column (100Cyanopropyl-polysiloxane; 100 m, 0.25 mm I.D., 0.25 �mlm thickness; Varian, Palo Alto, CA, USA) cold on-column

mato
iatt1w
2
1amcsa(appcan(eiannedC
2
iTcs
3
udohalormnimt
oi
3c
a[mtoo1[sCoiocaawc
rpaaiseTla“mtopctci
3
drrm
F. Destaillats et al. / J. Chro
njector and flame-ionization detector (300 ◦C). Oven temper-ture programming was 60 ◦C isothermal for 5 min, increasedo 165 ◦C at 15 ◦C/min, isothermal for 1 min at this temperaturehen increased to 225 ◦C at 2 ◦C/min and held isothermal for7 min at 225 ◦C [24]. The inlet pressure of the carrier gas (H2)as 200 kPa.
.6. Identification and quantification of fatty acids
Optimal GLC separation is obtained using long (at least00 m), polar, open-tubular capillary columns, which permitccurate separation of FAMEs including the cis and trans iso-ers. Response factors for each FAMEs were calculated using
ommercially available FAME standard mixtures. In the presenttudy a mixture containing the following methyl esters of butyriccid (4:0), caproic acid (6:0), caprylic acid (8:0), capric acid10:0), undecanoic acid (11:0), lauric acid (12:0), tridecanoiccid (13:0), myristic acid (14:0), myristoleic acid (14:1 n − 5),entadecanoic acid (15:0), pentadecenoic acid (15:1 n − 5),almitic acid (16:0), palmitoleic acid (16:1 n − 7), heptade-anoic acid (17:0), heptadecenoic acid (17:1 n − 7), steariccid (18:0), elaidic acid (trans-18:1 n − 9), oleic acid (18:1− 9), linolelaidic acid (all trans-18:2 n − 6), linoleic acid
18:2 n − 6), arachidic acid (20:0), �-linoleic acid (18:3 n − 6),icosenoic acid (20:1 n − 9), linolenic acid (18:3 n − 3), hene-cosanoic acid (21:0), eicosadienoic acid (20:2 n − 6), beheniccid (22:0), eicosatrienoic acid (20:3 n − 6), erucic acid (22:1− 9), eicosatrienoic acid (20:3 n − 3), arachidonic acid (20:4− 6), docosadienoic acid (22:2 n − 6), lignoceric acid (24:0),icosapentanoic acid (20:5 n − 3), nervonic acid (24:1 n − 9),ocosahexaenoic acid (22:6 n − 3) was obtained from Nu-heck-Prep (Elysian, MN).
.7. Statistics
Analytical data are often subject to potential outliers. To min-mize their influence in the calculation, robust statistics are used.heir main advantage is to be less sensitive to outliers than classi-al statistics, and then provide more reliable results Q-Stat 1.1.5oftware (Nestle, Switzerland) was used for statistical analyses.
. Results and discussion
Milk fat is by far one of the most complex dietary fat withnique nutritional and physical properties. It was reported thatairy fat contains about 30–40 major fatty acids and a myriadf minor fatty acids, such as branched-chain, oxo-, keto- andydroxy-fatty acids for a total of 400 fatty acids [18]. Acyl chainsre organized in phospholipids and acylglycerols [18]. Chainengths vary from C4 to C24 and ethylenic double bond (cisr trans) numbers vary from 0 to 6. Dairy phospholipids areemoved during the butter process; therefore butterfat containsainly neutral lipids, i.e. TAGs and cholesterol. Due to the high
umber of different fatty acids, the amount of milk TAG speciess considerable, and to our knowledge has not been accurately
easured. Nevertheless, these TAGs could be grouped accordingo their chain length, which is calculated by summing the length
Tato
gr. A 1131 (2006) 227–234 229
f the three acyl chains; e.g. triolein chain length is C54 becauset contains 3 oleic (18:1) acid residues.
.1. Rapid analysis of milk fat triacylglycerols (TAGs) byapillary GLC
The standard method provides a basic separation of TAGsccording to their chain length using GLC on a packed-column2–7]. This procedure is convenient to accurately quantify the 16ain milk TAG classes ranging from C24 to C54. Additionally
o the quantification of these 16 classes, it is possible to quantifydd-number TAG classes (n + 1). The n + 1 TAG classes containdd-number acyl chains such as 5:0, 7:0, 9:0, 11:0, 13:0, 15:0,7:0, 19:0 and 21:0, which occur in minute amounts in dairy fat18]. These fatty acids are formed endogenously by the fatty acidynthase when the chain elongation is initiated from propionyl-oA group instead of acetyl-CoA as a starting precursor. Somedd-number carbon fatty acids, i.e. 15:0, 17:0 or 19:0, occur alson plant lipids. However, occurrence of these lipids in vegetableils is limited compared to milk fat. Odd-number milk TAGlasses contain also branched-chain fatty acids such as iso andnteiso saturated acyl chains. In carbon class quantification n + 1nd n classes were considered as one, e.g. C31 and C30 [7],hich simplified quantification to the previously mentioned 16
lasses.Packed column are really convenient to achieve such sepa-
ation but their are not commercially available and need to berepared in house [7]. Moreover, GLC apparatus needs to bedapted to use packed column. TAGs profile separation can bechieved by capillary GLC. A major drawback of this techniques the poor thermal stability of the stationary phase. However,uitable capillary columns are available from different suppli-rs and these columns are more resolutive than packed-column.he separation of milk fat TAGs by capillary GLC provides a
ot of information and it is difficult to identify the TAG peaksnd to group even and odd peaks for certain chain lengths. Thisover” resolution could compromise the use in the mathematicalodel developed for the authenticity of milk fat and therefore
he accuracy of the result. In the present study, the basic res-lution between the TAG classes required in the standardizedrocedure [7] was obtained using a short (4 m) apolar capillaryolumn (see Fig. 1). Different column lengths ranging from 0.6o 4.0 m, prepared from commercially available 15 m capillaryolumn, were evaluated and acceptable separation was obtainedn each case.
.2. Validation of the methodology
The developed TAGs profile separation method was vali-ated by calculating linearity, repeatability, and by performingecovery experiments. Linearity was calculated measuring theesponse (in triplicate) of six concentration levels of standardilk fat in n-hexane, covering a range from 0.4 to 1.4 mg/mL.
he different analyte concentrations (C24 to C54) were plottedgainst the instrument response and the fitted line was charac-erized by a correlation coefficient (r). A correlation coefficientf at least 0.99 has been obtained for the total of all TAG classes,
230 F. Destaillats et al. / J. Chromato
Fac
wtcr
uprfi(all
sCtaor
ste9CTmThphvap
3v
idotstcbuvtfc
TR
T
CCCCCCCCCCCCCCCC
ig. 1. Gas–liquid chromatograms of pure milk fat analyzed by GLC on shortpolar open-tubular capillary column (see material and methods for analyticalonditions).
hich shows clearly that the method is linear in the concentra-ion range tested. An overview of the results per individual TAGlass for linearity as well as repeatability and trueness versuseference values are listed in Table 1.
The closeness of agreement between independent test resultsnder stipulated conditions of repeatability, also known as therecision of the method, was evaluated by calculating the simpleepeatability. Six solutions of the same concentration of certi-ed standard butter fat CRM-519 were measured in triplicate=18 measurements) by the same analyst in the same laboratorynd with the same equipment; the weighed average repeatabilityimit at 95% confidence interval for all TAG classes was calcu-ated to be 1.7%.
The trueness of the method was evaluated by performingpiking experiments. Different solutions of reference materialRM-519 were spiked at different levels (see Table 2) with par-
ially hydrogenated vegetable oil (PHVO A), and samples werenalyzed in duplicate. The recovery of the method for C54 TAG,ne of the main TAGs in PHVO A, was calculated to be in theange 97.3–99.6%.
utti
able 1epeatability, linearity and trueness values obtained for individual triacylglycerols (T
AG Repeatability limit [%]reference methoda
Repeatability limpresent study
24 + Chol 28.00 27.7026 7.53 26.2028 8.48 10.4230 4.93 7.9532 2.88 3.7934 2.21 1.9336 0.70 1.3238 1.18 1.1440 0.56 0.7442 0.73 0.7444 0.95 1.4246 1.04 1.4948 1.48 1.1850 1.06 1.3552 1.51 1.2454 1.68 3.23
a Adapted from the values given in the standardized method [7].
gr. A 1131 (2006) 227–234
In addition to the spiking experiments, the closeness of theo-called obtained ‘true’ value of a certified milk fat versus itsheoretically declared reference value was evaluated. The recov-ry for TAG classes with different carbon number ranged from9.6–106.1%. Results for TAG classes C24 + cholesterol and26 showed to deviate from the results for other TAG classes.he relative repeatability values obtained with the developedethod had been compared to the standardized method (seeable 1). The relative repeatability value for the C26 TAG isigher with the fast GLC method compared to the standardizedrocedure. It has to be remarked that these two TAG classesave a minor contribution in the total fat profile. Results of thealidation indicate that the developed method can be used as anlternative to the original methodology involving TAG analysiserformed using packed column.
.3. Detection and quantification of partially hydrogenatedegetable oil in milk fat
No information was found on the application of the standard-zed methodology has never been applied, to our knowledge, toetect adulteration of milk fat with TFAs containing vegetableils. The validated procedure described was found applicableo detect adulteration of milk fat with PHVOs. Using PHVOamples, containing different TFAs content (13 and 38%) andherefore different TAG compositions, and certified butterfat,omposite samples were prepared and subsequently analyzedy GLC (see Table 2 for sample composition). PHVOs aresually obtained by catalytic hydrogenation of polyunsaturatedegetable oils, e.g. soybean, sunflower or rapeseed oils, charac-erized by a very high level (up to 60%) of C18 fatty acids. There-ore, the main TAG classes of PHVOs are C52 and C54, whichontain 2 and 3 C18 residues, respectively. Milk fat contains
sually about 10 and 6% of respectively C52 and C54 TAGs,herefore addition of PHVOs in milk fat lead to an increase ofhe C52 and C54 contents (modification of the TAGs profile isllustrated in Fig. 2). Correlations between C52 and C54 TAGsAGs) chain length classes
it [%] Linear correlationcoefficient (r)
Trueness referencerecovery [%]
0.99 106.00.99 106.11.00 99.81.00 101.21.00 99.91.00 99.61.00 99.61.00 99.91.00 100.01.00 100.01.00 99.71.00 99.81.00 100.01.00 100.21.00 100.11.00 100.5

F. Destaillats et al. / J. Chromatogr. A 1131 (2006) 227–234 231
Fig. 2. Fast gas–liquid chromatograms of milk fat samples spiked with (A) 20.2%, (B) 16.0%, (C) 12.1%, (D) 5.0% and (E) 0% of partially hydrogenated vegetableoil (PHVO A) having a trans-18:1 acid isomers content of 13.4 g/100 g of fatty acid and, (E) pure milk fat.

232 F. Destaillats et al. / J. Chromatogr. A 1131 (2006) 227–234
Table 2Triacylglycerol (TAG) composition of certified standard CRM-519 butterfat and spiked samples prepared using two different partially hydrogenated vegetable oil(PHVO A and B) samples
Triacylglycerol Milk fat Spiked samples with PHVO A [%] Spiked samples with PHVO B [%]
5.0 12.1 16.0 20.2 31.7 5.0 11.6 15.0 20.7 30.2
C24 + Chola 0.35 0.35 0.28 0.31 0.26 0.22 0.35 0.27 0.26 0.24 0.21C26 0.25 0.27 0.24 0.26 0.26 0.20 0.31 0.24 0.23 0.18 0.17C28 0.59 0.59 0.52 0.52 0.52 0.49 0.58 0.53 0.50 0.47 0.32C30 1.15 1.05 0.91 0.88 0.78 0.63 1.09 0.93 0.93 0.80 0.59C32 2.43 2.29 2.00 1.89 1.76 1.45 2.22 1.99 1.91 1.71 1.37C34 5.64 5.28 4.79 4.56 4.28 3.70 5.19 4.64 4.44 4.07 3.39C36 10.47 10.09 9.60 9.25 9.00 7.79 9.99 9.20 8.94 8.31 7.36C38 12.52 12.10 11.34 11.07 10.73 9.68 12.20 11.68 11.18 10.86 10.15C40 10.03 9.47 8.74 8.31 7.94 6.75 9.29 8.46 8.01 7.36 6.23C42 6.69 6.23 5.66 5.38 5.04 4.19 6.18 5.59 5.30 4.82 4.11C44 6.11 5.75 5.23 4.93 4.65 3.83 5.74 5.13 4.84 4.47 3.75C46 6.86 6.45 5.95 5.62 5.35 4.56 6.34 5.80 5.50 5.08 4.29C48 8.69 8.53 8.34 8.28 8.10 7.79 8.17 7.59 7.17 6.70 5.80C50 11.40 11.46 11.58 11.57 11.53 11.48 11.08 10.73 10.44 10.14 9.48C52 10.96 11.69 12.81 13.33 13.90 15.49 11.19 11.43 11.66 11.77 12.01C 5.90
R ols
ctta
idaavFtdtsbrtttu
tm
X
S(fabT
X
RP
TS
S
S
S
S
S
S
54 5.89 8.39 12.02 13.84 1
esults (average of duplicate analysis) are expressed in g/100 g of triacylglycera Cholesterol and C24 TAG elute in the same peak.
ontent and adulteration level give excellent results, confirminghe linearity of the developed method for TAGs profile quan-ification (Fig. 3). The C54 is a much better marker of PHVOdulteration than the C52.
The standardized methodology for detection of foreign fatn milk fat involved calculation of different so-called S values,eveloped for different types of adulterants [7]. The formulaere provided in Table 3. Confidence intervals, which take intoccount the variability of genuine milk fat composition, are pro-ided for each formula; results obtained are given in Table 4.or almost all S value calculations, results are in agreement with
he nature of the samples (pure or adulterated). The S5 formulaeveloped for the detection of lard in milk fat gave non satisfac-ory results for detection of PHVOs in milk fat at 5% level but thetandardized procedure mentioned that a sample is assumed toe adulterated if at least one of the five equations give a positiveesult. At levels above 5%, S5 calculated values were outside
he given confidence interval. Nevertheless, when adulterationests are done in blind the total (Stotal) formula is often used. Inhe present study the results obtained with this formula allowednequivocal diagnostics.Pasr
able 3tandardized equations for detection of foreign fat in milk fat [7]
value Equation and standard deviation
total −2.7575C26 + 6.4077C28 + 5.5437C30 − 15.3247C32 + 6.2600C34 + 8+ 0.6356C44 + 6.01171C46
2 2.0983C30 + 0.7288C34 + 0.6927C36 + 0.6353C38 + 3.7452C40 − 1.29+ 1.7013C46 + 2.5283C50
3 3.7453C32 + 1.1134C36 + 1.3648C38 + 2.1544C42 + 0.4273C44 + 0.58+ 0.9953C52 + 1.2396C54
4 3.6644C28 + 5.2297C30 − 12.5073C32 + 4.4285C34 − 0.2010C36 + 1.+ 6.7433C40 − 4.2714C42 + 6.3739C46
5 6.5125C26 + 1.2052C32 + 1.7336C34 + 1.7557C36 + 2.2325C42 + 2.80
21.76 10.08 15.79 18.69 23.01 30.77
An additional property of the standardized methodology ishe approximation of the amount of foreign fat in adulterated
ilk fat, using the following formula:
(g/100g) = 100 ×∣∣∣∣
100 − Stotal
100 − Sf
∣∣∣∣
total represents the result obtained with the general formulaTable 2), with Sf a reference value that depends on the type oforeign fat [7]. When the nature of the fat added is unknown,ccording to the standardized procedure, the calculation coulde performed using 7.46 as an average value for the Sf parameter.he following formula would then apply:
(g/100g) = 100 ×∣∣∣∣
100 − Stotal
92.54
∣∣∣∣
esults obtained for the samples prepared with the two differentHVOs are given in Table 4. Adulteration results obtained with
HVO A were better than with PHVO B. Nevertheless, over-ll comparison between true and calculated adulteration levelshowed that, in the range investigated, the calculation allowed aough estimation of the adulteration level. The development ofField of application
.0108C40 − 5.0336C42 General formula
29C42 + 1.3544C44 Soybean, sunflower, olive, rape-seed,linseed, wheat germ, maize germ,cotton seed and fish oil
09C46 + 1.2926C48 + 1.0306C50 Coconut and palm kernel fat
2791C38 Palm oil and beef tallow
06C46 + 2.5432C52 + 0.9892C54 Lard
F. Destaillats et al. / J. Chromatogr. A 1131 (2006) 227–234 233
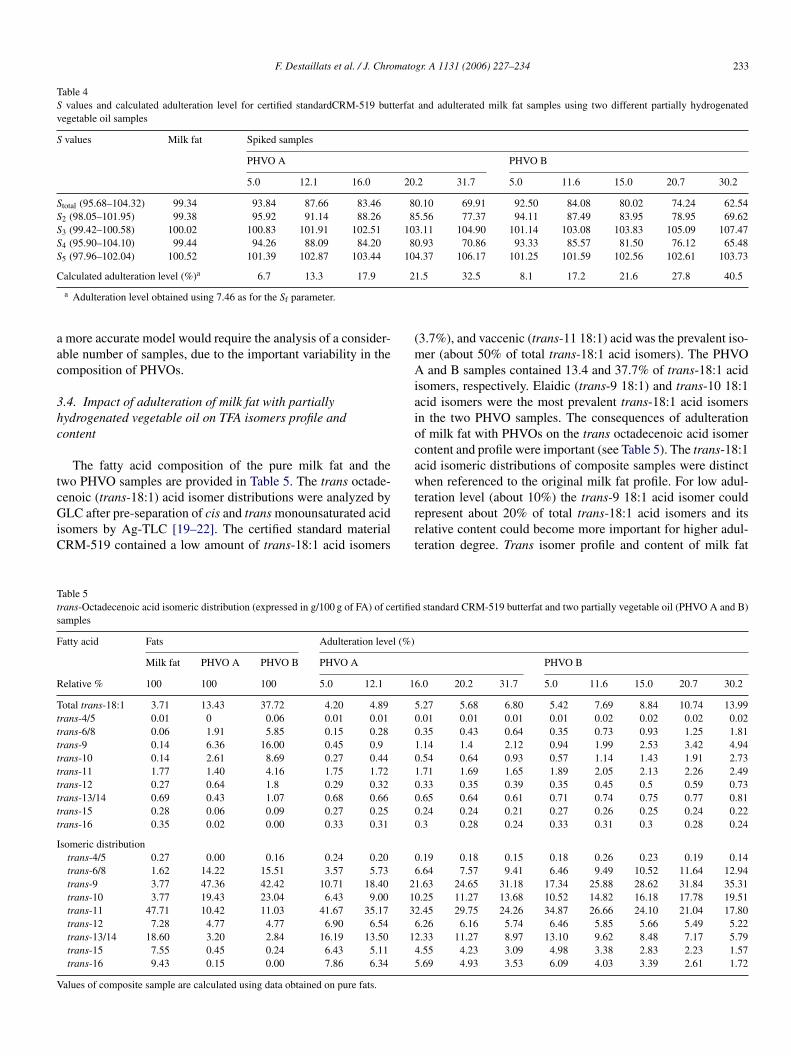
Table 4S values and calculated adulteration level for certified standardCRM-519 butterfat and adulterated milk fat samples using two different partially hydrogenatedvegetable oil samples
S values Milk fat Spiked samples
PHVO A PHVO B
5.0 12.1 16.0 20.2 31.7 5.0 11.6 15.0 20.7 30.2
Stotal (95.68–104.32) 99.34 93.84 87.66 83.46 80.10 69.91 92.50 84.08 80.02 74.24 62.54S2 (98.05–101.95) 99.38 95.92 91.14 88.26 85.56 77.37 94.11 87.49 83.95 78.95 69.62S3 (99.42–100.58) 100.02 100.83 101.91 102.51 103.11 104.90 101.14 103.08 103.83 105.09 107.47S4 (95.90–104.10) 99.44 94.26 88.09 84.20 80.93 70.86 93.33 85.57 81.50 76.12 65.48S5 (97.96–102.04) 100.52 101.39 102.87 103.44 104.37 106.17 101.25 101.59 102.56 102.61 103.73
C 21
aac
3hc
tcGiC
(mAiaiocaw
Tts
F
R
Tttttttttt
I
V
alculated adulteration level (%)a 6.7 13.3 17.9
a Adulteration level obtained using 7.46 as for the Sf parameter.
more accurate model would require the analysis of a consider-ble number of samples, due to the important variability in theomposition of PHVOs.
.4. Impact of adulteration of milk fat with partiallyydrogenated vegetable oil on TFA isomers profile andontent
The fatty acid composition of the pure milk fat and thewo PHVO samples are provided in Table 5. The trans octade-
enoic (trans-18:1) acid isomer distributions were analyzed byLC after pre-separation of cis and trans monounsaturated acidsomers by Ag-TLC [19–22]. The certified standard materialRM-519 contained a low amount of trans-18:1 acid isomers
trrt
able 5rans-Octadecenoic acid isomeric distribution (expressed in g/100 g of FA) of certifieamples
atty acid Fats Adulteration level (%)
Milk fat PHVO A PHVO B PHVO A
elative % 100 100 100 5.0 12.1 16
otal trans-18:1 3.71 13.43 37.72 4.20 4.89 5rans-4/5 0.01 0 0.06 0.01 0.01 0rans-6/8 0.06 1.91 5.85 0.15 0.28 0rans-9 0.14 6.36 16.00 0.45 0.9 1rans-10 0.14 2.61 8.69 0.27 0.44 0rans-11 1.77 1.40 4.16 1.75 1.72 1rans-12 0.27 0.64 1.8 0.29 0.32 0rans-13/14 0.69 0.43 1.07 0.68 0.66 0rans-15 0.28 0.06 0.09 0.27 0.25 0rans-16 0.35 0.02 0.00 0.33 0.31 0
someric distributiontrans-4/5 0.27 0.00 0.16 0.24 0.20 0trans-6/8 1.62 14.22 15.51 3.57 5.73 6trans-9 3.77 47.36 42.42 10.71 18.40 21trans-10 3.77 19.43 23.04 6.43 9.00 10trans-11 47.71 10.42 11.03 41.67 35.17 32trans-12 7.28 4.77 4.77 6.90 6.54 6trans-13/14 18.60 3.20 2.84 16.19 13.50 12trans-15 7.55 0.45 0.24 6.43 5.11 4trans-16 9.43 0.15 0.00 7.86 6.34 5
alues of composite sample are calculated using data obtained on pure fats.
.5 32.5 8.1 17.2 21.6 27.8 40.5
3.7%), and vaccenic (trans-11 18:1) acid was the prevalent iso-er (about 50% of total trans-18:1 acid isomers). The PHVOand B samples contained 13.4 and 37.7% of trans-18:1 acid
somers, respectively. Elaidic (trans-9 18:1) and trans-10 18:1cid isomers were the most prevalent trans-18:1 acid isomersn the two PHVO samples. The consequences of adulterationf milk fat with PHVOs on the trans octadecenoic acid isomerontent and profile were important (see Table 5). The trans-18:1cid isomeric distributions of composite samples were distincthen referenced to the original milk fat profile. For low adul-
eration level (about 10%) the trans-9 18:1 acid isomer couldepresent about 20% of total trans-18:1 acid isomers and itselative content could become more important for higher adul-eration degree. Trans isomer profile and content of milk fat
d standard CRM-519 butterfat and two partially vegetable oil (PHVO A and B)
PHVO B
.0 20.2 31.7 5.0 11.6 15.0 20.7 30.2
.27 5.68 6.80 5.42 7.69 8.84 10.74 13.99
.01 0.01 0.01 0.01 0.02 0.02 0.02 0.02
.35 0.43 0.64 0.35 0.73 0.93 1.25 1.81
.14 1.4 2.12 0.94 1.99 2.53 3.42 4.94
.54 0.64 0.93 0.57 1.14 1.43 1.91 2.73
.71 1.69 1.65 1.89 2.05 2.13 2.26 2.49
.33 0.35 0.39 0.35 0.45 0.5 0.59 0.73
.65 0.64 0.61 0.71 0.74 0.75 0.77 0.81
.24 0.24 0.21 0.27 0.26 0.25 0.24 0.22
.3 0.28 0.24 0.33 0.31 0.3 0.28 0.24
.19 0.18 0.15 0.18 0.26 0.23 0.19 0.14
.64 7.57 9.41 6.46 9.49 10.52 11.64 12.94
.63 24.65 31.18 17.34 25.88 28.62 31.84 35.31
.25 11.27 13.68 10.52 14.82 16.18 17.78 19.51
.45 29.75 24.26 34.87 26.66 24.10 21.04 17.80
.26 6.16 5.74 6.46 5.85 5.66 5.49 5.22
.33 11.27 8.97 13.10 9.62 8.48 7.17 5.79
.55 4.23 3.09 4.98 3.38 2.83 2.23 1.57
.69 4.93 3.53 6.09 4.03 3.39 2.61 1.72

234 F. Destaillats et al. / J. Chromato
Fc(
cPtdi1Ht
gt
4
aotwmtfmim
R
[[[
[[
[[
[[[[[
ig. 3. Correlations between adulteration level and C52 or C54 content inomposite samples prepared from milk fat and two different PHVO samplesA and B).
ould be modulated by modification of cow’s feeding [17–19].articularly, dietary induced milk fat depression could affect the
rans-18:1 acid isomer profile. In those non-physiological con-itions, the relative content of trans-10 18:1 acid could be more
mportant than usual (about 3–10%). In some cases, the trans-0 18:1 acid isomer could be the most prevalent isomer [17].owever, milk fat depression did not give rise to an increase ofrans-9 18:1 acid isomer and therefore its increase could be a
[
[[
gr. A 1131 (2006) 227–234
ood complementary indicator of the occurrence of PHVOs inhe milk fat sample.
. Conclusion
Detection of foreign fat in milk fat was performed by TAGnalysis using the standardized methodology [7]. The separationf milk fat TAG classes was achieved using a short apolar open-ubular capillary column in less than 4 min. The methodologyas validated and used successfully to detect adulteration ofilk fat with PHVOs, which contains substantial amounts of
rans-18:1 acids. In composite samples, made with pure milkat and PHVOs, the trans-18:1 acid isomeric distributions ofilk fat were affected by the addition of PHVOs. The relative
ncrease of trans-9 18:1 was an indicator of the adulteration ofilk fat with PHVOs.
eferences
[1] R. Timms, Dairy Res. 47 (1980) 295.[2] D. Precht, Z. Lebensm Unters Forsch. 194 (1992) 1.[3] D. Precht, Z. Lebensm Unters Forsch. 194 (1992) 107.[4] D. Precht, Kieler Milchwirtsch. Forschungsber. 43 (1991) 219.[5] D. Precht, Fat Sci. Technol. 93 (1991) 538.[6] D. Precht, in: K.D. Mukherjee, N. Weber, J. Sherma (Eds.), CRC Handbook
of Chromatography, Analysis of Lipids, CRC Press, Boca Raton, FL, 1993,p. 123.
[7] Commission of the European Communities: Detection of foreign fats inmilk fat by means of gas chromatographic triglyceride analysis, Doc. NoVI/5202/90-EN, VI/2645/91.
[8] D. Precht, J. Molkentin, Chrompack News 4 (1993) 16.[9] J. Molkentin, D. Precht, Chromatographia 39 (1994) 265.10] J. Molkentin, D. Precht, Chromatographia 52 (2000) 791.11] J. Fontecha, I. Mayo, G. Toledano, M. Juarez, J. Dairy Sci. 89 (2006) 882.12] G. Contarini, R. Leardi, C. Pezzi, P.M. Toppino, Riv. Ital. Sostanze. Grasse
70 (1993) 491.13] A.J. Dijkstra, Eur. J. Lipid Sci. Technol. 108 (2006) 249.14] D. Mozaffarian, M.B. Katan, A. Ascherio, M.J. Stampfer, W.C. Willett, N.
Engl. J. Med. 354 (2006) 1601.15] A. Aro, Eur. J. Lipid Sci. Technol. 106 (2004) 390.16] A.L. Lock, P.W. Parodi, D.E. Bauman, Aust. J. Dairy Technol. 60 (2005)
134.17] D.E. Bauman, M. Griinari, Annu. Rev. Nutr. 23 (2003) 203.18] R.G. Jensen, J. Dairy Sci. 85 (2002) 295.19] D. Precht, J. Molkentin, Milchwissenschaft 52 (1997) 564.20] D. Precht, J. Molkentin, Kieler Milchwirtsch. Forschungsber. 51 (1999) 63.21] R.L. Wolff, C.C. Bayard, J. Am. Oil Chem. Soc. 72 (1995)
1197.
22] R.L. Wolff, N.A. Combe, F. Destaillats, C. Boue, D. Precht, J. Molkentin,B. Entressangles, Lipids 35 (2000) 815.23] J. Molkentin, D. Precht, Milchwissenschaft 52 (1997) 82.24] P.A. Golay, F. Dionisi, B. Hug, F. Giuffrida and F. Destaillats, Food Chem,
(2006) in press.