thermoplastic vulcanizates based on hydrogenated natural
TRANSCRIPT

HAL Id: tel-01954357https://tel.archives-ouvertes.fr/tel-01954357
Submitted on 13 Dec 2018
HAL is a multi-disciplinary open accessarchive for the deposit and dissemination of sci-entific research documents, whether they are pub-lished or not. The documents may come fromteaching and research institutions in France orabroad, or from public or private research centers.
L’archive ouverte pluridisciplinaire HAL, estdestinée au dépôt et à la diffusion de documentsscientifiques de niveau recherche, publiés ou non,émanant des établissements d’enseignement et derecherche français ou étrangers, des laboratoirespublics ou privés.
Thermoplastic Vulcanizates Based on HydrogenatedNatural Rubber/Polypropylene Blends
Korn Taksapattanakul
To cite this version:Korn Taksapattanakul. Thermoplastic Vulcanizates Based on Hydrogenated Natural Rub-ber/Polypropylene Blends. Food and Nutrition. Université du Maine; Prince of Songkla University,2016. English. �NNT : 2016LEMA1028�. �tel-01954357�

JURY Rapporteurs : Mme SOPHIE BISTAC, PROFESSEUR, Université de Haute-Alsace
M. TAWEECHAI AMORNSAKCHAI, PROFESSEUR, Université de Mahidol
Examinateurs : M. POLPHAT RUAMCHAROEN, PROFESSEUR, Université de Songkhla Rajabhat
M. PHILIPPE DANIEL, PROFESSEUR, Université du Maine
M. TULYAPONG TULYAPITAK, PROFESSEUR, Université de Prince of Songkla
M. PRANEE PHINYOCHEEP, PROFESSEUR, Université de Mahidol
Mme JAREERAT SAMRAN-RUAMCHAROEN, PROFESSEUR, Université de Prince of Songkla
Directeur de Thèse : M. PHILIPPE DANIEL, PROFESSEUR, Université du Maine
M. TULYAPONG TULYAPITAK, PROFESSEUR, Université de Prince of Songkla
Co-directeur de Thèse : M. PRANEE PHINYOCHEEP, PROFESSEUR, Université de Mahidol
M. POLPHAT RUAMCHAROEN, PROFESSEUR, Université de Songkhla Rajabhat
Thermoplastic vulcanizates based onhydrogenated natural rubber/polypropylene blends
Korn TAKSAPATTANAKUL
Mémoire présenté en vue de l’obtention dugrade de Docteur de l'Université du Mainesous le sous le sceau de l'Université Bretagne Loireen cotutelle avec Prince of Songkla University École doctorale : MATIERE, MOLECULES, MATERIAUX EN PAYS DE LOIRE
Discipline : PHYSIQUE
Spécialité : (7)
Unité de recherche : Institut des Molécules et Matériaux du Mans, IMMM –UMR-
CNRS 6283 and Rubber Technology and Polymer Science department, Chemistry Division of Science department, Faculty of Science and Technology, Prince of Songkla University, Pattani campus
Soutenue le 15 décembre 2016
Thèse N° : (10)

Thermoplastic Vu
A Thesis Submitted in Partial
Docto
Le Grad
F
Cop
ulcanizates based on Hydrogenated Natural Rub
Polypropylene Blends
Korn Taksapattanakul
Partial Fulfillment of the Requirements for th
tor of Philosophy in Polymer Technology
Prince of Songkla University
Pattani, Thailand
and
rade de Docteur de l'Université du Maine
(Physique)
Faculté des Sciences et Techniques
Université du Maine
Le Mans, France
2017
Copyright of Prince of Songkla University
i
Rubber/
the Degree of


v
Thesis Title Thermoplastic Vulcanizates Based on Hydrogenated
Natural Rubber/Polypropylene Blends
Author Mr. Korn Taksapattanakul
Major Program Polymer Technology (PSU)
Physique (Université du Maine)
Academic Year 2016
ABSTRACT
The non-catalytic hydrogenation of natural rubber latex (NRL) was carried
out by using diimide generated in situ from the reaction between hydrazine (N2H4) and
hydrogen peroxide (H2O2). The effects of mole ratios of [C=C]:[N2H4]:[H2O2], reaction
conditions, solvent types, solvent volumes and reaction scale-up on the hydrogenation
levels were investigated. Nuclear magnetic resonance (NMR), Fourier transform infrared
(FTIR), and Raman spectroscopic techniques were employed to investigate the chemical
structure of the hydrogenated natural rubber (HNRs) and to quantify the hydrogenation
levels. It was found that variations in moles of N2H4 and H2O2 in the range of 1.0-2.0
moles resulted in degrees of hydrogenation in the range of 10-18%. Little improvement in
hydrogenation levels of HNRs was obtained when NRL particles were swollen in
solvents by which toluene yielded better results than hexane. The increase in toluene
volume resulted in the increase in hydrogenation levels up to 42 %. TEM micrographs
revealed that swelling mainly occurred at the surface of NRL particles, implying that
hydrogenation reaction confined largely at the surface of NRL particles. After removal of
toluene, particle size and particle size distribution of partially hydrogenated NRL
remained unchanged. To further improve degrees of hydrogenation, the reaction volume
was extended and 65% hydrogenation levels were obtained. Therefore, 14%HNR,
33%HNR, and 65%HNR were successfully prepared under suitable reaction conditions.
However, crosslinking and cis-trans isomerization were side-reactions occurring during
hydrogenation. Gel and trans contents increased with increasing hydrogenation levels,
leading to the increase in hardness of HNRs. Mooney viscosities of HNRs increased with
increasing degrees of hydrogenation due to the increased gel contents. Mooney torque
relaxation of NR and HNRs were similar. Thermogravimetric analysis revealed that

vi
HNRs had greater thermal stability than NR and thermal stability increased with
increasing degrees of hydrogenation. HNR vulcanizates were much better resistant to
ozone and UV than cured NR. Sulfur-vulcanized rubbers had greater ozone resistance
than peroxide-cure rubbers due to less amounts of carbon-carbon double bonds present in
rubbers. In addition, modulus at low strain and tensile strength of sulfur-cured rubbers
were higher than those of peroxide-cured rubbers, but lower elongation due to higher
crosslink densities. Also, modulus at low strain and tensile strength increased with
increasing hydrogenation levels of HNRs, in contrast to strain at break. Thermoplastic
vulcanizates (TPVs) from blends of HNR and Polypropylene (PP) were prepared via
dynamic vulcanization using peroxide and sulfur as curing agents. The effects of blend
ratios on mechanical properties of TPVs were investigated. Tensile strength increased
with increasing PP portions, but breaking strain decreased. Morphology of TPVs was
characterized with Raman mapping and scanning electron microscope (SEM). The phase
sizes of crosslinked rubber obtained from both techniques were correlated well.
Key words: Non-catalytic hydrogenation, Hydrogenated natural rubber, Raman
spectroscopy, Thermoplastic vulcanizates

vii
ช�อวทยานพนธ เทอรโมพลาสตกวลคาไนซจากยางธรรมชาตไฮโดรจเนตเบลนดกบพอลโพรพลน
ผเขยน นายกร ทกษพฒนกล
สาขาวชา เทคโนโลยพอลเมอร (PSU)
ฟสกส (Université du Maine)
ปการศกษา 2559
บทคดยอ
ปฏกรยาการเตมไฮโดรเจนแบบไมใชตวเรงของน�ายางธรรมชาต (NRL) ใชไดอไมดซ� งเกดจากปฏกรยาระหวางไฮดราซน (N2H4) และไฮโดรเจนเปอรออกไซด (H2O2)
ไฮโดรจเนตเตรยมผานปฏกรยาไฮโดรจเนชนแบบไมใชตวเรง ซ�งอาศยไดอไมดท�เกดจากปฏกรยาออกซเดชนของไฮดราซนดวยไฮโดรเจนเปอรออกไซด ศกษาผลของอตราสวนโดยโมลของ [C=C]:[N2H4]:[H2O2]
สภาวะการเตรยมปฎกรยา ประเภทตวทาละลาย ปรมาตรของตวทาละลายและการขยายขนาดการเตรยมปฏกรยา โครงสรางทางเคมของยางธรรมชาตไฮโดรจเนตและการคานวณเปอรเซนตของการเกดไฮโดรจเนชน ไดวเคราะหโดยใชเทคนคนวเคลยรแมกเนตกเรโซแนนซ อนฟราเรดสเปกโตรสโคปและรามาน
จากการแปรอตราสวนโดยโมลของไฮดราซนและไฮโดรเจนเปอรออกไซดในชวง 1.0-2.0 โมล
พบวา เปอรเซนตการเกดไฮโดรจเนชนของน� ายางธรรมชาตอยในชวงประมาณ 10-18% นอกจากน� สามารถเพ�มเปอรเซนตการเกดไฮโดรจเนชนของน�ายางธรรมชาตดวยวธการทาใหอนภาคของน� ายางธรรมชาตเกดการบวมพองท�ผวดวยตวทาละลาย พบวา เปอรเซนตการเกดไฮโดรจเนชนของน� ายางธรรมชาตดวยตวทาละลายโทลอนเพ�มข�นมากกวาตวทาละลายเฮกเซน จากการเพ�มปรมาตรของตวทาละลายโทลอน พบวา เปอรเซนตการเกดไฮโดรจเนชนของน� ายางธรรมชาตเพ�มข�นถง 42% และเปอรเซนตการเกดไฮโดรจเนชนของน� ายางธรรมชาตเพ�มข�นถง 65 % โดยการขยายขนาดของการเตรยมปฏกรยา นอกจากน�พบวา ปฏกรยาไฮโดรจเนชนทาใหเกดปฏกรยาขางเคยง เชน การเกดเจลและการเกดไอโซเมอรไรเซชนแบบซส-ทรานส
จากการศกษาสณฐานวทยาของอนภาคน� ายางธรรมชาตไฮโดรจเนตดวยกลองจลทรรศนอเลกตรอนแบบสองผาน พบวา ปฏกรยาไฮโดรจเนชนเกดท�บรเวณผวของอนภาคน� ายางธรรมชาต และเม�อระเหยตวทาละลายโทลอน พบวา ขนาดอนภาคและการกระจายตวของน�ายางธรรมชาตไฮโดรจเนตไมมการเปล�ยนแปลง
จากการศกษาสมบตทางความรอนพบวา ยางธรรมชาตไฮโดรจเนตมความเสถยรตอความรอนสงกวายางธรรมชาต และความเสถยรตอความรอนเพ�มข�นเม�อเปอรเซนตของการเกดไฮโดรจเนชนของยางธรรมชาตเพ�มข�น ยางธรรมชาตไฮโดรจเนตวลคาไนซ มความเสถยรตอการสลายตวดวยโอโซนและยวดกวายางธรรมชาตวลคาไนซ นอกจากน�พบวา ระบบการวลคาไนซดวยซลเฟอรของยางธรรมชาตมความเสถยรตอการสลายตวดวยโอโซนและยวดกวาการวลคาไนซดวยเปอรออกไซด เน�องจากปรมาณของพนธะคของยางธรรมชาตลดลง เพราะระบบการวลคาไนซดวยซลเฟอรจะเกดปฏกรยาท�พนธะคของยางธรรมชาต

viii
จากการศกษาสมบตทางกายภาพของยางธรรมชาตไฮโดรจเนต พบวา ยางธรรมชาตไฮโดรจเนตมความแขงท�เพ�มข�น ซ� งเปนผลจากการเกดเจลและไอโซเมอรไรเซชนแบบทรานส คาความหนดมน� เพ�มข�นเม�อเปอรเซนตของการเกดไฮโดรจเนชนของยางธรรมชาตเพ�มข�น เน�องจากการเกดเจลท�เพ�มข�น ในขณะท�การคลายความเคนแบบมน�ของยางธรรมชาตและยางธรรมชาตไฮโดรจเนตมคาท�ใกลเคยงกน คามอดลสท�คาความเครยดต�าและความตานทานแรงดงสงสดเพ�มข�น เม�อเปอรเซนตของการเกดไฮโดรจเนชนของยางธรรมชาตเพ�มข�น ในขณะท�ระยะยด ณ
จดแตกหก ลดลง
จากการเตรยมเทอรโมพลาสตกวลคาไนซจากยางธรรมชาตไฮโดรจเนตเบลนดกบพอลโพรพลนผานกระบวนการท�เรยกวา ไดนามกวลคาไนเซชน ดวยระบบการวลคาไนซท�งซลเฟอรและเปอรออกไซด พบวา ความตานทานแรงดงสงสดเพ�มข�น เม�อสดสวนของพอลโพรพลนเพ�มข�น ในขณะท�ระยะยด ณ จดแตกหก ลดลง สณฐานวทยาของเทอรโมพลาสตกวลคาไนซ วเคราะหโดยใชเทคนค แผนภาพรามาน และ กลองอเลกตรอนชนดสองกราด
พบวา เทคนคแผนภาพรามานสามารถคานวณหาสดสวนของเฟสยางและเฟสพลาสตกและขนาดของเฟสยางและลกษณะการกระจายตวของเฟสยางในเฟสพลาสตกของเทอรโมพลาสตกวลคาไนซ
คาสาคญ: ปฏกรยาไฮโดรจเนชนแบบไมใชตวเรง ยางธรรมชาตไฮโดรจเนต รามานสเปกโตรสโคป
เทอรโมพลาสตกวลคาไนซ

ix
ACKNOWLEDGEMENTS
Completely of the doctoral thesis is not finish without the support and assistance
from all people. I would like to thank them.
I would like to take my sincere gratitude to my doctoral thesis advisor, Asst. Prof.
Dr. Tulyapong Tulyapitak, Assoc. Prof. Dr. Pranee Phinyocheep, Asst. Prof. Dr. Polphat
Ruamcharoen, Asst. Prof. Dr. Jareerat Ruamcharoen and Prof. Dr. Philippe Daniel for
teaching, suggestion, English editing and proof reading of manuscript and thesis.
I am grateful to all lecturers, technical staff and my friends of Rubber Technology
and Polymer Science department, Chemistry Division of Science department, Faculty of
Science and Technology, Prince of Songkla University, Pattani campus, Rubber and
Polymer Technology program, Faculty of Science and Technology, Songkhla Rajabhat
University, Department of Chemistry, Faculty of Science, Mahidol University, Thailand
and Institut des Molécules et Matériaux du Mans, IMMM –UMR-CNRS 6283, Université
du Maine, France. Especial thank to Prof. Dr. Lazhar Benyahia, Dr. Fabienne Lagarde
and Dr. Mathieu Edely of Faculté des Sciences et techniques, Université du Maine,
France for technical help and practical advices.
I would like to extend my sincerest thanks to thesis committee, Prof. Dr. Sophie
Bistac and Assoc. Prof. Dr. Taweechai Amornsakchai for comments and reviewing this
thesis.
Thanks to the financial support from human resource development in science
project (Science Achievement Scholarship of Thailand, SAST) and the financial support
from Prince of Songkla University graduate thesis grant for Ph.D. research.
I also thank my family for support everything during as a Ph.D student.
Korn Taksapattanakul

x
CONTENTS
Page
ABSTRACT (ENGLISH) v
ABSTRACT (THAI) vii
ACKNOWLEDGEMENTS ix
CONTENTS x
LIST OF TABLES xv
LIST OF FIGURES xvii
LIST OF ABBREVIATIONS xxiv
CHAPTER 1 INTRODUCTION 1
CHAPTER 2 LITERATURE REVIEW 4
2.1 Hydrogenation of natural rubber 4
2.2 Characterization of hydrogenated natural rubber 8
2.2.1 Nuclear magnetic resonance spectroscopy 8
2.2.1.1 1H-NMR of NR and HNRs 11
2.2.1.2 13
C-NMR of NR and HNRs 12
2.2.2 Infrared spectroscopy 12
2.2.2.1 Infrared spectrum 15
2.2.2.2 Raman spectroscopy 16
2.2.3 Infrared and Raman spectra of NR and HNRs 19
2.3 Vulcanization of hydrogenated natural rubber 19
2.3.1 Peroxide vulcanization 20
2.3.2 Sulfur vulcanization 20
2.4 Thermoplastic vulcanizates 24
2.5 Characterization of thermoplastic vulcanizates 26
2.5.1 Raman imaging 27
2.5.2 Imaging methods 29
2.5.2.1 Point mapping 30
2.5.2.2 Line scanning 30

xi
CONTENTS (continued)
Page
2.5.2.3 Global mapping 31
CHAPTER 3 MATERIALS AND METHODS 33
3.1 Materials and Equipments 33
3.1.1 Materials 33
3.1.2 Equipment and Apparatus 34
3.2 Preparation of hydrogenated natural rubbers 35
3.2.1 Non-catalytic hydrogenation of natural rubber latex 35
3.2.2 Characterization of NR and HNRs 37
3.2.2.1 Chemical structure 37
3.2.2.2 Hydrogenation levels 37
3.2.2.3 cis and trans Isomerization 38
3.2.2.4 Morphology of latex by transmission electron microscopy
38
3.2.2.5 Glass transition temperature (Tg) by differential
scanning calorimetry 39
3.2.2.6 Particle size and particle size distribution 39
3.2.2.7 Hardness 39
3.2.2.8 Rheological properties 40
3.2.2.9 Gel content 40
3.2.2.10 Thermogravimetric analysis 40
3.3 Properties of NR and HNR compounds and vulcanizates 41
3.3.1 Preparation of HNR compounds 41
3.3.2 Cure properties and preparation of vulcanized rubber
sheet 41
3.3.3 Characterization of NR and HNR vulcanizates 43
3.3.3.1 Ozone and Ultraviolet (UV) resistance test 43
3.3.3.2 Raman spectroscopy 43

xii
CONTENTS (continued)
Page
3.3.3.3 Tensile properties 44
3.3.3.4 Crosslink density 45
3.4 Thermoplastic vulcanizates (TPVs) based on blends of
HNRs and PP 45
3.4.1 Preparation of TPVs 45
3.4.2 Characterization of TPVs 46
3.4.2.1 Mixing behavior and dynamic vulcanization 46
3.4.2.2 Raman mapping 46
3.4.2.3 Phase size analysis 47
3.4.2.4 Scanning electron microscopy 47
3.4.2.5 Dynamic mechanical analysis 47
CHAPTER 4 RESULTS AND DISCUSSION 49
4.1 Preparation and characterization of hydrogenated
natural rubbers 49
4.1.1 Non-catalytic hydrogenation of natural rubber latex 49
4.1.1.1 Chemical structure characterization of HNRs
by 1H-NMR 49
4.1.1.2 Effect of hydrazine 50
4.1.1.3 Effect of hydrogen peroxide 51
4.1.1.4 Effects of reaction temperature and time 52
4.1.2 Improvement of hydrogenation levels of NRL 54
4.1.2.1 Effect of solvent types 54
4.1.2.2 Effect of solvent volume 55
4.1.2.3 Effect of reaction scale-up 56
4.1.2.4 cis-trans isomerization 61
4.1.2.5 Particle size of NRL and HNRL 63
4.2 Properties of HNRs 64

xiii
CONTENTS (continued)
Page
4.2.1 Appearance 64
4.2.2 Gel content 65
4.2.3 Hardness 66
4.2.4 Glass transition temperature (Tg) 67
4.2.5 Rheological properties of NR and HNRs 68
4.2.5.1 Apparent shear stress and viscosity 68
4.2.5.2 Mooney Viscosity and Mooney Stress
Relaxation 70
4.2.6 Thermal properties 73
4.2.6.1 Decomposition properties 73
4.3 Vucanization and physical properties of HNRs 76
4.3.1 Vulcanization properties of HNR compounds 76
4.3.2 Ozone and UV resistance 78
4.3.3 Crosslink densities of HNR vulcanizates 86
4.3.4 Tensile properties of HNR vulcanizates 87
4.4 Thermoplastic vulcanizates based on dynamically
vulcanized HNR and PP blends 88
4.4.1 Mixing of TPVs 88
4.4.2 Morphological characterization of TPVs by
Raman mapping 91
4.4.3 Phase size analysis by Raman mapping technique 95
4.4.4 Determination of blend ratio by Raman spectroscopy 97
4.4.5 Dynamic mechanical behavior of TPVs 99
4.4.6 Tensile properties of TPVs 101
4.4.7 Fractured surface of TPVs 102
CHAPTER 5 CONCLUSIONS 104

xiv
CONTENTS (continued)
Page
REFERENCES 106
APPENDICES 114
CURRICULUM VITAE 145

xv
LIST OF TABLES
Table Page
2.1 Classification of accelerators and their vulcanization speed 20
2.2 Sulfur vulcanization systems 23
3.1 Experimental runs to study the effects of mole ratios of
hydrogenation degrees of NRL at 503oC for 24 hrs 36
3.2 Formulations of rubber compounds 42
3.3 Cure time (tc,90) for each rubber compounds 42
4.1 Effects of reaction scale-up on degrees of hydrogenation of NRL 57
4.2 Hydrogenation levels of HNRs calculated from 1H-NMR and
Raman spectra 61
4.3 Average particle size of NRL and HNRL 64
4.4 Power law index (n) and flow consistency (K) 69
4.5 Mooney viscosity and relaxation rate of NR and HNRs 71
4.6 Decomposition temperatures of NR, HNRs and EPDM 4725P 74
4.7 Cure properties of peroxide-vulcanized rubber compounds at
various temperatures 78
4.8 Cure properties of sulfur-vulcanized rubber compounds at
various temperatures 78
4.9 Characteristic peak frequency of unvulcanized and vulcanized HNRs 83
4.10 Integral intensity of C=C bond stretching, IC=C, at 1664 cm-1
of
NR and HNRs vulcanized by peroxide and sulfur 84
4.11 Difference integral intensity (IP) peak, IC=C, at 1664 cm-1
of
NR and HNRs vulcanized by peroxide and sulfur before and after
ozone exposure 85
4.12 Difference integral intensity (IP) peak, IC=C, at 1664 cm-1
of
NR and HNRs vulcanized by peroxide and sulfur before and after
UV exposure 86

xvi
LIST OF TABLES (continued)
Table Page
4.13 The content of each component of TPVs based on NR/PP
and 65 %HNR/PP blends 98

xvii
LIST OF FIGURES
Figure Page
2.1 Chemical structure of cis-1,4-polyisoprene 4
2.2 The magnetic field generated by nuclei spins (a) random orientation of
these dipoles in the absence of an applied field, (b) the dipole aligned
with the applied magnetic field, (c) the average alignment at a small
angle to the applied field caused by thermal motion, and (d) precession of
magnetic moment around the magnetic field at Larmor
frequency 9
2.3 Quntized energy of nuclei in the applied field 10
2.4 Energy levels for a molecule, (A) pure rotational Transitions, (B)
rotational- vibrational transitions, and (C) rotational-vibrational-
electronic transitions 13
2.5 Model of a harmonic oscillator (a) mass m bound to a spring with force
constant k and (b) masses m1 and m2 connected by the spring
with the same force constant 14
2.6 Jablonski diagram illustrating quantum energy for Rayleigh and
Raman scattering 17
2.7 Polarization of the molecule induced by the electric field of the
incident light 18
2.8 Mechanisms of NR vulcanization by dicumyl peroxide 21
2.9 Possible crosslink structures of peroxide-cured NR 22
2.10 Possible scission reaction in ethylene-propylene rubbe 22
2.11 Reaction pathway for accelerated sulfur vulcanization 24
2.12 Torque-time characteristics of a dynamic vulcanization process in an
internal mixer for peroxide-vulcanized PP/EPR (40/60) blend 26

xviii
LIST OF FIGURES (continued)
Figure Page
2.13 Schematic of morphology transformation during the dynamic
vulcanization of polymer blends 27
2.14 Schematic diagrams from bright field imaging to Raman mapping. The
hypercube is a collection of Raman intensities as a function of I(x, y, ).
At a fixed position (xi, yi), it is a localized Raman
spectrum. At a fixed wave number k, it is a Raman intensity map 28
2.15 Schematic diagrams describing (a) point mapping, (b) line scanning,
and (c) global mapping. The top row illustrates the illumination pattern
on the sample and the bottom row shows the image onto the
Detector 29
4.1 1H-NMR spectra of (a) 0 % HNR, (b) 11 %HNR and (d) 18 %HNR 49
4.2 Effect of moles of hydrazine on degrees of hydrogenation of NRL
(mole ratio of [C=C]:[H2O2] is 1:1) 51
4.3 Effect of moles of hydrogen peroxide on degrees of hydrogenation of
NRL (mole ratio of [C=C]:[N2H4] = 1:1) 52
4.4 Effect of reaction temperature and reaction time on degrees of
hydrogenation of NRL (mole ratio of [C=C]:[N2H4]:[H2O2] is 1:1.5:1
and volume ratio of toluene to NRL is 0.1) 53
4.5 1H-NMR spectra of (a) NR, (b) 14 %HNR prepared by swelling NRL
with hexane, and (c) 16 %HNR prepared by swelling NRL with
toluene (volume ration of solvent to NRL is 0.1) 54
4.6 1H-NMR spectra of NR and HNRs at various toluene/NRL volume
ratios; (a) NR, (b) 18 %HNR (no toluene), (c) 21%HNR (volume ratio
= 0.1), (d) 29 %HNR (volume ratio = 0.4), (e) 33 %HNR (volume
ratio = 0.7), and (f) 42 %HNR (volume ratio = 0.1) 55

xix
LIST OF FIGURES (continued)
Figure Page
4.7 Effects of toluene /NRL volume ratios on degrees of hydrogenation
of NRL 56
4.8 TEM images at 40k magnification of (a) unswollen NRL particle, (b)
NRL particle swollen by 10% volume of toluene, and (c) NRL
particle swollen by 100% volume of toluene 57
4.9 Effects of increased reaction volume on collision of reacting particles
due to high pressure build-up 58
4.10 1H-NMR spectra of (a) NR, (b) 14 %HNR, (c) 33 %HNR and (d)
65 %HNR 59
4.11 Raman spectra of (a) NR, (b) 14 %HNR, (c) 33 %HNR, and (d)
65%HNR 59
4.12 FT-IR spectra of (a) NR, (b) 14 %HNR, (c) 33 %HNR, and (d)
65 %HNR 60
4.13 Correlation between degrees of hydrogenation calculated from
Raman and1H NMR spectra 61
4.14 1H-NMR spectra of (a) NR, (b) 14%HNR, (c) 33%HNR, and
65 %HNR 62
4.15 cis and trans contents as a function of hydrogenation levels of HNRs 63
4.16 The mechanism of cis-trans isomerization 63
4.17 Particle size distributions of various latices; NRL, 14%HNRL,
33%HNRL, and 65%HNRL 64
4.18 Appearance of (a) NR, (b) 14%HNR, (c) 33%HNR and (d) 65%HNR 65
4.19 Gel contents as a function of hydrogenation levels of HNRs 66
4.20 Crosslinking reaction initiated by hydroxyl radical (OH) 66
4.21 Effect of degree of hydrogenation on hardness of HNRs 67
4.22 DSC thermograms of NR, 14%HNR, 33%HNR, and 65 %HNR 68

xx
LIST OF FIGURES (continued)
Figure Page
4.23 Apparent shear stresses and viscosities of NR and HNRs as a
function of shear rate 69
4.24 Schematic of structural orientation of polymers under shear field 70
4.25 Time-dependent Mooney viscosities of NR, 14%HNR, 33%HNR
and 65 %HNR 71
4.26 Mooney stress relaxation of NR, 14% HNR, 33% HNR and 65% HNR 72
4.27 TGA curves of NR, 14 %HNR, 33 %HNR, 65 %HNR and EPDM
(heating rate of 20oC/min under oxygen atmosphere) 73
4.28 Derivatives of TGA curves of NR, 14 %HNR, 33 %HNR, 65 %HNR
and EPDM (heating rate of 20oC/min under oxygen atmosphere) 74
4.29 Raman spectra of (a) NR, (b) 65 %HNR and (c) EPDM 4725P 75
4.30 FT-IR spectra of (a) NR, (b) 65 %HNR and (c) EPDM 4725P 75
4.31 ODR curves of NR and HNR compounds vulcanized by dicumyl
peroxide (left column) and sulfur (right column) at 150oC (a, b),
180oC (c, d), and 200
oC (e, f) 77
4.32 Optical photographs of cracks on surfaces of rubbers vulcanized by
peroxide after ozone exposure; (a) NR, (b) 14%HNR, (c) 33%HNR,
and (d) 65%HNR 79
4.33 Optical photographs of cracks on surfaces of rubber vulcanized by
sulfur after ozone exposure; (a) NR, (b) 14%HNR, (c) 33%HNR,
and (d) 65%HNR 80
4.34 Optical photographs of cracks on surfaces of rubber vulcanized by
peroxide after UV exposure; (a) NR, (b) 14%HNR, (c) 33%HNR,
and (d) 65%HNR 81
4.35 Optical photographs of cracks on surfaces of rubber vulcanized by
sulfur after UV exposure; (a) NR, (b) 14 %HNR, (c) 33 %HNR,
and (d) 65 %HNR 82

xxi
LIST OF FIGURES (continued)
Figure Page
4.36 Mechanisms of ozone degradation in diene rubbers 82
4.37 Raman spectra of 65 %HNR; (U) unvulcanized, (P) peroxide-
vulcanized, and (S) sulfur-vulcanized 83
4.38 Raman spectra of peroxide-cured 65%HNR before (black line)
and after (red line) ozone exposure 85
4.39 Crosslink densities versus degree of hydrogenation by peroxide
and sulfur cure 86
4.40 True stress - true strain curves of NR and HNRs vulcanized by
peroxide 87
4.41 True stress - true strain curves of NR and HNRs vulcanized by sulfur 88
4.42 Mixing torque-time profiles of TPVs prepared from blends of
NR/PP and 65 %HNR/PP at blend ratios 70/30 and 50/50
vulcanized with peroxide (left column) and sulfur (right column) 89
4.43 Mixing torque-time profiles of TPVs prepared from blends of
65 %HNR/PP at blend ratio 70/30 and 50/50 vulcanized with
peroxide 90
4.44 Morphology of simple blends; (a) NR/PP and (b) 65%HNR/PP at
blend ratio of 50/50 (wt/wt%); Raman optical micrograph (left):
rubber phase (white), PP phase (dark); Raman spectra (middle);
and Raman mapping (right): PP phase (blue) and rubber phase
(red) 92
4.45 Morphology of TPVs prepared from dynamically vulcanized
blends of (a) NR/PP and (b) 65%HNR/PP at 50/50 blend ratio
vulcanized by peroxide; Raman optical micrograph (left), rubber
phase (white) and PP phase (dark); Raman spectra (middle); and
Raman mapping (right), PP phase (blue) and rubber phase (red) 93

xxii
LIST OF FIGURES (continued)
Figure Page
4.46 Morphology of TPVs prepared from dynamically vulcanized
blends of (a) NR/PP and (b) 65%HNR/PP at 50/50 blend ratio
vulcanized by sulfur; Raman optical micrograph (left), rubber
phase (white) and PP phase (dark); Raman spectra (middle); and
Raman mapping (right), PP phase (blue) and rubber phase (red) 94
4.47 Raman maps of TPVs based on 50/50 of 65 %HNR/PP
dynamically vulcanized blends cured by peroxide, revealing
crosslinked rubber particles (red) dispersed in matrix PP (blue) 95
4.48 SEM micrograph of TPVs based on 50/50 of 65 %HNR/PP
dynamically vulcanized blends cured by peroxide, revealing
crosslinked rubber particles (dark hole) dispersed in PP matrix
(magnification 4,500x) 96
4.49 Correlation between of particle sizes of crosslinked rubber phase
of TPVs measured by Raman mapping and SEM methods (50/50
of 65%HNR/PP blend) 96
4.50 Raman spectra of TPVs based on 65 %HNR/PP blends cured by
peroxide at blend ratios of (a) 70/30, (b) 60/40, (c) 50/50, (d) 40/60 97
4.51 Raman maps of TPVs based on 65 %HNR/PP blends cured by
peroxide with blend ratio (a) 70/30 and (b) 40/60 (PP phase (blue)
and rubber phase (red)) 98
4.52 Strain-dependent storage modulus of 65 %HNR vulcanizates and
TPVs based on 65%HNR/PP blends vulcanized by peroxide at 7
70/30 and 50/50 blend ratios 100
4.53 Strain-dependent storage modulus of 65 %HNR vulcanizates and
TPVs based on 65 %HNR/PP blends vulcanized by sulfur at 70/30
and 50/50 blend ratios 100

xxiii
LIST OF FIGURES (continued)
Figure Page
4.54 True stress-true strain curves of HNR vulcanizate and peroxide-
cured TPVs based on 65%HNR/PP blends at various blend ratios 101
4.55 Tensile properties of peroxide-cured TPVs based on 65
%HNR/PP blends as a function of rubber contents 102
4.56 The fractured surfaces of peroxide-cured TPVs based on
65%HNR/PP blends at blend ratio of (a) 70/30 and (b) 50/50 103

xxiv
LIST OF ABBREVIATIONS
NR Natural rubber
NRL Natural rubber latex
HNRs Hydrogenated natural rubbers
EPR Ethylene propylene rubber
EPDM Ethylene propylene diene monomer rubber
TMS Tetramethylsilane
TPVs Thermoplastic vulcanizates
NMR Nuclear magnetic resonance
PP Polypropylene
UV Ultraviolet
1H-NMR Proton nuclear magnetic resonance
13C-NMR Carbon nuclear magnetic resonance
DSC Differential scanning calorimetry
PSD Particle size and particle size distributions
PIDS Polarization intensity differential scattering
TGA Thermogravimetric analysis
DCP Dicumyl peroxide
TMTD Tetramethylthiuram disulfide
MBT 2-Mercaptobenzothaiazole
TAC Triallyl cyanurate
CV Conventional vulcanization
EV Efficient vulcanization
SEV Semi-efficient vulcanization
IR Infrared
SEM Scanning electron microscope
AFM Atomic force microscopy
TEM Transmission electron microscopy

xxv
LIST OF ABBREVIATIONS (continued)
DMA Dynamic mechanical analysis
DRC Dry rubber content
KAS Kissinger-Akahira-Sunose
1D One-dimensional
TS Tensile strength
I Nuclear spin number
Ho Magnetic field
Magnetogyric ratio
Magnetic moment
Ih/2 Angular momentum
E Energy level
h Planck’s constant
o Thermal equilibrium magnetization
N1 Number of spins per unit volume
k Boltzmann’s constant
T Absolute temperature
o Static magnetic susceptibility
Wave length
Frequency
Wave number
c Speed of light
n Refractive index
Ep Photons of the energy
Erot Rotational energy
Evib Vibrational energy
Eel Electronic energy
m Mass
xxvi
LIST OF ABBREVIATIONS (continued)
k Spring force constant
F Force
x Distance
Vibrational frequency
Phase angle
A Absorbance
I0 Intensity in the background spectrum
I Intensity in the sample spectrum
Absorptivity
b Path length
c Concentration
%T Percent transmission
P Polarization
Polarizability
E Electric field
t Time
j A characteristic frequency for the jth
normal mode
o Inherent polarizability
EPR / PP Viscosity ratio
X Hydrogenation levels
Tg Glass transition temperature
W Weigh
Ti Initial decomposition temperature
k0 A constant
Ea Activation energy
R Gas constant
g() Kinetic model

xxvii
LIST OF ABBREVIATIONS (continued)
Fraction of reactant remaining
Heating rate
Tz Decomposition temperature
ML Minimum torque
MH Maximum torque
ts1 Scorch time
Tc,90 Cure time
A A true cross-sectional area
Ao An original cross-sectional area
lo An original length
l A deformed length
t True strain
tb Tensile strength
Fb Force at break.
b Elongation at break or ultimate strain
lb Specimen length at fracture
r Volume fraction of the rubber
s Density of toluene
r Density of rubber
Crosslink density
sV
Molar volume of toluene
1 Polymer-solvent interaction parameter
1
CHAPTER 1
INTRODUCTION
1.1 Background and rational
Natural rubber (NR) is an important material widely used in rubber
industry because of its excellent mechanical properties. Chemical structure of NR
consists of cis-1,4-polyisoprene. However, unsaturation of the backbone makes NR
susceptible to degradation when exposed to oxygen, ozone, and sunlight. In addition,
heat resistance of NR is also poor. Attempts have been made to improve these
drawbacks. One is to chemically modify chemical structure of NR by turning
unsaturated units into saturated ones which can be achieved via epoxidation,
maleinization, halogenations, hydrogenation, and so on. Hydrogenation of NR
involved addition of hydrogen molecules to double bonds of isoprene units in the
backbone chains. The products obtained can be either partially or fully hydrogenated
natural rubbers (HNRs) whose thermal and degradation properties will be improved.
HNRs are expected as potential replacements for ethylene propylene (EPR) and
ethylene propylene diene monomer (EPDM) rubbers.
Hydrogenation of NR can be carried out by both catalytic and non-
catalytic processes. In catalytic processes, homogeneous and heterogeneous catalysts
can be used. The dominant homogeneous catalysts are complexes of group VIII
transition metals in the second row of the periodic table, such as rhodium, ruthenium,
and palladium. Heterogeneous catalysts rely on insoluble transition metal catalysts
such as Pd/Al2O3, Pd/CaCO3, and Pd/BaSO4. Generally, homogeneous hydrogenation
results in low conversion and scission of polymer backbone. In addition, the catalysts
are difficult to be removed from the system. Heterogeneous catalysts yield high
conversions, do not cause chain scission, and can be easily removed. However,
catalytic hydrogenation processes are normally carried out at high temperatures and
pressures, which are difficult to handle, and some systems are poisonous.
Non-catalytic processes employ hydrogenation reagents generated
from various types of reactions, such as decarboxylation of potassium
azodicarboxylate, photochemical irradiation of 1-thia-3,4-diazolidine-2,5-dione,

2
thermolysis of arylsulfonylhydrazide, the thermal decomposition of p-toluenesulfonyl
hydrazide (p-TSH) and the oxidation of hydrazine by hydrogen peroxide.
Complete hydrogenation of NR would provide an alternating EPR with
better thermal, oxidative, and chemical resistance than the original NR. However, it is
not easily to achieve. The unsaturated isoprene units can be only partially
hydrogenated. The advantage of the partially HNRs is that they possess the elastic
character of unsaturated part and the plastic behaviors of saturated part.
Thermoplastic vulcanizates (TPVs) have become potential materials in
rubber industry. TPVs can be prepared via dynamic vulcanization, in which an
elastomer is vulcanized under dynamic shear to generate finely dispersed cross-linked
rubber particles distributed in the continuous thermoplastic matrix. Important
commercial TPVs are based on blends of EPDM and polypropylene (PP), for
example, Santoprene, which are used as substitutes for thermoset EPDM in
windshield rubber seal applications. Due to its high melting point and high
crystallinity, PP provides TPVs good mechanical properties even at elevated
temperatures. EPDM is used because it is stable against ozone and high temperatures,
thus giving the corresponding TPVs good heat and ozone resistance. However, there
has not been yet reported on TPVs based on HNR/PP blends. It is expected that
HNR/PP blends when dynamically cured would give TPVs with good mechanical
properties and ozone and heat resistance as well as those based on EPDM/PP blends.
In this research, hydrogenation of NR is carried out by using a non-
catalytic process employing oxidation of hydrazine by hydrogen peroxide. Nuclear
magnetic resonance (NMR) and Raman spectroscopic techniques are employed to
investigate the chemical structure of the HNRs and to quantify the degree of
hydrogenation. The thermoplastic vulcanizates (TPVs) will be prepared from blends
of HNR and PP via dynamic vulcanization using peroxide and sulfur as curing agents.
Thermal, mechanical and morphological properties of TPVs will be investigated.

3
1.2 Objectives
1.2.1 To prepare HNRs with various degrees of hydrogenation using
diimide generated in situ from the reaction of hydrazine and
hydrogen peroxide.
1.2.2 To prepare TPVs based on blends of HNR and PP.
1.3 Expected advantages
1.3.1 Realization of the techniques for preparation of HNR by using
hydrazine and hydrogen peroxide and for preparation of TPVs
based on blends of HNR and PP.
1.3.2 To obtain HNRs and TPVs with better thermal and mechanical
properties for a wide range of applications.

4
CHAPTER 2
LITERATURE REVIEW
Natural rubber (NR) is produced from the latex of the Heavea
brasiliensis tree. The chemical structure of NR is cis-1,4-polyisoprene (Fig. 2.1). It is
widely used in rubber industries, for example, tire, rubber parts in automotive
industries, and etc., due to its good mechanical and dynamic properties. However, the
presence of carbon–carbon double bonds in the backbone makes NR prone to degrade
by thermal-oxidation, ozone, and ultraviolet (UV) radiation. In addition, hydrocarbon
nature of NR results in its low resistance to many types of organic solvents, fuel, and
gasoline. These drawbacks lead to limit use of NR in many applications. Improvement
of these disadvantages can be achieved by a number of ways, i.e., careful selection of
cure systems, use of suitable antidegradants in compound formulations, blending with
other polymers with good degradation properties, and structural modification by
chemical means.
x
C C
H3C
CH2CH2
H
Figure 2.1 Chemical structure of cis-1,4-polyisoprene (Nagdi, 1993)
2.1 Hydrogenation of natural rubber
Chemical modification of NR continues to be an active research field
for the improvement of properties of the rubber. This is because double bonds in
rubber chains are very active and susceptible to various chemical reactions, such as
epoxidation, halogenation, maleinization and hydrogenation. Hydrogenation is an
important method for improving and modifying properties of unsaturated polymers to
provide greater stability against thermal, oxidative, (Phinyocheep et al., 2002; Samran
et al., 2004a; Hinchiranan et al., 2006a; Hinchiranan et al., 2009) and radiation-

5
induced degradation (Mahittikul et al., 2007a; Mahittikul et al., 2007b).
Hydrogenation of NR involves the addition of hydrogen molecules into unsaturated
isoprene units to give saturated moieties (Hudlicky, 1984; Rylander, 1985).
Hydrogenation of diene-based polymers can be brought about by
catalytic and non-catalytic processes. For catalytic processes, homogeneous and
heterogeneous catalysts can be employed. Homogeneous catalysts are based on
rhodium, ruthenium, and palladium complexes (Hinchiranan et al., 2006a;
Hinchiranan et al., 2006b), while heterogeneous ones are dominated by insoluble
transition metal catalysts such as kieselguhr-supported nickel (Rachapudy et al., 1979;
Singha et al., 1997), and calcium carbonate-supported palladium (Rachapudy et al.,
1979). Since the reaction rates of the heterogeneous reaction are usually slower than
those of homogeneous hydrogenation (Neon et al., 1996), therefore, homogeneous
catalysts are more favorable than heterogeneous catalysts (Hinchiranan et al., 2006a;
Hinchiranan et al., 2006b). However, catalytic processes need careful operation due to
requirement of high pressure of hydrogen, difficulty in catalyst removal, and toxicity
of some catalyst systems (Singha et al., 1997).
Non-catalytic processes utilize organic molecules which can generate
hydrogenation agents such as diimide (N2H2). Diimide can provide a hydrogen
molecule to the carbon–carbon double bonds without using a catalyst. Diimide
hydrogenation can be easily performed at atmospheric pressure with simpler devices
and processes, therefore, it is more convenient than catalytic hydrogenation (Samran
et al., 2004a; Samran et al., 2004b). Diimide can be produced by various methods,
such as the oxidation of hydrazine, the thermal decomposition of
arenesulfonylhydrazides, the thermal decomposition of p-toluenesulfonylhydrazide
(p-TSH), and the photochemical irradiation of 1-thia-3,4-diazolidine-2,5-dione
(Harwood et al., 1973; De Sarkar et al., 2000; Samran et al., 2004b; Lin, 2005;
Arayapranee and Rempel, 2009; Simma et al., 2009; Mahittikul et al., 2007a).
However, hydrogenation of unsaturated elastomers using diimide
generated in situ from the thermal decomposition of p-toluenesulfonyl hydrazide (p-
TSH) resulted in side reactions. Catalytic oxidation of hydrazine by hydrogen
peroxide had also some drawbacks, i.e., difficulty in catalyst removal, catalyst
toxicity, and undesired reactions (Xie et al., 2003; Lin, 2005). Thus, the non-catalytic

6
process utilizing diimide in situ generated from reaction between hydrazine (N2H4)
and hydrogen peroxide (H2O2) is more interesting approach because it can be easily
carried out under mild condition with less limitation. The reactions between N2O4 and
H2O2 to form diimide are redox reactions. The reaction between hydrazine and water
is represented by the following equilibrium and is postulated to form a protonated
intermediate, hydrazonium ion (N2H5+), (De Sarkar et al., 1997).
N2H4 + H2O N2H5 + OH
Hydrazonium ion (N2H5+) is further oxidized by H2O2 to form diimide as follows
N2H5 + H2O2 N2H3 + 2H2O
N2H3 + N2H4 N2H5 + N2H2
Diimide may exist as cis-trans isomers (eq. (2.4)); only the cis isomer serves as a
reducing agent for NR (eq. (2.5)) (Hudlicky, 1984).
+
diimide (cis) diimide (trans)
or +NH2 NH2 H2O2 N N
HH
N N
H
H
2H2O
nitrogen gas
(stable)
n
+N N
cis-1,4 polyisoprene diimide (cis)
+
n
N N
Transition state
hydrogenated product
C C
HH3C
H2C CH2
HHN2C C
HH3C
H2C CH2H H
C C
H
CH2H2C
HH
H3C
The trans isomer will lead to decomposition reactions of diimide as shown in eq. (2.6)
and (2.7), respectively.
diimide (trans)
N N
H
H
N2 + H2
(2.5)
(2.6)
(2.4)
(2.1)
(2.2)
(2.3)

7
diimide (trans)
N N
H
H
N2 +2 NH2 NH2
The trans isomer is slightly more stable than the cis isomer (Handt et
al., 2006). Although these species are stable at very low temperature (-196oC), they
can undergo disproportionation to hydrazine and nitrogen at higher temperature (-
180oC) (Pasto and Taylor, 1991).
It was found that redox reactions between N2H4 and H2O2 and
decomposition of H2O2 also produced radicals. This suggested that excessive amounts
of H2O2 would lead to an increase in the dissociation of H2O2 to form active hydroxyl
radicals (OH) (Jones, 1999; Yves and Fontanille, 2008) as shown in eq. (2.8).
Therefore, crosslinking reaction can be occurred through the formation of rubber
radical (eq. 2.9) and then rubber radicals react to form the gel formation (eq. 2.10)
(Xie et al., 2003).
H2O2 HO + OH
hydrogen peroxide hydroxyl radical
cis-1,4 polyisoprene
+ +
hydroxyl radical
C C
HH3C
H2C CH2
C C
H
OH C C
H
CH
C C
H
H2O
H3C
CH2H2C
H3C H3C
CH2H2CH2C
C C
H
CH
C C
HH3C H3C
CH2H2C
n
C C
H
H2C CH
C C
HH3C H3C
CH2H2C
C C
CH
H3C H
C C
CH2H2C H2C
HH3Cn
crosslinking
H2C
(2.7)
(2.9)
(2.10)
(2.8)

8
2.2 Characterization of hydrogenated natural rubber
NR and HNRs can be characterized by various methods such as proton
nuclear magnetic resonance (1H-NMR) (Phinyocheep et al., 2002; Samran et al.,
2004c; Mahittikul et al., 2007b), infrared (Samran et al., 2004c; Hinchiranan et al.,
2006b; Mahittikul et al.,2007b) and Raman spectroscopy (Jackson et al., 1990;
Hendra et al., 1994; Xue, 1997; Samran et al., 2004a). These techniques give the
details of chemical structures of NR and HNRs.
2.2.1 Nuclear magnetic resonance (NMR) Spectroscopy
NMR techniques can be employed to molecules containing atomic
nuclei possessing spins as described by the nuclear spin number (I). The nuclear spin
can generate a small magnetic field. These dipoles assume random orientation in the
absence of an applied magnetic field (Figure 2.2 (a)). In NMR, a constant external
magnetic field (Ho) is applied to the nuclei causing them to align in the direction of
the applied field (Figure 2.2 (b)). However, due to angular momentum and thermal
motion of the nuclei, the magnetic moments will not completely align with the
direction of the field (Figure 2.2 (c)). The torque from the applied field forces the
magnetic moment to precess around the direction of the field at a characteristic
angular frequency known as Larmor frequency, o, which is proportional to Ho and
given by
oHsrado )/( (2.11)
or oHMHzo
2
)( (2.12)
where is the magnetogyric ratio or the ratio of magnetic moment () and angular
momentum (Ih/2).

9
Figure 2.2 The magnetic field generated by nuclei spins (a) random orientation of
these dipoles in the absence of an applied field, (b) the dipole aligned with the applied
magnetic field, (c) the average alignment at a small angle to the applied field caused
by thermal motion, and (d) precession of magnetic moment around the magnetic field
at Larmor frequency (Koenig, 1999)

10
The nuclei with a spin number of 1/2 assume two energy states;
aligned with the field (lower energy) and aligned against the field (higher energy) as
shown in Figure 2.3.
Figure 2.3 Quantized energy of nuclei in the applied field
The energy level (E) is given by
oHhoHh
E
2
(2.13)
where h is Planck’s constant. At equilibrium, the spins are distributed between these
two quantum energy levels according to Boltzmann distribution. Due to thermal
motion and interactions between the molecules the magnetic moments of the protons
are randomly oriented. The average magnetization is, however, preferentially aligned
along the magnetic field. This average magnetic moment is called the thermal
equilibrium magnetization, o, which is given by
oooo HHIIhkT
N
)1(
3
221 (2.14)
where N1 is the number of spins per unit volume, k is Boltzmann’s constant, T is the
absolute temperature, o is the static magnetic susceptibility, and Ho is the applied
magnetic field. The average magnetization is approximately 1.4 ppm meaning that
there are 1.4 excess aligned protons per million protons. The intensity of NMR signal
is proportional to o and directly related to Ho. The vector sum along Ho of the
individual spin moments is called the macroscopic nuclear magnetization, (Figure
+Ho
2Ho
-Ho
I = 1/2

11
2.2 (d)). The small difference in size of the two opposing populations results in a net
magnetization vector, , in the direction of Ho. For the proton with spins of 1/2, this
equilibrium magnetization increases with field strength Ho and inversely proportional
to T. As the spins are randomly oriented along the direction of Ho, the z-axis, which is
perpendicular to the xy-plane, thus, no net magnetization is in that plane.
If a second, less intense magnetic field H1, for example, radio-
frequency electromagnetic field tuned to the Larmor frequency, is applied along the x-
axis, the spins will start to precess about the x-axis at a frequency given by
ohoE (2.15)
In terms of the applied magnetic field, the frequency of the radio-frequency field is
oo H (2.16)
This equation explains the resonance condition for the NMR experiment and the
resonant radio-frequency corresponds to the Larmor frequency for the applied
magnetic field. In a given applied magnetic field, different nuclei resonate at widely
different frequencies, due to difference in for each nuclear isotope. For example in a
magnetic field of 1T, the frequency of 1H is 42.576 MHz, where as that of
13C is
10.705 MHz.
If the short radio-frequency pulse at the Larmor frequency is applied,
all spins are precessed together about the x-axis as a coherent packet. It is possible to
rotate at any given angle by adjusting the duration, tp, of the radio-frequency pulse.
In usual NMR measurement, a 90o radio-frequency pulse is applied along the x-axis to
flip over the z-axis to the y-axis where it can be detected.
2.2.1.1 1H-NMR of NR and HNRs
1H-NMR analysis of NR revealed three main characteristic peaks at
5.12, 2.03, and 1.67 ppm, corresponding to proton adjacent to C=C bond, methylene,
and methyl protons of unsaturated unit, respectively. For HNR samples, the intensity
of the peak at 5.12 and 1.67 ppm was reported to decrease with increasing
hydrogenation time. The increase in the intensity of the methyl and methylene proton
peaks at 0.84 and 1.1-1.3 ppm, respectively, with hydrogenation time was due to
transformation of unsaturated double bonds into saturated single bonds. It was also

12
reported that the degrees of hydrogenation could be determined by comparison of the
integrals of signal at 5.12 ppm with those for proton signal of saturated units (Samran
et al., 2004c).
2.2.1.2 13
C-NMR of NR and HNRs
In the case of NR, 13
C-NMR results showed the strong carbon signals
of C=C bond of cis-isoprene at 135.2 and 125.5 ppm. Three peaks corresponding to
methyl and two methylene carbons of unsaturated unit were at 23.4, 26.4, and 32.2
ppm, respectively. After hydrogenation, the appearance of the peaks at 19.5, 33.0, and
37.1 ppm assigning for the methyl, methane, and methylene carbon of saturated
moieties was observed. Their intensity increased with increasing hydrogenation time.
13C-NMR analysis revealed that cis-trans isomerization of isoprene units also took
place as evidenced by the peaks at 134.9 and 124.7 ppm corresponding to olefinic
carbons of trans-polyisoprene of HNRs (Samran et al., 2004c).
2.2.2 Infrared (IR) spectroscopy
Infrared spectroscopy is the most common spectroscopic technique
used for characterizing polymeric materials. It is used to elucidate the details of
molecular structures and intermolecular interactions of polymers. IR spectroscopy
probes the oscillation of atoms in molecules. IR light is an electromagnetic radiation
consisting of alternating electric and magnetic fields which can be described by a
continuous sinusoidal wave like motion. For IR and Raman spectroscopy, only the
electric field is considered. The important parameters are the wave length (),
frequency (), and wave number ( ), which are related by
1
)/(
nc (2.17)
where c is the speed of light and n is the refractive index of the medium through
which the light passes. The IR radiation is emitted from the source with the photons of
the energy (Ep) given by
hE p (2.18)
where h is Planck’s constant. Photons of specific energy may be absorbed or emitted
by a molecule leading to energy transfer. If the molecule absorbs the energy, it is

13
raised from ground to the excited state (Figure 2.4). The rotational (Erot), vibrational
(Evib), or electronic (Eel) energy is changed by E,
hchE (2.19)
Figure 2.4 Energy levels for a molecule, (A) pure rotational transitions, (B)
rotational-vibrational transitions, and (C) rotational-vibrational-electronic transitions
Each atom has three degrees of freedom so that it can move
independently along each axes of the Cartesian coordinate system. For a molecule
consisted of N atoms, there will be 3N degrees of motional freedom. Three are
involved the simultaneous moving of all atoms in the same direction parallel to the
axes of the Cartesian coordinate system or translational motions. Another three
degrees of freedom do not change the distance between atoms. They are involved with
rotational motions about the axes of inertial ellipsoid of the molecule. The remaining
3N – 6 degrees are motions that cause the change in the distance between atoms, the
length of chemical bonds, and the bond angles. All vibrational motions of the
molecule are caused by superposition of 3N – 6 non-interacting normal vibrations.
A simple model describing the vibrating molecule consists of an atom
of mass m bound to a large mass by the weightless spring with the force constant k

14
(Figure 2.5 (a)). The force F necessary for moving the atom by a distance x from an
equilibrium position is given by
kxF (2.20)
The negative sign indicates that this force is in opposite direction to elongation.
Figure 2.5 Model of a harmonic oscillator (a) mass m bound to a spring with force
constant k and (b) masses m1 and m2 connected by the spring with the same force
constant
According to Newton’s law, the force is also proportional to the mass
m and the acceleration;
2
2
dt
xdmF (2.21)
Combination of equations (2.20) and (2.21) gives rise to
kxdt
xdm
2
2
(2.22)
For harmonic oscillation,
)2(cos txx o (2.23)
where is the vibrational frequency and is the phase angle. The second derivative
of x with respect to t is given by
xtxdt
xdo
2222
2
2
4)2(cos4 (2.24)
Inserting equation (2.24) into (2.22) yields

15
m
k
2
1 (2.25)
For a diatomic molecule (Figure 2.5 (a)), the mass m or reduced mass can be obtained
from
21
111
mmm (2.26)
Therefore, the frequency of vibration of diatomic molecule is given by
kmm
21
11
2
1
(2.27)
In vibrational spectroscopy, the frequency is commonly measured in wavenumber, .
If atomic mass units are employed and the spring constant is measured in N/cm, the
wave number of diatomic vibration is given by (Colthup et al., 1975)
kmm
cm
21
1 111303)( (2.28)
A C-H group of atomic masses of 12 and 1 units, respectively, with the force constant
of the bond of 5 N/cm will have the wavenumber of 3033 cm-1
For polyatomic molecules, the bonds will experience various types of
vibrations and rotations. Therefore, atoms continuously fluctuate over times.
Vibrational motions for diatomic or triatomic molecules are easily defined as
stretching and bending. However, this is not the case for large molecules which
experience several vibrational motions and interactions. When the vibration causes
the interatomic distance along the axis of the bond between two atoms to change, this
process is called bond stretching. If the vibration results in the change in the bond
angle, this process is termed bending. Four bending vibrations, namely, wagging,
twisting, rocking, and scissoring do exist.
2.2.2.1 Infrared spectrum (Smith, 2011)
Infrared spectrum is a plot of measured infrared intensity against wave
number, which is always plotted in absorbance units implying amount of infrared
light absorbed by a sample. The absorbance spectrum is calculated from

16
I
IA olog (2.29)
where A is the absorbance, I0 is the intensity in the background spectrum, and I is the
intensity in the sample spectrum.
Absorbance can be related to the concentration of molecules through
Beer’s law;
bcA (2.30)
where is absorptivity, b is path length, and c is concentration. The area or height of
a peak in absorption spectrum is proportional to concentration of molecules. Infrared
spectrum can be plotted in terms of percent transmission (%T) against wave number.
%T can be calculated from
100%
oI
IT (2.31)
2.2.2.2 Raman spectroscopy (Colthup et al., 1975; McCreery, 2000)
When the light of energy h irradiated a molecule, the energy may be
absorbed, transmitted, or scattered. In Rayleigh scattering, the molecules scatter light
with no change in individual photon wavelength. Rayleigh scattering can be
considered as an elastic collision between the molecule and the incident proton.
Because the energy for molecular vibration and rotation is unchanged in the elastic
collision, therefore, the energy and the frequency of the scattered photons are the
same as those of the incident photons (Figure 2.6). The Raman effect can be
considered as an inelastic collision between the incident photon and the molecule
resulting in the change in the energy and the frequency of the scattered photon. The
scattered photon has an energy of hj, corresponding to a vibrational transition, which
is different from the energy (h) of the incident photon by the amount Ej
jj hhE (2.32)
At ambient temperature, most molecules are in their vibrational ground state and
much smaller number of molecules is in the virtual excited state which is not
necessarily a true quantum state of the molecule. The virtual state can be considered

17
as a very short lived distortion of the electron cloud caused by the oscillating electric
field of the light. The electron cloud of the molecule can also be perturbed by
molecular vibration. It is possible that optical oscillation and molecular vibration can
interact, resulting in Raman scattering.
When the molecule is collided by the oscillating electric field of the
incident light, a polarization of the molecule is induced (Figure 2.7). This induced
dipole irradiates the scattered light with or without exchanging energy with vibrations
of the molecule. The strength of polarization (P) is given by
EP (2.33)
where is the polarizability and E is the electric field. The classical Raman scattering
is based on the effects of molecular vibrations on the polarizability. Consider the laser
light of the electric field E which is given by
tEE o 2cos (2.34)
Figure 2.6 Jablonski diagram illustrating quantum energy for Rayleigh and Raman
scattering

18
Figure 2.7 Polarization of the molecule induced by the electric field of the incident
light (McCreery, 2000)
where t is time and is the frequency of the laser light. Normally, molecular
vibrations are considered to be composed of normal modes, Qj, of which there are 3N-
6 (or 3N-5 for a linear molecule) in a molecule with N atoms. Qj is given by
tQQ jojj 2cos (2.35)
where j is a characteristic frequency for the jth
normal mode. The polarizability of the
molecule will be modulated by the molecular vibration so that
j
j
o QQ
(2.36)
Combination of equations (2.33) and (2.34) together with ignoring the higher order
terms of equation (2.36) results in
ttQQ
EtEP joj
j
ooo 2cos2cos2cos
(2.37)
By noting that cos a cos b = [cos (a-b) + cos (a+b)]/2, equation (2.37) can be
rewritten as
2
)(2cos
2
)(2cos2cos
tQ
QE
tQ
QEtEP
joj
j
o
joj
j
ooo
(2.38)

19
Equation (2.38) implies that the light will be scattered at three frequencies. The first
term corresponds to Rayleigh scattering, for which the scattered light will have the
same frequency as the laser, and its magnitude is proportional to the inherent
polarizability (o) of the molecule. The second term is Stokes scattering which occurs
at -j and the third term is Anti-Stokes scattering at +j (Figure 2.6). j is the same
frequency which would be observed in IR absorption for a given vibration mode.
Although equation (2.38) is incomplete, it, however, does provide some useful
insights. First, polarization and scattering intensities (both Rayleigh and Raman) are
linear with laser intensity. Second, Raman scattering results only from vibrations that
change the polarizability. Third, Raman shifts can be both positive and negative.
Fourth, variation of /Qj) due to different molecules and different vibrational
modes in a given molecule leads to wide variations in Raman scattering intensity.
Fifth, since (/Qj) is much smaller than o, therefore, Rayleigh scattering is much
stronger than Raman scattering.
2.2.3 Infrared and Raman spectra of NR and HNRs
It was reported for NR of IR absorption occurred at 1665 cm-1
and 836
cm-1
corresponding to the C=C stretching mode and the C-H out of plane deformation
of the trisubstituted carbon-carbon double bond of isoprene unit, respectively (Samran
et al., 2004c) can be observed. With increasing hydrogenation time, the intensity of
the peaks at 1665 cm-1
and 836 cm-1
gradually decreased with the appearance of the
peaks at 735 cm-1
assigning to -CH2- groups of HNRs.
Raman spectra of NR showed strong intensity at 1664 cm-1
which
represented C=C stretching (Samran et al., 2004a). The intensity of this peak
decreased with increasing degrees of hydrogenation.
2.3 Vulcanization of hydrogenated natural rubber
Partially hydrogenated natural rubbers (HNRs) can be vulcanized by
using peroxide and sulfur. The reactions between peroxide and rubber can take place
either at saturated ethylene-propylene segment or at allylic position of isoprene units
while those of sulfur and rubber occurs mainly at unsaturated units (Loan, 1972;
Akiba and Hashim, 1997).

20
2.3.1 Peroxide vulcanization
The mechanisms of peroxide crosslinking for NR using dicumyl
peroxide (DCP) are shown in Figures 2.8. DCP first undergoes thermal decomposition
to form cumyloxy radicals followed by abstraction of allylic hydrogens by cumyloxy
radicals to form polymeric radicals. Then, polymeric radicals are coupled to form
crosslinks whose possible structures are shown in Figure 2.9. In the case of saturated
rubbers such as EPR, chain scission may also occur (Figure 2.10).
2.3.2 Sulfur vulcanization
Sulfur is widely used to vulcanize NR and other diene rubbers. It must
be used in combination with activators and accelerators. Many types of accelerators
are available and their classification in terms of chemical compositions and
vulcanization speed is shown in Table 2.1. Metal oxide and fatty acid are the most
commonly used activators, of which ZnO 3-5 phr and stearic acid 1-3 phr are in
general.
Table 2.1 Classification of accelerators and their vulcanization speed
Types Examples Speed of vulcanization
Dithiocarbamates ZDMC, ZDEC, ZDBC Very fast
Thiurams TMTM, TMTD, DPTTS Very fast
Thiazole MBT, MBTS, ZMBT Moderate
Sulfenamides CBS, MBS, TBBS Fast
Thiophosphates DIPDIS Semi-fast
Guanidines DPG Slow

21
Figure 2.8 Mechanisms of NR vulcanization by dicumyl peroxide (Loan, 1972;
Akiba and Hashim, 1997)

22
Figure 2.9 Possible crosslink structures of peroxide-cured NR (Loan, 1972; Akiba
and Hashim, 1997)
CH2 C
CH3
CH2CH2 CH2 CH2 C
CH3
CH2CH2CH2 +
CH2 CH
CH3
CH2CH CH2 CH2CH + CH
CH3
CH2CH2
CH2 CH
CH3
CH2C CH2
CH3
CH2C
CH3
+ CH
CH3
CH2CH2
Figure 2.10 Possible scission reaction in ethylene-propylene rubber (Loan, 1972;
Akiba and Hashim, 1997)
The ratio of amounts of sulfur to accelerator determines vulcanization
systems which are conventional (CV), efficient (EV), and semi-efficient (SEV)
vulcanization (Table 2.2).

23
Table 2.2 Sulfur vulcanization systems
Vulcanization Systems Sulfur (S, phr) Accelerator (A,
phr) A/S ratio
Conventional (CV) 2.0-3.5 1.2-0.4 0.1-0.6
Semi-efficient (SEV) 1.0-1.7 2.5-1.2 0.7-2.5
Efficient (EV) 0.4-0.8 5.0-2.0 2.5-12.0
CV system employs high sulfur to accelerator ratios. Thus, crosslinks
formed in rubber vulcanizates are mainly polysulfidic which provide better flex and
dynamic properties but poor heat and reversion resistance to rubber.
In EV system, low levels of sulfur and high levels of accelerator are
employed. In some particular cases, sulfur donors are used instead of sulfur. The
crosslink types occurred in rubbers are mostly mono- and disulfidic. Therefore,
rubbers cured by EV systems are dominant in low compression set and high heat and
reversion resistance.
To obtain optimum mechanical and dynamic properties with
intermediate heat and reversion resistance SEV system is employed. SEV system
utilizes intermediate amounts of sulfur and accelerator.
Although sulfur vulcanization of NR was discovered more than 170
years, its mechanism is still not completely understood. Unaccelerated sulfur
vulcanization has been proposed to proceed via free radical or ionic intermediates or
both. However, mechanisms of accelerated sulfur vulcanization are more complicated
and involved many steps as shown in Figure 2.11.

24
Figure 2.11 Reaction pathway for accelerated sulfur vulcanization (Loan, 1972;
Akiba and Hashim, 1997)
2.4 Thermoplastic vulcanizates
Thermoplastic vulcanizates (TPVs) are composed of both rubber and
thermoplastic phases and considered as a special class of thermoplastic elastomers
(TPEs). TPVs are produced by dynamic vulcanization process in which vulcanized
rubber particles are uniformly dispersed in a continuous thermoplastic matrix.
Generally, TPVs contain relatively high amounts of crosslinked rubber particles (50–
70 wt%). During dynamic vulcanization, the increased viscosity of the elastomer
phase affects the phase continuity by promoting phase inversion, which enables the
crosslinked elastomer to become the dispersed phase. In most case, the sizes of
crosslinked rubber particles are of 0.1-2.0 μm in diameter (Van Duin and Machado,
2005; Vennemann et al., 2006; Costa et al., 2008; Prut et al., 2008; Goharpey et al.,
2008). Such a morphological feature results in soft and high elastic products (l’Abee
et al., 2009). Although the rubber phase is already vulcanized, the continuous
thermoplastic matrix enables TPVs to be melt-processed using common thermoplastic

25
processing machines such as extrusion, blow molding, and injection molding (Boyce
et al., 2001).
Thermoplastic vulcanizates can be prepared by using batch or
discontinuous mixing, when relatively short cycles are required and polymer melts
require heavy machinery to achieve satisfactory mixing. Batch mixing is frequently
done in a specified volume of a mixing device such as an internal mixer (Drobny,
2007), in which the typical stages of the dynamic vulcanization can be notified.
Figure 2.12 illustrates the torque-time profile of the production of a dynamic
vulcanizate based on polypropylene (PP) and ethylene-propylene rubber (EPR). The
blend consisted of 40 wt% PP and 60 wt% EPR with viscosity ratio (EPR / PP) of 1.5
were prepared using a laboratory internal mixer (Radusch, 2005). PP was first
plasticized (first peak) followed by the addition of the uncrosslinked EPR rubber
(second peak). A polymer blend was then produced as reflected by slightly decreasing
torque or blend viscosity, which was caused by thermo-mechanical breakdown of
polymer molecules. In this stage, a co-continuous phase was formed. At a specified
time, the crosslinking agent was added. The progress of crosslinking reaction resulted
in the increasing torque, which is then followed by the breakup of the highly
deformed rubber threads in the co-continuous phase. Crosslinking and dispersion of
the rubber component simultaneously and rapidly occurred. The amounts of
crosslinking agent would determine the duration of this process. After the crosslinking
process was completed (expressed by the third peak) the highly viscous rubber
particles are only distributed in the low viscosity thermoplastic matrix (Radusch,
2005).

26
Figure 2.12 Torque-time characteristics of a dynamic vulcanization process in an
internal mixer for peroxide-vulcanized PP/EPR (40/60) blend (Radusch, 2005)
Morphological transformation during the dynamic vulcanization of
polymer blends can be explained as shown in Figure 2.13. In the initial stage, a
mixture of the molten thermoplastic and the uncrosslinked rubber co-exist in co-
continuous phases. As the curing agent is added and crosslinking takes place, the
rubber phase becomes elongated until highly deformed stage is reached and then it
breaks into small particles (Figure 2.13). This process is called phase inversion, in
which the lower portion thermoplastic phase becomes the only continuous phase
throughout which the crosslinked rubber particles are uniformly dispersed (Nicolini et
al., 2008).
2.5 Characterization of thermoplastic vulcanizates
Morphological charcterization of TPVs can be done by many methods
such as scanning electron microscope (SEM) (Han et al., 1998; Li and Kontopoulou,
2009), atomic force microscopy (AFM) (Prut et al., 2008; Le et al., 2010) and
transmission electron microscopy (TEM) (Van Duin and Machado, 2005; l’Abee et
al., 2009). Raman imaging is an excellent method for acquiring information about the
spatial distribution of molecular species (Turrell and Corset, 1996; Ferraro, 2003;

27
Esmonde-White and Morris, 2010; Lee, 2012). It combines Raman spectroscopy and
imaging techniques and may be used to characterize the distribution of polymeric
components in multiphase polymer blends.
Figure 2.13 Schematic of morphology transformation during the dynamic
vulcanization of polymer blends (Radusch, 2005)
2.5.1 Raman Imaging
The general principle of Raman imaging consists of mapping the
spatial arrangement of one constituent of an inhomogeneous sample by isolating from
the Raman scattered photons which originate from a characteristic Raman line of the
specific compound (Barbillat, 1996). A complete spectrum is collected at each and
every pixel of the image, and then examined to generate false color images based on
material composition and structure. Raman peak provides images of material
concentration and distribution. The position of Raman peak gives images of molecular
structure and phase and the peak width yields images of crystallinity and phase. Due
to the inherent weakness of Raman scattering, two- and three-dimensional Raman
imaging is not simple. However, modern technology makes possible for recording
higher resolution images. Hyperspectral imaging is referred to any spectral imaging
whose spectral quality is comparable to that of traditionally recorded spectra.
Therefore, Raman hyperspectral imaging is referred to as a method for recording a
Raman hypercube whose spectral quality is comparable to that of traditionally
collected Raman spectra. The Raman hypercube is a set of intensity data made of I(x,
y, ), where x and y are coordinates of the image pixels and is the wave number.

28
Raman hyperspectral imaging is performed using a high spatial
resolution Raman microscope to collect numerous Raman spectra from different
locations of the sample. The conventional experiment scheme from bright field
imaging to Raman imaging is shown in Figure 2.14. Bright field imaging is useful for
visualizing the sample topology and morphology and identifying the region of interest
for analysis, while Raman imaging is for visualizing the local chemistry, morphology,
and spatial distribution of chemical ingredients.
Figure 2.14 Schematic diagrams from bright field imaging to Raman mapping. The
hypercube is a collection of Raman intensities as a function of I(x, y, ). At a fixed
position (xi, yi), it is a localized Raman spectrum. At a fixed wave number k, it is a
Raman intensity map (Lee, 2012)
Raman hyperspectral imaging requires multivariate analysis due to a
number of reasons. First, spectral features would be mixed at varying degrees with
contributions from multiple chemical/spectral species depending on the local
concentration and intrinsic Raman scattering cross section of each ingredient. Second,
crystallinity, orientation, or domain size of each ingredient can affect relative and
overall intensities. Third, there would be additional interference from fluorescence
background, scattering and noise. And forth, there will be large volume of data and

29
information in the hypercube. Therefore, Raman signals can be separated from
varying sources and ingredients by multivariate analysis.
2.5.2 Imaging Methods
Raman imaging methods can be carried out by point mapping, line
scanning and global mapping. Schematic diagrams of these methods are shown in
Figure 2.15.
Figure 2.15 Schematic diagrams describing (a) point mapping, (b) line scanning, and
(c) global mapping. The top row illustrates the illumination pattern on the sample and
the bottom row shows the image onto the detector (Lee, 2012)
30
2.5.2.1 Point mapping
This is the simplest method used for recording Raman
hypercubes of high spectral and spatial resolutions. The operator can specify the
mapping area and measured locations, usually in a rectangular shape and grid pattern.
A Raman spectrum is collected at each point, and a mapping stage is used to move
from point-to-point on the sample. Scanning along the x- and y-axes is required. If
desired, any experiment conditions controlled by the computer can be programmed.
This is, so far, the most flexible and popular Raman hyperspectral imaging method
employed.
It is possible to scan the laser. This can be done by placing
mirrors in the optical path which both incident and scattering beams pass. Mirrors can
be precisely moved at a high speed. When the mirrors are moved at a high speed, a
predetermined area of the sample is illuminated uniformly and the signal returns
instantaneously. Since the scattering and incident beam paths are coincident, the result
is an averaged Raman spectrum of the illuminated area. The main advantage of this
method is that large area of the sample with a few numbers of measurements can be
made. It is suitable for a sample with large particles or agglomerates, or finding a
small sample on a large substrate. The mirrors can be moved in a stop-and-go fashion
to excite individual points, therefore, measurements at a very fine grid, which is
useful to map a small sample, can be carried out. We follow this method in our work.
2.5.2.2 Line scanning
In this method, the sample is illuminated in a line, which is
imaged onto the entrance slit of the spectrograph, and then onto the detector along the
y-axis (column). Raman signal along the line is dispersed along the x-axis (row) of the
detector for spectral resolution. A correlation between rows of the detector and points
in the illuminated line provides the spatial resolution along the illuminated line. To
map an area, the sample is moved along only one spatial axis which is orthogonal to
the line illumination. The objective lens and the size of the detector will limit the
height of mapping area.
31
When compared to the point mapping, the advantage of line
scanning is the speed. To map 25x 25 points, point mapping requires 625
measurements, while 25 measurements are for line scanning. Furthermore, line
scanning can reduce the heat-induced damage by spreading the laser beam over the
illuminated line. However, the main disadvantage of the line scanning is the spatial
resolution. Since the propagation of the signal from the sample to the detector is in a
line shape, a confocal hole cannot be used to reject out-of-focus signal. Therefore, line
scanning cannot be truly confocal though the entrance slit offers a measure of
confocality. In addition, non-uniform illumination may occur, especially, between the
edges and the center of the illuminated line.
2.5.2.3 Global mapping
In this method, a finite area of the sample is illuminated and then
imaged onto the detector. Resolution of spectra is achieved with a liquid crystal
tunable filter (LCTF) or a combination of LCTFs. Global imaging performs Raman
multi-spectra imaging by recording Raman peak intensity images at a few
predetermined wavelengths, which takes a much shorter time than recording a full
Raman hypercube. However, the authenticity of “Raman” image cannot be verified
without a full range spectrum. For recording a full spectrum, filters must be tuned at a
series of wavelengths. The speed of the measurement is determined by the number of
points along the spectral axis and the speed of tuning from one wavelength to the
next. The spectra resolution is limited by the filters.
Raman imaging has been employed for characterizing polypropylene
(PP)-polyethylene (PE) blends (Schmidt et al., 2002; Furukawa et al., 2006), tertiary
blends of polystyrene (PS), polypropylene and poly(styrene-ethylene/propylene)
diblock copolymer (Lee et al., 2011), multilayered thin film consisting of chlorinated
PP, ethylene-propylene rubber (EPR) and PP blend (Morris et al., 1999). Raman
mapping images of polyethylene (PE) and polypropylene (PP) blends were reported to
be greatly affected by melt flow index (MFI) ratios of PE and PP (Furukawa et al.,
2006).

32
However, morphological studies of thermoplastic vulcanizates based on HNR/PP
blends using Raman mapping have not yet been reported up to our knowledge.

33
CHAPTER 3
MATERIALS AND METHODS
3.1 Materials and Equipments
3.1.1 Materials
3.1.1.1 High ammonia natural rubber latex (cis-1,4 polyisoprene)
with 60% dry rubber content (DRC) was a product of
Yala Latex Co., Yala, Thailand
3.1.1.2 Hydrazine monohydrate (N2H4.H2O) with 35% assay, a
commercial grade, was supplied by Kaiser-Wilhelm-
Allee, Lanxess Deutschland Gmbh, Germany.
3.1.1.3 Hydrogen peroxide (H2O2), a commercial grade of 50%
assay, was a product of Thai Peroxide Co., Ltd., Thailand.
3.1.1.4 Toluene (C7H8), 90% assay, a commercial grade, was
supplied by Boss Oftical Limited Parnership, Thailand.
3.1.1.5 Sulfur (S8), a vulcanizing agent, was yellow powder with
specific gravity of 2.0. It was a product of Siam
Chemicals Co., Ltd., Samutprakarn, Thailand.
3.1.1.6 Stearic acid (C18H36O2), a cure activator, is white solid
with specific gravity of 0.85. It was supplied by Imperial
Chemical Co., Ltd., Pathumthani, Thailand.
3.1.1.7 Zinc oxide, a cure activator, is white powder. Its specific
gravity was 5.6. It was supplied by Global Chemical Co.,
Ltd., Samutprakarn, Thailand.
3.1.1.8 Tetramethylthiuram disulfide (TMTD, C6H12S4N2) is an
accelerator and a sulfur donor. Its specific gravity is 1.30.
It was supplied by Flexsys Co., Ltd., Belgium.
3.1.1.9 2-Mercaptobenzothaiazole (MBT, C7H5S2N), specific
gravity of 1.42, is an accelerator for sulfur vulcanization.
It was a product of Flexsys America LP Co., Ltd., United
States.

34
3.1.1.10 Dicumyl peroxide (DCP, C18H22O2) is a vulcanizing
agent. It is 98% assay with specific gravity of 1.56. Its
half-life is 1 min at 180oC, 1 hr at 135
oC, and 10 hr at
116oC. It was supplied by Wuzhou International Co.,
Ltd., China.
3.1.1.11 Triallyl cyanurate (TAC, C12H15N3O3) is a coagent for
peroxide vulcanization. It has specific gravity of 1.11
and contains 98-99% of active functional group. It was a
product of Fluka Chemie GmbH, Switzerland.
3.1.1.12 Polypropylene (PP), HP500N, a general purpose grade
for injection molding, was supplied by Lyondell Basell
Co., USA.
3.1.1.13 Ethylene propylene diene monomer (EPDM) rubber,
IP4725 grade, contains 70 mass% of ethylene, 25 mass%
of propylene, and 5 mass% of ethylidene norbornene
(ENB). It was the product of Dow Chemical Co., United
States.
3.1.2 Equipment and Apparatus
3.1.2.1 1L- and 2L-Three-necked round bottom flask
3.1.2.2 Condenser
3.1.2.3 Dropping funnel
3.1.2.4 Mechanical stirrer
3.1.2.5 1H-NMR (VARIAN NMR, Unity Inova 500)
3.1.2.6 Raman spectrometer (Xplora-Horiba)
3.1.2.7 Fourier transform infrared spectroscopy (A225/Q
Platinum ATR, Multiple Crystals Diamond Tensor 27
Bruker spectrometer)
3.1.2.8 Transmission electron microscopy (JEM 2010, JEOL:
TEM)
3.1.2.9 Differential scanning calorimeter (Q100 V9.8 Build 296
TA Instrument)

35
3.1.2.10 Laser particle size analyzer (Coulter, LS-230, small
volume module (model: liquid module))
3.1.2.11 Durometer (Digital hardness tester, toyoseiki Co. Ltd,
Japan)
3.1.2.12 Capillary rheometer (Goettfert-Rheograph 20)
3.1.2.13 Mooney viscometer (model VISCAL, Tech Pro Co., Ltd,
USA)
3.1.2.14 Thermogravimetric analysis (Perkin-Elmer, STA 6000)
3.1.2.15 Internal mixer (Brabender Plastic-Corder PL-2000)
3.1.2.16 Oscillating disk rheometer (ODR 2000, Monsanto)
3.1.2.17 Ozone chamber (Model Rev. 2.0, Korea)
3.1.2.18 UV test chamber (QUV accelerated weathering tester,
Model QUV spray, American)
3.1.2.19 Tensile testing machine (Model H 10KS, Hounsfield test
equipment, Tinius Olsen Ltd, UK)
3.1.2.20 Scanning electron microscopy (JEOL, JSM-6510LV)
3.1.2.21 Rheometrics solids analyzer instrument (RSA 2)
3.2 Preparation of hydrogenated natural rubbers (HNRs)
3.2.1 Non-catalytic hydrogenation of natural rubber latex (NRL)
Concentrated NRL was diluted to 20% DRC and then added to a 1-L
three-necked round bottom flask equipped with a condenser and a dropping funnel
under constant stirring speed and at specified temperature. A specified volume of
hydrazine was added dropwise and then hydrogen peroxide was slowly introduced
into the reactor by dropping funnel. Hydrogenated NRL samples were collected at
specified period of time, coagulated by methanol, sheeted, and then washed several
times with water before drying in vacuum oven at 50oC.
The effects of mole ratios of [C=C]:[N2H4]:[H2O2] on hydrogenation
degrees of NRL were studied using the values shown in Table 3.1. In this case, the
hydrogenation reactions were carried out at 50oC for 24 hrs.

36
Table 3.1 Experimental runs to study the effects of mole ratios of hydrogenation
degrees of NRL at 503oC for 24 hrs.
Run Molar ratio of
[C=C] [N2H4] [H2O2]
1 1.0 0.5 1.0
2 1.0 1.0 1.0
3 1.0 1.5 1.0
4 1.0 2.0 1.0
5 1.0 1.0 0.5
6 1.0 1.0 1.5
7 1.0 1.0 2.0
The effects of reaction temperatures and times on hydrogenation levels
of NRL were studied by fixing the mole ratio of [C=C]:[N2H4]:[H2O2] at 1:1.5:1.
Reaction temperatures were varied from 30oC to 60
oC and reaction times were varied
from 2 to 24 hrs.
Hydrogenation of NRL was also carried out in the swollen state at
50oC for 24 hrs. Two types of solvents, toluene and hexane, were used. The effects of
swelling degrees on degrees of hydrogenation were studied by varying the volume
ratios of solvent to latex. After reaction, the solvent was removed from HNR lattices
before being coagulated by methanol, sheeted, washed with water, and dried in
vacuum oven at 50oC.
The effects of reaction scale-up on the degrees of hydrogenation of
NRL were also investigated. In this case, the 2-L reactor was used, and the volumes of
NRL were scaled up from 250 mL to 650 mL. To achieve the designed degrees of
hydrogenation, the typical mole ratios of [C=C]:[N2H4]:[H2O2] and toluene volume
were chosen.

37
3.2.2 Characterization of NR and HNRs
3.2.2.1 Chemical structure
The structures of rubbers were characterized by 1H-NMR, Raman
and FT-IR spectroscopy. 1H-NMR spectra were obtained using a Varian Unity Inova
500 MHz NMR spectrometer. The rubbers were dissolved in deuterated chloroform
(CDCl3) using tetramethylsilane (TMS) as an internal reference. The measurements
were performed with 90o pulses and an acquisition time of 1 s.
Raman spectra of rubbers were recorded with a Xplora-Horiba
Raman spectrometer at room temperature under a microscope with a magnification
x50. The simple spectrograph was adjusted with a 600 linesmm-1
grating. Rubbers
were illuminated with a He-Ne laser source selecting the red line at 785 nm. The
Raman spectra of rubbers were collected in the range of 500-3500 cm-1
with 50
accumulations and an acquisition time of 2s. The best resolution was obtained by
setting both the entrance slit and the confocal pinhole at the same value of 300 μm.
FT-IR spectra of rubbers were obtained using an A225/Q
Platinum ATR, Multiple Crystals Diamond Tensor 27 Bruker spectrometer. The
spectra were acquired at wavenumber of 500-3500 cm-1
.
3.2.2.2 Hydrogenation levels
The hydrogenation levels (X) of HNRs can be determined from
1H NMR and Raman spectra (Samran et al., 2004c). For
1H NMR spectra, X was
calculated from the areas under assigned characteristic peaks of 1H-NMR according to
equation (3.1),
1003 2.58.0
8.0
AA
AX (3.1)
where A0.8 and A5.2 are the integrated areas of methyl proton signals of HNR and
proton signals adjacent to C=C bond, respectively.
The degrees of hydrogenation of HNRs were also determined
from the ratio of integrated area of Raman peak at 1665 cm-1
, corresponding to C=C
bonds stretching, to that at 1434 cm-1
, corresponding to the CH2 bending (Samran et
al., 2004a);

38
1002
K
KX (3.2)
where K and were the ratios of the integrated area of the C=C peak to CH2 vibration
peak of starting NR and HNRs, respectively.
3.2.2.3 cis and trans Isomerization
The cis and trans isomerization of HNRs was investigated by 1H-
NMR. The percentages of cis and trans configurations were calculated from the
integrated areas of 1H-NMR characteristic peaks according to equations (3.3) and
(3.4) (Samran et al., 2004c),
100(%)67.164.1
67.1
AA
Acis (3.3)
100(%)67.164.1
64.1
AA
Atrans (3.4)
A1.64 and A1.67 are the integrated areas of the proton signals of methyl groups
corresponding to trans and cis configurations, respectively.
3.2.2.4 Morphology of latex by transmission electron
microscopy
The morphology of unswollen and swollen NRLs was studied
using JEOL JEM 2010 TEM. The latex was first diluted to approximately one four
hundredth of its original concentration with distilled water. An aqueous solution (2 wt
%) of OsO4 was added to stain NR molecules. The stained latex was then placed on a
400 mesh grid, and dried overnight in desiccators before characterization.

39
3.2.2.5 Glass transition temperature (Tg) by differential
scanning calorimetry
Thermal properties of NR and HNRs were characterized using
differential scanning calorimeter model DSC Q100 V9.8 Build 296 of TA Instrument.
The measurement was performed in the temperature range from -80oC to 150
oC with
cooling and heating rates of 10oC/min. The sample was first equilibrated at 25°C for 5
min and then heated to 150oC with the rate of 10
oC/min. The sample was held at
150°C for 1 min before ramping down to -80oC with the rate of 10
oC/min. The sample
was held at -80oC for 1 min and then ramped up to 150
oC. The thermogram of the
sample was automatically recorded by computer. The glass transition temperature (Tg)
was determined from the midpoint of the base line shift of DSC thermograms.
3.2.2.6 Particle size and particle size distribution
Particle size and particle size distributions (PSD) of HNR latices
were measured using Coulter LS-230 particle size analyzer (liquid module) operating
with a 750 nm laser beam. The laser light from the source was passed through a
chamber containing the latex sample. The scattered light was then detected by a
photo-detector array. The intensity of scattered light on each detector was then
converted to PSD plot calculated using mathematical algorithms. Beckman Coulter
LS230 uses 126 detectors in its diffraction arrays and the polarization intensity
differential scattering (PIDS) system to measure particles from 0.04 to 2000 m in a
single scan.
About 10 mL of a 20 %DRC latex sample (NR or HNR) was
diluted to 10% DRC latex in a beaker. Then, 4-10 drops of dilute surfactant solution
(2-5 wt%) were added and mixed with the latex sample before analysis. Particle size
and PSD of the latex sample were calculated by Coulter software.
3.2.2.7 Hardness
Shore A hardness of NR and HNRs was measured according to
ASTM D2240 using Shore A Durometer, digital hardness tester of Toyoseiki Co. Ltd,
Japan. The measurement was done on a sample of at least 6.0 mm thick and at

40
26 2oC. Hardness was measured from three different positions on the specimen and
recorded in Shore A after 30 sec of indentation.
3.2.2.8 Rheological properties
Rheological properties of NR and HNRs were studied using
Goettfert-Rheograph 20 capillary rheometer. The experiment was carried over a shear
rate range from 10 to 1500 s-1
at 180oC. The capillary die of 2 mm in diameter and 32
mm in length was used.
Mooney viscosities of NR and HNRs were measured according
to ASTM D1646 by using a VISCAL Mooney viscometer of Tech Pro Co., Ltd. A
large rotor was used with the speed of 2 rpm. The test was carried out at 125oC. The
sample was first pre-heated for 1 min and then tested for 4 min. Also, stress relaxation
of rubbers was measured for another 3 min after immediate stop of the rotor.
3.2.2.9 Gel content
About 0.35 g (W1) of rubbers was immersed in 25 mL of toluene
at room temperature for 168 hrs. The swollen samples were then taken out and
excessive toluene was rapidly removed by blotting with filter paper. The samples
were dried at 50oC for 48 hrs and weighed (W2). The gel content was determined from
equation (3.5),
100(%)1
2 W
Wgel (3.5)
3.2.2.10 Thermogravimetric analysis
Thermogravimetric analysis (TGA) of NR and HNRs was
performed on a Perkin-Elmer STA 6000. The temperature of the sample was ramped
from 30oC to 600
oC at a heating rate of 5, 10, 15, and 20
oC /min under an oxygen
atmosphere. The initial decomposition temperature (Ti) was obtained from the
intersection of two tangents at the initial stages of the decomposition. The kinetics of
decomposition were analyzed to estimate the activation energy by using Kissinger-
Akahira-Sunose (KAS) equation (Aboulkas and El Harfi, 2008; Slopiecka et al.,
2011; Blaine and Kissinger, 2012),

41
z
a
azRT
E
gE
Rk
T
)(lnln 0
2
(3.6)
where k0 is a constant, Ea is the activation energy, R is gas constant, g() is the kinetic
model or the “some-function-of ”, is the fraction of reactant remaining, is
heating rate, and Tz is the decomposition temperature. The plot of ln (/Tz2) versus
1/Tz will give a straight line with a slope from which the activation energy can be
calculated.
3.3 Properties of NR and HNR compounds and vulcanizates
3.3.1 Preparation of HNR Compounds
The formulations used for preparing NR and HNR compounds were
shown in Table 3.2. Rubber compounds were prepared using a 60 mL internal mixer,
Brabender Plasticorder PL-2000, with fill factor of 0.8. The mixing was performed at
30oC and a rotor speed of 60 rpm. The rubber was first masticated for 2 min. Then,
vulcanizing agents were added and mixed with the rubber for 8 min. The rubber
compound was taken out and then sheeted using a two roll mill. The compound sheet
was kept at room temperature for 24 hr before its cure properties being measured.
3.3.2 Cure Properties and Preparation of Vulcanized Rubber Sheet
The cure properties of rubber compounds, such as minimum torque
(ML), maximum torque (MH), scorch time (ts,1), and cure time (tc,90) were measured by
using an oscillating disk rheometer, ODR 2000, at 180oC for 30 minutes. The
biconical disk rotor was oscillated at amplitude of 1o and frequency of 1.67 Hz. ML,
MH, ts,1, and tc,90 can be determined from the rheograph, a plot of torque versus time.
Scorch time, ts,1, is referred to as the time when the torque rises above ML for 1 dN.m.
The cure time, tc,90, is the time to reach 90% of torque increase (M90)
LHL MMMM 100
9090 (3.7)
Vulcanized rubber sheets, about 1 mm thick, were prepared using a
compression molding at 180oC and a pressure of 12.5 MPa. The rubber compounds
were vulcanized according to their tc,90 (Table 3.3). The vulcanized sheets were kept
at room temperature for 24 hr before testing their physical properties.

42
Table 3.2 Formulations of rubber compounds
Ingredients Vulcanization systems
Peroxide (phr) Sulfur (phr)
Rubber (NR or HNRs) 100 100
DCP 1.0 -
TAC 0.6 -
Sulfur - 1.50
TMTD - 0.65
MBT - 0.40
Zinc oxide - 5.00
Stearic acid - 1.00
phr - parts per hundred of rubber
Table 3.3 Cure time (tc,90) for each rubber compounds
Rubbers Cure time (tc,90), min
Peroxide cure Sulfur cure
NR 4.07 1.43
14 %HNR 4.15 1.55
33 %HNR 4.30 2.02
65 %HNR 4.00 1.60
43
3.3.3 Characterization of NR and HNR Vulcanizates
3.3.3.1 Ozone and Ultraviolet (UV) resistance test
A specimen of 1 mm thick and 3 mm wide was stretched to 30%
deformation using a specimen holder before being placed in the ozone chamber. The
specimen was exposed to ozone atmosphere of 505 pphm at 40oC for 168 hr. After
that it was removed from the chamber and kept at room temperature for a week before
analyzing with Raman spectroscopy.
UV resistance test of rubber vulcanizates was conducted
according to ASTM D1148 in a QUV accelerated weathering tester (Model QUV
spray) at 50oC. The UV irradiance level was set to 0.77 W/m
2nm at 340 nm. A
rectangular specimen, 62 x 12 mm2, was exposed to UV for 168 hr. After exposure, it
was removed from the chamber and kept at room temperature for 1 week before
characterizing with Raman spectroscopy.
The cracks on the surface and the change in chemical structures
of rubber vulcanizates after ozone and UV aging were examined by using Raman
spectroscopy which provides Raman spectra and the image of the cracks at the same
time.
3.3.3.2 Raman Spectroscopy
Raman spectra of the surface cracks of NR, HNR and EPDM
vulcanizates, before and after exposure to ozone and UV, were recorded with an
Xplora-Horiba spectrometer adjusting the spectrograph configuration with a 1200
lines mm-1
grating. Samples were illuminated with a He-Ne laser source selecting the
red line at 785 nm. The Raman shift range was selected between 500 - 3500 cm-1
with
50 accumulations and each acquisition time of 2 s. The slit and pinhole were set to
100 and 500 μm, respectively.
The normalized peak integral intensities of C=C bonds from
degree of hydrogenation and vulcanization system was determined while the change
of peak intensity area which relates to the deleterious effect from ozone calculated by
the subtraction of peak intensities of double bond signal of isoprene units after
exposure by those before exposure (Overman and Thomas, 1999; Rich and Breton,
2002; Yu et al., 2008).

44
The cracks on the surface of rubber vulcanizates were also
investigated by using Raman spectroscopy with a microscope magnification x10 of
objective lens in one-dimensional (1D) modes.
3.3.3.3 Tensile properties
The dumbbell test pieces were cut from a 1 mm thick vulcanized
rubber sheet using die D according to ASTM D412. The tensile testing machine,
model H10KS Hounsfield test equipment, was used to stretch the specimen with the
cross head speed of 50±5 mm/min. The narrow section of the specimen was marked
with two pieces of reflective tape between which the distance was 10.0 mm. The
deformation of the specimen was monitored by laser extensometer. Tensile properties
of rubber vulcanizates, such as elongation at break, and tensile strength were
calculated from all measured quantities. At least 3 specimens were tested.
A true stress (t) can be calculated from
A
Ft (3.8)
where F is a force used to stretch the rubber and A is a true cross-sectional area.
Rubbery materials are considered to be incompressible, i.e., there is no volume
change upon deformation. Therefore, A can be approximated by Alo/l and t is given
by
oo
tlA
Fl (3.9)
where Ao is an original cross-sectional area, lo is an original length, and l is a
deformed length.
A true strain (t) was calculated from
oo A
A
l
llnln (3.10)
The tensile strength (TS, tb) can be calculated from
lA
lF
o
btb (3.11)
where Fb is the force at break.
The elongation at break or ultimate strain (b) is given by

45
o
obb
l
ll (3.12)
where lb is the specimen length at fracture.
3.3.3.4 Crosslink density
The crosslink density of rubber vulcanizates was determined by
equilibrium swelling measurements (Flory, 1953; Treloar, 1973; Sperling, 2005). A
sample was weighed in the range of 0.38-0.40 g and immersed in toluene in a closed
vial to reach swelling equilibrium. Then the sample was removed from the vial and
the excess amount of solvent on the rubber surface was wiped out by paper. The
sample was quickly weighed (w1) and dried at 50oC for 168 h and weighed again (w2).
The volume fraction (r) of the rubber in the swollen gel was calculated by Equation
(3.13)
)/()/)((
)/(
221
2
rs
rr
www
w
(3.13)
where s is the density of toluene (0.88 g/cm3) and r is the density of rubber. The
crosslink density (), number of moles of network chains per unit volume, of the
sample could be calculated from
2
])1([ln1
3/1
21
rr
rrr
sVv
(3.14)
where sV is the molar volume of toluene (106.2 cm
3/mol for toluene) and 1 is the
polymer-solvent interaction parameter (0.42 for NR-toluene system).
3.4 Thermoplastic vulcanizates (TPVs) based on blends of HNRs and PP
3.4.1 Preparation of TPVs
The TPVs from blends of HNR and PP at various blends ratios, i.e.,
70/30, 60/40, 50/50, 40/60 were prepared via dynamic vulcanization using peroxide
and sulfur as vulcanizing agents. A 50 cm3 laboratory internal mixer, Brabender
Plasticorder PL-2000, was employed to prepare all TPVs. The TPVs were mixed
using fill factor of 0.8 at a constant rotor speed of 80 rpm and initial temperature of
46
180oC. Firstly, PP was melted for 3 min in the mixer. Then, a rubber compound
prepared using the recipe in Table 3.2 according to method in 3.3.1 was added and
mixed with PP until the constant torque was reached. The mixing for each batch took
10 min. After complete mixing, the TPV was removed from the mixer, sheeted on the
two-roll mill, and kept at room temperature for 24 hr before investigating their
physical properties.
TPV sheets were prepared by compression molding at 190oC and
pressure of 12.5 MPa for 10 min, cooled down under pressure to room temperature,
and stored at room temperature for 24 hr before their physical properties being tested.
3.4.2 Characterization of TPVs
3.4.2.1 Mixing Behavior and Dynamic Vulcanization
The mixing behavior and dynamic vulcanization of HNR-PP
blends were analyzed from torque-time profiles obtained from Brabender Plasticorder
PL-2000.
3.4.2.2 Raman mapping
The morphology of TPVs was investigated by using Raman
spectroscopy with a microscope magnification x10 of objective lens. The samples
were cut from frozen in liquid nitrogen.
Raman spectra of the blends were recorded with an Xplora-
Horiba spectrometer. The experiment was performed at room temperature under
microscope (Olympus BX 40) using a long distance work objective with a
magnification 50. The simple spectrograph was adjusted with a 1200 lines per mm
grating. The samples were illuminated with a laser light at 785 nm. The frequency
range studied was 400-1800 cm-1
with 50 accumulations and an acquisition time of 2s
per spectrum. The lateral resolution is dependent on the entrance slit, the selected
objective, and the grating. In this case, the 100 μm entrance slit was used. Raman
mapping was recorded by means of scanning a sample surface (10 10 μm2) by step
size of 0.9 μm in both X- and Y-axes (point to point), which is lower than the lateral
resolution in these conditions. The confocal pinhole conjugated to microscope was
adjusted to 500 μm in this experiment and gives the depth resolution which can be

47
estimated in these conditions to 1μm. Labspec 6 software was used to operate the
mapping system, record spectra, and analyze the data.
The contents of TPV components can be calculated using the
equations (3.15) and (3.16),
100(%))16641434()846813(
)846813(
II
IPP (3.15)
100(%))16641434()846813(
)16641434(
II
IHNRorNR (3.16)
where I(813-846) and I(1434-1664) are integrated peak intensities of PP phase in the range of
813 to 846 cm-1
and NR or HNR phase in the range of 1434-1664 cm-1
, respectively.
3.4.2.3 Phase size analysis
The sizes of cross-linked rubber particles dispersed in the
thermoplastic matrix of TPVs were determined from Raman maps in comparison with
electron micrograph from SEM. For Raman mapping, Image J software (an open
source image processing program designed for scientific multidimensional images)
was used to calculate the phase size (Igathinathane et al., 2008; Greaves et al., 2008).
3.4.2.4 Scanning electron microscopy
The fracture surfaces of TPVs were studied using Jeol (JSM-
6510LV) scanning electron microscopy with an applied voltage of 15 kV. The
dumbbell specimens were frozen in liquid nitrogen and fractured. The samples were
then immersed in toluene at room temperature together with stirring for 120 hr to
extract dispersed rubber. The samples were dried and surface-coated with gold before
characterization.
3.4.2.5 Dynamic mechanical analysis
Dynamic mechanical analysis (DMA) of rubber vulcanizates and
TPVs was carried out using a Rheometrics RSA 2 analyzer. A strip specimen of 20
mm long, 4 mm wide, and 1 mm thick is used. The test was carried out in tension

48
mode. All tests were conducted at room temperature. Dynamic strain sweep test was
carried out in range of 0.01 to 1 % at the frequency of 1 rad/s.

49
CHAPTER 4
RESULTS AND DISCUSSION
4.1 Preparation and characterization of hydrogenated natural rubbers
4.1.1 Non-catalytic hydrogenation of natural rubber latex
4.1.1.1 Chemical structure characterization of HNRs by 1H-
NMR
Hydrogenated natural rubbers (HNRs) were prepared by non-
catalytic hydrogenation of NRL using diimide as hydrogenation reagent. Diimide was
generated in-situ via reaction of hydrazine and hydrogen peroxide. The chemical
structures of NR and HNRs were characterized using 1H-NMR (Figure 4.1).
Figure 4.1 1H-NMR spectra of (a) 0 %HNR, (b) 11 %HNR and (c) 18 %HNR

50
The three main characteristic peaks of NR are at 1.67, 2.04, and
5.2 ppm, corresponding to proton signals of methyl and methylene groups of isoprene
unit, and that adjacent to C=C bond, respectively (Samran et al., 2004a). For HNRs, a
decrease in the peak intensity at 5.2 ppm was observed together with appearance of
methyl and methylene proton signals at 0.8 and 1.1 ppm, respectively, indicating the
conversion of unsaturated double bonds to saturated units.
4.1.1.2 Effect of hydrazine
The effects of hydrazine concentrations on hydrogenation
percentages were investigated by fixing the mole ratio of [C=C] to [H2O2] at 1:1. The
amounts of hydrazine were varied from 0.5 to 2.0 moles. It was found that the degrees
of hydrogenation increased with increasing moles of hydrazine from 0.5 to 1.5 (Figure
4.2) because of the increased amounts of diimide generated in situ (Xie et al., 2003).
Two forms of diimide, cis- and trans-configurations (equation (4.1)) can be generated
(Paquette, 1991). However, only cis-diimide is an effective hydrogenation agent;
trans-diimide is ineffective and easily decomposes to yield nitrogen and hydrogen
gases (Hudlicky, 1984; Handt et al., 2006). The maximum degree of hydrogenation
was about 18%. Further increase in hydrazine concentrations caused a slight decrease
in degree of hydrogenation possibly due to disproportionation of diimide to form
hydrazine and nitrogen gas (Hudlicky, 1984).
(4.1)

51
Figure 4.2 Effect of moles of hydrazine on degrees of hydrogenation of NRL (mole
ratio of [C=C]:[H2O2] is 1:1)
4.1.1.3 Effect of hydrogen peroxide
The effects of hydrogen peroxide concentrations on
hydrogenation levels were studied by fixing the molar ratio of [C=C] to [N2H4] at 1:1,
and the hydrogenation reaction was carried out at 50 3 oC for 24 hrs. It was found
that degrees of hydrogenation increased with increasing moles of hydrogen peroxide
up to 1.5, then slightly decreased (Figure 4.3). At lower moles (<1.5) of hydrogen
peroxide the hydrogenation percentages increased due to the increase in
concentrations of diimide generated in situ. The maximum hydrogenation level was
about 15 %. At higher concentrations (>1.5 moles), the excessive hydrogen peroxide
may react with hydrazine to form nitrogen gas and water (equation (4.2)) resulting in
lower amounts of diimide, hence, lower degrees of hydrogenation (Xie et al., 2003).
(4.2)

52
Figure 4.3 Effect of moles of hydrogen peroxide on degrees of hydrogenation of NRL
(mole ratio of [C=C]:[N2H4] = 1:1)
Furthermore, redox reaction between hydrogen peroxide and
hydrazine together with thermal decomposition of hydrogen peroxide can generate
hydroxyl radicals which cause crosslinking between rubber molecules to form gel
(Xie et al., 2003).
From the results above, it can be seen that variation in moles of
hydrazine and hydrogen peroxide was insufficient to obtain high degrees of
hydrogenation of NRL. The maximum hydrogenation levels of NRL were about 15-
18 %.
4.1.1.4 Effects of reaction temperature and time
The effects of reaction temperature and reaction time on the
degrees of hydrogenation were studied by using the molar ratio of
[C=C]:[N2H4]:[H2O2] at 1:1.5:1 and volume ratio of toluene to NRL at 0.1. Small
amount of toluene was used with the expectation that degrees of hydrogenation of
NRL could be improved. The range of temperature was 30-60 oC and time period was
2-24 hrs. The degrees of hydrogenation increased with increasing reaction
temperature (Figure 4.4). The activity of reacting species is low at low temperature.

53
As reaction temperature was increased, the activity and collision of reacting species
increased, enhancing the hydrogenation percentages of the product. However,
hydrogenation reaction is strongly exothermic. At 60 oC small amounts of natural
rubber latex coagulated due to less stability, and the reaction was difficult to control
due to formation of gas bubbles during addition of hydrogen peroxide. From these
reasons, the suitable reaction temperature was at 50 oC. The degrees of hydrogenation
also increased with increasing reaction time (Figure 4.4) since reacting species had
more chances to collide with each other.
Figure 4.4 Effect of reaction temperature and reaction time on degrees of
hydrogenation of NRL (mole ratio of [C=C]:[N2H4]:[H2O2] is 1:1.5:1 and volume
ratio of toluene to NRL is 0.1)

54
4.1.2 Improvement of hydrogenation levels of NRL
Non-catalytic hydrogenation of NRL seemed not to yield high
hydrogenation levels possibly due to confinement of hydrogenation agents only at the
surface of the latex particle. To improve hydrogenation degrees of NRL, solvents like
hexane and toluene were used to swell rubber particles aiming that hydrogenation
agents could diffuse into inside rubber particles and have more chances to react with
unsaturated sites.
4.1.2.1 Effect of solvent types
Effects of toluene and hexane on 1H-NMR of hydrogenated NRs
were shown in Figure 4.5.
Figure 4.5 1H-NMR spectra of (a) NR, (b) 14 %HNR prepared by swelling NRL with
hexane, and (c) 16 %HNR prepared by swelling NRL with toluene (volume ration of
solvent to NRL is 0.1)

55
In both cases, the intensity of the proton signals of isoprene units
(1.67, 2.04, and 5.2 ppm corresponding to protons of methyl, methylene groups and
that adjacent to C=C bond, respectively) decreased when compared to those of NR.
The conversion of double bonds to saturated moiety was evidenced by appearance of
the signals at 0.8 and 1.1 ppm, corresponding to methyl and methylene protons of
saturated units, respectively. However, toluene resulted in 16 %HNR which was
slightly higher than hexane (14 %HNR). Therefore, toluene was chosen for
investigating the effect of volume of solvent on degree of hydrogenation.
4.1.2.2 Effect of solvent volume
Effects of volume ratios of toluene to NRL on 1H-NMR and
degrees of hydrogenation of hydrogenated NRs were shown in Figure 4.6 and 4.7,
respectively.
Figure 4.6 1H-NMR spectra of NR and HNRs at various toluene/NRL volume ratios;
(a) NR, (b) 18 %HNR (no toluene), (c) 21 %HNR (volume ratio = 0.1), (d) 29 %HNR
(volume ratio = 0.4), (e) 33 %HNR (volume ratio = 0.7), and (f) 42 %HNR (volume
ratio = 0.1)

56
The increase in volumes of toluene resulted in the decrease in
peak intensities of unsaturated units (1.67, 2.04, and 5.2 ppm, respectively) together
with the increase in peak intensities of hydrogenated isoprene units (0.8 and 1.1 ppm,
respectively) indicating the increase in hydrogenation levels. The maximum degree of
hydrogenation was 42 %. The increased volumes of toluene caused more surface
swelling of rubber particles (Figure 4.8). Therefore, more diimide could diffuse into
the particles and react with unsaturated isoprene units to form hydrogenated products.
However, hydrogenation apparently confined only at the swollen surface of the rubber
particles.
Figure 4.7 Effects of toluene /NRL volume ratios on degrees of hydrogenation of
NRL
4.1.2.3 Effect of reaction scale-up
To further improve hydrogenation degrees of NRL, the effects of
reaction scale-up were investigated. In this case, the reaction volume was increased
from 250 mL to 650 mL using 2L reactor. The effects of reaction scale-up on
hydrogenation levels of NRL were shown in Table 4.1. It was found that
hydrogenation levels of NRL increased with reaction scale-up. The hydrogenation

57
level of 65 % was obtained. The increase in reaction volume resulted in the decreased
volume of the space above the surface of the reaction mass in the reactor. As
mentioned above hydrazine can react with hydrogen peroxide to form diimide or
nitrogen gas. Furthermore, trans-diimide generated may decompose to yield nitrogen
and hydrogen gases. Therefore, it was expected that there would be larger pressure
build-up for the system with larger reaction volume. The pressure build-up would
increase the opportunity for reacting species to react each other, resulting in higher
degrees of hydrogenation (Figure 4.9).
Figure 4.8 TEM images at 40k magnification of (a) unswollen NRL particle, (b) NRL
particle swollen by 10 %volume of toluene, and (c) NRL particle swollen by 100 %
volume of toluene
Table 4.1 Effects of reaction scale-up on degrees of hydrogenation of NRL
Mole ratios of
[C=C]:[N2H4]:[H2O2]
Volume ratios of
toluene to NRL
Degrees of hydrogenation (%)
at different reaction volumes
250 mL 650 mL
1:0:0 0.0 0 0
1:1:0.5 0.0 10 14
1:1.5:1 0.1 21 33
1:1.5:1 1.0 42 65

58
Figure 4.9 Possibility effects of increased reaction volume on collision of reacting
particles due to high pressure build-up
1H-NMR, Raman and FT-IR spectra of NR and HNRs prepared
by reaction scale-up were shown in Figures 4.10, 4.11, and 4.12, respectively. The
increase in hydrogenation degrees was evidenced by the decrease in intensities of the
characteristic peaks of unsaturated parts at 1.67, 2.04, and 5.2 ppm, respectively, and
the increase in peak intensities of saturated parts at 0.8 and 1.1 ppm
Raman spectra of NR and HNRs presented in Figure 4.11
revealed the decrease in the peak intensity at 1000 cm-1
, 1309 cm-1
and 1665 cm-1
,
corresponding to frequencies of C–CH2 stretching, –CH3 wagging, and C=C bond,
respectively (Jackson et al., 1990; Bunce et al., 1993; Hendra and Jackson, 1994;
Healey et al., 1996; Samran et al., 2004a). The increase in peak intensities at 817 cm-1
(–CH wagging), 1434 cm-1
(–CH2– symmetric stretching) and 2966 cm-1
(–CH3
asymmetric stretching) with increasing degrees of hydrogenation was also observed.

59
Figure 4.10 1H-NMR spectra of (a) NR, (b) 14 %HNR, (c) 33 %HNR and (d) 65
%HNR
Figure 4.11 Raman spectra of (a) NR, (b) 14 %HNR, (c) 33 %HNR, and (d)
65%HNR

60
The FT-IR spectra of NR and HNRs were shown in Figure 4.12.
The increasing hydrogenation levels resulted in the decrease in peak intensities at 575
cm-1
, 836 cm-1
, 1374 cm-1
, 1456 cm-1
, 1664 cm-1
, 2856 cm-1
, and 2962 cm-1
peaks,
corresponding to frequencies of C–H out of plane bending, C–H bending, –CH3
bending, –CH2– scissoring, C=C bond stretching, –CH3 symmetric stretching, and –
CH3 asymmetric stretching, respectively. In contrast, the intensity of the peak at 739
cm-1
(–CH2– rocking) and 2924 cm-1
(–CH2– asymmetric stretching) increased with
increasing degrees of hydrogenation.
Figure 4.12 FT-IR spectra of (a) NR, (b) 14 %HNR, (c) 33 %HNR, and (d) 65
%HNR
The degrees of hydrogenation of HNRs calculated from Raman
spectra (shown in Table 4.2) were correlated well with those calculated from 1H-
NMR spectra (Figure 4.13).

61
Table 4.2 Hydrogenation levels of HNRs calculated from 1H-NMR and Raman
spectra
Mole ratios of
[C=C]:[N2H4]:[H2O2]
Volume ratios of
toluene to NRL
Degrees of hydrogenation (%)
at reaction volume of 650 mL 1H-NMR Raman
1:0:0 0.0 0 0
1:1:0.5 0.0 14 16
1:1.5:1 0.1 33 32
1:1.5:1 1.0 65 63
Figure 4.13 Correlation between degrees of hydrogenation calculated from Raman
and 1H NMR spectra
4.1.2.4 cis-trans isomerization
During the progress of hydrogenation reaction, cis-trans
isomerization of isoprene unit also occurred. Figure 4.14 showed 1H-NMR spectra of
NR and HNRs in the range of 1.60 - 1.70 ppm. The characteristic peak at 1.67 ppm
corresponded to the methyl proton of cis-isoprene unit. The intensity of this peak
apparently decreased with increasing hydrogenation degrees of HNRs. However, a
new characteristic peak at 1.64 ppm, corresponding to the methyl proton of trans-
isoprene unit, was observed. The intensity of this peak tended to increase with
increasing hydrogenation levels of HNRs.

62
Figure 4.14 1H-NMR spectra of (a) NR, (b) 14 %HNR, (c) 33 %HNR, and 65 %HNR
Variation in cis and trans contents with hydrogenation degrees of
HNRs was shown in Figure 4.15. The amounts of cis structure decreased with
increasing hydrogenation degrees in contrast to trans structure. Hydrogenation of NR
required hydrogen atoms released from diimide molecules to react with carbon-carbon
double bonds of isoprene units. The intermediates were unstable and cis-trans
isomerization could be taken place through rotation of the weak double bond as
shown in Figure 4.16 (Samran, 2005). Cis structure in the backbone chain resulted in
flexible and elastic material while trans structure made rubber hard and less elastic
(Daniel et al., 2010).

63
Figure 4.15 cis and trans contents as a function of hydrogenation levels of HNRs
Figure 4.16 The reaction mechanism of cis-trans isomerization
4.1.2.5 Particle size of NRL and HNRL
Measurement of particle size and particle size distribution of
latex particles was carried out after toluene was removed from the system. The results
were shown in Figure 4.17 and Table 4.3. NRL and HNRLs exhibited bimodal
distribution. Particle sizes of NRL were in the range of 0.34 – 4.43 m similar to
those of HNRLs. Therefore, particle size and particle size distribution of the HNRL
particles were not affected by hydrogenation reaction and presence of toluene.

64
Figure 4.17 Particle size distributions of various lattices; NRL, 14%HNRL,
33%HNRL, and 65%HNRL
Table 4.3 Average particle size of NRL and HNRL
LaticesParticle size range
(μm)
Mean particle size
(μm)
S.D.
(μm)
NRL 0.342 - 4.240 1.215 0.538
14 % HNRL 0.375 - 4.655 1.165 0.518
33 % HNRL 0.342 - 4.240 1.165 0.524
65 % HNRL 0.375 - 4.655 1.239 0.557
4.2 Properties of HNRs
4.2.1 Appearance
Appearance of dried solid NR and HNRs was shown in Figure
4.18. It was seen that the color of the rubber turned from amber-like for NR into more
white with increasing hydrogenation contents. This may be due to transformation of
carbon-carbon double bonds to carbon-carbon single bonds and cis-trans
isomerization.

65
Figure 4.18 Appearance of (a) NR, (b) 14 %HNR, (c) 33 %HNR and (d) 65 %HNR
4.2.2 Gel content
HNRs prepared by non-catalytic hydrogenation contained
significant amounts of gel. Apparently, gel contents increased with increasing
hydrogenation degrees of HNRs (Figure 4.19), indicating that crosslinking reaction
also took place during hydrogenation. This was due possibly to hydroxyl radicals
generated from the thermal decomposition of H2O2 could initiate crosslinking (Figure
4.20).
(a) (b)
(c) (d)

66
Figure 4.19 Gel content as a function of hydrogenation levels of HNRs
Figure 4.20 Crosslinking reaction initiated by hydroxyl radical (OH)
4.2.3 Hardness
The effect of hydrogenation levels on hardness of HNRs was
shown in Figure 4.21. It was notably that hardness of HNRs increased with increasing
degrees of hydrogenation. The increase in the amounts of saturated unit and trans
structure during hydrogenation resulted in stiffer chain molecules and hence hardness
of the rubbers.

67
4.2.4 Glass transition temperature (Tg)
DSC thermograms of NR and HNRs were shown in Figure 4.22. It
was seen that Tgs of NR and HNRs were similar and Tg of HNRs were not affected by
the increase in degrees of hydrogenation. These results were similar to those reported
by Hinchiranan et al. (2006b) and Mahittikul et al. (2007a). As mentioned previously
hydrogenation reaction confined largely at the surface of rubber particles, thus, the
core of the rubber particle was still mainly NR. This was probably the reason why Tg
of HNRs was independent of hydrogenation levels.
Figure 4.21 Effect of degree of hydrogenation on hardness of HNRs
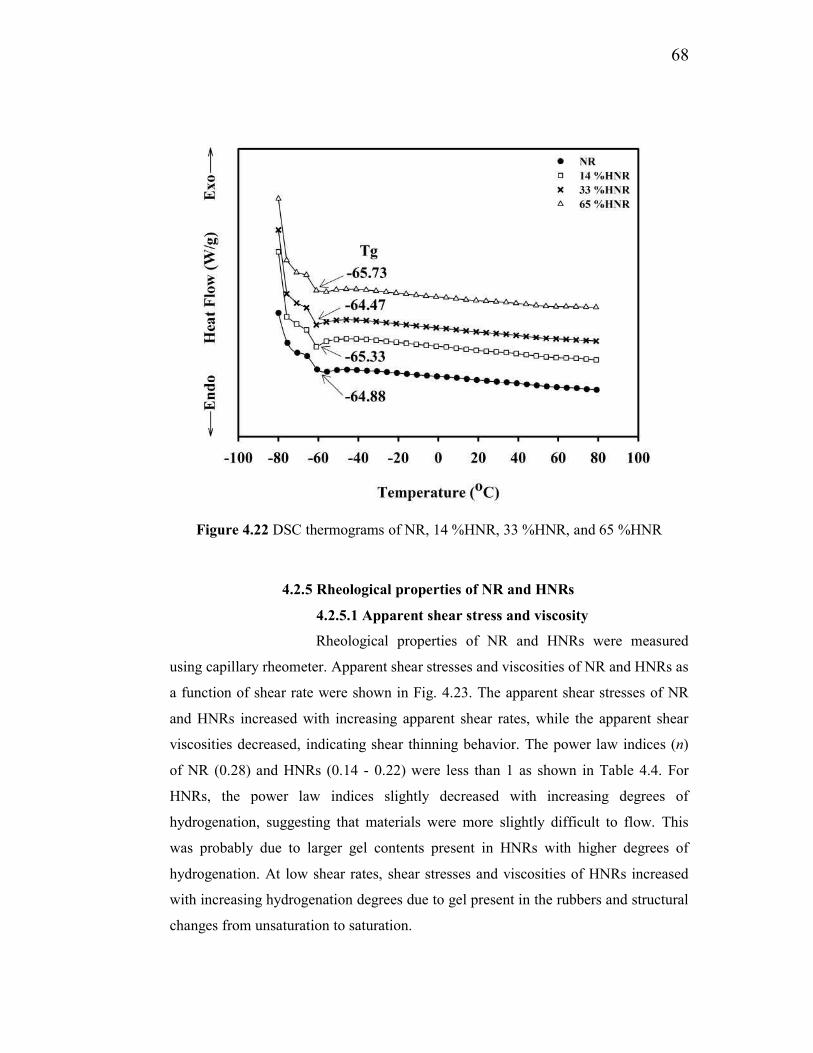
68
Figure 4.22 DSC thermograms of NR, 14 %HNR, 33 %HNR, and 65 %HNR
4.2.5 Rheological properties of NR and HNRs
4.2.5.1 Apparent shear stress and viscosity
Rheological properties of NR and HNRs were measured
using capillary rheometer. Apparent shear stresses and viscosities of NR and HNRs as
a function of shear rate were shown in Fig. 4.23. The apparent shear stresses of NR
and HNRs increased with increasing apparent shear rates, while the apparent shear
viscosities decreased, indicating shear thinning behavior. The power law indices (n)
of NR (0.28) and HNRs (0.14 - 0.22) were less than 1 as shown in Table 4.4. For
HNRs, the power law indices slightly decreased with increasing degrees of
hydrogenation, suggesting that materials were more slightly difficult to flow. This
was probably due to larger gel contents present in HNRs with higher degrees of
hydrogenation. At low shear rates, shear stresses and viscosities of HNRs increased
with increasing hydrogenation degrees due to gel present in the rubbers and structural
changes from unsaturation to saturation.
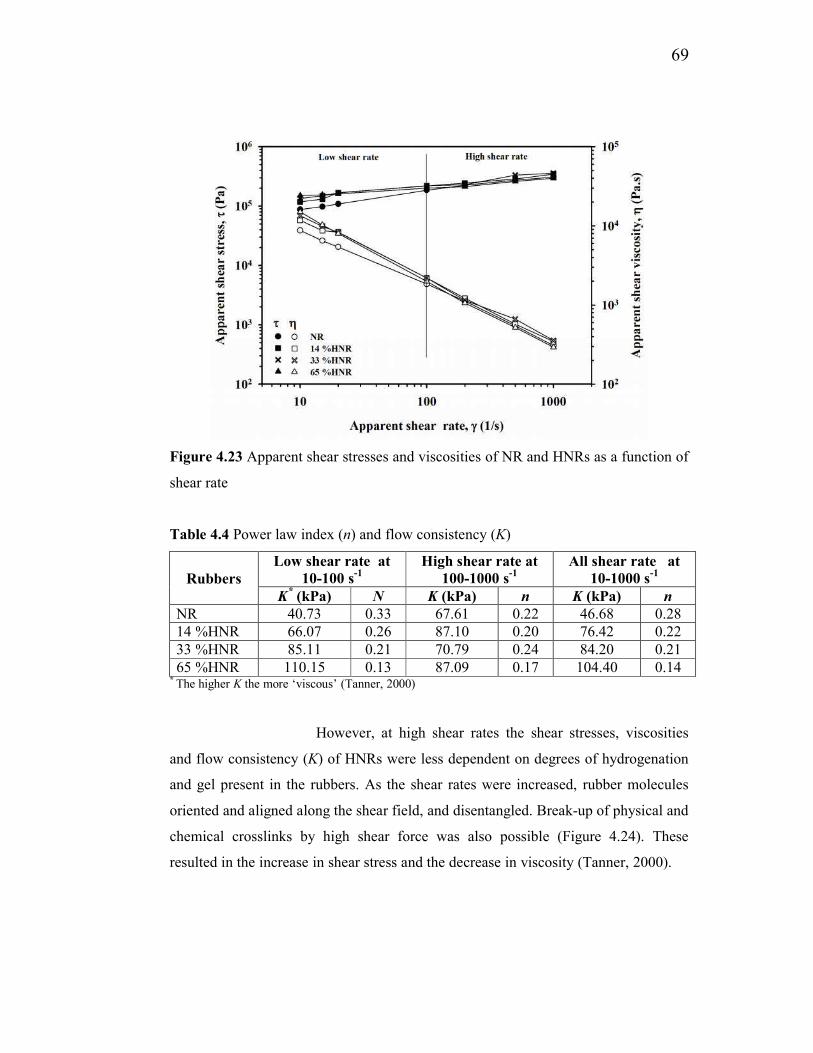
69
Figure 4.23 Apparent shear stresses and viscosities of NR and HNRs as a function of
shear rate
Table 4.4 Power law index (n) and flow consistency (K)
Rubbers
Low shear rate at
10-100 s-1
High shear rate at
100-1000 s-1
All shear rate at
10-1000 s-1
K* (kPa) N K (kPa) n K (kPa) n
NR 40.73 0.33 67.61 0.22 46.68 0.28
14 %HNR 66.07 0.26 87.10 0.20 76.42 0.22
33 %HNR 85.11 0.21 70.79 0.24 84.20 0.21
65 %HNR 110.15 0.13 87.09 0.17 104.40 0.14 *
The higher K the more ‘viscous’ (Tanner, 2000)
However, at high shear rates the shear stresses, viscosities
and flow consistency (K) of HNRs were less dependent on degrees of hydrogenation
and gel present in the rubbers. As the shear rates were increased, rubber molecules
oriented and aligned along the shear field, and disentangled. Break-up of physical and
chemical crosslinks by high shear force was also possible (Figure 4.24). These
resulted in the increase in shear stress and the decrease in viscosity (Tanner, 2000).

70
Figure 4.24 Schematic of structural orientation of polymers under shear field
4.2.5.2 Mooney Viscosity and Mooney Stress Relaxation
The changes in Mooney torques with time of NR and HNRs
were shown in Figure 4.25. Apparently, Mooney torque of NR was nearly constant
with time, while those for HNRs largely decreased with time in the initial stage (zone
A) indicating thixotropic behavior. This was presumably due to the movement of
ethylene-propylene segments present in HNRs. After that (zone B) Mooney torques
slightly increased with time due to gel present in HNRs. Mooney viscosities, reported
as ML(1+4) @ 125 oC (Table 4.5), of HNRs increased with increasing hydrogenation
levels because of the increased gel contents present in the rubbers.

71
Figure 4.25 Time-dependent Mooney viscosities of NR, 14 %HNR, 33 %HNR and
65 %HNR
Table 4.5 Mooney viscosity and relaxation rate of NR and HNRs
Rubbers ML(1+4) @ 125oC a
NR 63.7 - 0.150
14%HNR 90.4 - 0.168
33%HNR 93.9 - 0.156
65%HNR 96.6 - 0.144
Mooney relaxation behavior of NR and HNRs was
investigated immediately after rotor stop. The Mooney relaxation can be
approximated by power law model;
ktaM logloglog
where M is Mooney torque during relaxation test, t is relaxation time, k is Mooney
torque 1 s after the rotor stopped, and a is relaxation rate. The rubber with larger value
of a, a steeper slope, will have higher viscoelastic to elastic ratio and lower elastic
quality than rubber with flatter slope. Therefore, it will be easier to flow and process.

72
Mooney stress relaxation of NR and HNRs was illustrated in
Figure 4.26 and relaxation rates were shown in Table 4.5. It was found that relaxation
rates of NR and HNRs were similar. Although the increase in hydrogenation degrees
resulted in the increase in ethylene-propylene segments, the gel contents were also
increased (Figure 4.19). The former would enhance flow of HNRs, while the latter
made HNRs more elastic. Therefore, relaxation behavior of NR and HNRs was
balanced by presence of ethylene-propylene segments and gel.
Figure 4.26 Mooney stress relaxation of NR, 14 %HNR, 33 %HNR and 65 %HNR
For HNRs, however, relaxation rate tended to slightly
decreased with increasing hydrogenation levels due to the presence of gel, which
made the rubber become more elastic.

73
4.2.6 Thermal properties
4.2.6.1 Decomposition properties
Decomposition temperatures (Td) of NR, HNRs and EPDM
were investigated using thermogravimetric analyzer (TGA). TGA thermograms, plots
of weight loss (%) against temperature, of rubbers were shown in Figure 4.27 and
derivatives of TGA curves were shown in Figure 4.28.
Figure 4.27 TGA curves of NR, 14 %HNR, 33 %HNR, 65 %HNR and EPDM
(heating rate of 20oC/min under oxygen atmosphere)

74
Figure 4.28 Derivatives of TGA curves of NR, 14 %HNR, 33 %HNR, 65 %HNR and
EPDM (heating rate of 20oC/min under oxygen atmosphere)
Table 4.6 Decomposition temperatures of NR, HNRs and EPDM 4725P
Rubbers Td (oC)
NR 385.9
14 %HNR 390.8
33 %HNR 404.5
65 %HNR 431.1
EPDM 4725P 433.0
It was found that Td of HNRs were higher than that of NR,
but lower than that of EPDM (Table 4.6). For HNRs, the increase in degrees of
hydrogenation shifted Td to higher temperatures. NR contains carbon-carbon double
bonds which are susceptible to oxidation. Hydrogenation of NR resulted in the
increase in saturated carbon-carbon single bonds which were less susceptible to
oxidation.

75
Figure 4.29 Raman spectra of (a) NR, (b) 65 %HNR and (c) EPDM 4725P
Figure 4.30 FT-IR spectra of (a) NR, (b) 65 %HNR and (c) EPDM 4725P

76
Therefore, thermal stability of HNRs was much improved
when compared to NR. Thermal stability of HNRs increased with increasing
hydrogenation levels. Thermal stability of 65 %HNR was comparable to that of
EPDM because their chemical structure were very similar as confirmed by Raman and
FT-IR spectra shown in Figures 4.29 and 4.30, respectively.
4.3 Vucanization and physical properties of HNRs
4.3.1 Vulcanization properties of HNR compounds
ODR curves of NR and HNRs vulcanized by dicumyl peroxide
(DCP) and sulfur at various temperatures were shown in Figure 4.31 and cure
properties were shown in Tables 4.7 and 4.8.
For peroxide-cured rubbers, cure properties such as scorch time
(ts1) and cure time (tc,90) decreased with increasing temperatures. At 150 oC, the rate of
vulcanization was very slow due to decomposition of peroxide was not complete
leading to small amounts free radicals that could initiate crosslinking. Therefore,
torque rose slowly. At higher temperatures, peroxide easily decomposed and radicals
generated could effectively initiate crosslinking, leading to rapid increase in torque.
Although the rate of vulcanization at 180 oC was greater than that at 150
oC, slight
reversion and smaller maximum torque was observed. This was due to thermal
degradation of polymer chains under shear. For peroxide vulcanization, the optimum
cure temperature was 180 oC. Apparently cure rates of HNR compounds were
independent of degrees of hydrogenation.
For sulfur-vulcanized rubber compounds, ts1 and tc,90 also
decreased while vulcanization rate increased with increasing temperatures. However,
reversion, thermal degradation of crosslink under dynamic shear, was pronounced at
high temperatures.

77
Figure 4.31 ODR curves of NR and HNR compounds vulcanized by dicumyl
peroxide (left column) and sulfur (right column) at 150 oC (a, b), 180
oC (c, d), and
200 oC (e, f)

78
Table 4.7 Cure properties of peroxide-vulcanized rubber compounds at various
temperatures
Rubbers
Cure properties
150 oC 180
oC 200
oC
MH ML Ts1 Tc90 MH ML Ts1 Tc90 MH ML Ts1 Tc90
NR 12.11 3.42 3.09 11.24 19.03 7.46 0.51 4.07 12.68 3.82 0.29 1.33
14 %HNR 12.18 5.32 4.20 11.50 20.00 9.96 1.03 4.15 13.20 6.34 0.36 1.45
33 %HNR 12.40 5.03 4.07 11.66 20.13 9.89 1.08 4.30 14.73 5.49 0.35 1.49
65 %HNR 15.42 6.87 3.40 14.56 21.45 11.86 1.06 4.01 15.05 5.60 0.25 1.30
Table 4.8 Cure properties of sulfur-vulcanized rubber compounds at various
temperatures
Rubbers
Cure properties
150 oC 180
oC 200
oC
MH ML ts1 tc,90 MH ML ts1 tc,90 MH ML ts1 tc,90
NR 20.68 2.58 2.56 4.27 20.38 4.83 1.07 1.43 16.40 6.02 0.33 1.00
14 %HNR 22.26 5.60 3.28 5.11 22.49 7.72 1.09 1.55 15.58 7.14 0.45 1.13
33 %HNR 21.07 3.91 3.37 5.38 24.46 7.81 1.13 2.02 16.91 7.90 0.45 1.13
65 %HNR 26.38 5.99 3.26 5.34 23.81 8.71 1.10 1.57 17.32 8.60 0.48 1.15
4.3.2 Ozone and UV Resistance
Raman optical photographs of cracks on surfaces rubber vulcanized
by peroxide and sulfur after exposure to ozone and UV were shown in Figures 4.32-
4.35. The larger number of cracks was observed for NR vulcanizates, and cracks
spread when compared to HNR vulcanizates due to larger amounts of C=C bonds in
rubber molecules. Ozone cracking involved the attack of ozone on C=C bonds to form
ozonide intermediate which caused chain scission and formation of decomposition
products (Figure 4.36). For HNR vulcanizates, the number of cracks apparently
decreased with increasing degrees of hydrogenation. The increase in the degrees of
hydrogenation causes the decrease in the amounts of C=C bonds. Thus, there would
be less amounts of C=C bonds available for ozone attack, resulting in less ozone and
UV cracking on the rubber surface. In addition, reactions between ozone and saturated
units are much slower than those between ozone and the C=C bond (Simma et al.,

79
2009) and reactions between UV radiation (320 nm or 288.9 kJ/mol) and C=C bonds
are easier than those between UV and R-H bonds due to lesser bond dissociation
energies, i.e., C=C (271.63 kJ/mol) < C-H (334.72 kJ/mol) < CH-H (414.22 kJ/mol) <
CH2-H (485.34 kJ/mol) (Stans, 1970; Walsh, 1998).
Figure 4.32 Optical photographs of cracks on surfaces of rubbers vulcanized by
peroxide after ozone exposure; (a) NR, (b) 14 %HNR, (c) 33 %HNR, and (d) 65
%HNR

80
Figure 4.33 Optical photographs of cracks on surfaces of rubber vulcanized by sulfur
after ozone exposure; (a) NR, (b) 14 %HNR, (c) 33 %HNR, and (d) 65 %HNR
Apparently, sulfur-vulcanized rubbers had greater ozone resistance
than peroxide-cured rubbers due to lower unsaturated contents in the rubbers as
evidenced by Raman spectra shown in Figure 4.37. Raman characteristic peaks of
HNRs were shown in Table 4.9. The characteristic peak of C=C stretching was at
1664 cm-1
. From Table 4.10, it was noted that the amounts of unsaturated portions of
uncured rubbers were high. After vulcanized with peroxide, the amounts of C=C
bonds remained unchanged, implying that crosslinking reactions were less involved
with C=C bonds. In contrast, the amounts of C=C bonds of sulfur-cured rubbers
largely decreased after vulcanization, indicating that crosslinking reactions took place
at C=C bonds.

81
Figure 4.34 Optical photographs of cracks on surfaces of rubber vulcanized by
peroxide after UV exposure; (a) NR, (b) 14 %HNR, (c) 33 %HNR, and (d) 65
%HNR

82
Figure 4.35 Optical photographs of cracks on surfaces of rubber vulcanized by sulfur
after UV exposure; (a) NR, (b) 14 %HNR, (c) 33 %HNR, and (d) 65 %HNR
C CO3
C C
O
O
O
O
O
O
C C
chain scission products
C COO +
Figure 4.36 Mechanisms of ozone degradation in diene rubbers

83
Figure 4.37 Raman spectra of 65 %HNR; (U) unvulcanized, (P) peroxide-vulcanized,
and (S) sulfur-vulcanized
Table 4.9 Characteristic peak frequency of unvulcanized and vulcanized HNRs
Wave number
(cm-1
) Assignments
568 S-S stretching
995 C–CH3 stretching
1031 CH3 rocking
1120 CH2 wagging
1298 CH bending
1369 CH2 deformation
1446 CH2 deformation asymmetric stretching
1624 C=C-C-S stretching
1664 C=C stretching
2878 CH2 symmetric stretching
2903 CH3 symmetric stretching

84
Table 4.10 Integral intensity of C=C bond stretching, IC=C, at 1664 cm-1
of NR and
HNRs vulcanized by peroxide and sulfur
Rubbers Integral intensity (I), IC=C at 1664 cm
-1, (a.u.)
Uncured rubber Peroxide cure Sulfur cure
NR 1.93 1.90 1.17
14 %HNR 1.92 1.92 0.92
33 %HNR 1.08 1.02 0.44
65 %HNR 0.79 0.61 0.22
The Raman spectra peroxide-cured 65 %HNR before and after
ozone exposure were illustrated in Figure 4.38. It was found that the amounts of C=C
bonds decreased after ozone exposure as evidenced by the decrease in intensity at
1664 cm-1
. The integral intensity difference (IP), difference in peak integral at 1664
cm-1
before and after ozone/UV exposure, of NR and HNRs cured by peroxide and
sulfur was shown in Table 4.11 and 4.12. It was noted that IP decreased with
increasing degrees of hydrogenation. This was consistent well with optical
photographs given in Figures 4.32-4.35, indicating that ozone and UV resistance of
HNR vulcanizates was much better than that of the NR vulcanizates.
In addition, IP of sulfur-vulcanized rubbers was lower than that of
peroxide-cured rubbers. This was due to lower unsaturated contents in the former.

85
Figure 4.38 Raman spectra of peroxide-cured 65%HNR before (black line) and after
(red line) ozone exposure
Table 4.11 Different integral intensity (IP) peak, IC=C, at 1664 cm-1
of NR and HNRs
vulcanized by peroxide and sulfur before and after ozone exposure
Rubbers
Different integral intensity (IP) peak, IC=C, at 1664 cm-1
, (a.u.)
Peroxide cure Sulfur cure
NR -1.16 -0.83
14 %HNR -1.33 -0.72
33 %HNR -0.47 -0.35
65 %HNR -0.23 -0.15
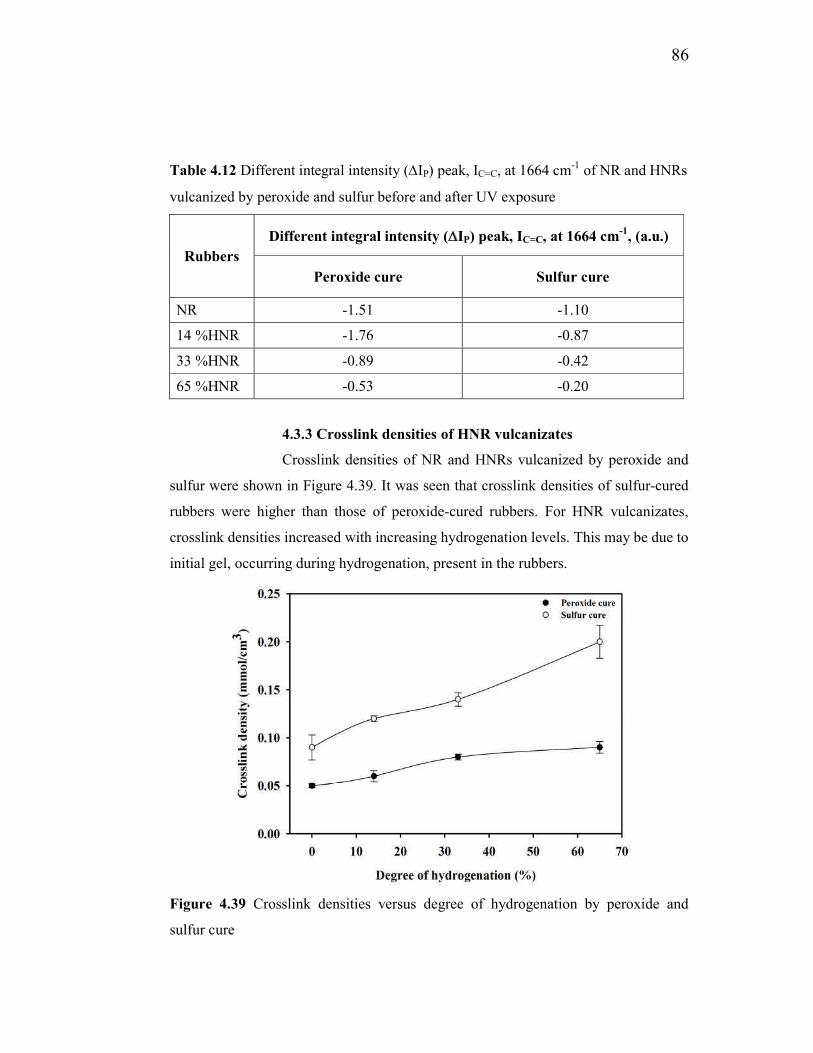
86
Table 4.12 Different integral intensity (IP) peak, IC=C, at 1664 cm-1
of NR and HNRs
vulcanized by peroxide and sulfur before and after UV exposure
Rubbers
Different integral intensity (IP) peak, IC=C, at 1664 cm-1
, (a.u.)
Peroxide cure Sulfur cure
NR -1.51 -1.10
14 %HNR -1.76 -0.87
33 %HNR -0.89 -0.42
65 %HNR -0.53 -0.20
4.3.3 Crosslink densities of HNR vulcanizates
Crosslink densities of NR and HNRs vulcanized by peroxide and
sulfur were shown in Figure 4.39. It was seen that crosslink densities of sulfur-cured
rubbers were higher than those of peroxide-cured rubbers. For HNR vulcanizates,
crosslink densities increased with increasing hydrogenation levels. This may be due to
initial gel, occurring during hydrogenation, present in the rubbers.
Figure 4.39 Crosslink densities versus degree of hydrogenation by peroxide and
sulfur cure

87
4.3.4 Tensile properties of HNR vulcanizates
True stress - true strain curves of NR and HNRs cured by peroxide
and sulfur were shown in Figures 4.40 and 4.41, respectively. At low elongation (<
200 % strain), 100 % Moduli, the stress required to stretched rubber to 100% strain, of
HNR vulcanizates were greater than that for NR sample and the stress increased with
increasing degrees of hydrogenation. Tensile strength or stress at break tended to
increase whereas elongation at break decreased with increasing hydrogenation levels.
As mentioned previously, hydrogenation transformed unsaturated, flexible, and elastic
NR to partially saturated, stiff, and less elastic HNRs, therefore, HNR vulcanizates
were stiffer and harder than NR vulcanizates, leading to higher modulus at low strain
and lower elongation at break. Furthermore, larger gel contents present in higher HNR
also helped increased the modulus of the rubber. However, tensile strength of
vulcanizates was very low ( 0.1 MPa) due to strain rate was low (50 mm/min).
Similar results were observed for NR and HNRs vulcanized by sulfur. However, the
effect of hydrogenation degrees on stress at low strain was pronounced in sulfur-cured
rubbers.
Figure 4.40 True stress - true strain curves of NR and HNRs vulcanized by peroxide

88
Figure 4.41 True stress - true strain curves of NR and HNRs vulcanized by sulfur
Sulfur-cured rubbers had higher moduli and tensile strength, but
lower strain at break than peroxide-cured rubbers because of higher amounts of
crosslinks.
4.4 Thermoplastic vulcanizates based on dynamically vulcanized
HNR and PP blends
4.4.1 Mixing of TPVs
The TPVs were prepared from dynamic vulcanization of HNRs and
PP blends using peroxide and sulfur as curing agents. 65 %HNRs was selected due to
greater thermal resistance than 14 %HNR and 33 %HNR. Moreover, the chemical
structure of 65 %HNR was similar to EPDM. The typical stages of the dynamic
vulcanization in an internal mixer at 180 oC could be investigated from torque-time
profile. Figure 4.42 showed time-dependent mixing torque of TPVs based on blends
of NR/PP (70/30, 50/50) and 65 %HNR/PP (70/30, 50/50) vulcanized by peroxide and
sulfur.

89
Figure 4.42 Mixing torque-time profiles of TPVs prepared from blends of NR/PP and
65 %HNR/PP at blend ratios 70/30 and 50/50 vulcanized with peroxide (left column)
and sulfur (right column)
For all torque-time curves, when solid PP was first added, torque
increased (peak 1) due to PP was not completely melt. After that, torque decreased
due to PP was completely in molten state. When the rubber compound was added,
mixing torque increased due to high viscosity rubber phase. At the same blend ratio,
viscosities of NR and HNR compounds were about the same. For peroxide-cured
systems, the increase in torque was only in one-step due to rapid crosslinking
reactions initiated by free radicals generated from the decomposition of DCP.
Crosslinking of NR and HNRs with peroxide involved hydrogen abstraction at allylic
position of isoprene units to generate macroradicals followed by coupling of these
macroradicals. After that the high viscosity crosslinked rubber phase was sheared and
broken into small particles dispersed in PP matrix, resulting in a decrease in mixing

90
torque and finally reaching equilibrium state. Apparently, the difference in chemical
structures between NR and 65 %HNR did not affect crosslinking with peroxide.
For sulfur-cured systems, after rubber compound was added, the
increase in torque (peak 2) was observed, and then mixing torque decreased. This may
be because of thermo-mechanically induced molecular destruction processes (Harrats
et al., 2005) and lower rate of sulfur vulcanization than peroxide cure due to the
complexity of the number and variety of the ingredients used in the sulfur cure. After
crosslinking took place, mixing torque increased (peak 3) to reach a maximum due to
high viscosity crosslinked rubber phase, then decreased continuously with time
because crosslinked rubber phase was deformed under intensive shear and broken into
small particles dispersed throughout continuous PP phase. The decrease in torque was
more pronounce in TPVs with higher rubber components and TPVs prepared from
NR. Also, it could be seen that the difference in chemical structures between NR and
65 %HNR affected crosslinking with sulfur. This was because sulfur crosslinking
involved reactions at C=C bonds. Hydrogenation caused C=C bonds in HNRs to
decrease, leading to less C=C bonds available for crosslinking.
For TPVs with larger rubber portions, mixing torque was greater
(Figure 4.43) due to high viscosity of rubber component.
Figure 4.43 Mixing torque-time profiles of TPVs prepared from blends of 65
%HNR/PP at blend ratio 70/30 and 50/50 vulcanized with peroxide

91
4.4.2 Morphological characterization of TPVs by Raman
mapping
The morphology of simple or physical blends of NR/PP and
65 %HNR/PP at blend ratio 50/50 characterized by Raman spectroscopic technique
was shown in Figure 4.44, revealing co-continuous morphology of both rubber and PP
phases. PP was characterized by peaks at 813 cm-1
and at 846 cm-1
corresponding to
the CH2 (rocking) and CH3 (rocking), respectively. Characteristic peak of NR and
HNR at 1664 cm-1
was assigned to stretching of C=C double bond. The intensity of
this peak decreased in 65 %HNR. The absorption at 1434 cm-1
and 1452 cm-1
,
attributed to the CH3 symmetric bending and CH2 twisting, respectively, increased in
65 %HNR. Therefore, characteristic frequencies in the range of 1434-1664 cm-1
for
NR and 65 %HNR and 813-846 cm-1
for PP could be used to identify phase
component in their blends. The Raman mapping of the distribution of the phase
component in NR/PP and 65 %HNR/PP blends was also shown in Figure 4.44 (right).
The colored image was constructed in the range of 813-846 cm-1
(blue), which
represented characteristic frequencies of PP phase and 1434 -1664 cm-1
(red),
representing characteristic wave numbers of NR or 65 %HNR phase. The surface of
these blends, it appears that NR/PP and 65 %HNR/PP blends seem to be continuous
rubber phase morphology of the blends as shown in Figure 4.44. In this case, the
blend system was nonreactive and phase inversion phenomenon not occurred.
The morphological maps of TPVs prepared from dynamically
vulcanized blends of NR/PP and 65 %HNR/PP at 50/50 blend ratio cured by peroxide
and sulfur were illustrated in Figures 4.45 and 4.46, respectively. Dispersed-
continuous morphology was obvious in both cases. Crosslinked rubber particles were
finely dispersed throughout thermoplastic PP matrix. These results were similar to
those reported on PE/PP blends by Furukawa et al. (2006).

92
Figure 4.44 Morphology of simple blends; (a) NR/PP and (b) 65%HNR/PP at blend ratio of 50/50 (wt/wt%); Raman optical micrograph
(left): rubber phase (white), PP phase (dark); Raman spectra (middle); and Raman mapping (right): PP phase (blue) and rubber phase
(red)

93
Figure 4.45 Morphology of TPVs prepared from dynamically vulcanized blends of (a) NR/PP and (b) 65 %HNR/PP at 50/50 blend ratio
vulcanized by peroxide; Raman optical micrograph (left), rubber phase (white) and PP phase (dark); Raman spectra (middle); and
Raman mapping (right), PP phase (blue) and rubber phase (red)

94
Figure 4.46 Morphology of TPVs prepared from dynamically vulcanized blends of (a) NR/PP and (b) 65 %HNR/PP at 50/50 blend ratio
vulcanized by sulfur; Raman optical micrograph (left), rubber phase (white) and PP phase (dark); Raman spectra (middle); and Raman
mapping (right), PP phase (blue) and rubber phase (red)

95
4.4.3 Phase size analysis by Raman mapping technique
The size of crosslinked rubber phase of TPVs was size dispersed in
matrix PP phase was determined from Raman map (Figure 4.47) and compared with
SEM micrograph (Figure 4.48). From Raman image, the range of particle size of
crosslinked rubber was from 0.32 to 2.74 μm, while the values in the range of 0.44 to
1.95 μm were obtained from SEM method. The particle sizes of crosslinked rubber in
TPVs measured by both techniques were in good correlation as shown in Figure 4.49.
Figure 4.47 Raman maps of TPVs based on 50/50 of 65 %HNR/PP dynamically
vulcanized blends cured by peroxide, revealing crosslinked rubber particles (red)
dispersed in matrix PP (blue)

96
Figure 4.48 SEM micrograph of TPVs based on 50/50 of 65 %HNR/PP dynamically
vulcanized blends cured by peroxide, revealing crosslinked rubber particles (dark
hole) dispersed in PP matrix (magnification 4,500x)
Figure 4.49 Correlation between of particle sizes of crosslinked rubber phase of
TPVs measured by Raman mapping and SEM methods (50/50 of 65 %HNR/PP
blend)

97
4.4.4 Determination of blend ratio by Raman spectroscopy
Raman spectroscopic technique could be employed to
quantitatively determine the components of the TPVs. For NR/PP and HNR/PP
blends, characteristic frequencies in the range of 813-846 cm-1
and 1434-1664 cm-1
,
attributed to PP and NR or HNR, respectively, could be used to characterize the
blends. The amount of each component could be calculated from equations (3.15) and
(3.16). Figure 4.50 showed Raman spectra of TPVs based on dynamically cured 65
%HNR/PP blends vulcanized by peroxide at various blend ratios and Raman spectra
of 65 %HNR/PP TPVs with blend ratios of 70/30 and 40/60 were shown in Figure
4.51. It was found that the increase in PP and rubber contents in TPVs led to the
increase in intensity at 813-846 cm-1
for PP and at 1434-1664 cm-1
for 65 %HNR in
their blends. The calculated blend ratios from Raman spectra were in good agreement
with the nominal blend ratios (Table 4.13). Therefore, Raman spectroscopic technique
can effectively be used to quantitatively determine blend ratios in simple blends or
TPVs.
Figure 4.50 Raman spectra of TPVs based on 65 %HNR/PP blends cured by peroxide
at blend ratios of (a) 70/30, (b) 60/40, (c) 50/50, (d) 40/60

98
Figure 4.51 Raman maps of TPVs based on 65 %HNR/PP blends cured by peroxide
with blend ratio (a) 70/30 and (b) 40/60 (PP phase (blue) and rubber phase (red))
Table 4.13 The content of each component of TPVs based on NR/PP and 65
%HNR/PP blends
Samples
The nominal blend ratio
(%wt/%wt)
The blend ratio calculated from
Raman spectra
Peroxide cure Sulfur cure Peroxide cure Sulfur cure
NR/PP
70/30 70/30 72/28 69/31
60/40 60/40 64/36 64/36
50/50 50/50 52/48 51/49
40/60 40/60 44/56 41/59
65 %HNR/PP
70/30 70/30 69/31 72/28
60/40 60/40 59/41 64/36
50/50 50/50 48/52 51/49
40/60 40/60 39/61 42/58

99
4.4.5 Dynamic mechanical behavior of TPVs
Strain-dependent storage modului of 65 %HNR vulcanizates and
TPVs based on 65 %HNR/PP blends vulcanized by peroxide and sulfur at 70/30 and
50/50 blend ratios were shown in Figures 4.52 and 4.53, respectively. It was noted
that storage modulus of sulfur- and peroxide-cured HNRs were lower than those of
TPVs and were independent of the amplitudes of the strain. HNR vulcanizates
exhibited only linear region on the dynamic mechanical behavior due to one phase
nature, while linear and non-linear behaviors were observed for TPVs due to two-
phase nature of the system. For TPVs, storage moduli were independent of strain
amplitudes up to about 0.2. Further increase in strain amplitudes resulted in the
decrease in storage modulus. TPVs with higher PP contents had higher storage
modulus but modulus relaxed faster at high strain. The origin of non-linear region was
probably due to the interfacial slippage between crosslinked rubber phase and PP
matrix. The slopes of non-linear region for TPVs cured by peroxide were lower than
those of sulfur-cured TPVs. This could be explained in terms of the increase in
interfacial interactions between rubber and PP phases. Peroxide vulcanization
involved hydrogen abstraction by free radicals from polymer chains to generate
macroradicals followed by coupling of these macroradicals. Free radicals obtained
from thermal decomposition of peroxide were able to abstract hydrogen atoms from
rubber and PP to form macroradicals of these polymers, leading interfacial coupling
of these two macroradicals. For sulfur-cured TPVs, interfacial interactions would
rarely occur due to involvement of C=C bonds in crosslinking process.
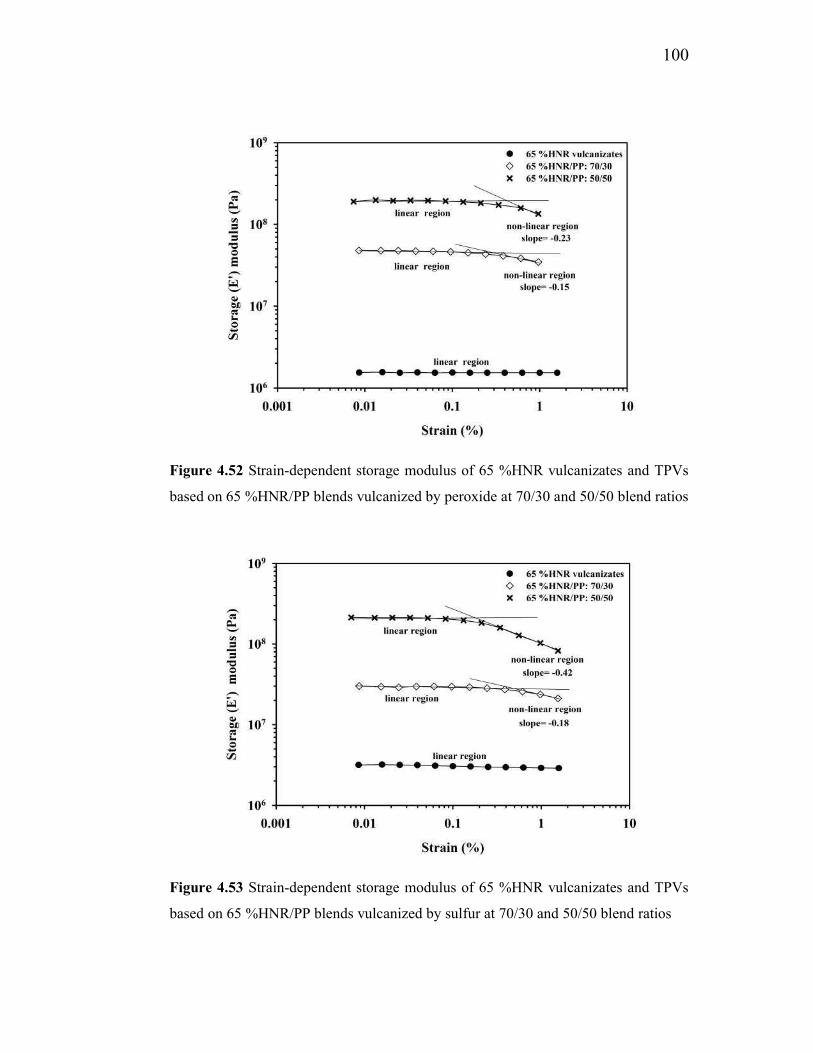
100
Figure 4.52 Strain-dependent storage modulus of 65 %HNR vulcanizates and TPVs
based on 65 %HNR/PP blends vulcanized by peroxide at 70/30 and 50/50 blend ratios
Figure 4.53 Strain-dependent storage modulus of 65 %HNR vulcanizates and TPVs
based on 65 %HNR/PP blends vulcanized by sulfur at 70/30 and 50/50 blend ratios

101
4.4.6 Tensile properties of TPVs
True stress-true strain curves of HNR vulcanizate and peroxide-
cured TPVs based on 65 %HNR/PP blends at various blend ratios were shown in
Figure 4.54 and their tensile properties were shown in Figure 4.55. HNR vulcanizate
had lowest strength and highest elongation at break. For TPVs, the increase in rubber
contents resulted in the increase in elongation and the decrease in strength. This was
because the strength of TPVs was governed by the hard phase PP. At the same rate of
extension (50 mm/min), tensile strength of PP (the inset in Figure 4.54) was much
greater than that of HNR vulcanizate. Therefore, strength of TPVs were mainly
governed by the amount of hard thermoplastic phase.
Figure 4.54 True stress-true strain curves of HNR vulcanizate and peroxide-cured
TPVs based on 65%HNR/PP blends at various blend ratios

102
4.4.7 Fractured surface of TPVs
Fracture behavior of TPVs was largely affected by rubber contents.
Figure 4.56 showed fractured surfaces of peroxide-cured TPVs based on 65
%HNR/PP blends at blend ratios of 70/30 and 50/50. It could be seen that the
fractured surface of TPV with higher rubber content was rougher than that of TPV
with lower rubber content, indicating the ductile failure with higher elongation. TPV
with lower rubber content had smoother fractured surface, indicating brittle failure
with low elongation.
Figure 4.55 Tensile properties of peroxide-cured TPVs based on 65 %HNR/PP
blends as a function of rubber contents

103
Figure 4.56 The fractured surfaces of peroxide-cured TPVs based on 65 %HNR/PP
blends at blend ratio of (a) 70/30 and (b) 50/50
(a)
(b)
104
CHAPTER 5
CONCLUSIONS
1. Partially hydrogenated natural rubbers (HNRs) was prepared by
non-catalytic hydrogenation of natural rubber latex (NRL) using diimide generated in
situ from the reaction between hydrazine (N2H4) and hydrogen peroxide (H2O2).
2. Variations in moles of N2H4 and H2O2 in the range of 1.0-2.0 moles
resulted in degrees of hydrogenation in the range of 10-18 %. High improvement in
hydrogenation levels of HNRs was obtained when NRL particles were swollen in
solvents by which toluene yielded slightly higher degrees of hydrogenation than
hexane.
3. The increase in degrees of swelling of NRL could increase
hydrogenation levels up to 42 %. TEM micrograph revealed that hydrogenation
confined only at the swollen surface. After removal of toluene, particle size and
particle size distribution of HNRL remained unchanged.
4. The increase in reaction volume could increase hydrogenation
levels from 42 % to 65 %.
5. Crosslinking and cis-trans isomerization were side-reactions
occurring during hydrogenation, leading the increase in gel contents and hardness
with increasing degrees of hydrogenation of HNRs. Mooney viscosities of HNRs also
increased with increasing degrees of hydrogenation due to gel present in rubbers.
Stress relaxation of raw NR and HNRs were similar.
6. HNRs had greater thermal stability than NR and thermal stability
increased with increasing degrees of hydrogenation. HNR vulcanizates had better
resistance to ozone/UV than NR vulcanizates. Sulfur vulcanization provided rubbers
with greater ozone/UV resistance than peroxide vulcanization. Furthermore,
mechanical properties of sulfur-vulcanized rubbers were greater than those of
peroxide-cured rubbers due to higher crosslink densities.
7. Raman spectroscopy was a powerful technique that could be
employed to characterize phase morphology and to quantitatively determine blend

105
components of TPVs. Particle sizes of crosslinked rubber phase of TPVs measured by
Raman spectroscopic technique were correlated well with those determined from
SEM technique. Furthermore, the blend ratios of TPVs calculated from Raman
spectra were in good agreement with the nominal blend ratios.
8. Strength properties of TPVs were mainly governed by the hard
thermoplastic phase. Tensile strength of HNR/PP TPVs increased with increasing PP
contents, while elongation decreased. For TPVs with high PP contents, fractured
surface were smoother, indicating brittle fracture with low elongation. For TPVs with
high rubber contents, fractured surfaces were rougher, indicating ductile failure with
high elongation.

106
REFERENCES
Aboulkas, A. and El Harfi, K. 2008. Study of the kinetics and mechanisms of thermal
decomposition of Moroccan tarfaya oil shale and its kerogen. Oil Shale.
25, 426-443.
Akiba, M. and Hashim, A.S. 1997. Vulcanization and crosslinking in elastomers.
Progress in Polymer Science. 22, 475-521.
Arayapranee, W. and Rempel, G.L. 2009. Synthesis and mechanical properties of
diimide-hydrogenated natural rubber vulcanizates. Journal of Polymer
Science. 114, 4066–4075.
Barbillat, J. 1996. Raman imaging. In Raman Microscopy: Development and
Applications. Turrell, G. and Corset, J., Eds. Elsevier-Academic Press.
Amsterdam. pp. 175.
Blaine, R.L. and Kissinger, H.E. 2012. Homer Kissinger and the Kissinger equation.
Thermochimica Acta. 540, 1-6.
Boyce, M. C., Kear, K., Socrate, S., and Shaw, K. 2001. Deformation of thermoplastic
vulcanizates. Journal of the Mechanics and Physics of Solids. 49, 1073–
1098.
Bunce, S.J., Edwards, H.G.M., Johnson, A.F., Lewis, I.R. and Turner, P.H. 1993.
Synthetic polyisoprenes studied by Fourier transform Raman
spectroscopy. Spectrochimica Acta. 49, 775-783.
Colthup, N. B., Daly, L. H., and Wiberly, H. E. 1975. Introduction to Infrared and
Raman Spectroscopy, 2nd
Edition, Academic Press, New York.
Costa, F.R., Dutta, N.K., Choudhury, N.R. and Bhowmick, A.K. 2008. Current topics
in elastomers research: Chapter 5 thermoplastic elastomers. CRC Press.,
USA.
Daniel, L., Reger, S.R. and Goode, D.W.B. 2010. Chemistry: principles and practice.
Third Edition. Cengage Learning, Inc., U.S.A.

107
De Sarkar, M., De, P.P. and Bhowmick, A.K. 1997. Thermoplastic elastomeric
hydrogenated styrene–butadiene elastomer: Optimization of reaction
conditions, thermodynamics, and kinetics. Journal of Applied Polymer
Science. 66, 1151–1162.
De Sarkar, M., De, PP. and Bhowmick, A.K. 2000. Diimide reduction of carboxylated
styrene–butadiene rubber in latex stage. Polymer. 41, 907–915.
Drobny, J. G. 2007. Handbook of thermoplastic elastomers William Andrew, New
York.
Esmonde-White, F. W., and Morris, M. D. 2010. In emerging Raman applications and
techniques in biomedical and pharmaceutical fields; Raman imaging and
Raman mapping. Springer Inc., USA.
Ferraro, J. R. 2003. Introductory Raman spectroscopy. 2nd
Edition. Elsevier
Academic Press Inc., USA.
Flory, P.J. 1953.Principles of polymer chemistry. Cornell University Press, Ithaca,
U.S.A., pp. 576-580.
Furukawa, T., Sato, H., Kita, Y., Matsukawa, K., Yamaguchi, H., Ochiai, S., Siesler,
H.W. and Ozaki, Y. 2006. Molecular structure, crystallinity and
morphology of polyethylene/polypropylene blends studied by Raman
mapping, scanning electron microscopy, wide angle x-ray diffraction,
and differential scanning calorimetry. Polymer Journal, 38, 1127-1136.
Gere, J.M. 2004. Mechanics of Materials. Sixth Edition. Thomson Learning, Inc,
USA. pp. 1-19.
Goharpey, F., Foudazi, R., Nazockdast, H. and Katbab, A.A. 2008. Determination of
twin-screw extruder operational conditions for the preparation of
thermoplastic vulcanizates on the basis of batch-mixer results. Journal of
Applied Polymer Science. 107, 3840–3847.
Greaves, D., Boxall, J., Mulligan, J., Montesi, A., Creek, J., Sloan, E.D. and Koh,
C.A. 2008. Measuring the particle size of a known distribution using the
focused beam reflectance measurement technique. Chemical Engineering
Science. 63, 5410-5419.

108
Han, S. J., Lohse, D. J., Radosz, M. and Sperling, L. H. 1998. Thermoplastic
vulcanizates from isotactic polypropylene and ethylene-propylene-diene
terpolymer in supercritical propane: synthesis and morphology.
Macromolecules. 31, 5407-5414.
Handt, J., Kunert, T. and Schmidt, R. 2006. Fragmentation and cis–trans
isomerization of diimide in fs laser-pulses. Chemical Physics Letters.
428, 220–226.
Harrats, C., Thomas, S., Groeninckx, G. and Radusch, H. J. 2005. Chapter 9 Phase
morphology of dynamically vulcanized thermoplastic vulcanizates.
Micro-and nanostructured multiphase polymer blend systems: Phase
morphology and interfaces. CRC Press., USA.
Harwood, H.J., Russell, D.B., Verthe, J.J.A. and Zymonas, J. 1973. Diimide as a
reagent for the hydrogenation of unsaturated polymer. Macromolecular
Chemistry and Physics. 163, 1-12.
Healey, A.M., Hendra, P.J. and West, Y.D. 1996. A Fourier-transform Raman study
of the strain-induced crystallization and cold crystallization of natural
rubber. Polymer. 30, 4009-4024.
Hendra, P. J., Jackson, K.D.O. 1994. Applications of Raman spectroscopy to the
analysis of natural rubber. Spectrochimica Acta. 50A, 1987-1997.
Hinchiranan, N., Charmondusit, K., Prasassarakich, P., and Rempel, G. L. 2006a.
Hydrogenation of synthetic cis-1, 4-polyisoprene and natural rubber
catalyzed by [Ir(COD)py(PCy3)]PF6. Journal of Applied Polymer
Science. 100, 4219–4233.
Hinchiranan, N., Prasassarakich, P., and Rempel, G. L. 2006b. Hydrogenation of
natural rubber in the presence of OsHCl(CO)(O2)(PCY3)2 : Kinetics and
mechanism. Journal of Applied Polymer Science. 100, 4499–4514.
Hinchiranan, N., Lertweerasirikun, W., Poonsawad, W., Rempel, G. L., and
Prasassarakich, P. 2009. Hydrogenated natural rubber blends: Aspect on
thermal stability and oxidative behavior. Journal of Applied Polymer
Science. 113, 1566–1575.
Hudlicky, M. 1984. Reductions in organic chemistry. Ellis Horwood Limited,
England.

109
l’Abee, R., Goossens, H., van Duin, M., and Spoelstra, A. 2009. Sub-micrometer
thermoplastic vulcanizates obtained by reaction-induced phase
separation of miscible mixtures of poly(ethylene) and alkyl
methacrylates. European Polymer Journal. 45, 503–514.
Igathinathane, C., Pordesimo, L.O., Columbus, E.P., Batchelor, W.D. and Methuku,
S.R. 2008. Shape identification and particles size distribution from basic
shape parameters using ImageJ. Computers and Electronics in
Agriculture. 63, 168-182.
Jackson, K.D.O., Loadman, M. J. R., Jones, C. H. and Ellis, G. 1990. Fourier
transform Raman spectroscopy of elastomers: an overview.
Specrrochimica Acta. 46A, 217-226.
Jones, C.W. 1999. Applications of Hydrogen Peroxide and Derivatives. The Royal
Society of Chemistry, Thomas Graham House, Science Park, Milton
Road Cambridge CB4 OWF, UK.
Koenig, J. L. 1999. Spectroscopy of Polymers, 2nd
Edition, Elsevier Science, New
York. pp. 256-258.
Le, H. H., Heidenreich, D., Kolesov, I. S., Ilisch, S. and Radusch, H.J. 2010. Effect of
carbon black addition and its phase selective distribution on the stress
relaxation behavior of filled thermoplastic vulcanizates. Journal of
Applied Polymer Science. 117, 2622–2634.
Lee, U. 2012. Imaging modes. In Raman Imaging: Techniques and Applications.
Zoubir, A., Ed. Springer, New York, USA. pp.1-6.
Lee, Y.J., Moon, D., Migler, B.K. and Cicerone, M.T. 2011. Quantitative image
analysis of broadband CARS hyperspectral images of polymer blends.
Journal of Analytical Chemistry. 83, 2733-2739.
Lin, X. 2005. Hydrogenation of unsaturated polymers in latex Form. Ph.D. Thesis,
Waterloo University.
Loan, L. D. 1972. Peroxide crosslinking reactions of polymers. Pure and Applied
Chemistry. 30, 173-180.

110
Li, Z. and Kontopoulou, M. 2009. Evolution of rheological properties and
morphology development during crosslinking of polyolefin elastomers
and their TPV blends with polypropylene. Journal of Polymer
Engineering and Sciences. 49, 34-43.
Mahittikul, A., Prasassarakich, P., and Rempel, G. L. 2007a. Noncatalytic
hydrogenation of natural rubber latex. Journal of Applied Polymer
Science. 103, 2885–2895.
Mahittikul, A., Prasassarakich, P., and Rempel, G. L. 2007b. Diimide hydrogenation
of natural rubber latex. Journal of Applied Polymer Science. 105, 1188–
1199.
Mark, J. E. 2007. Physical properties of polymers handbook. Second Edition.
Springer Science and Business Media, LLC, New York, USA. pp. 430-
431.
McCreery, R. L. 2000. Raman Spectroscopy for Chemical Analysis. Wiley-
Interscience, New York. pp. 15-16.
Morris, H.R., Turner, J.F., Munro, B., Ryntz, R.A. and Treado, P.J. 1999. Chemical
imaging of thermoplastic olefin (TPO) surface architecture. Journal of
Langmuir. 15, 2961-2972.
Nagdi, K. 1993. Rubber as an engineering material: guideline for users. Hanser., New
York.
Neon, G. S., Subramaniam, N., and Yahya, R. 1996. Hydrogenation of natural rubber
using Nickel 2-Ethylhexanoate catalyst in combination with
Triisobutylaluminum. Journal of Applied Polymer Science. 59, 63–70.
Nicolini, A., de Campos Rocha, T. L. A., and Jacobi, M. A. M. 2008. Dynamically
vulcanized PP/EPDM blends: Influence of curing agents on the
morphology evolution. Journal of Applied Polymer Science. 109, 3093–
3100.
Overman, S.A. and Thomas, G. J. 1999. Raman markers of nonaromatic side chains in
an α-helix assembly: Ala, Asp, Glu, Gly, Ile, Leu, Lys, Ser, and Val
residues of phage fd subunits. Biochemistry. 38, 4018-4027.
Paquette, L.A. 1991. Organic reactions. John Wiley & Sons, Inc., New Jersey.

111
Pasto, D.J. and Taylor, R.T. 1991. Organic reactions, reduction with diimide. John
Wiley & Sons, Inc., New Jersey.
Phinyocheep, P., Pasiri, S., and Tavichai, O. 2002. Diimide hydrogenation of
isoprene–styrene diblock copolymers. Journal of Applied Polymer
Science. 87, 76–82.
Prut, E.V., Erina, N.A., Karger-Kocsis, J. and Medintseva, T.I. 2008. Effects of blend
composition and dynamic vulcanization on the morphology and dynamic
viscoelastic properties of PP/EPDM blends. Journal of Applied Polymer
Science. 109, 1212–1220.
Rachapudy, H., Smith, G.G., Raju, V.R. and Graessley, W.W. 1979. Properties of
amorphous and crystallizable hydrocarbon polymer. III. studies of the
hydrogenation of polybutadiene. Journal of Polymer Science. 17, 1211-
1222.
Radusch, H. J. 2005. Phase morphology of dynamically vulcanized thermoplastic
vulcanizates. Micro-and nanostructured multiphase polymer blend
systems: Phase morphology and interfaces. pp. 295-330.
Rylander, P.N. 1985. Hydrogenation methods. Academic press, INC., England.
Rich, P.R. and Breton, J. 2002. Attenuated total reflection fourier transform infrared
studies of redox changes in bovine cytochrome c oxidase: resolution of
the redox fourier transform infrared difference spectrum of heme a3.
Biochemistry. 41, 967-973.
Samran, J., Phinyocheep, P., Daniel, P., Derouet, D., and Buzaré, J. Y. 2004a. Raman
spectroscopic study of non-catalytic hydrogenation of unsaturated
rubbers. Journal of Raman Spectroscopy. 35, 1073–1080.
Samran, J., Phinyocheep, P., Daniel, P., and Kittipoom, S. 2004b. Hydrogenation of
unsaturated rubbers using diimide as a reducing agent. Journal of
Applied Polymer Science. 95, 16–27.
Samran, J., Phinyocheep, P., Daniel, P., Derouet, D. and Buzaré, J.Y. 2004c.
Spectroscopic study of di-imide hydrogenation of natural rubber.
Macromolecular Symposia, 216, 131-143.
Samran, J. 2005. A study of non-catalytic hydrogenation of natural rubber. Ph.D.
Thesis, Mahidol University.

112
Schmidt, P., Dybal, J., Scudla, J., Raab, M. and Kratochvil, J. 2002. Structure of
polypropylene/polyethylene blends assessed by polarized PA-FTIR
spectroscopy, polarized FT Raman spectroscopy and confocal Raman
microscopy. Journal of Macromolecular Symposia. 184, 107-122.
Simma, K., Rempel, G.L. and Prasassarakich, P. 2009. Improving thermal and ozone
stability of skim natural rubber by diimide reduction. Polymer
Degradation and Stability. 94, 1914–1923.
Singha, N.K., Bhattacharjee, S. and Sivaram, S. 1997. Hydrogenation of diene
elastomers, their properties and applications: A critical review. Rubber
Chemistry and Technology. 70, 309-339.
Slopiecka, K., Bartocci, P. and Fantozzi, F. 2011. Thermogravimetric analysis and
Kinetic study of poplar wood pyrolysis. Third International Conference
on Applied Energy - 16-18 May 2011 - Perugia, Italy, pp. 1687-1698.
Smith, B.C. 2011. Fundamentals of Fourier Transform Infrared Spectroscopy, 2nd
Edition. CRC Press, USA. pp. 5-7.
Sperling, L. H. 2005. Introduction to physical polymer science. Fourth Edition. John
Wiley & Sons. U.S.A. pp. 434-473.
Stans, M.H. 1970. Bond dissociation energies in simple molecules. NIST Special
Publication. 1, 58.
Tanner, R.I. 2000. Engineering rheology, Second edition. Oxford University Press
Inc., New York., U.S.A.
Treloar, L.R.G. 1973. The elasticity and related properties of rubbers. Reports on
Progress in Physics. 36, 755-826.
Turrell, G., and Corset, J.1996. Raman microscopy: developments and applications.
Elsevier Academic Press Inc., USA.
Van Duin, M. and Machado, A.V. 2005. EPDM-based thermoplastic vulcanisates:
crosslinking chemistry and dynamic vulcanisation along the extruder
axis. Journal of Polymer Degradation and Stability. 90, 340 – 345.
Vennemann, N., Bokamp, K. and Broker, D. 2006. Crosslink density of peroxide
cured TPV. Journal of Macromolecular Symposia. 245-246, 641–650.

113
Walsh, R. 1998. Bond dissociation energies in organosilicon compounds. 23M. A.
Brook, Silicon in Organic, Organometallic and polymer Chemistry.
Wiley., New York.
Xie, H.Q., Li, X.D. and Guo, J.S. 2003. Hydrogenation of nitrile-butadiene rubber
latex to form thermoplastic elastomer with excellent thermooxidation
resistance. Journal of Polymer Science. 90, 1026-1031.
Xue, G. 1997. Fourier transform Raman spectroscopy and its application for the
analysis of polymeric materials. Progress in Polymer Science. 22, 313-
406.
Yu, H., Zeng, Z., Lu, G. and Wang, Q. 2008. Processing characteristics and thermal
stabilities of gel and sol of epoxidized natural rubber. European Polymer
Journal. 44, 453–464.
Yves, G. and Fontanille, M. 2008. Organic and Physical Chemistry of Polymers. John
Wiley & Sons, Inc., Hoboken, New Jersey.
Zoubir, A. 2012. Raman imaging: techniques and applications. Springer Inc., New
York, USA.

114
APPENDICES
APPENDIX A
A.1 Effect of vulcanization systems on Raman spectra
Figure A.1.1 Raman spectra of (a) NR, (b) 14 %HNR, (c) 33 %HNR, and (d) 65
%HNR, [U; Uncured, P; Peroxide cure, S; Sulfur cure]

115
A.2 Raman spectra of ozone and ultraviolet (UV) stability of HNR vulcanizates
Figure A.2.1 Raman spectra before ozone (black line) and after ozone test (Red line)
of rubber surface; (a) NR, (b) 14 %HNR, (c) 33 %HNR, and (d) 65 %HNR cured by
peroxide

116
Figure A.2.2 Raman spectra before ozone (black line) and after ozone test (Red line)
of rubber surface; (a) NR, (b) 14 %HNR, (c) 33 %HNR, and (d) 65 %HNR cured by
sulfur

117
Figure A.2.3 Raman spectra before UV (black line) and after UV test (Red line) of
rubber surface; (a) NR, (b) 14 %HNR, (c) 33 %HNR, and (d) 65 %HNR cured by
peroxide
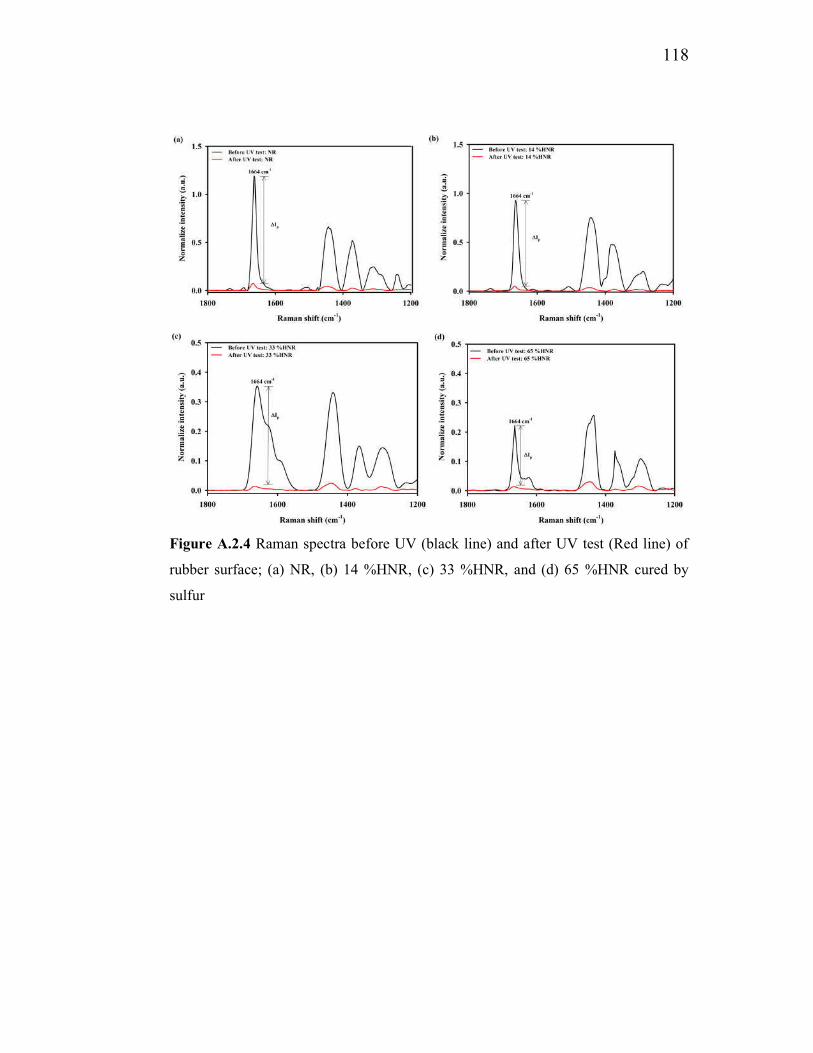
118
Figure A.2.4 Raman spectra before UV (black line) and after UV test (Red line) of
rubber surface; (a) NR, (b) 14 %HNR, (c) 33 %HNR, and (d) 65 %HNR cured by
sulfur

119
A.3 Mixing torque of thermoplastic vulcanizates based on dynamically
vulcanized HNR and PP blends
Figure A.3.1 Torque-time of (a) NR/PP, and (b) 65 %HNR/PP blends at 70/30, 60/40,
50/50, 40/60 (wt/wt%), peroxide cure (left column) and sulfur cure (right column)

120
A.4 Raman mapping of TPVs based on HNR/PP blends
Figure A.4.1 Raman spectra of (a) PP (HP500N), (b) NR, (c) 65 % HNR

121
Figure A.4.1 The phase size of cross-linked rubber phase (red) dispersed in matrix PP
phase (blue) of both peroxide cure (Left column) and sulfur cure (Right column) in
TPVs based on (a) NR/PP and (b) 65 %HNR/PP at 50/50 wt/wt%. The phase size was
calculated by using Raman mapping method

122
Figure A.4.2 The phase size of cross-linked rubber phase (dark hole) dispersed in
matrix PP phase of both peroxide cure (Left column) and sulfur cure (Right column)
in TPVs based on (a) NR/PP and (b) 65 %HNR/PP at 50/50 wt/wt% (magnification:
4,500x). The phase size was calculated by using SEM method

123
Figure A.4.3 Data correlation of phase size by using Raman mapping method versus
SEM method of TPVs in peroxide cure (Left column,) and sulfur cure (Right column)
base on NR/PP (a, b) and 65 %HNR/PP (c, d) at 50/50 (wt/wt%)

124
A.5 Determination of blend ratio by Raman spectroscopy
Figure A.5.1 Raman spectrum of TPVs (peroxide cure) based on (a) NR/PP, (b) 65
%HNR/PP and TPVs (sulfur cure) based on (c) NR/PP, (d) 65 %HNR/PP. The blends
ratio of TPVs at 70/30, 60/40, 50/50 and 40/60 (wt/wt%)

125
Figure A.5.2 Raman mapping of the blends ratio at 70/30 (wt/wt%) (Left column), at
40/60 (wt/wt%) (Right column) of TPVs (peroxide cure) based on (a) NR/PP, (b) 65
%HNR/PP: [PP phase (blue), rubber phase (red)].

126
Figure A.5.3 Raman mapping of the blends ratio at 70/30 (wt/wt%) (Left column), at
40/60 (wt/wt%) (Right column) of TPVs (sulfur cure) based on (a) NR/PP, (b) 65
%HNR/PP: [PP phase (blue), rubber phase (red)]

127
A.6 Dynamic properties of TPVs based on HNR/PP blends
Figure A.6.1 Dynamic strain sweep of (a) NR vulcanizates and NR/PP blends at
70/30, 50/50 (wt/wt%) and (b) 65 %HNR vulcanizates and 65 %HNR/PP blends at
70/30, 50/50 (wt/wt%) in peroxide cure
Figure A.6.2 Dynamic strain sweep of (a) NR vulcanizates and NR/PP blends at
70/30, 50/50 (wt/wt%) and (b) 65 %HNR vulcanizates and 65 %HNR/PP blends at
70/30, 50/50 (wt/wt%) in sulfur cure

128
Figure A.6.3 Dynamic frequency sweep of (a) NR vulcanizates and NR/PP blends (b)
65 %HNR vulcanizates and 65 %HNR/PP blends. The blend ratio at 70/30, 50/50
(wt/wt%) in peroxide cure
Figure A.6.4 Dynamic frequency sweep of (a) NR vulcanizates and NR/PP blends (b)
65 %HNR vulcanizates and 65 %HNR/PP blends. The blend ratio at 70/30, 50/50
(wt/wt%) in sulfur cure

129
Figure A.6.5 Dynamic time sweep at frequency =1 rad/s (Left column) and frequency
=10 rad/s (Right column) of (a) NR vulcanizates and NR/PP blends (b) 65 %HNR
vulcanizates and 65 %HNR/PP blends. The blend ratio at 70/30, 50/50 (wt/wt%) in
peroxide cure

130
Figure A.6.6 Dynamic time sweep at frequency =1 rad/s (Left column) and frequency
=10 rad/s (Right column) of (a) NR vulcanizates and NR/PP blends (b) 65 %HNR
vulcanizates and 65 %HNR/PP blends. The blend ratio at 70/30, 50/50 (wt/wt%) in
sulfur cure

131
A.7 Tensile properties of TPVs based on HNR/PP blends
Figure A.7.1 True stress-strain curve of (a) NR/PP, (b) 14 %HNR/PP, (c) 33
%HNR/PP and (d) 65 %HNR/PP blends at 100/0, 70/30, 60/40, 50/50, 40/60, 0/100
(wt/wt%), peroxide cure

132
Figure A.7.2 Rubber contents of NR/PP, 14 %HNR/PP, 33 %HNR/PP and 65
%HNR/PP blends on (a) tensile strength (MPa) and (b) elongation at break (%) in
peroxide cure
Figure A.7.3 Rubber contents of Rubber contents of NR/PP, 14 %HNR/PP, 33
%HNR/PP and 65 %HNR/PP blends on (a) tensile strength (MPa) and (b) elongation
at break (%) in sulfur cure

133
Figure A.7.4 True stress-strain curve of (a) NR/PP, (b) 14 %HNR/PP, (c) 33
%HNR/PP and (d) 65 %HNR/PP blends at 100/0, 70/30, 60/40, 50/50, 40/60, 0/100
(wt/wt%), sulfur cure

134
(b)
(d)
A.8 Fracture surface of TPVs based on HNR/PP blends
Figure A.8.1 The fracture surface morphology of TPVs: (a) NR/PP at 70/30 wt/wt%,
(b) NR/PP at 50/50 wt/wt%, (c) 65% HNR/PP at 70/30 wt/wt% and (d) 65 %HNR/PP
at 50/50 wt/wt% in peroxide cure
(c)
(a)

135
(b)
Figure A.8.2 The fracture surface morphology of TPVs: (a) NR/PP at 70/30 wt/wt%,
(b) NR/PP at 50/50 wt/wt%, (c) 65% HNR/PP at 70/30 wt/wt% and (d) 65 %HNR/PP
at 50/50 wt/wt% in sulfur cure
(d) (c)
(a)

136
APPENDICES
APPENDIX B
Raman investigation of thermoplastic vulcanizates based on hydrogenated
natural rubber/polypropylene blends (Polymer Testing Journal)

Material Characterisation
Raman investigation of thermoplastic vulcanizates based on
hydrogenated natural rubber/polypropylene blends
Korn Taksapattanakul a, b, 1, Tulyapong Tulyapitak b, Pranee Phinyocheep c,Polphat Ruamcharoen d, Jareerat Ruamcharoen e, Fabienne Lagarde a, Mathieu Edely a,Philippe Daniel a, *
a Institut des Mol�ecules et des Mat�eriaux du Mans, IMMM eUMR-CNRS 6283, Universit�e du Maine, Avenue Olivier Messiaen, 72085 Le Mans Franceb Department of Rubber Technology and Polymer Science, Faculty of Science and Technology, Prince of Songkla University, Pattani Campus, 94000 Thailandc Department of Chemistry, Faculty of Science, Mahidol University, 10400 Thailandd Rubber and Polymer Technology Program, Faculty of Science and Technology, Songkhla Rajabhat University, 90000 Thailande Division of Chemistry, Department of Science, Faculty of Science and Technology, Prince of Songkla University, Pattani Campus, 94000 Thailand
a r t i c l e i n f o
Article history:
Received 21 July 2016
Received in revised form
30 September 2016
Accepted 11 November 2016
Available online 12 November 2016
Keywords:
Raman spectroscopy
Thermoplastic elastomers
Thermoplastic vulcanizates
Hydrogenated natural rubber
Polymer blends
a b s t r a c t
Raman spectroscopy including mapping technique appears as a powerful technique for the character-
ization of polymer blends like thermoplastic elastomers (TPEs) and thermoplastic vulcanizates (TPVs).
The Raman spectra of polymers blends such as natural rubber/polypropylene (NR/PP) and 65% hydro-
genated natural rubber/polypropylene (65%HNR/PP) were identified and the phase distribution was
determined. The study was driven for the same type of blends in TPEs state and TPVs state obtained after
to 2 different processes, either peroxide cure or sulfur cure. The morphology of TPEs and TPVs obtained
by Raman spectroscopy were compared and confirmed using scanning electronic microscopy.
Raman mapping shows that the phase morphology of NR/PP, 65%HNR/PP, were characterized as
continuous rubber phase morphology of the thermoplastic elastomers (TPEs) and a fine dispersion of
cross-linked rubber phase in a continuous matrix of the thermoplastic vulcanizates (TPVs). Raman
spectroscopy is demonstrated to be a reference to determine the content ratio of each component in the
TPVs. Moreover, Raman mapping could be used to calculate the phase size of cross-linked rubber phase
dispersed in the thermoplastic vulcanizates (TPVs).
© 2016 Elsevier Ltd. All rights reserved.
1. Introduction
Thermoplastic vulcanizates (TPVs) constitute a special class of
Thermoplastic Elastomers (TPEs) resulting from elastomer cross-
linking and generating a fine dispersion of cross-linked elastomer
particles in a continuous matrix of thermoplastics. The vulcaniza-
tion of the elastomer phase has been carried out under dynamic
shear during mixing (dynamic vulcanization) by sulfur and accel-
erator, peroxide vulcanization systems [3]. TPVs offer properties of
cross-linked rubber, coupled with the processability of
thermoplastics. There may be several combinations of rubbers, like
Ethylene-propylene-diene-rubber (EPDM), natural rubber (NR),
with plastics, like PP, to form TPEs and TPVs. Polypropylene (PP)
was used because of its high melting point and high crystallinity,
resulting in good TPV properties even at high temperatures. EPDM
can be also used because of its stability against high temperatures
and ozone as same as hydrogenated natural rubber (HNR), thus
giving to the corresponding TPVs good heat and ozone resistance.
Due to the process of dynamic vulcanization used, the production
of TPVs has been carried out under high temperature (melt tem-
perature of plastic). Natural rubber (NR) can be degraded under
high temperature due to the unsaturation of C]C double bonds
within the isoprene backbone. Hydrogenation of natural rubber
helps to improve the thermal and oxidative stability, since the
radical-susceptive C]C bonds are replaced by saturated CeC
bonds. With almost complete saturation, the backbone structure of
natural rubber is changed from cis-1,4-polyisoprene to an
* Corresponding author. Institut des Mol�ecules et des Mat�eriaux du Mans, IMMM
eUMR CNRS 6283, Universit�e du Maine, Le Mans 72085 France.
E-mail address: [email protected] (P. Daniel).1 Permanent address. Department of Rubber Technology and Polymer Science,
Faculty of Science and Technology, Prince of Songkla University, Pattani Campus,
94000 Thailand.
Contents lists available at ScienceDirect
Polymer Testing
journal homepage: www.elsevier .com/locate/polytest
http://dx.doi.org/10.1016/j.polymertesting.2016.11.016
0142-9418/© 2016 Elsevier Ltd. All rights reserved.
Polymer Testing 57 (2017) 107e114

alternating ethylene-propylene copolymer. Therefore, the ther-
moplastic vulcanizates (TPVs) based on blends of hydrogenated
natural rubber (HNR) and polypropylene (PP) were investigated.
Hydrogenated natural rubber (HNR) was prepared by the chemical
modification of natural rubber via non-catalytic hydrogenation
reaction.
Raman mapping techniques can characterize distribution of
polymer components in multiphase systems. Actually Raman
spectroscopy provides the potential of fast determinationwith little
or no sample preparation and also without the classical use of
stains or dyes samples [1,2]. Moreover, Raman spectroscopy has the
advantage to produce a strong signal especially in systemswith non
polar bonds like for instance C]C bond in the case of NR [2].
Additionally Raman spectroscopy is a non-destructive method and
a fingerprint technique.
Numerous studies have been done on the Raman mapping of
multilayer polymer blends based on polystyrene, polypropylene
and poly (styrene-ethylene/propylene) diblock copolymer [4], IR/
HNBR blends [5], PET/HDPE polymer blends [6], polypropylene/
polyethylene blends [7], thin film of thermoplastic olefin (TPO) of
chlorinated Polyolefin (CPO), ethylene-propylene rubber (EPR) and
polypropylene (PP) [8], polypropene/polyethene/ethene-
propenecopolymer, polybutyleneterephthalate/polycarbonate/low
density polyethene, and styrene-co-acrylonitrile/styrene-co-mal-
eicanhydrate/poly-2,6-dimethylphenylene oxide [9], polystyrene/
micro-diamonds composite (PS/C) [10].
However, thermoplastic vulcanizates based on hydrogenated
natural rubber/polypropylene blends investigated by Raman spec-
troscopy such as Raman mapping, with calculation of blends ratio,
determination of particle size of cross-linked rubber phase
dispersed in the thermoplastic vulcanizates (TPVs), has not yet
been reported up to our knowledge.
In this work, Raman spectroscopy and Raman mapping were
used (1) to characterize the structure of the blends TPEs and TPVs in
the 50/50 content ratio, (2) to study the rubber and plastic phase
distribution also in the 50/50 content ratio for both blends TPEs and
TPVs (3) to determine the content ratio of polypropylene (PP) and
natural rubber (NR), hydrogenate natural rubber (65%HNR) in the
blends for different ratio contents and finally (4) to calculate the
phase size of cross-linked rubber phase dispersed in the thermo-
plastic vulcanizates (TPVs).
2. Experimental
2.1. Materials
Natural rubber latex (NRL) with 60% dry rubber content (DRC)
was purchased from Yala latex Co. Yala, Thailand. Hydrogenated
natural rubber (HNR) with a degree of hydrogenation equal to 65%
was prepared by using hydrazine monohydrate (N2H4$H2O) (the
assay is 35%, commercial grade, Lanxess Deutschland Gmbh, Ger-
many) and hydrogen peroxide (H2O2) (the assay is 50%, standard,
Thai peroxide co. ltd. Thailand) via non-catalytic hydrogenation.
Polypropylene was obtained from HP500N, Homopolymer, Lyon-
dell Basell co. USA.
The chemicals for the vulcanization were purchased according
to the following: sulfur (vulcanizing agent, Siam Chemicals Co. Ltd.
Thailand), Stearic acid (activator, Imperial Chemical Co. Ltd.
Thailand), Zinc oxide (activator, Global Chemical Co. Ltd. Thailand),
Tetramethylthiuram disulfide (TMTD) (accelerator or as a sulfur
donor, Flexsys Co. Ltd. Belgium), 2-mercaptobenzothaiazole (MBT)
(accelerator, Flexsys American LP Co. Ltd. USA), Dicumyl peroxide
(DCP) (curing agent, Wuzhou International Co. Ltd. China), Triallyl
cyanurate (TAC) (co-agent, Fluka Chemie, Buchs, Switzerland).
2.2. Preparation of thermoplastic elastomers and thermoplastic
vulcanizates
For the preparation of TPEs and TPVs, the grade of PP which was
used is characterized by a melt flow rate of 12 g/10 min at 230 �Cunder 2.16 kg load. Additionally the average molecular weight of
this PP grade has been reported in literature to be in the range of
2.38 � 105ee2.60 � 105 g/mol and polydispersity in the range of
3.3e6.9 [11e14]. The degree of crystallinity of PP HP500N, used in
this work, has been previously reported and calculated according to
the classical relation:
%cC ¼ DHf
.
DH0f
where DHf is an enthalpy of fusion of PP crystals and DH0f is the
enthalpy of fusion of 100% crystalline PP. These values were then
reported in literature to be 45.4%e46.3% and 57.4e58.7% [15e18]
depending of the value of DH0f used in calculation [19,20].
Note that the blending process probably induce a decreasing in
the percentage of crystallinity as it was observed in other blends
like PP-thermoplastic polyurethane [18], PP-polyolefine elastomer
[21], or also PP-chloroprene rubber [22].
Then for preparing thermoplastic elastomers (TPEs), PP was
melt for 3 min in the internal mixer before adding rubber. Two
polymers were mixed in the internal mixer (fill factor ¼ 0.8) until
the constant torque is obtained. Themixing time for each batch was
10min at a constant rotor speed of 80 rpm. The temperature setting
of the mixer is 180 �C. For the blends without chemicals, they were
removed immediately from the mixer and passed through the two-
roll mill to get sheets.
The preparation of NR and HNR compounds was performed
using an internal mixer (fill factor ¼ 0.8). The mixing was per-
formed at room temperature (30 �C) and at a constant rotor speed
of 60 rpm. NR and HNR were masticated for 2 min and then the
chemicals were added. The mixing time for each batch tooks
10 min.
For the vulcanization process peroxide or sulfur were used. The
formulation used for the preparation of the rubber compounds is
given in Table 1.
For preparing thermoplastic vulcanizates (TPVs), PP was melt
for 3 min in the internal mixer before adding rubber compounds.
The temperature setting of the mixer is 180 �C. Two polymers were
mixed in the internal mixer (fill factor ¼ 0.8) until the constant
torque is obtained. The mixing time for each batch took 10min. The
TPVs were removed immediately from the mixer and passed
through the two-roll mill to get sheets. TPEs and TPVs samples
were pressed for 5 min in a compression molding press at a tem-
perature of 190 �C and at a pressure of 12.5 MPa. Subsequently, the
samples were cooled down under pressure to room temperature.
Note that considering the sample preparation method, where
compression molding was used with very low shear rate, together
with a 1e2 mm samples thickness, a skin-core effect can't be
observed.
2.3. Raman spectroscopy and Raman mapping
In this study, Raman spectra of the samples were recorded with
a Xplora-Horiba spectrometer. The experiment was performed at
room temperature under microscope (Olympus BX 40) using a long
distance work objective with a magnification�50. The simple
spectrograph was adjusted with a 1200 lines per mm grating. The
samples were illuminated with a laser light at 785 nm. The fre-
quency range studied was 400e3500 cm�1 with 50 accumulations
and an acquisition time of 2 s per spectrum. The lateral resolution is
K. Taksapattanakul et al. / Polymer Testing 57 (2017) 107e114108

depending of the entrance slit (100 mm in our case), the selected
objective and the grating. Then Raman mapping in this study was
recorded by means of scanning a sample surface (10 � 10 mm2) by
step size of 0.9 mm in both X- and Y-axes (point to point), which is
lower than the lateral resolution in these conditions. The confocal
pinhole conjugated to microscope was adjusted to 500 mm in this
experiment and gives the depth resolution which can be estimated
in these conditions to 1 mm. Labspec 6 software (from Horiba) was
used to operate the mapping system and record the spectral data.
Because Raman scattering is not only qualitative technique but
can bring quantitative information, the content ratio of NR/PP and
65%HNR/PP blends can be calculated using Eq. (1), Eq. (2) as
following:
PP content ð%Þ ¼h�
Ið813�846Þ
�.�Ið813�846Þ þ Ið1434�1664Þ
�ix100
(1)
Table 1
Formulation of the rubber compounds, TPEs and TPVs preparation.
Ingredients TPEs TPVs
Peroxide cure Sulfur cure
NR (phra) - 100 100
HNR (phra) - 100 100
DCP (phra) - 1.0 -
TAC (phra) - 0.6 -
Sulfur (phra) - - 1.50
TMTD (phra) - - 0.65
MBT (phra) - - 0.40
Zinc oxide (phra) - - 5.00
Stearic acid (phra) - - 1.00
NR/PP (wt/wt%) 50/50 70/30, 60/40, 50/50, 40/60 70/30, 60/40, 50/50, 40/60
HNR/PP (wt/wt%)
a phr, parts per hundred of rubber by weight.
Fig. 1. Raman spectra of polymer: (a) polypropylene (PP, HP500N), (b) natural rubber
(NR), (c) hydrogenated natural rubber (HNR) at 65% HNR.
Fig. 2. Raman spectrum and Raman mapping of TPEs based on (a) NR/PP, (b) 65%HNR/PP. All containing 50 wt% rubbers, Raman mapping: PP phase (blue) and rubber phase (red).
(For interpretation of the references to colour in this figure legend, the reader is referred to the web version of this article.)
K. Taksapattanakul et al. / Polymer Testing 57 (2017) 107e114 109

NR or 65 %HNR content ð%Þ ¼h�
Ið1434�1664Þ
�.
��Ið813�846ÞþIð1434�1664Þ
�ix100
(2)
where I(813-846) are the integrated intensities of the Raman spectra
peaks of PP phase at 813-846 cm�1, I(1434-1664) are the integrated
intensities of the Raman spectra peaks of NR or HNR phase at 1434-
1664 cm�1.
2.4. Scanning electron microscopy (SEM)
The samples were taken from the tensile dumbbell test. The
samples were frozen in liquid nitrogen and fractured. The dispersed
rubber phase was extracted using toluene for 120 h and stirred at
room temperature. The dry samples were coated with gold. Jeol
(JSM-6510LV) scanning electronmicroscopy was used and operated
at 15 kV.
Fig. 3. Raman spectrum and Raman mapping of TPVs (peroxide cure) based on (a) NR/PP, (b) 65%HNR/PP. All containing 50 wt% rubbers, Raman mapping: PP phase (blue) and
rubber phase (red). (For interpretation of the references to colour in this figure legend, the reader is referred to the web version of this article.)
Fig. 4. Raman spectrum and Raman mapping of TPVs (sulfur cure) based on (a) NR/PP, (b) 65%HNR/PP. All containing 50 wt% rubbers, Raman mapping: PP phase (blue) and rubber
phase (red). (For interpretation of the references to colour in this figure legend, the reader is referred to the web version of this article.)
K. Taksapattanakul et al. / Polymer Testing 57 (2017) 107e114110

2.5. Phase size analysis
The phase sizes of cross-linked rubber phase dispersed in the
thermoplastic vulcanizates (TPVs) were calculated by using Raman
mapping and compared with scanning electron microscopy. For
Raman mapping, ImageJ software (Open source image processing
program designed for scientific multidimensional images) was
used to calculate the phase size [23,24].
3. Results and discussion
3.1. Raman spectrum of pure polymer
In order to have spectral reference [25e30], it was firstly
recorded Raman scattering for the natural rubber (NR), hydroge-
nated natural rubber (65%HNR), polypropylene (PP, HP500N). Re-
sults are exhibited in Fig. 1.
Polypropylene was clearly characterized by Raman spectros-
copy. The spectra of PP contain some well-known group fre-
quencies (involving CH2, CH3 groups). Fig. 1 shows that
polypropylene (PP) was clearly characterized by bands at 813 cm�1
and at 846 cm�1 corresponding to the CH2 (rocking) and CH3
(rocking) respectively.
Raman spectra of natural rubber (NR) show in particular the
typical band at 1664 cm�1 corresponding to the stretching of the
C]C double bond. Logically intensity of this band decreased in the
hydrogenated natural rubber (65%HNR). Reversely the scattering at
1334 cm�1, which is attributed to the CH3 sym bending, and the one
at 1452 cm�1 which is CH2 twisting, increase in the hydrogenated
natural rubber (65%HNR).
3.2. Morphology characterization by raman mapping and SEM for
50/50 polymers blends
This part of the study was focused on one type of blend with a
content ratio of 50/50. As a consequence of the good knowledge of
the reference spectra of pure compounds, the characteristic Raman
peaks at 1434e1664 cm�1 for natural rubber (NR) and hydroge-
nated natural rubber (65%HNR), at 813-846 cm�1 for polypropylene
(PP) can be used to identify phase component in their blends as
illustrated in Figs. 2e4. By comparison between Fig. 2 and Figs. 3e4,
it is evidently observed that the Raman spectra look different be-
tween two components of TPEs and TPVs and are identifiable as NR,
65%HNR, and PP phase component in the TPEs and TPVs.
Fig. 5. SEM images of TPEs based on (a) NR/PP, (b) 65%HNR/PP (magnification: 500�) and TPVs based on (c, e) NR/PP, (d, f) 65%HNR/PP (magnification: 1,800�) by peroxide cure
[(c), (d)] and sulfur cure [(e), (f)]. All containing 50 wt% rubbers, rubber phase (dark hole).
K. Taksapattanakul et al. / Polymer Testing 57 (2017) 107e114 111

The Ramanmapping of the distribution of the phase component
for this typical 50/50 ratio in the TPEs and TPVs is shown in also
shown Figs. 2e4 (a,b). The images were built considering the in-
tensities of typical Raman lines of each component, namely: (i) the
813-846 cm�1 range (in blue on the figure), which represent
characteristic Raman peaks of PP phase, and (ii) at 1434-1664 cm�1
(in red in the figure), which represent characteristic the Raman
peaks of NR or 65%HNR phase, for NR/PP, 65%HNR/PP blends.
From Fig. 2 (a, b), at the surface of these blends, it appears that
NR/PP, 65%HNR/PP blends seem to be a continuous rubber phase
(red) morphology in the PP matrix (blue) of the thermoplastic
elastomers (TPEs). This result is confirmed by using SEM as shown
in Fig. 5 (a, b). Actually the morphology of rubber phase (dark hole)
seems to be a continuous phase in the PP matrix of thermoplastic
elastomers. In this TPEs case, the blend systemwas nonreactive and
phase inversion phenomenon [31] not occurred. Also, after pro-
cessing in the internal mixing with relatively high mixing intensity,
there is no change in the continuous morphology type. The non-
cross-linked elastomer phase could be deformed further by the
application of shear stresses, but the continuous morphology re-
mains unchanged.
For TPVs of both peroxide and sulfur cure, it was shown that a
fine dispersion of cross-linked rubber phase (red) was generated in
a continuous matrix of PP (blue), as shown in Figs. 3e4 (a, b). This
morphology is also obtained by using SEM, then it was shown that
the cross-linked rubber phase (dark hole) was dispersed in a
continuous matrix of PP, as shown in Fig. 5(cef).
These results can be compared to the work of Furukawa et al.
[32] who studied the morphology of polyethylene (PE) and poly-
propylene (PP) blends by using Raman mapping where they espe-
cially investigate the Raman mapping of the metallocene
polyethylene (MEPE)/polypropylene (PP) blends and show the
dispersion of each component in polymer blends.
In this TPVs case, the cross-linking reaction in the rubber phase
is initiated and phase inversion phenomenonwas occurred. Harrats
et al. [31] studied the morphology transformation during the dy-
namic vulcanization of polymer blends. It was found that the co-
continuous of rubber-thermoplastic blends for TPEs before cross-
linked and shows that after phase inversion, the cross-linked rub-
ber dispersed in thermoplastic matrix for TPVs. Thus, the
morphology of the TPEs and TPVs were obtained by using Raman
spectroscopy, Raman mapping and compared with SEM technique.
It is then proved that Raman spectroscopy and Raman mapping
could be used to study the morphology of the TPEs and TPVs.
Consequently this study was done in fixed conditions for some
parameters like temperature, time, etc … and their effect on the
distribution and size of PP and Rubber phases was not investigated.
Actually as previously mentioned the main goal of this work was
dedicated to the usefulness of the Raman spectroscopy for such
blends. Note that the effect of these parameters was previously
Fig. 6. Raman spectrum of TPVs (peroxide cure) based on (1) NR/PP, (2) 65%HNR/PP and TPVs (sulfur cure) based on (3) NR/PP, (4) 65%HNR/PP. The blends ratio of TPVs at (a) 70/30
(wt/wt%), (b) 60/40 (wt/wt%), (c) 50/50 (wt/wt%), (d) 40/60 (wt/wt%).
K. Taksapattanakul et al. / Polymer Testing 57 (2017) 107e114112

reported in vulcanized thermoplastic elastomer recently [33,34].
3.3. Determination of the blends ratio by raman spectroscopy
In addition to the previous study dedicated to one type of blend
different ratio contents between NR or 65%HNR, and PP content in
the TPVs of both peroxide cure and sulfur cure were confirmed by
using Raman spectra of TPVs. As previously mentioned the content
ratio of NR/PP and 65%HNR/PP blends were calculated using Eq. (1)
and Eq. (2). The Raman spectra of NR/PP and 65%HNR/PP of TPVs
are shown in Fig. 6(1e4) and Raman mapping in Figs. 7e8. It was
found that the increase in the PP content and the increase in the
rubber content in the TPVs led respectively to an increase in the
scattering at 813-846 cm�1 for PP and an increase in the absorption
at 1434-1664 cm�1 for natural rubber (NR) and hydrogenated
natural rubber (65%HNR) in their blends. As a comparison of con-
tent ratio (Table 2) between calculations method and Raman
spectra, it was established that Raman spectroscopy can be used as
a reference method to calculate the content ratio in their blends.
The nominal concentrations are then fully confirmed.
3.4. Phase size analysis by raman mapping and SEM method
The phase size of cross-linked rubber phase dispersed in matrix
PP phase of both peroxide cure and sulfur cure in TPVs was calcu-
lated by using Raman mapping method and compared with SEM
method. The range size for phase diameter in cross-linked rubbers
was estimated from 0.32 to 3.64 mm by using Raman mapping
method and 0.35e1.29 mm diameter by using SEM method. As also
noticed by Markwort and Kip [9] who studied the morphology of
three other ternary polymer blends by confocal laser line scanning
Raman imaging technique, it is found that the heterogeneities in
composition and morphology are on a rather large scale equal to or
larger than 1 mm. In most cases, fully cross-linked rubbers of
0.5e3.0 mm diameter were dispersed in thermoplastic matrix.
Moreover, the phase size was obtained by using Raman mapping
method and SEM method. It was shown a linear data correlation
between both methods with a correlation coefficient value (R2)
within the range 0.93e0.97. Thus, Ramanmapping could be used to
calculate the phase size of cross-linked rubber phase dispersed in
matrix PP phase in TPVs. The difference of maximum phase size of
cross-linked rubber phase in TPVs was calculated by using Raman
mapping method and SEM method, it may be due to (1) the se-
lection of position test on the samples test, (2) cross-linked rubber
phase dispersed in the TPVs could not be control and it's random to
disperse in PP matrix of TPVs and (3) the effect of sample prepa-
ration for testing, in which the Raman mapping method did not
sample preparation. For SEM method, the samples were frozen in
liquid nitrogen and fractured, and the dispersed cross-linked rub-
ber phase was extracted.
4. Conclusion
Raman spectroscopy and especially mapping configuration
appear to be a powerful technique for the characterization and the
study of morphology of polymer blends. The Raman spectra of two
components in the blends were identifiable as NR, 65%HNR, PP
Fig. 7. Raman mapping of the blends ratio at 70/30 (wt/wt%) (Left column), at 40/60
(wt/wt%) (Right column) of TPVs (peroxide cure) based on (a) NR/PP, (b) 65%HNR/PP:
[PP phase (blue), rubber phase (red)]. (For interpretation of the references to colour in
this figure legend, the reader is referred to the web version of this article.)
Fig. 8. Raman mapping of the blends ratio at 70/30 (wt/wt%) (Left column), at 40/60
(wt/wt%) (Right column) of TPVs (sulfur cure) based on (a) NR/PP, (b) 65%HNR/PP: [PP
phase (blue), rubber phase (red)]. (For interpretation of the references to colour in this
figure legend, the reader is referred to the web version of this article.)
Table 2
Content ratio of TPVs based on NR/PP, 65%HNR/PP blends.
Samples Calculated content ratio (wt/
wt%)
Experimental content ratio
obtained with Raman data
(%)
Peroxide cure Sulfur cure Peroxide cure Sulfur cure
NR/PP 70/30 70/30 72/28 69/31
60/40 60/40 64/36 64/36
50/50 50/50 52/48 51/49
40/60 40/60 44/56 41/59
65%HNR/PP 70/30 70/30 69/31 72/28
60/40 60/40 59/41 64/36
50/50 50/50 48/52 51/49
40/60 40/60 39/61 42/58
K. Taksapattanakul et al. / Polymer Testing 57 (2017) 107e114 113

phase component. Due to the contrast between two components in
each blends, the blends compositions in the thermoplastic elasto-
mers (TPEs) and thermoplastic vulcanizates (TPVs) could be
determined. Raman mapping was shown that the phase
morphology of NR/PP, 65%HNR/PP, were characterized as contin-
uous rubber phase morphology of the thermoplastic elastomers
(TPEs) and a fine dispersion of cross-linked rubber phase in a
continuous matrix of the thermoplastic vulcanizates (TPVs). The
morphology of TPEs and TPVs obtained by Raman spectroscopy,
were compared with SEM with consistent results. Additionally a
comparison between nominal content ratio and calculated ratio
using Raman are fully consistent and shows that this vibrational
spectroscopy could be used to calculate the content ratio in the
TPVs. Moreover, Raman mapping could be used to calculate the
phase size of cross-linked rubber phase dispersed in thermoplastic
vulcanizates (TPVs).
References
[1] F.R. Costa, N.K. Dutta, N.R. Choudhury, A.K. Bhowmick, Current Topics in
Elastomers Research: Chapter 5-thermoplastic Elastomers, CRC Press, 2008.[2] L.R. Lewis, H.G.M. Edwards, Handbook of Raman Spectroscopy: from the
Research Laboratory to the Process Line, CRC Press, 2001.[3] J.M. Chalmers, R.J. Meier, Molecular Characterization and Analysis of Polymers,
Elsevier, 2008.[4] Y.J. Lee, D. Moon, B.K. Migler, M.T. Cicerone, Quantitative image analysis of
broadband CARS hyperspectral images of polymer blends, Anal. Chem. 83 (7)
(2011) 2733e2739.[5] W. Smitthipong, R. Gadiou, L. Vidal, P. Wagner, M. Nardin, 3D Raman images
of rubber blends (IR-HNBR), Vib. Spectrosc. 46 (1) (2008) 8e13.[6] S. Huan, W. Lin, H. Sato, H. Yang, J. Jiang, Y. Ozaki, H. Wu, G. Shen, R. Yu, Direct
characterization of phase behavior and compatibility in PET/HDPE polymer
blends by confocal Raman mapping, J. Raman Spectrosc. 38 (3) (2007)260e270.
[7] P. Schmidt, J. Dybal, J. Scudla, M. Raab, J. Kratochvil, Structure of poly-propylene/polyethylene blends assessed by polarised PA-FTIR spectroscopy,
polarised FT Raman spectroscopy and confocal Raman microscopy, Macromol.Symp. 184 (2002) 107e122.
[8] H.R. Morris, J.F. Turner, B. Munro, R.A. Ryntz, P.J. Treado, Chemical imaging of
thermoplastic olefin (TPO) surface architecture, Langmuir 15 (1999)2961e2972.
[9] L. Markwort, B. Kip, Micro-raman imaging of heterogeneous polymer systems:General applications and limitations, J. Appl. Polym. Sci. 61 (2) (1996)
231e254.
[10] M. Pastorczak, M. Wiatrowski, M. Lodzinski, U. Ulanski, Confocal Raman mi-croscopy in 3-dimensional shape and composition determination of hetero-
geneous systems, J. Mol. Struct. 744 (SI) (2005) 997e1003.[11] M. Khalil, P. H�ebraud, A. Mcheik, H. Mortada, H. Lakis, T. Hamieh, Elongational
flow-induced crystallization in polypropylene/talc nanocomposites, Phys.
Procedia 55 (2014) 259e264.[12] M. Yousfi, S. Livi, J. Duchet-Rumeau, Ionic Liq. A new way Compat. Thermo-
plast. blends, 255, 2014, pp. 513e524.[13] M. Yousfi, S. Livi, A. Dumas, J. Crepin-Leblond, M. Greenhill-Hooper, J. Duchet-
Rumeau, Compatibilization of polypropylene/polyamide 6 blends using newsynthetic nanosized talc fillers: morphology, thermal, and mechanical prop-
erties, J. Appl. Polym. Sci. 131 (13) (2014), http://dx.doi.org/10.1002/
app.40453.[14] B. Fiorentino, R. Fulchiron, V. Bounor-Legare, J.C. Majeste, J.C. Leblond,
J. Duchet-Rumeau, Chemical modification routes of synthetic talc: Influenceon its nucleating power and on its dispersion state, Appl. Clay Sci. 109 (2015)
107e118.
[15] C.Z. Liao, H.M. Wong, K.W.K. Yeung, S.C. Tjong, The development, fabrication,
and material characterization of polypropylene composites reinforced withcarbon nanofiber and hydroxyapatite nanorod hybrid fillers, Int. J. Nano-
medicine 9 (2014) 1299e1310, http://dx.doi.org/10.2147/IJN.S58332.[16] Z. Lin, Z. Guan, Z. Zhang, K. Mai, The effect of thermal history of polyamide 6
on the crystallization and melting behavior of beta-nucleated polypropylene/
polyamide 6 blends, Thermochim. Acta 543 (2012) 59e65, http://dx.doi.org/10.1016/j.tca.2012.05.003.
[17] Y. Chen, C. Xu, L. Cao, Y. Wang, X. Cao, PP/EPDM-based dynamically vulcanizedthermoplastic olefin with zinc dimethacrylate: Preparation, rheology,
morphology, crystallization and mechanical properties, Polym. Test. 31 (6)(2012) 728e736, http://dx.doi.org/10.1016/j.polymertesting.2012.05.010.
[18] E.G. Bajsic, V.O. Bulatovic, V. Rek, The influence of filler treatment on the
properties of TPU/PP Blends: I. Thermal properties and stability, Polym. Eng.Sci. 55 (8) (2015) 1920e1930, http://dx.doi.org/10.1002/pen.24033.
[19] B. Wunderlich, B. Macromolecular Physics, vol. 3, Academic Press, New York,1980, p. 63.
[20] L. Mandelkern, R. Alamo, Thermodynamic quantities governing melting, in:
J.E. Mark (Ed.), Physical Properties of Polymer Handbook, second ed., Springer,New York, 2007, pp. 165e186.
[21] G.Y. Liu, G.X. Qiu, Study on the mechanical and morphological properties oftoughened polypropylene blends for automobile bumpers, Polym. Bull. 70 (3)
(2013) 849e857, http://dx.doi.org/10.1007/s00289-012-0880-1.
[22] H. Salmah, B.N. Azra, M.D. Yusrina, H. Ismail, A comparative study of poly-propylene/(chloroprene rubber) and (recycled polypropylene)/(chloroprene
rubber) blends, J. Vinyl Addit. Technol. 21 (2) (2015) 122e127, http://dx.doi.org/10.1002/vnl.21390.
[23] C. Igathinathane, L.O. Pordesimo, E.P. Columbus, W.D. Batchelor, S.R. Methuku,J. Shape identification and particles size distribution from basic shape pa-
rameters using Image, Comput. Electron. Agric. 63 (2) (2008) 168e182.
[24] D. Greaves, J. Boxall, J. Mulligan, A. Montesi, J. Creek, E.D. Sloan, C.A. Koh,Measuring the particle size of a known distribution using the focused beam
reflectance measurement technique, Chem. Engeenering Sci. 63 (22) (2008)5410e5419.
[25] E. Andreassen, Polypropylene: An A-Z, Kluwer Publishers, Dordrecht, 1999.
[26] P.J. Hendra, K.D.O. Jackson, Applications of Raman-spectroscopy to the anal-ysis of natural-rubber, Spectrochim. Acta 50 (11) (1994) 1987e1997.
[27] A.M. Healey, P.J. Hendra, Y.D. West, A Fourier-transform Raman study of thestrain-induced crystallization and cold crystallization of natural rubber,
Polymer 30 (18) (1996) 4009e4024.[28] K.D.O. Jackson, M.J.R. Loadman, C.H. Jones, G. Ellis, Fourier-transform Raman
spectroscopy of elastomers - an overview, Spectrochim. Acta 64 (2) (1990)
217e226.[29] S.J. Bunce, H.G.M. Edwards, A.F. Johnson, I.R. Lewis, P.H. Turner, Synthetic
polyisoprenes studies by Fourier-transform Raman-spectroscopy, Spec-trochim. Acta 49 (5e6) (1993) 775e783.
[30] J. Samran, P. Phinyocheep, P. Daniel, D. Derouet, J.Y. Buzare, Raman spectro-
scopic study of non-catalytic hydrogenation of unsaturated rubbers, J. RamanSpectrosc. 35 (12) (2004) 1073e1080.
[31] C. Harrats, S. Thomas, G. Groeninckx, H.J. Radusch, Phase Morphology ofDynamically Vulcanized Thermoplastic Vulcanizates. Micro-and Nano-
structured Multiphase Polymer Blend Systems: Phase Morphology and In-terfaces, CRC Press, 2005.
[32] T. Furukawa, H. Sato, Y. Kita, K. Matsukawa, H. Yamaguchi, S. Ochiai,
H.W. Siesler, Y. Ozaki, Molecular structure, crystallinity and morphology ofpolyethylene/polypropylene blends studied by Raman mapping, scanning
electron microscopy, wide angle X-Ray diffraction, and differential scanningcalorimetry, Polym. J. 38 (2006) 1127e1136.
[33] S. Shahbikian, P.J, Plasticization and morphology development in dynamically
vulcanized thermoplastic elastomers (Chapter 3), in: C.K. Das (Ed.), Thermo-plastic Elastomers e Synthesis and Applications, Intech, 2015, p. 2015.
[34] H. Wu, M. Tian, L. Zhang, H. Tian, Y. Wu, N. Ning, T.W. Chan, New under-standing of morphology evolution of thermoplastic vulcanizate (TPV) during
dynamic vulcanization, ACS Sustain. Chem. Eng. 3 (1) (2015) 26e32, http://dx.doi.org/10.1021/sc500391g.
K. Taksapattanakul et al. / Polymer Testing 57 (2017) 107e114114

145
APPENDICES
APPENDIX C
Curriculum Vitae
146
Mr. Korn Taksapattanakul
Student ID: 5520330101
Tel.: +669-18472196
E-mail: [email protected]
1. Education Background:
- Bachelor of Science: Physics (second class honors) (2005 – 2009)
Division of Physics, Department of Science, Faculty of Science and
Technology, Prince of Songkla University, Pattani, Thailand
GPA: 3.35
Thesis: Mechanical property of EPDM/PP blend carbon fibers reinforced
Advisor: Mr. Somchai Kopoonpat
- Master of Science: Polymer Physics (2009 – 2011)
Division of Physics, Department of Science, Faculty of Science and
Technology Prince of Songkla University, Pattani, Thailand
GPA: 3.51
Thesis: Compression properties of natural rubber – asphalt – aggregated
blends
Advisor: Associate Professor Dr. Sombat Puttajukr
Co-advisor: Assistant Professor Dr. Thoranit Navarat
2. Scholarships and Prize:
- Human resource development in science project (Science Achievement
Scholarship of Thailand, SAST) (B.Sc, M.Sc. – Ph.D.)
- Highest mark in Physics, Science, Prince of Songkla University, by Prof. Dr.
TAB Foundation, 2009.
- The financial support from Prince of Songkla University graduate thesis grant
for Ph.D. research.

147
3. Apprenticeship:
- March-May, 2008, Apprentice in R&D section, The National Metal and
Materials Technology Center (MTEC), National Science and Technology
Development Agency (NSTDA), Pathum Thani, Thailand
4. List of Presentations:
- Chelae, F., and Kopoonpat, S. “Mechanical property of EPDM/PP Blend carbon
fibers reinforced”, The 4th
Conference on Science and Technology for Youth,
Bangkok international trade and exhibition centre, Bangkok, Thailand on 20 –
21 March 2009. (Oral presentation)
- Chelae, F., Puttajukr, S., and Navarat, T. “Compression Properties of Natural
Rubber – Asphalt - Aggregate blends”, The 6th
Conference on Science and
Technology for Youth, Bangkok international trade and exhibition centre,
Bangkok, Thailand on 18 – 19 March 2011. (Oral presentation)
- Taksapattanakul, K., Tulyapitak, T., Phinyocheep, P., and Ruamcharoen, P. “In
situ Hydrogenation of Natural Rubber from Oxidation, Reaction of
Hydrazine Monohydrate (N2H4 .H2O) by Hydrogen Peroxide (H2O2 )”, The 8th
Conference on Science and Technology for Youth, Bangkok international trade
and exhibition centre, Bangkok, Thailand on 22 – 23 March 2013. (Oral
presentation)
- Taksapattanakul, K., Tulyapitak, T., Phinyocheep, P., Ruamcharoen, P.,
Ruamcharoen, J., and Daniel, P. “Hydrogenated natural rubber (HNR) as a
potential replacement for ethylene – propylene – diene – monomer (EPDM)
rubber”, The 6th
Sci-Tech Grad Symposium 2016, Faculty of Science and
Technology, Prince of Songkla University. Pattani, Thailand, on 23 May 2016.
(Oral presentation)
- Korn Taksapattanakul, Tulyapong Tulyapitak, Pranee Phinyocheep, Polphat
Ruamcharoen, Jareerat Ruamcharoen and Phillippe Daniel. “Rheological
properties of hydrogenated natural rubber”, The International Rubber
Conference 2016, Kitakyushu, Japan on 24-28 October 2016. (Oral
presentation)

148
5. List of Publications:
- Chelae, F., Puttajukr, S., and Navarat, T. 2011. Compression Properties of
Natural Rubber – Asphalt – Aggregate blends. The Proceedings of the 6th
Conference on Science and Technology for Youths: 2011. 132 – 142.
- Taksapattanakul, K., Tulyapitak, T., Phinyocheep, P., and Ruamcharoen, P.
2013. In situ Hydrogenation of Natural Rubber from Oxidation, Reaction
of Hydrazine Monohydrate (N2H4 .H2O) by Hydrogen Peroxide (H2O2 ). The
Proceedings of the 8th
Conference on Science and Technology for Youths: 2013.
94 – 102.
- Korn Taksapattanakul, Tulyapong Tulyapitak, Pranee Phinyocheep, Polphat
Ruamcharoen, Jareerat Ruamcharoen and Phillippe Daniel. Rheological
properties of hydrogenated natural rubber. The proceedings of IRC 2016
Kitakyushu, Japan
- Korn Taksapattanakul, Tulyapong Tulyapitak, Pranee Phinyocheep, Polphat
Ruamcharoen, Jareerat Ruamcharoen, Fabienne Lagarde, Mathieu Edely,
Philippe Daniel. Raman investigation of thermoplastic vulcanizates based on
hydrogenated natural rubber/polypropylene blends. Polymer Testing, Volume
57, February 2017, Pages 107–114.
6. Extra-curricular activities:
- The 4th
Human Resource Development in Science Project (Science
Achievement Scholarship of Thailand ,SAST) of Science Camp, 23-25 October
2008, Faculty of Science, Mahidol University, Thailand
- The 4th
Conference on Science and Technology for Youth, Bangkok
international trade and exhibition centre, Bangkok, Thailand, on 20 – 21 March
2009
- The 6th
Conference on Science and Technology for Youth, Bangkok
international trade and exhibition centre, Bangkok, Thailand, on 18 – 19 March
2011

149
- The 1st Human Resource Development in Science Project (Science Achievement
Scholarship of Thailand ,SAST) of Graduate Camp, 16-17 May 2013, Asia
Hotel, Phayathai Road Ratchathewi, Bangkok, Thailand
- The 8th
Conference on Science and Technology for Youth, Bangkok
international trade and exhibition centre, Bangkok, Thailand, on 22 – 23 March
2013
- The 6th
Sci-Tech Grad Symposium 2016, Faculty of Science and Technology,
Prince of Songkla University. Pattani, Thailand, on 23May 2016
- Taksapattanakul, K., Tulyapitak, T., Phinyocheep, P., Ruamcharoen, P.,
Ruamcharoen, J., and Daniel, P. “Hydrogenated natural rubber (HNR) as a
potential replacement for ethylene – propylene – diene – monomer (EPDM)
rubber”, TechnoBiz Communications Co., Ltd. (TechnoBiz) and China United
Rubber Corporation (CURC) jointly organizing 3rd
Edition of GRTE 2016 -
Global Rubber, Latex & Tire Expo 2016 during 9-11 March 2016 at Bangkok
International Trade & Exhibition Center (BITEC) in Bangkok, Thailand. (Poster
Presentation)

Thermoplastic Vulcanizates Based on Hydrogenated Natural Rubber/Polypropylene Blends
Etude et caractérisation de thermoplastiques vulcanisés à base de caoutchouc naturel hydrogéné et de polypropylène
korn TAKSAPATTANAKUL
Résumé
L'préparation du caoutchouc naturel hydrogéné (HNR) par réaction avec
l'hydrazine et le peroxyde d'hydrogène et le latex de caoutchouc naturel a
été intéressée. L’influence de conditions de réaction, types et volume de
solvants, volume du réactionnel, l'quantité d’hydrazine et de peroxyde
d’hydrogène sur le degré d’hydrogénation du caoutchouc naturel a été
étudiée. Le structure et détermination du degré d’hydrogénation des
caoutchoucs naturel hydrogénés a été analysée par résonance
magnétique nucléaire (RMN), transformée de fourier infrarouge (FTIR) et
spectroscopie Raman. Un degré d'hydrogénation de 18 % a été obtenu à
1.0 - 2.0 du la molaire de d’hydrazine et de peroxyde d’hydrogène,
température optimale de 50°C et le temps de réaction de 24h. Afin
d'améliorer le degré d'hydrogénation, des solvants tels que l'toluène et le
hexane et l'effet de le volume du réactionnel ont été étudiée, ce qui a
permis d'obtenir des degrés d’hydrogénation élevés (proches de 65%
avec le toluène). D’autre part, des mesures de tailles de particules de latex
ont montré que l’hydrogénation du caoutchouc naturel n’avait pas d’effet
sur latex de caoutchouc naturel. Un résultat également intéressant
concerne le détermination du taux de gel. Ce gel augmente avec le degré
d’hydrogénation, prouvant que des réactions de réticulation ont eu lieu.
Néanmoins aucun effet de degré d’hydrogénation sur le température de
transition vitreuse n’est détecté. L’dureté et viscosités Mooney
augmentent, en lien avec l’augmentation du taux de gel. Par ailleurs,
l'résistance thermique du caoutchouc naturel hydrogéné est
considérablement améliorée lorsque le degré d’hydrogénation augmente.
Le partie suivante est consacrée à l'vulcanisation du caoutchouc. Deux
types de réticulation ont été utilisés : au soufre et au peroxyde. Les
élastomères HNR réticulés montrent une meilleure résistance à l’ozone et
l’UV que le NR réticulé. De plus, cette résistance à l’ozone et l’UV est plus
élevée pour le réticulation au soufre, comparée à le réticulation au
peroxyde. Une bonne corrélation entre les images de microscopie optique
et les résultats des analyses Raman est obtenue. L'préparation et l’étude
de mélanges HNR/PP obtenus par vulcanisation dynamique en utilisant du
peroxyde et du soufre comme agents de réticulation. Un degré
d’hydrogénation de 65% a été choisi, et différentes ratio HNR/PP ont été
étudiés, et comparés avec des mélanges NR/PP. L'morphologie des
mélanges a été caractérisée par spectroscopie Raman, ce qui a permis
d’obtenir des images cartographie Raman indiquant de façon précise le
localisation et l'distribution des phases de caoutchouc et de PP. Une
bonne corrélation entre le cartographie Raman et les images de
microscopie électronique à balayage (SEM) est obtenue. Ainsi il apparaît
que les particules de caoutchouc sont dispersées dans une phase
continue de PP, ceci à la fois pour le HNR et le NR. L’étude des propriétés
mécaniques a montré que celles-ci étaient gouvernées principalement par
le phase continue de PP.
Mots clés
Non-catalytique l’hydrogénation, caoutchouc naturel hydrogéné, spectroscopie Raman, thermoplastiques vulcanisés
Abstract
The non-catalytic hydrogenation of natural rubber latex (NRL) was carried out by using diimide generated in situ from the reaction between hydrazine (N
2H
4) and hydrogen peroxide (H
2O
2). The effects of mole ratios of [C=C]:
[N2H
4]:[H
2O
2], reaction conditions, solvent types, solvent volumes and
reaction scale-up on the hydrogenation levels were investigated. Nuclear magnetic resonance (NMR), Fourier transform infrared (FTIR), and Raman spectroscopic techniques were employed to investigate the chemical structure of the hydrogenated natural rubber (HNRs) and to quantify the hydrogenation levels. It was found that variations in moles of N
2H
4 and H
2O
2
in the range of 1.0-2.0 moles resulted in degrees of hydrogenation in the range of 10-18%. Little improvement in hydrogenation levels of HNRs was obtained when NRL particles were swollen in solvents by which toluene yielded better results than hexane. The increase in toluene volume resultedin the increase in hydrogenation levels up to 42 %. TEM micrographs revealed that swelling mainly occurred at the surface of NRL particles, implying that hydrogenation reaction confined largely at the surface of NRL particles. After removal of toluene, particle size and particle size distribution of partially hydrogenated NRL remained unchanged. To further improve degrees of hydrogenation, the reaction volume was extended and 65% hydrogenation levels were obtained. Therefore, 14%HNR, 33%HNR, and 65%HNR were successfully prepared under suitable reaction conditions. However, crosslinking and cis-trans isomerization were side-reactions occurring during hydrogenation. Gel and trans contents increased with increasing hydrogenation levels, leading to the increase in hardness of HNRs. Mooney viscosities of HNRs increased with increasing degrees of hydrogenation due to the increased gel contents. Mooney torque relaxation of NR and HNRs were similar. Thermogravimetric analysis revealed that HNRs had greater thermal stability than NR and thermal stability increased with increasing degrees of hydrogenation. HNR vulcanizates were much better resistant to ozone and UV than cured NR. Sulfur-vulcanized rubbers had greater ozone resistance than peroxide-cure rubbers due to less amounts of carbon-carbon double bonds present in rubbers. In addition, modulus at low strain and tensile strength of sulfur-cured rubbers were higher than those of peroxide-cured rubbers, but lower elongation due tohigher crosslink densities. Also, modulus at low strain and tensile strength increased with increasing hydrogenation levels of HNRs, in contrast to strainat break. Thermoplastic vulcanizates (TPVs) from blends of HNR and Polypropylene (PP) were prepared via dynamic vulcanization using peroxideand sulfur as curing agents. The effects of blend ratios on mechanical properties of TPVs were investigated. Tensile strength increased with increasing PP portions, but breaking strain decreased. Morphology of TPVs was characterized with Raman mapping and scanning electron microscope (SEM). The phase sizes of crosslinked rubber obtained from both techniques were correlated well.
Key Words
Non-catalytic hydrogenation, Hydrogenated natural rubber, Raman spectroscopy, Thermoplastic vulcanizates
L'Université Bretagne Loire