aus swap rate volatility db 10.15.13.pdf
TRANSCRIPT

8/14/2019 AUS Swap Rate Volatility DB 10.15.13.pdf
http://slidepdf.com/reader/full/aus-swap-rate-volatility-db-101513pdf 1/11
Deutsche BankMarkets Research
Australia Data FlashRatesGov. Bonds & SwapsRates Volatility
Date16 October 2013
Australia - RV Monthly
________________________________________________________________________________________________________________
Deutsche Bank AG/Sydney
DISCLOSURES AND ANALYST CERTIFICATIONS ARE LOCATED IN APPENDIX 1. MICA(P) 054/04/2013.
Ken Crompton
Strategist
(+61) 2 8258-1361
Cross currency basis and a funding crisisAUD/USD basis swap spreads have trended mostly sideways over the past month.Three of the four major Australian banks are currently in an informal issuanceblackout period before release of their results later in October. Historically thebasis has tended to narrow during the blackout.
We look at the impact of previous US fiscal crises on the AUD/USD basis swapspread market. Based on history, the debt ceiling and potential default, rather thanthe government shutdown, is the more important event in our view. Historicallythe AUD/USD basis swap spread market has moved at a much lower beta thanoffshore markets during funding stress events.
Overall, we remain biased toward being received the basis at the present time.
Bringing carry back – AUD front end’s bearish turnThe AUD front end has steepened as rates have sold off and carry trades are backon the radar of many investors.
The 9Y node of the Australian curve stands as somewhat rich on the rollingforward curve.
The steepening of the AUD front end has taken some box spreads against the USswap curve to historical extremes. In particular we highlight the AUD/USD spot 1Y / 2Y*1Y box which has widened by more than 30bp in the past three weeks.
Capturing carry via conditionalityAUD swaption gamma vol has fallen sharply over the past month. Implied vol stilltends to be somewhat rich to realised volatility at shorter maturities but to a much
lesser extent than a month ago.
We note that in July/August 2011 when the US was last approaching its debtceiling and then suffered a credit rating downgrade, gamma volatility in Australiaquickly doubled. A significant catalyst for that vol spike was that pricing forchanges to the cash rate over the next twelve months moved by 150bp in a shortperiod of time. With the cash rate now at 2.50% we don’t think front end ratescan move as far as they did in 2011 and nor do we think that implied vol will moveas far. But this assumes a default is eventually avoided.
US default risk notwithstanding, at present we like trades which can capture thecarry offered by the recent selloff in Australian rates. In particular we like ratioreceivers on the 2Y*2Y rate, which can capture rolldown of the relatively steep volsurface. Alternatively, a 1Y*1Y receiver can be funded by a 1Y*10Y strangle for anet zero cost trade. Key risk to the ratio receiver is an extremely large rally, whilstthe long receiver / short strangle position can incur potentially unlimited losses inthe event of a large move in 10Y rates.
8/14/2019 AUS Swap Rate Volatility DB 10.15.13.pdf
http://slidepdf.com/reader/full/aus-swap-rate-volatility-db-101513pdf 2/11
16 October 2013
Data Flash: Australia - RV Monthly
Page 2 Deutsche Bank AG/Sydney
Cross currency basis and a funding crisis
AUD/USD basis swap spreads have trended mostly
sideways over the past month.
Three of the four major Australian banks arecurrently in an informal issuance blackout period
before release of their results later in October.
Historically the basis has tended to narrow during
the blackout.
We look at the impact of previous US fiscal crises
on the AUD/USD basis swap spread market.
Based on history, the debt ceiling and potential
default, rather than the government shutdown, is
the more important event in our view. Historically
the AUD/USD basis swap spread market has
moved at a much lower beta than offshore markets
during funding stress events.
Overall, we remain biased toward being receivedthe basis at the present time.
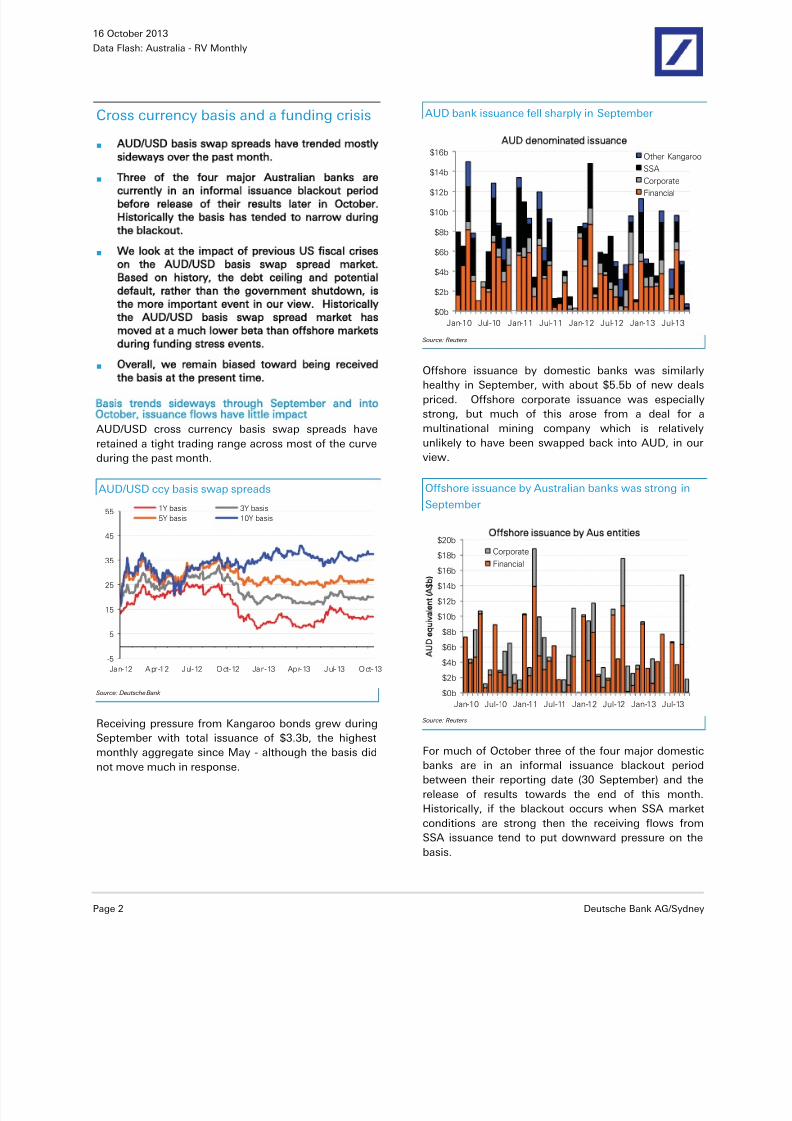
Basis trends sideways through September and intoOctober, issuance flows have little impact
AUD/USD cross currency basis swap spreads have
retained a tight trading range across most of the curve
during the past month.
AUD/USD ccy basis swap spreads
-5
5
15
25
35
45
55
Jan-12 Apr -12 Jul-12 Oct-12 Jan-13 Apr-13 Jul-13 Oct-13
1Y basis 3Y basis
5Y basis 10Y basis
Source: Deutsche Bank
Receiving pressure from Kangaroo bonds grew during
September with total issuance of $3.3b, the highestmonthly aggregate since May - although the basis did
not move much in response.
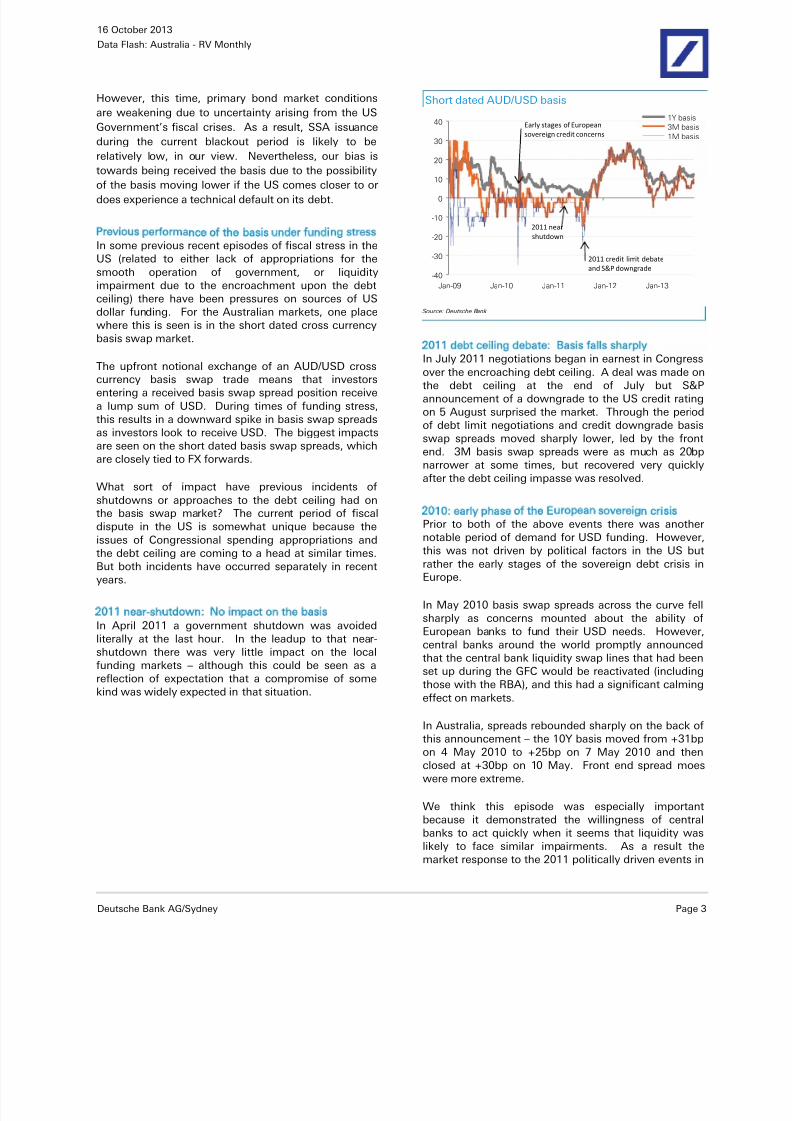
AUD bank issuance fell sharply in September
$0b
$2b
$4b
$6b
$8b
$10b
$12b
$14b
$16b
Jan-10 Jul-10 Jan-11 Jul-11 Jan-12 Jul-12 Jan-13 Jul-13
UD denominated issuance
Other Kangaroo
SSA
CorporateFinancial
Source: Reuters
Offshore issuance by domestic banks was similarlyhealthy in September, with about $5.5b of new deals
priced. Offshore corporate issuance was especially
strong, but much of this arose from a deal for a
multinational mining company which is relatively
unlikely to have been swapped back into AUD, in our
view.
Offshore issuance by Australian banks was strong in
September
$0b
$2b
$4b
$6b
$8b
$10b
$12b
$14b
$16b
$18b
$20b
Jan-10 Jul-10 Jan-11 Jul-11 Jan-12 Jul-12 Jan-13 Jul-13
A
e
v
e
A
Offshore issuance by us entities
CorporateFinancial
Source: Reuters
For much of October three of the four major domestic
banks are in an informal issuance blackout period
between their reporting date (30 September) and the
release of results towards the end of this month.
Historically, if the blackout occurs when SSA market
conditions are strong then the receiving flows from
SSA issuance tend to put downward pressure on the
basis.
8/14/2019 AUS Swap Rate Volatility DB 10.15.13.pdf
http://slidepdf.com/reader/full/aus-swap-rate-volatility-db-101513pdf 3/11
16 October 2013
Data Flash: Australia - RV Monthly
Deutsche Bank AG/Sydney Page 3
However, this time, primary bond market conditions
are weakening due to uncertainty arising from the US
Government’s fiscal crises. As a result, SSA issuance
during the current blackout period is likely to be
relatively low, in our view. Nevertheless, our bias is
towards being received the basis due to the possibility
of the basis moving lower if the US comes closer to ordoes experience a technical default on its debt.
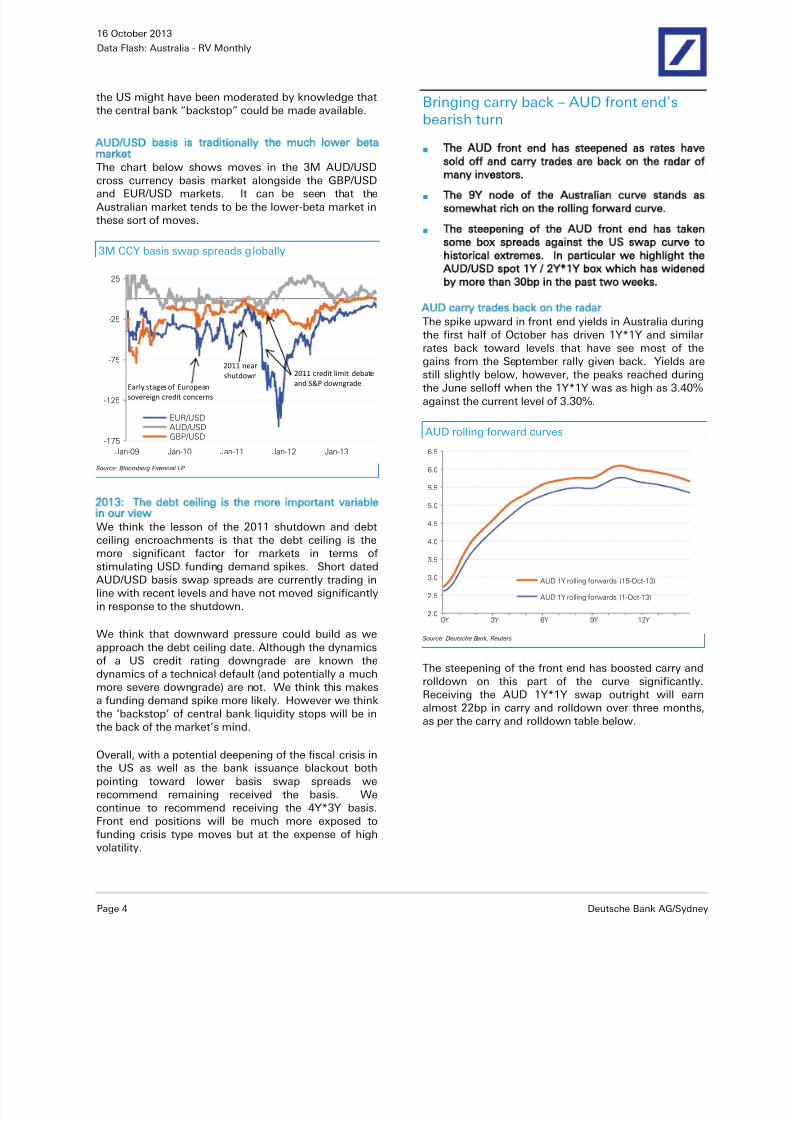
Previous performance of the basis under funding stressIn some previous recent episodes of fiscal stress in theUS (related to either lack of appropriations for thesmooth operation of government, or liquidityimpairment due to the encroachment upon the debtceiling) there have been pressures on sources of USdollar funding. For the Australian markets, one placewhere this is seen is in the short dated cross currencybasis swap market.
The upfront notional exchange of an AUD/USD crosscurrency basis swap trade means that investorsentering a received basis swap spread position receivea lump sum of USD. During times of funding stress,this results in a downward spike in basis swap spreadsas investors look to receive USD. The biggest impactsare seen on the short dated basis swap spreads, whichare closely tied to FX forwards.
What sort of impact have previous incidents ofshutdowns or approaches to the debt ceiling had onthe basis swap market? The current period of fiscaldispute in the US is somewhat unique because theissues of Congressional spending appropriations and
the debt ceiling are coming to a head at similar times.But both incidents have occurred separately in recentyears.
2011 near-shutdown: No impact on the basisIn April 2011 a government shutdown was avoidedliterally at the last hour. In the leadup to that near-shutdown there was very little impact on the localfunding markets – although this could be seen as areflection of expectation that a compromise of somekind was widely expected in that situation.
Short dated AUD/USD basis
-40
-30
-20
-10
0
10
20
30
40
Jan-09 Jan-10 Jan-11 Jan-12 Jan-13
1Y basis
3M basis
1M basis
2011 credit limit debate
and S&P downgrade
Early stages of European
sovereign credit concerns
2011 near
shutdown
Source: Deutsche Bank
2011 debt ceiling debate: Basis falls sharplyIn July 2011 negotiations began in earnest in Congress
over the encroaching debt ceiling. A deal was made onthe debt ceiling at the end of July but S&Pannouncement of a downgrade to the US credit ratingon 5 August surprised the market. Through the periodof debt limit negotiations and credit downgrade basisswap spreads moved sharply lower, led by the frontend. 3M basis swap spreads were as much as 20bpnarrower at some times, but recovered very quicklyafter the debt ceiling impasse was resolved.
2010: early phase of the European sovereign crisisPrior to both of the above events there was anothernotable period of demand for USD funding. However,
this was not driven by political factors in the US butrather the early stages of the sovereign debt crisis inEurope.
In May 2010 basis swap spreads across the curve fellsharply as concerns mounted about the ability ofEuropean banks to fund their USD needs. However,central banks around the world promptly announcedthat the central bank liquidity swap lines that had beenset up during the GFC would be reactivated (includingthose with the RBA), and this had a significant calmingeffect on markets.
In Australia, spreads rebounded sharply on the back of
this announcement – the 10Y basis moved from +31bpon 4 May 2010 to +25bp on 7 May 2010 and thenclosed at +30bp on 10 May. Front end spread moeswere more extreme.
We think this episode was especially importantbecause it demonstrated the willingness of centralbanks to act quickly when it seems that liquidity waslikely to face similar impairments. As a result themarket response to the 2011 politically driven events in
8/14/2019 AUS Swap Rate Volatility DB 10.15.13.pdf
http://slidepdf.com/reader/full/aus-swap-rate-volatility-db-101513pdf 4/11
16 October 2013
Data Flash: Australia - RV Monthly
Page 4 Deutsche Bank AG/Sydney
the US might have been moderated by knowledge thatthe central bank “backstop” could be made available.
AUD/USD basis is traditionally the much lower betamarketThe chart below shows moves in the 3M AUD/USD
cross currency basis market alongside the GBP/USDand EUR/USD markets. It can be seen that theAustralian market tends to be the lower-beta market inthese sort of moves.
3M CCY basis swap spreads globally
-175
-125
-75
-25
25
Jan-09 Jan-10 Jan-11 Jan-12 Jan-13
EUR/USDAUD/USDGBP/USD
Early stages of European
sovereign credit concerns
2011 nearshutdown 2011 credit limit debate
and S&P downgrade
Source: Bloomberg Financial LP
2013: The debt ceiling is the more important variablein our viewWe think the lesson of the 2011 shutdown and debtceiling encroachments is that the debt ceiling is the
more significant factor for markets in terms ofstimulating USD funding demand spikes. Short datedAUD/USD basis swap spreads are currently trading inline with recent levels and have not moved significantlyin response to the shutdown.
We think that downward pressure could build as weapproach the debt ceiling date. Although the dynamicsof a US credit rating downgrade are known thedynamics of a technical default (and potentially a muchmore severe downgrade) are not. We think this makesa funding demand spike more likely. However we thinkthe ‘backstop’ of central bank liquidity stops will be inthe back of the market’s mind.
Overall, with a potential deepening of the fiscal crisis inthe US as well as the bank issuance blackout bothpointing toward lower basis swap spreads werecommend remaining received the basis. Wecontinue to recommend receiving the 4Y*3Y basis.Front end positions will be much more exposed tofunding crisis type moves but at the expense of highvolatility.
Bringing carry back – AUD front end’sbearish turn
The AUD front end has steepened as rates have
sold off and carry trades are back on the radar of
many investors.
The 9Y node of the Australian curve stands as
somewhat rich on the rolling forward curve.
The steepening of the AUD front end has taken
some box spreads against the US swap curve to
historical extremes. In particular we highlight the
AUD/USD spot 1Y / 2Y*1Y box which has widened
by more than 30bp in the past two weeks.
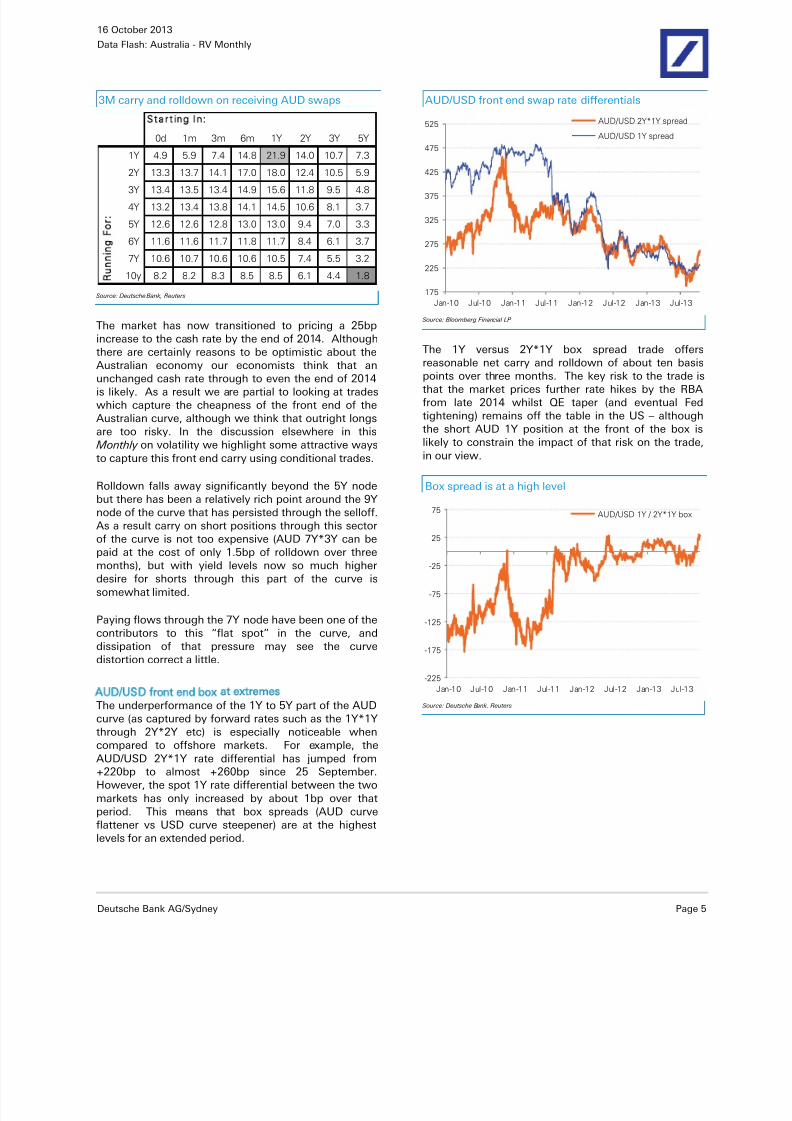
AUD carry trades back on the radarThe spike upward in front end yields in Australia duringthe first half of October has driven 1Y*1Y and similarrates back toward levels that have see most of thegains from the September rally given back. Yields arestill slightly below, however, the peaks reached duringthe June selloff when the 1Y*1Y was as high as 3.40%against the current level of 3.30%.
AUD rolling forward curves
2.0
2.5
3.0
3.5
4.0
4.5
5.0
5.5
6.0
6.5
0Y 3Y 6Y 9Y 12Y
AUD 1Y rolling forwards (15-Oct-13)
AUD 1Y rolling forwards (1-Oct-13)
Source: Deutsche Bank, Reuters
The steepening of the front end has boosted carry androlldown on this part of the curve significantly.Receiving the AUD 1Y*1Y swap outright will earnalmost 22bp in carry and rolldown over three months,as per the carry and rolldown table below.
8/14/2019 AUS Swap Rate Volatility DB 10.15.13.pdf
http://slidepdf.com/reader/full/aus-swap-rate-volatility-db-101513pdf 5/11
16 October 2013
Data Flash: Australia - RV Monthly
Deutsche Bank AG/Sydney Page 5
3M carry and rolldown on receiving AUD swaps
0d 1m 3m 6m 1Y 2Y 3Y 5Y
1Y 4.9 5.9 7.4 14.8 21.9 14.0 10.7 7.3
2Y 13.3 13.7 14.1 17.0 18.0 12.4 10.5 5.9
3Y 13.4 13.5 13.4 14.9 15.6 11.8 9.5 4.8
4Y 13.2 13.4 13.8 14.1 14.5 10.6 8.1 3.7
5Y 12.6 12.6 12.8 13.0 13.0 9.4 7.0 3.3
6Y 11.6 11.6 11.7 11.8 11.7 8.4 6.1 3.7
7Y 10.6 10.7 10.6 10.6 10.5 7.4 5.5 3.2
10y 8.2 8.2 8.3 8.5 8.5 6.1 4.4 1.8R
n
F
S t a r t i n g I n
Source: Deutsche Bank, Reuters
The market has now transitioned to pricing a 25bpincrease to the cash rate by the end of 2014. Althoughthere are certainly reasons to be optimistic about the
Australian economy our economists think that anunchanged cash rate through to even the end of 2014is likely. As a result we are partial to looking at tradeswhich capture the cheapness of the front end of theAustralian curve, although we think that outright longsare too risky. In the discussion elsewhere in this Monthly on volatility we highlight some attractive waysto capture this front end carry using conditional trades.
Rolldown falls away significantly beyond the 5Y nodebut there has been a relatively rich point around the 9Ynode of the curve that has persisted through the selloff.As a result carry on short positions through this sectorof the curve is not too expensive (AUD 7Y*3Y can be
paid at the cost of only 1.5bp of rolldown over threemonths), but with yield levels now so much higherdesire for shorts through this part of the curve issomewhat limited.
Paying flows through the 7Y node have been one of thecontributors to this “flat spot” in the curve, anddissipation of that pressure may see the curvedistortion correct a little.
AUD/USD front end box at extremesThe underperformance of the 1Y to 5Y part of the AUDcurve (as captured by forward rates such as the 1Y*1Y
through 2Y*2Y etc) is especially noticeable whencompared to offshore markets. For example, theAUD/USD 2Y*1Y rate differential has jumped from+220bp to almost +260bp since 25 September.However, the spot 1Y rate differential between the twomarkets has only increased by about 1bp over thatperiod. This means that box spreads (AUD curveflattener vs USD curve steepener) are at the highestlevels for an extended period.
AUD/USD front end swap rate differentials
175
225
275
325
375
425
475
525
Jan-10 Jul-10 Jan-11 Jul-11 Jan-12 Jul-12 Jan-13 Jul-13
AUD/USD 2Y*1Y spread
AUD/USD 1Y spread
Source: Bloomberg Financial LP
The 1Y versus 2Y*1Y box spread trade offers
reasonable net carry and rolldown of about ten basispoints over three months. The key risk to the trade isthat the market prices further rate hikes by the RBAfrom late 2014 whilst QE taper (and eventual Fedtightening) remains off the table in the US – althoughthe short AUD 1Y position at the front of the box islikely to constrain the impact of that risk on the trade,in our view.
Box spread is at a high level
-225
-175
-125
-75
-25
25
75
Jan-10 Jul-10 Jan-11 Jul-11 Jan-12 Jul-12 Jan-13 Jul-13
AUD/USD 1Y / 2Y*1Y box
Source: Deutsche Bank, Reuters

8/14/2019 AUS Swap Rate Volatility DB 10.15.13.pdf
http://slidepdf.com/reader/full/aus-swap-rate-volatility-db-101513pdf 6/11
16 October 2013
Data Flash: Australia - RV Monthly
Page 6 Deutsche Bank AG/Sydney
Capturing carry via conditionality
AUD swaption gamma vol has fallen over the past
month. Implied vol still tends to be somewhat rich
to realised volatility at shorter maturities but to a
much lesser extent than a month ago.
We note that in July/August 2011 when the US
was last approaching its debt ceiling and then
suffered a credit rating downgrade, gamma
volatility in Australia quickly doubled. A significant
catalyst for that vol spike was that pricing for
changes to the cash rate over the next twelve
months moved by 150bp in a short period of time.
With the cash rate now at 2.50 we don’t think
front end rates can move as far as they did in 2011
and nor do we think that implied vol will move as
far. But this assumes a default is eventually
avoided.
US default risk notwithstanding, at present we like
trades which can capture the carry offered by therecent selloff in Australian rates. In particular we
like ratio receivers on the 2Y*2Y rate, which can
capture rolldown of the relatively steep vol surface.
Alternatively, a 1Y*1Y receiver can be funded by a
1Y*10Y strangle for a net zero cost trade. Key risk
to the ratio receiver is an extremely large rally,
whilst the long receiver / short strangle position
can incur potentially unlimited losses in the event
of a large move in 10Y rates.
Gamma vol declines
AUD gamma vol has declined significantly over the
past month, led by falls of as much as 25% in upper
left corner vols. In comparison, vega vol has been
stable, with longer maturity vols moving very little.
AUD gamma (DGX) and vega (DVX) implied vol indices
(annual bp)
70
80
90
100
110
120
130
140
150
160
Jan-11 Jun-11 Nov-11 Apr-12 Sep-12 Feb-13 Jul-13
AUD DGX
AUD DVX
Realised volatility over the whole curve has declinedover the past month, albeit somewhat erratically. Ingeneral, the premium for implied vol relative to realisedvol has fallen the furthest in the gamma part of the
surface, although outside of 5Y+ maturity swaptions(which are generally the most illiquid parts of thesurface) implied vol still tends to look somewhat richimplied vol (ie realised/implied vol ratio less than 1.0).
Realised/implied vol ratios
Real/
Imp1Y 2Y 3Y 4Y 5Y 7Y 10Y
1M 95% 84% 86% 85% 84% 81% 81%
2M 91% 90% 90% 88% 86% 83% 83%
3M 8 9% 91% 91% 90% 87% 84% 84%
6M 9 6% 98% 94% 92% 89% 86% 87%
1Y 93% 99% 94% 93% 90% 89% 91%
2Y 108% 99% 98% 96% 97% 96% 98%
3Y 92% 93% 94% 98% 99% 104% 105%
5Y 10 3% 110 % 110 % 114 % 12 0% 12 0% 12 5%
7Y 111% 117 % 12 5% 12 7% 12 7% 13 2% 13 2%
10Y 12 7% 13 0% 13 7% 14 3% 14 5% 14 0% 13 3%
Source: Deutsche Bank, Reuters
Where does implied vol go in a crisis?
During the July/August 2011 US debt ceiling debate
and credit rating downgrade, implied gamma volatility
in Australia almost doubled over a very short period of
time (see the earlier chart of DGX and DVX indices).
Implied vol doubled around the time of the US credit
rating downgrade in 2011
0
20
40
60
80
100
120
140
160
180
-250
-200
-150
-100
-50
0
50
100
150
200
250
Oct-08 Oct-09 Oct-10 Oct-11 Oct-12 Oct-13
Cash rate / 12th IB slope
AUD DGX vol index (RHS)
US downgrade
Source: Deutsche Bank, Reuters
At present, the bill strip is pricing a full rate hike by the
end of 2014 – very similar to what was being priced
just ahead of the 2011 volatility spike. Implied gamma
volatility is also at a relatively similar level. Could front
end pricing swing as rapidly as did in 2011, and see vol
spike as sharply?
One significant factor in the increase in impliedvolatility during that period was that expectations of

8/14/2019 AUS Swap Rate Volatility DB 10.15.13.pdf
http://slidepdf.com/reader/full/aus-swap-rate-volatility-db-101513pdf 7/11
16 October 2013
Data Flash: Australia - RV Monthly
Deutsche Bank AG/Sydney Page 7
RBA activity in the short term were changing very fast.The cash rate had been set at 4.75% since November2010 and for most of the time leading up to the creditrating downgrade the market had been expecting thenext move to be a further rate increase. When pricingfor cash rate changes turned around by more than150bp in the space of a few weeks, a doubling ofimplied volatility was a proportionate response to theamount of front end pricing.
At present, the RBA cash rate is now 225bp lower than
it was in August 2011 and the RBA has been easing
rates steadily for nearly two years. There is not as
much “headroom” left in the market for pricing
aggressive easing from the current levels. Additionally,
outside of a possible technical default by the US, the
global economy is on surer footing now than it was in
late 2011 and the domestic economy is showing signs
of responding to easier monetary policy.
USD gamma barely responded to the 2011 vol spike
0
50
100
150
200
250
Oct-08 Oct-09 Oct-10 Oct-11 Oct-12 Oct
AUD DGX USD DGX
US downgrade
Source: Deutsche Bank, Bloomberg Financial LP
Looking at the experience of USD volatility during that
period, gamma volatility largely trended sideways. The
proximity of the zero bound in US front end rates was
one reason that volatility was less likely to shift
dramatically to the upside in the US. Nevertheless, we
think the example is still somewhat useful for Australia
now that the RBA has its cash rate at the lowest ever
level since inflation targeting began.
Thus although we think there is scope for some
increase in volatility in the event of the US approaching
default we don’t expect to see, for example, our AUD
DGX index to nearly double as it did in 2011 in the
period of turmoil following the US credit rating
downgrade. However, this view is grounded in an
expectation that default is ultimately avoided. If default
does occur then this takes markets very much into an
area of “known unknowns” from where it is much
more difficult to anticipate the likely course of vol.
Aside from fiscal crisis pressures, we also think it is
important to note that the recent backup in yields has
increased carry in AUD swaps and we think this is
likely to draw some demand for AUD volatility via OTMreceiver type structures – however we do not expect to
see large increases in volatility from this source alone.
We look to capture carry and rolldown of both theswap and vol surfacesAssuming that we are looking at a solution to the USdebt ceiling which does not result in meaningful USdefault we prefer trades which can capture the steepvol surface and carry on the curve.
We think that the selloff in yields makes receiverspread trades attractive; in particular we like zero cost
ratio receivers on the 2Y*1Y rate (2x1 ratio, strikesATMF and ATMF-63bp), which will capture rolldown ofthe steep vol surface. An aggressive rally would be arisk to a ratio receiver trade but if the US situation isresolved without default and rates sell off the positionwill not lose money.
2Y*1Y receiver spread rolls down the steep vol surface
0
1
2
3
4
5
6
7
8
0Y 2Y 4Y 6Y 8Y 10Y
waption maturity
AUD 1Y tenor
10-Apr-13
10-Sep-13
9-Oct-13
Source: Deutsche Bank, Bloomberg Financial LP
Alternatively, a receiver on the highest carrying part ofthe AUD swap curve – the 1Y*1Y rate – could befunded by selling a strangle on long end rates such asthe 1Y*10Y, taking advantage of the steepness alongthe tenor axis, whilst capturing rolldown along the
maturity axis (as the ratio receiver does).
A $100m ATMF 1Y*1Y receiver can be funded using a114bp wide $12m strangle on the 1Y*10Y swaption.The key risk to this trade is a significant movement inthe 10Y swap rate – a move of more than 57bp ineither direction would put the short strangle at a loss.

8/14/2019 AUS Swap Rate Volatility DB 10.15.13.pdf
http://slidepdf.com/reader/full/aus-swap-rate-volatility-db-101513pdf 8/11
8/14/2019 AUS Swap Rate Volatility DB 10.15.13.pdf
http://slidepdf.com/reader/full/aus-swap-rate-volatility-db-101513pdf 9/11
16 October 2013
Data Flash: Australia - RV Monthly
Deutsche Bank AG/Sydney Page 9
Appendix 1
Important Disclosures
Additional information available upon request
For disclosures pertaining to recommendations or estimates made on securities other than the primary subject of thisresearch, please see the most recently published company report or visit our global disclosure look-up page on ourwebsite at http://gm.db.com/ger/disclosure/DisclosureDirectory.eqsr
Analyst Certification
The views expressed in this report accurately reflect the personal views of the undersigned lead analyst(s). In addition,the undersigned lead analyst(s) has not and will not receive any compensation for providing a specific recommendationor view in this report. Ken Crompton

8/14/2019 AUS Swap Rate Volatility DB 10.15.13.pdf
http://slidepdf.com/reader/full/aus-swap-rate-volatility-db-101513pdf 10/11
16 October 2013
Data Flash: Australia - RV Monthly
Page 10 Deutsche Bank AG/Sydney
Regulatory Disclosures
1. Important Additional Conflict Disclosures
Aside from within this report, important conflict disclosures can also be found at https://gm.db.com/equities under the"Disclosures Lookup" and "Legal" tabs. Investors are strongly encouraged to review this information before investing.
2. Short-Term Trade IdeasDeutsche Bank equity research analysts sometimes have shorter-term trade ideas (known as SOLAR ideas) that areconsistent or inconsistent with Deutsche Bank's existing longer term ratings. These trade ideas can be found at theSOLAR link at http://gm.db.com.
3. Country-Specific Disclosures
Australia and New Zealand: This research, and any access to it, is intended only for "wholesale clients" within themeaning of the Australian Corporations Act and New Zealand Financial Advisors Act respectively.Brazil: The views expressed above accurately reflect personal views of the authors about the subject company(ies) andits(their) securities, including in relation to Deutsche Bank. The compensation of the equity research analyst(s) isindirectly affected by revenues deriving from the business and financial transactions of Deutsche Bank. In cases whereat least one Brazil based analyst (identified by a phone number starting with +55 country code) has taken part in thepreparation of this research report, the Brazil based analyst whose name appears first assumes primary responsibility for
its content from a Brazilian regulatory perspective and for its compliance with CVM Instruction # 483.EU countries: Disclosures relating to our obligations under MiFiD can be found athttp://www.globalmarkets.db.com/riskdisclosures.Japan: Disclosures under the Financial Instruments and Exchange Law: Company name - Deutsche Securities Inc.Registration number - Registered as a financial instruments dealer by the Head of the Kanto Local Finance Bureau(Kinsho) No. 117. Member of associations: JSDA, Type II Financial Instruments Firms Association, The Financial FuturesAssociation of Japan, Japan Investment Advisers Association. This report is not meant to solicit the purchase of specificfinancial instruments or related services. We may charge commissions and fees for certain categories of investmentadvice, products and services. Recommended investment strategies, products and services carry the risk of losses toprincipal and other losses as a result of changes in market and/or economic trends, and/or fluctuations in market value.Before deciding on the purchase of financial products and/or services, customers should carefully read the relevantdisclosures, prospectuses and other documentation. "Moody's", "Standard & Poor's", and "Fitch" mentioned in thisreport are not registered credit rating agencies in Japan unless "Japan" or "Nippon" is specifically designated in thename of the entity.Malaysia: Deutsche Bank AG and/or its affiliate(s) may maintain positions in the securities referred to herein and mayfrom time to time offer those securities for purchase or may have an interest to purchase such securities. Deutsche Bankmay engage in transactions in a manner inconsistent with the views discussed herein.Russia: This information, interpretation and opinions submitted herein are not in the context of, and do not constitute,any appraisal or evaluation activity requiring a license in the Russian Federation.
Risks to Fixed Income Positions
Macroeconomic fluctuations often account for most of the risks associated with exposures to instruments that promiseto pay fixed or variable interest rates. For an investor that is long fixed rate instruments (thus receiving these cashflows), increases in interest rates naturally lift the discount factors applied to the expected cash flows and thus cause aloss. The longer the maturity of a certain cash flow and the higher the move in the discount factor, the higher will be theloss. Upside surprises in inflation, fiscal funding needs, and FX depreciation rates are among the most common adversemacroeconomic shocks to receivers. But counterparty exposure, issuer creditworthiness, client segmentation, regulation(including changes in assets holding limits for different types of investors), changes in tax policies, currency
convertibility (which may constrain currency conversion, repatriation of profits and/or the liquidation of positions), andsettlement issues related to local clearing houses are also important risk factors to be considered. The sensitivity of fixedincome instruments to macroeconomic shocks may be mitigated by indexing the contracted cash flows to inflation, toFX depreciation, or to specified interest rates - these are common in emerging markets. It is important to note that theindex fixings may -- by construction -- lag or mis-measure the actual move in the underlying variables they are intendedto track. The choice of the proper fixing (or metric) is particularly important in swaps markets, where floating couponrates (i.e., coupons indexed to a typically short-dated interest rate reference index) are exchanged for fixed coupons. It isalso important to acknowledge that funding in a currency that differs from the currency in which the coupons to bereceived are denominated carries FX risk. Naturally, options on swaps (swaptions) also bear the risks typical to optionsin addition to the risks related to rates movements.
8/14/2019 AUS Swap Rate Volatility DB 10.15.13.pdf
http://slidepdf.com/reader/full/aus-swap-rate-volatility-db-101513pdf 11/11