augustine band of cahuilla indiansi executive summary the augustine band of cahuilla indians was...
TRANSCRIPT

AUGUSTINE BAND OF CAHUILLA INDIANS
ENERGY CONSERVATION AND DEVELOPMENT PROJECT-ENERGY OPTIONS ANALYSIS
AWARD NUMBER: DE-FG36-0XGO16018
FINAL REPORT
I Executive Summary
The Augustine Band of Cahuilla Indians was awarded a grant through the Department of Energy First Steps program in June of 2006. The primary purpose of the grant was to enable the Tribe to develop energy conservation policies and a strategy for alternative energy resource development. All of the work contemplated by the grant agreement has been completed and the Tribe has begun implementing the resource development strategy through the construction of a 1.0 MW grid-connected photovoltaic system designed to offset a portion of the energy demand generated by current and projected land uses on the Tribe’s Reservation. Implementation of proposed energy conservation policies will proceed more deliberately as the Tribe acquires economic development experience sufficient to evaluate more systematically the interrelationships between conservation and its economic development goals.
II Project Overview
The Department of Energy grant that is the subject of this report enabled the Augustine Band of Cahuilla Indians to establish the analytical and policy basis for the energy component of its economic development strategy. More particularly, the DOE grant permitted the Tribe to analyze various possible approaches to the development of a regulatory, policy and administrative framework for the Tribe that is designed to ensure that the development of the Tribe’s Reservation is accomplished with thorough attention to energy conservation and the development of alternative energy resources. We began the project with the assumption that economic development and alternative energy resource development were inherently competitive objectives, in the sense that to the extent one was emphasized, the other would suffer. As a consequence of this project, we have come to a more nuanced view, including the recognition that some forms of alternative energy resource development on the Tribe’s Reservation are both economically and environmentally sensible. In part, this change of perspective is the result of contemporaneous increases in conventional energy costs that have dramatically exceeded our forecasts from even a few years ago. Although we have not simply extrapolated recent trends to forecast the long-term economics of conservation and distributed energy production, a number of additional factors suggest that over the next few years, at least, the cost of electricity from conventional sources will continue to increase at rates above trend. Nevertheless, we believe that electricity cost forecasts are
fraught with difficulty, particularly when they extend over more than a few years. We therefore based our economic analysis on the assumption that grin-supplied electricity costs will increase at roughly the long-term trend rate.
In any case, the first step in the articulation of the Tribes economic development strategy was the preparation and adoption by the Tribal Council of a five-year development plan for the Reservation. The second step was the preparation of the Augustine Reservation Energy Feasibility Study, a preliminary evaluation of the feasibility of developing various kinds of alternative energy supplies on the Reservation, including solar, wind, biomass, geothermal and co-generation resources. The cost of these steps was borne by the Tribe from its own resources.
In the third stage of the project, the Tribe shifted its attention to reducing future demand for energy through conservation and to encouraging the development and use of alternative energy resources. It is this portion of the project that DOE has supported with both financial and technical assistance. To assist in this analysis, we have searched widely for ideas from other public and private agencies. Because there has been a great deal of thoughtful and creative work done by others governments and their advisors, our task was to discover the best of that work and to evaluate its appropriateness for application to the Reservation.
As with most alternative energy projects, it was important in this effort to take into account the characteristics of the local environment, including geophysical, meteorological, infrastructure and public policy variables. The most important of these are discussed below.
The Augustine Band’s Reservation includes approximately 502 acres of allotted and unallotted land. The Band also owns approximately 36 acres of contiguous non-trust land. It has developed a roughly 34,000 square foot casino and associated offices, storage, parking and other ancillary facilities on about 20 acres of the Reservation. The predominate land use in surrounding neighborhoods has, until recently, been agriculture, including grapes, citrus, melons, dates, nursery products, turf and vegetables. However, there has recently been a rapid conversion of agricultural land to more intensive uses, primarily suburban housing. A regional airport is located within a mile of the Reservation boundary. Nearby residential and related commercial development is expected to continue, albeit at a more moderate pace, for the foreseeable future.
The Coachella Valley, in which the Reservation is located, is an intense desert environment. It is located in the Sonoran Desert biome and within the rain shadow of the San Jacinto, San Gorgonio and Santa Rosa Mountains. The Desert is characterized by low moisture levels and precipitation that is infrequent and unpredictable. The low humidity results in comparatively wide temperature fluctuations. The Reservation is virtually flat and is entirely below sea level, with an average elevation of approximately -90 feet. The mean annual precipitation is about four inches, concentrated in the winter, although high intensity rainfall can occur during the summer monsoon season, sometimes resulting in flashfloods in areas near the Reservation.

During the winter, overnight temperatures in the 20-30ºF range are common. Summer temperatures are quite hot with daily maximums averaging in excess of 100º F and occasionally exceeding 120º F.
Windspeed measurements done for the Tribe suggest that there is not sufficient sustained wind energy to support a wind turbine generation system on the Reservation.
In general, the geophysical and meteorological environment suggested that solar development might be advantageous to the Tribe, although high daytime temperatures in the summer could be expected to degrade photovoltaic performance somewhat. The policy environment, particularly federal tax credits and State-prescribed rebates, have at least temporarily created a financing environment in which capital costs could be drastically reduced for deals structured to capture those benefits.
Both exceptionally high summer temperatures and wide differences between high and low temperatures also suggested to us that conservation should be a high priority. It would be fair to say that we began this project with the assumption that, in general, conservation would be more cost effective than the construction of new generating facilities of any kind. That assumption has been confirmed by our analysis.
The fourth step in the realization of the Tribe’s energy strategy was the design and development of a 1.0 MW photovoltaic system to provide a portion of the Reservation’s electricity needs. As of the date of this report, we have completed the recruitment process and have executed contracts with our development partner. Construction is expected to begin by August 1 and to be completed by November 15, 2008.
The fifth step in the strategy is proposed to be the adoption of energy conservation policies based on the International 2006 Energy Conservation Code of the International Code Council, Leadership in Energy and Environmental Design (LEED) standards and principles, and New Urbanism community design insights. Taken together, these concepts articulate a fairly comprehensive approach to resource-constrained development consistent with the Tribe’s long-term economic development objectives.
III Objectives
The initial objectives of this project were:
(1) evaluate the economic and technical feasibility of developing alternative energy resources;
(2) select one or two such alternatives for a detailed feasibility study; and
(3) develop energy conservation policies and practices.
Specific questions we wanted to answer through the work performed for this project included each of the following:
a) What energy conservation polices and administrative procedures have been adopted elsewhere and, among these, which are most likely to address the needs of the Tribe from the standpoint of economic feasibility, consistency

with economic development objectives of the Tribe, ease of administration, and effectiveness in reducing the energy demands of current and planned development on the Reservation?
b) What should be the form of the economic analysis used to select among alternative policies?
c) Among various sources of alternative energy, including solar, wind, geothermal, biomass and cogeneration, which are most likely to prove economically and technically feasible?
d) What are the anticipated energy needs of the Reservation? How does that affect the feasibility of alternative energy resource development?
e) If alternative energy resource development of any kind is undertaken by the Tribe, should it be centralized or distributed.
f) What external policies and conditions (such as net metering, anticipated conventional energy price increases, and equipment cost and availability, might affect the feasibility of alternative energy resource development?
g) What should be the process for selecting a vendor for the proposed PV system project if it proves feasible?
IV Description of Activities Performed
The following tasks have been accomplished to date:
1) Completion of the energy options analysis
The Tribe engaged the engineering consulting firm Sysska Hennessey to perform a coarse-grained evaluation of the Tribe’s alternative energy options. At the Tribe’s direction, Doug Price, Sysska Hennessey’s project manager for this project, evaluated generalized payback periods for biomass, wind, geothermal, solar hot water, photovoltaic and co-generation alternatives. He concluded that the last three of these were feasible, with payback periods of approximately 5 to 15 years, with cogeneration having the most rapid payback and PV the longest. His analysis estimated the Tribe’s future energy needs, based on the five-year development plan. His evaluation was conservative in the sense that we prescribed an assumption of 3 percent annual electricity and natural gas cost increases. In the three years since this report was published, electricity costs to the Tribe have increased by more than twice that rate.
2) Completion of the review of conservation policies of other agencies and organizations.
The Tribe’s economic development consultant, a partner on this project, evaluated 20 conservation policies of other public and private organizations, selected from among approximately 200 potential models. State and local governments were

the primary source of policies. Hospitals, schools, shopping centers, rental housing projects and other exemplars were also consulted with a view to permitting consideration of a wide variety of approaches.
3) Presentation of revised policy options to the Augustine Band for consideration and decisions.
Based on work products from the preceding tasks, the Tribe’s economic development consultant prepared a memorandum to the Tribal Chairperson outlining conservation and alternative energy development options and supporting policies for consideration by the Tribe.
4) Policy decision by Tribe to pursue photovoltaic option, with detailed project design contingent on engineering study and detailed economic analysis.
Based on the recommendations of its consultant, the Tribe decided to proceed with a detailed feasibility study of the photovoltaic option. The scope of work for this study included the evaluation of alternative photovoltaic technologies, including both new and proven systems and components. This analysis was helpfully informed by a good deal of input from the National Renewable Energy Laboratory (NREL) and Sandia National Laboratories.
5) Preliminary evaluation of selected equipment options for photovoltaics.
Once we had completed the general appraisal of options described above, we initiated conversations with vendors to explore the details of the capacity and efficiency of PV cells, systems and inverters. We also discussed conceptual costs without any engineering design. Using these inputs, we prepared rough pro forma estimates for 250,000 KW and 1.0 MW grid-tied systems, assuming no contributions from rebates, tax credits or green tags. This analysis suggested that among well-tested alternatives thin-film photovoltaic technology would be the most cost-effective.
6) Development of a conceptual schedule for photovoltaic plan implementation.
We then developed a conceptual schedule for development of a 1.0 MW system, assuming that tax credits would expire at the end of 2008 and that we could be under construction by June 1, 2008. The construction start date proved to be too optimistic by about 60 days.
7) Preparation of request for letters of interest from photovoltaic vendors.
To test the level of interest in our project among developers and vendors, we distributed a request for letters of interest to 23 solar companies that have a substantial presence in the U.S. We received responses from seven firms.

8) Preparation and publication of a Request for Proposals for an approximately 1 MW photovoltaic system to be constructed on the Augustine Reservation.
Our solicitation for system developers yielded three initial responses, of which one was deemed to be nonresponsive. We recruited one additional proposer following the initial review of proposals.
9) Conditional selection of vendor for exclusive negotiations for design and construction of an approximately 1 MW photovoltaic system.
Following an extensive review of proposals, including several rounds of requests for additional information,
At the time of this report, we have completed negotiations with our development partner on a ground lease, power purchase agreement and ancillary documents specifying the terms of our deal.
V Conclusions and Recommendations
To other tribes contemplating PV projects, we offer the following suggestions while recognizing that each project will have unique characteristics:
Use proven technologies. Early in the process we were tempted to install a system based on new concentrating, tracking modules that have been tested at more than 40 percent conversion efficiencies. However, we were unable to discover time series data beyond a few months for any such system. Thus, equipment performance degradation rates and operating expenses are not yet well-defined for these systems. It is accordingly difficult to estimate the long-term economics of such projects with much confidence.
Size the system based on both thoroughly characterized energy use patterns, both present and future, and public policy realities. In California, the administration of these policies vary somewhat depending on the utility service area in which a project is located, but generally the policies become less favorable for systems over 1.0 MW in size.
VI Lessons Learned
Many Tribes contemplating PV projects will have experience with more complicated real estate development projects. PV systems are straightforward to design and construct, although for grid-connected systems it is important to understand the requirements of the local utility. In California, important requirements include not only interconnection and net metering rules, but also the details of the applicable rebate program. The most formidable challenges in our project came during the negotiations for financing for the project. The interrelationships among the rules for rebates and tax credits with the Tribe’s objectives, for example, required a fair amount of legal input for which we were unprepared both it terms of time and budget.

Operating such systems is undemanding for the most part. In our case, our business partner will construct and operate the system during much of its useful life. It is important, however, that the contractual underpinnings for the project express clearly the Tribe’s expectations in terms of initial output and degradation over time. It is also important for Tribal clients to understand at the outset what is and is not required by IRS regulations for investors to qualify for tax credits. These requirements constrain the structure of deals in important ways.
When, as in our project, it is contemplated that the project will be constructed and operated by a non-Tribal entity, it is crucial that the development schedule permit adequate time for BIA review of the ground lease. The Bureau may also want to see the power purchase agreement and other collateral documents. Early involvement of BIA real estate staff may help to prevent surprises late in the contract negotiating process and ensure that the project schedule is realistic.

AUGUSTINE RESERVATION ENERGY FEASIBILITY STUDY
AUGUSTINE BAND OF CAHUILLA MISSION INDIANS 84-001 Avenue 54 at Van Buren
Coachella, CA 92236
Preliminary Study Report
PREPARED FOR:
Augustine Band of Cahuilla Indians Ms. Mary Ann Martin, Tribal Chairperson
P.O. Box 846, Coachella, CA 92236 (760) 369-7171
C/O Karen Chupcha Tribal Administrator
P.O. Box 1291 Yucca Valley, CA 92286
(760) 365-1373
BY:
SYSKA HENNESSY GROUP 9665 GRANITE RIDGE DRIVE, SUITE 110
SAN DIEGO, CA 92123 PHONE: 858/244/0360
ENERGY SERVICES GROUP
PROJECT NO. ______________
DATE: FEBRUARY 1, 2005
l:\augustine - programs\doe app#1 2005 jan20_05\reports\augustinereservationfeasibilitystudy0129.doc

Augustine Reservation Energy Feasibility Study Page i
Table of Contents l:\augustine - programs\doe app#1 2005 jan20_05\reports\augustinereservationfeasibilitystudy0129.doc
TABLE OF CONTENTS
SECTION PAGE NO.
1.0 Executive Summary ......................................................................................................................... 1 2.0 Introduction...................................................................................................................................... 1 3.0 Objective of the Study ..................................................................................................................... 1 4.0 Description of the Existing Facility ................................................................................................. 2
4.1 General Observation of the Current Facility ............................................................................... 3 5.0 Energy Demand and Consumption Projections ............................................................................... 3 6.0 Technology Evaluation .................................................................................................................... 1
6.1 Photovoltaics ............................................................................................................................... 1 PV Simple Payback Calculation .......................................................................................................... 2 Photovoltaics Conclusion..................................................................................................................... 3
6.2 Solar Hot Water Supply and Solar Space Heating ...................................................................... 4 Solar Hot Water Supply and Solar Space Heating Conclusion............................................................ 8 Solar Thermal Electricity Generation................................................................................................... 8 Solar Thermal Electric Conclusion .................................................................................................... 10
6.3 Solar Air Conditioning .............................................................................................................. 10 Solar Air Conditioning Conclusion.................................................................................................... 11
6.4 Wind Turbine Electricity Generation ........................................................................................ 11 Wind turbine Conclusion ................................................................................................................... 12
6.5 Biomass Conversion to Electricity ............................................................................................ 12 Biomass Conversion to Electricity Conclusion.................................................................................. 13
6.6 Geothermal Electricity Generation and Process Hot Water Production.................................... 14 Geothermal Power Plants ................................................................................................................... 14 Geothermal Direct Use....................................................................................................................... 16 Geothermal Heat Pumps (GHP) ......................................................................................................... 17

Augustine Reservation Energy Feasibility Study Page ii
Table of Contents l:\augustine - programs\doe app#1 2005 jan20_05\reports\augustinereservationfeasibilitystudy0129.doc
Geothermal Conclusion...................................................................................................................... 19 6.7 Solar Drying and Processing ..................................................................................................... 20
Solar Drying and Processing Conclusion........................................................................................... 20 6.8 Energy Conservation Policies, Design and Incentives .............................................................. 20
Energy Conservation Policies, Design & Incentives Conclusion ...................................................... 21 6.9 Cogeneration.............................................................................................................................. 21
Application of Heat ............................................................................................................................ 21 Central Plant or Individual Building Systems.................................................................................... 22 Cogeneration Conclusion ................................................................................................................... 22
6.10 Hybrids of Preceding Technologies .......................................................................................... 22 Hybrid Conclusion ............................................................................................................................. 23
7.0 Economic Evaluation ..................................................................................................................... 23 8.0 Recommendations.......................................................................................................................... 23
Appendices
Appendix A - Energy Demand and Consumption Projection: Assumptions and Calculations

Augustine Reservation Energy Feasibility Study Page 1 l:\augustine - programs\doe app#1 2005 jan20_05\reports\augustinereservationfeasibilitystudy0129.doc
1.0 EXECUTIVE SUMMARY The Augustine Band of Cahuilla Mission Indians, a federally recognized Indian Tribe, undertook this preliminary feasibility study to assess feasibility of developing off-grid energy resources on the Client’s 500+ acre Reservation located in the Eastern Coachella Valley in Southern California. The study results include three major conclusions. First, off-grid energy resources are not recommended due to primarily economic factors. Second, a combination of renewable resources, energy conservation measures, and cogeneration are recommended to serve the current and projected energy requirements of the reservation. Third, a detailed study should be completed in conjunction with preliminary design work, to assess the proposed systems in greater detail and ensure that projected development is planned with a cohesive energy strategy from the beginning.
Off-grid energy resources are not recommended for development on the reservation. Off-grid systems such as photovoltaic require large battery storage systems that are costly, require maintenance, and have negative environmental impact. Grid-connected photovoltaic utilizes the grid as the “storage” device, with load at night served by efficient base load generation. Further, off-grid systems have limited capability to handle large motor loads such as those found in air conditioning systems. Designing an off-grid system for these transient loads can result in over sizing with a focus on peak load capacity rather than the greatest economic performance and overall efficiency. The Reservation is relatively small, without housing remote from the nearest grid, characteristic of other large reservations that make off-grid energy systems viable. Certain small loads might be cost effectively served by dedicated, small off-grid sources, where more beneficial than running a long circuit.
A combination of renewable resources, energy conservation measures, and cogeneration are recommended to serve the current and projected energy requirements of the reservation. xxxxxxxxxxxxx
A detailed study should be completed in conjunction with preliminary design work, to assess the proposed systems in greater detail and ensure that projected development is planned with a cohesive energy strategy from the beginning. xxxxxxxxxxxxx
2.0 INTRODUCTION The Augustine Band of Cahuilla Mission Indians, a federally recognized Indian Tribe, desires to assess the feasibility of developing off-grid energy resources on the Client’s 500+ acre Reservation located in the Eastern Coachella Valley in Southern California. This report represents the first of two study phases. This first phase is a general assessment of the likelihood that various sorts of alternative energy, including photovoltaics, solar thermal, solar air conditioning, bio-mass conversion, geothermal and wind electricity generation, will prove to be technically and economically viable. The Client’s stated objective is to remove the Reservation entirely from the conventional energy grid and to reduce the energy footprint of the Reservation to lowest possible level consistent with economic development objectives. The second study phase will be a detailed feasibility analysis outside the scope of this report.
3.0 OBJECTIVE OF THE STUDY The study includes four tasks:
Task 1: Energy Demand and Consumption Projection
Evaluate, based on land use projections and other information provided by Client, the energy needs of the Reservation over the next 20 years.

Augustine Reservation Energy Feasibility Study Page 2 l:\augustine - programs\doe app#1 2005 jan20_05\reports\augustinereservationfeasibilitystudy0129.doc
Task 2: Energy Technology Feasibility Evaluation
Evaluate, based on available data and consultant’s experience, the likelihood that each of the following energy supply or conservation options will prove to be technically feasible if developed on the Augustine Reservation:
a) Photovoltaics;
b) Solar hot water supply;
c) Solar air conditioning;
d) Wind turbine electricity generation;
e) Biomass conversion to electricity;
f) Geothermal electricity generation and process hot water production;
g) Solar space heating;
h) Solar drying and processing;
i) Passive solar design;
j) Energy conservation policies, design and incentives;
k) Cogeneration;
l) Various hybrids of the preceding.
Task 3: Economic Comparison of Favored Technologies to Conventional (Status Quo)
Using three sets of future energy cost assumptions developed jointly with Client, and stipulated assumptions concerning the cost of alternative energy facilities, equipment, maintenance and other operating costs, compare the economic feasibility of the alternative energy sources favored by the technical analysis in Task 2, above, with the projected cost of conventional energy.
Task 4: Recommendations
Based upon the analyses in Tasks 1 through 3, above, present recommendations to Client for a detailed feasibility analysis, including a proposed scope of work and budget, of the alternatives deemed most likely to prove technically and economically feasible in the detailed analysis.
4.0 DESCRIPTION OF THE EXISTING FACILITY The Reservation consists of 502 acres of level land (see map Appendix D). Improvements consist of the existing Augustine Casino facility, a 33,000 square foot single story tilt-up structure, with surrounding outbuildings, mainly eighteen modular office space units, and parking lots. The Casino and associated buildings and parking occupy approximately 20 acres. Currently no self-generation or renewable energy sources are used on the reservation, either grid connected or off-grid. A single electric service serves the reservation, and there is no sub-metering. The Reservation is fed by a radial IID distribution feeder. Electric reliability is described by the client as “very unreliable,” with frequent outages, but has improved by 7-8% over the past eighteen months. The following table lists existing utility service details.

Augustine Reservation Energy Feasibility Study Page 3 l:\augustine - programs\doe app#1 2005 jan20_05\reports\augustinereservationfeasibilitystudy0129.doc
Table 4-1 Existing Utility Service Details
Electric Service Details Service Provider Imperial Irrigation District Service Voltage: 12.47 kV
12.47kV/480V Transformer owned by IID Metering Voltage: 480V Service Ampacity: 4000A at 480V Backup Generator: 2,000 kW – Serves entire load with spare capacity Rate Schedule: COMM_LARGE (Schedule GL – App. B) Natural Gas Service Details Service Provider: Southern California Gas Company Rate Schedule: GN-10 - App. C Water and Wastewater Service Details Water Provider: Self (well on Reservation with 250,000 gallon tank) Irrigation Provider: Coachella Valley Irrigation District (CVWD) [supply
infrastructure existing but not used] Wastewater Service Provider CVWD
4.1 GENERAL OBSERVATION OF THE CURRENT FACILITY The Casino electrical, mechanical and plumbing systems are modern and well maintained. The facility is energy efficient due to prudent energy conservation measures, and there is only marginal opportunity for further energy savings in the existing facility without investment in technologies that fall under the scope of this study. Facility operations staff is very knowledgeable and proactive in energy efficiency.
5.0 ENERGY DEMAND AND CONSUMPTION PROJECTIONS Demand and consumption projections are shown in graphs below with tabular data included. The calculations are detailed in Appendix A, and the spreadsheet is included in electronic format on compact disc included with this report.

0
500
1000
1500
2000
2500
Year
Kilo
wat
ts (k
W)
Incr. Demand 889 16.7 0 258 0 0 1.8 300 7.3 37.5 400 306 137 0 0 0 0 0 0 0 0
Demand F'cast 889 906 906 1164 1164 1164 1166 1466 1473 1511 1911 2217 2353 2353 2353 2353 2353 2353 2353 2353 2353
Casino 4k Res 30k Gov Wat Sys 3/4M St Lt 30k Ret 1M St Lt 3x3k Res 40k Ret RV Pk 10k Rest
2004 2005 2006 2007 2008 2009 2010 2011 2012 2013 2014 2015 2016 2017 2018 2019 2020 2021 2022 2023 2024
Figure 5-1: Electric Demand Forecast
Augustine Reservation Energy Feasibility Study Page 1 l:\augustine - programs\doe app#1 2005 jan20_05\reports\augustinereservationfeasibilitystudy0129.doc

0
1000000
2000000
3000000
4000000
5000000
6000000
7000000
8000000
Year
Kilo
wat
t hou
rs (k
Wh)
Incr. kWh 4228305 6800 502992 7388 513128 29269 21062 694485 1163678 175362
kWh F'cast 4228305 4235105 4235105 4738097 4738097 4738097 4745485 5258613 5287882 5308944 6003429 7167107 7342469 7342469 7342469 7342469 7342469 7342469 7342469 7342469 7342469
Casino 4k Res 30k Gov Wat Sys 3/4M St Lt 30k Ret 1M St Lt 3x3k Res 40k Ret RV Pk 10k Rest
2004 2005 2006 2007 2008 2009 2010 2011 2012 2013 2014 2015 2016 2017 2018 2019 2020 2021 2022 2023 2024
Figure 5-2: Electric Consumption Forecast
Augustine Reservation Energy Feasibility Study Page 2 l:\augustine - programs\doe app#1 2005 jan20_05\reports\augustinereservationfeasibilitystudy0129.doc

0
100
200
300
400
500
600
700
Year
Tons
Incr. Tons 165 10.67 92.31 120 24 160 13.33 44.44
Tons F'cast 165 176 176 268 268 268 268 388 388 412 572 585 630 630 630 630 630 630 630 630 630
Casino 4k Res 30k Gov Wat Sys 3/4M St Lt 30k Ret 1M St Lt 3x3k Res 40k Ret RV Pk 10k Rest
2004 2005 2006 2007 2008 2009 2010 2011 2012 2013 2014 2015 2016 2017 2018 2019 2020 2021 2022 2023 2024
Figure 5-3: Cooling Demand Forecast
Augustine Reservation Energy Feasibility Study Page 3 l:\augustine - programs\doe app#1 2005 jan20_05\reports\augustinereservationfeasibilitystudy0129.doc

0
500000
1000000
1500000
2000000
2500000
3000000
3500000
Year
BTU
H
Incr. BTUH 448472 80000 600000 600000 180000 800000 100000 300000
BTUH F'cast 448472 528472 528472 1128472 1128472 1128472 1128472 1728472 1728472 1908472 2708472 2808472 3108472 3108472 3108472 3108472 3108472 3108472 3108472 3108472 3108472
Casino 4k Res 30k Gov Wat Sys 3/4M St Lt 30k Ret 1M St Lt 3x3k Res 40k Ret RV Pk 10k Rest
2004 2005 2006 2007 2008 2009 2010 2011 2012 2013 2014 2015 2016 2017 2018 2019 2020 2021 2022 2023 2024
Figure 5-4: Heating Demand Forecast
Augustine Reservation Energy Feasibility Study Page 4 l:\augustine - programs\doe app#1 2005 jan20_05\reports\augustinereservationfeasibilitystudy0129.doc

Natural Gas Consumption Forecast
0
10000
20000
30000
40000
50000
60000
70000
80000
Year
Ther
ms
Incr. Therms 30949 430 11100 11100 1162 14800 1850 3700
Therm F'cast 30949 31379 31379 42479 42479 42479 42479 53579 53579 54741 69541 71391 75091 75091 75091 75091 75091 75091 75091 75091 75091
Casino 4k Res 30k Gov Wat Sys 3/4M St Lt 30k Ret 1M St Lt 3x3k Res 40k Ret RV Pk 10k Rest
2004 2005 2006 2007 2008 2009 2010 2011 2012 2013 2014 2015 2016 2017 2018 2019 2020 2021 2022 2023 2024
Figure 5-5: Natural Gas Consumption Forecast
Augustine Reservation Energy Feasibility Study Page 5 l:\augustine - programs\doe app#1 2005 jan20_05\reports\augustinereservationfeasibilitystudy0129.doc

Augustine Reservation Energy Feasibility Study Page 1 l:\augustine - programs\doe app#1 2005 jan20_05\reports\augustinereservationfeasibilitystudy0129.doc
6.0 TECHNOLOGY EVALUATION This section of the report evaluates, based on available data and consultant’s experience, the likelihood that each of the following energy supply or conservation options will prove to be technically feasible if developed on the Augustine Reservation.
6.1 PHOTOVOLTAICS Photovoltaic (PV) systems generate DC electrical power from ambient solar radiation. PV are solid state devices with no moving parts and, unlike other on-site generators, provide silent, maintenance free, emission free, 100% renewable power. PV systems require large shade free areas (approximately 120 sf for 1 KW of power) and generally perform best when oriented towards the south and tilted from horizontal (tilt angle is latitude specific). PV systems are typically installed in a “grid-connected” configuration with the PV output synchronized and paralleling the utility grid supplied power. An inverter is required to convert the DC output of the PV system to AC power, but no batteries are required for this type of system. Grid-connected PV is metered under “net metering” requirements, allowing excess power to be exported onto the utility grid, thus providing the means to optimize the PV system size for greatest economic benefit.
The Augustine Band’s stated objective “is to remove the Reservation entirely from the conventional energy grid...consistent with our economic development objectives.” If installed off-grid or “stand alone,” batteries are required to store energy for consumption during night when the panels are not producing power. Batteries raise the installation cost and also add cost for maintenance and periodic replacement. Also, off-grid systems require special design consideration to ensure capacity to handle load transients such as large motor starts. This is not an issue for grid-connected PV systems.
Figure 6-1: Flat Roof PV System (image courtesy PowerLight Corporation)
At the current time, significant incentives are available from the California Energy Commission, to help reduce the cost of photovoltaic systems. As renewable energy, photovoltaic supplied power also contributes towards the US Green Building Council LEED Rating, which the Reservation might consider pursuing for the existing Casino and future development. A photovoltaic system at the Reservation would also serve as an important symbol to the community, further promoting the Augustine Band’s leadership in pursuing clean energy sources and environmental stewardship.

Augustine Reservation Energy Feasibility Study Page 2 l:\augustine - programs\doe app#1 2005 jan20_05\reports\augustinereservationfeasibilitystudy0129.doc
A PV system at the Reservation will help to earn credits under the US Green Building Council Leadership in Energy and Environmental Design (LEED) Green Building Rating System. Up to three LEED credits are available for on-site renewable energy systems. A large PV system at the Reservation should provide for all available LEED credits.
Photovoltaic systems remain expensive to install. A 1000 kW system, which would be among the largest PV installations in Southern California, would likely cost $6.5 to $8 million. Costs are lower for fixed systems that don’t track the sun and therefore produce less energy, and higher for tracking systems. Currently available incentives from the California Public Utilities Council would provide for up to 50% of the cost of a PV system. 1000 kW is the maximum size system eligible for state Self-Generation Incentive Program funding, and also roughly approximates half the Reservation peak demand forecast of 2000 kW in 2015, when all projected development is considered. Proper PV sizing is important to ensure maximum economic benefit, taking into account Net Metering provisions and requirements when operating in parallel to the IID grid.
PV Simple Payback Calculation A simple payback calculation is illustrative here. Economic analysis is completed in Section 8.0.
Assumptions
• Photovoltaic mounting area is not limited, with all existing and planned parking areas and flat roofs available for panel mounting.
• The estimated full time yield of the photovoltaic panel is considered to be about 10 watts/sq.ft. This assumption is based on actual manufacturer data obtained from PowerLight Corporation.
• An average of 6 hours per day of full time yield
• PV system installed cost: $ 7.00 per watt
• Average electricity cost: $0.1017/kWh
Calculations
Photovoltaic Capacity: 1,000 kW (= maximum size that qualifies SGIP funding) PV Area = 1,000 kW / 10 watts/sf = 100,000 sf Photovoltaic Mounting Area = PV Area/0.75 = 133,000 sf The initial capital investment for the photovoltaic array ($7/watt) = $ 7,000,000 The buy down incentive from Southern California Edison = $ 3,500,000 Net capital investment after incentive = $ 3,500,000 The total annual energy yield from a 1 megawatt photovoltaic array based on 6 hrs/day of full time yield = 2,190,000 kWh Utility savings per year due to onsite generation from photovoltaics = $ 222,723 Simple payback for a 1 megawatt photovoltaic array: $ 3,500,000 / $ 222,723 = 15.7 years approx.

Augustine Reservation Energy Feasibility Study Page 3 l:\augustine - programs\doe app#1 2005 jan20_05\reports\augustinereservationfeasibilitystudy0129.doc
Expected inflation of electricity costs accelerates payback. Using 3% annual inflation rate on electricity rates results in simple payback of 11.5 years. Expected system life is 25-30 years, with warranty typically 20-25 years.
Flat roofs of buildings are typically used for mounting a large PV system, but parking shade structures at the casino and at planned buildings are a viable option that give the added benefit of shaded parking to patrons and would be a visible reminder of the Augustine Band’s commitment to renewable energy. Electrical inverters and grid-interconnection equipment associated with the PV system should be located within relatively close proximity to the PV panels. Any mounting configuration must account for high wind conditions that occur at the Reservation, and also consider security and potential vandalism. Careful consideration must be given to tradeoffs of the benefits of tracking systems versus fixed mounting, considering that tracking requires moving parts that are potential failure points, and that tracking systems suitable for high wind may add significant cost.
To allow for potential PV use on the Reservation, site electrical infrastructure should be planned to accommodate an on-site PV system operating in parallel with the Imperial Irrigation District utility service. IID has standard interconnection and net metering requirements. The system should be planned to allow incremental or modular additions to the system to coincide with load growth associated with new facility construction, again with the goal of maximizing economic benefit of the PV installation. The PV system could be planned as a single central system connected at the main service, or as several arrays connected individually at the associated facilities. These options are related to overall electrical planning for facility additions, and are also dependent on IID service requirements for major new facilities.
Photovoltaics Conclusion Photovoltaic application is known to be technically viable in the region, with many small systems and a growing number of large systems in operation and being added each year. PV technology is straightforward and mature, and grid interconnection to the Imperial Irrigation district system is clear-cut with proper design and planning. California Self-Generation Incentive Funding is applicable for photovoltaic, paying $3.50/watt, up to 50% of the installed cost of the system. Information on this incentive program in App ___. Photovoltaic application will be considered with other technologies to assess economic viability.
Figure 6-2: Parking Shade Mouned PV (photo credit – Sandia DOE/NREL)

Augustine Reservation Energy Feasibility Study Page 4 l:\augustine - programs\doe app#1 2005 jan20_05\reports\augustinereservationfeasibilitystudy0129.doc
6.2 SOLAR HOT WATER SUPPLY AND SOLAR SPACE HEATING Summer gas usage includes domestic hot water and cooking, with a monthly average of approximately 2300 therms. Winter gas usage peaked at 3229 therms per month, so approximately 900 therms per month are attributable to space heating. Projected development on the reservation is primarily commercial space – a mix of office and retail – so the proportion of hot water and space heating energy consumption compared to other reservation consumption will remain approximately the same. While hot water supply and space heating combined represent a small portion of Reservation energy demand and consumption, these are applications that are readily addressed with solar energy, so should be considered as potential solar applications.
Active Solar Heating1
Active solar heating uses concepts similar to passive solar heating. However, active solar takes the power of the sun and amplifies it. Using specially designed mechanical systems, active solar heating can generate much more heat for space heating and hot water than passive solar alone.
Solar collectors are at the heart of most active-solar energy systems. The collector absorbs the sun's light energy and changes it into heat energy. This thermal energy can then be used to provide heated water for residential or commercial use, to provide space heating or cooling, or for many other applications in which fossil fuels might otherwise be used.
There are two basic types of active-solar heating systems, depending on whether air or a liquid is heated in the solar collector. A liquid-based system heats water or an antifreeze solution in a "hydronic" collector, and an air-based system heats air in an "air collector."
Both of these systems collect and absorb solar radiation, then transfer the solar heat directly to the interior space or to a storage system, from which the heat is distributed. If the system cannot provide adequate space heating, an auxiliary or back-up system provides the additional heat. Liquid-based systems are more often used when storage is included.
In an active-solar water heating system, heated water is moved through the system with the aid of pumps, which increases the system's efficiency.
Solar thermal collectors are the key component of active-solar systems, and are designed to meet the specific temperature requirements and climate conditions for different end-uses. There are several types of solar collectors:
• Flat-plate collectors
• Evacuated-tube collectors
• Concentrating collectors
• Transpired air collectors
Residential and commercial building applications that require temperatures below 200°F typically use flat-plate or transpired air collectors, whereas those requiring temperatures greater than 200°F use evacuated-tube or concentrating collectors.
Flat-plate collectors
Flat-plate collectors are the most common collector for residential water-heating and space-heating installations. A typical flat-plate collector is an insulated metal box with a glass or plastic cover (called

Augustine Reservation Energy Feasibility Study Page 5 l:\augustine - programs\doe app#1 2005 jan20_05\reports\augustinereservationfeasibilitystudy0129.doc
the glazing) and a dark-colored absorber plate. These collectors heat either liquid or air at temperatures less than 180°F.
Flat-plate collectors are used for residential water-heating and space-heating installations.
Figure 6-3: Flat-Plate Collectors
Liquid flat-plate collectors heat liquid as it flows through tubes in or adjacent to the absorber plate. The simplest liquid systems use potable household water, which is heated as it passes directly through the collector and then flows to the house.
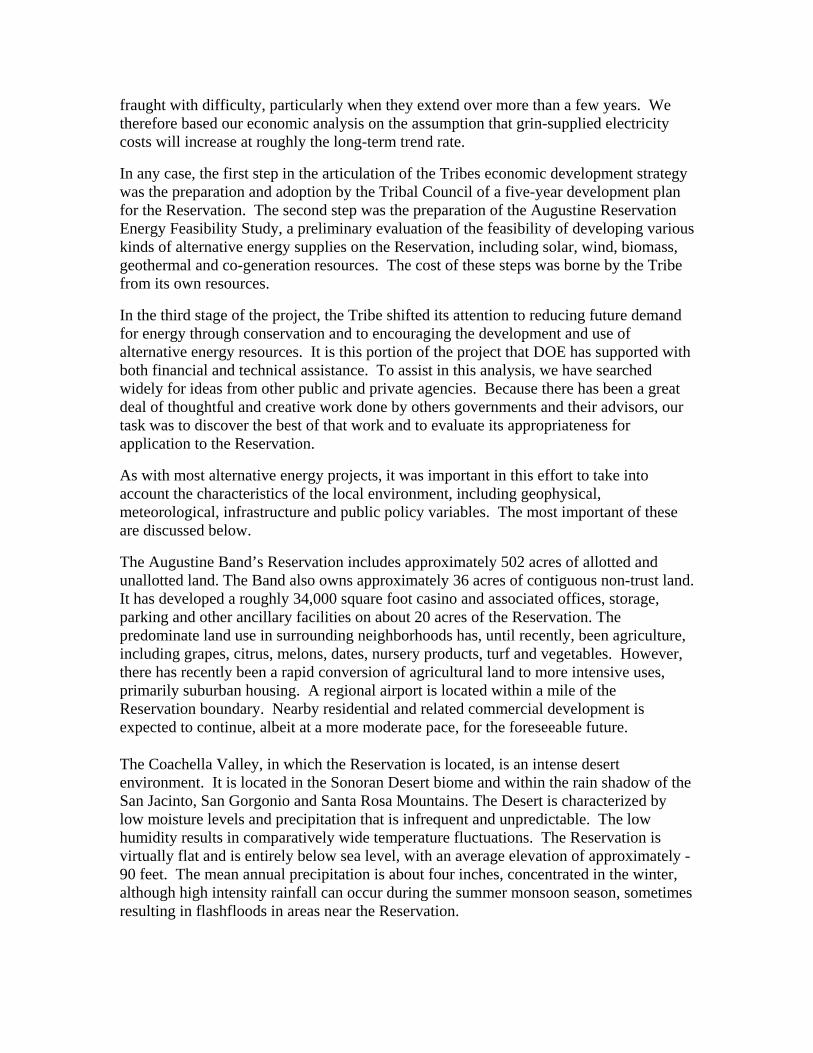
Swimming pool heating systems use liquid flat-plate collector technology. The pool's existing filtration system pumps water through the solar collectors, and the collected heat is transferred into the pool. Because solar pool collectors operate just slightly warmer than the surrounding air temperature, these systems typically use inexpensive, unglazed low-temperature collectors made from specially formulated plastic materials. Glazed (glass-covered) solar collectors usually are not used in pool-heating applications, except for indoor pools, hot tubs, or spas in colder climates. In some cases, unglazed copper or copper-aluminum solar collectors are used.
Augustine Reservation Energy Feasibility Study Page 6 l:\augustine - programs\doe app#1 2005 jan20_05\reports\augustinereservationfeasibilitystudy0129.doc
Unglazed solar collectors typically used for swimming pool heating.
Figure 6-4: Unglazed Solar Collectors
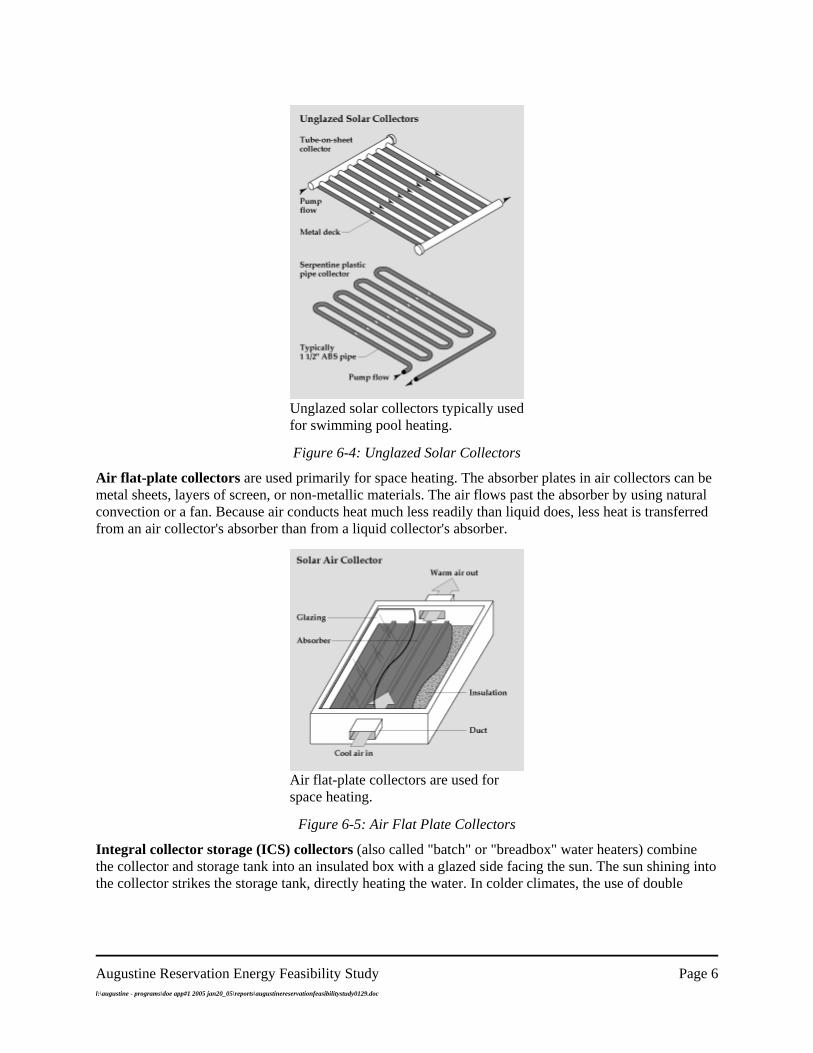
Air flat-plate collectors are used primarily for space heating. The absorber plates in air collectors can be metal sheets, layers of screen, or non-metallic materials. The air flows past the absorber by using natural convection or a fan. Because air conducts heat much less readily than liquid does, less heat is transferred from an air collector's absorber than from a liquid collector's absorber.
Air flat-plate collectors are used for space heating.
Figure 6-5: Air Flat Plate Collectors
Integral collector storage (ICS) collectors (also called "batch" or "breadbox" water heaters) combine the collector and storage tank into an insulated box with a glazed side facing the sun. The sun shining into the collector strikes the storage tank, directly heating the water. In colder climates, the use of double

Augustine Reservation Energy Feasibility Study Page 7 l:\augustine - programs\doe app#1 2005 jan20_05\reports\augustinereservationfeasibilitystudy0129.doc
glazing and selective surfaces will prevent freeze damage to the collector. In even mildly cold climates, installation and maintenance of insulation is needed to prevent supply and return pipes from freezing.
Evacuated-Tube Collectors
Evacuated-tube collectors are typically more efficient at higher temperatures than flat-plate collectors. In an evacuated-tube collector, sunlight enters through the outer glass tube and strikes the absorber, where the energy is converted to heat. The heat is transferred to the liquid flowing through the absorber. The collector consists of rows of parallel transparent glass tubes, each of which contains an absorber covered with a selective coating. The absorber typically has fin-tube design (fins increase the absorber surface and the heat-transfer rate), although cylindrical absorbers also are used.
Evacuated-tube collectors are efficient at high temperatures.
Figure 6-6: Evacuated Tube Collectors
When evacuated tubes are manufactured, air is evacuated from the space between the two tubes, forming a vacuum. Convective and conductive heat losses are eliminated because there is no air to convect or conduct heat, so evacuated-tube collectors are efficient at higher temperatures and perform well in both direct and diffuse solar radiation. Evacuated-tube collectors are more appropriate for most commercial and industrial applications because they can achieve extremely high temperatures (170°F to 350°F). However, evacuated-tube collectors are more expensive than flat-plate collectors.
Concentrating Collectors
Concentrating collectors use curved mirrors to concentrate sunlight on an absorber, called a receiver, at up to 60 times the sun's normal intensity. These high-temperature systems are used primarily in commercial and industrial applications.
Parabolic-trough collectors use trough-shaped reflectors that concentrate sunlight on a tube running along the reflector's focal line, achieving much higher temperatures than flat-plate or evacuated-tube collectors. These systems usually include a mechanical control system, called a tracker, that keeps the trough reflector pointed at the sun throughout the day. Parabolic-trough concentrating systems can provide hot water and steam, and are generally used in commercial and industrial applications.

Augustine Reservation Energy Feasibility Study Page 8 l:\augustine - programs\doe app#1 2005 jan20_05\reports\augustinereservationfeasibilitystudy0129.doc
Parabolic-trough collectors are generally used in commercial applications.
Figure 6-7: Parabolic Trough Collectors
Compound parabolic concentrating collectors (CPCCs) use mirrored surfaces to concentrate the sun's energy on a receiver, similar to parabolic-trough collectors. CPCCs achieve moderate concentration and moderately high temperatures, but unlike parabolic-trough collectors, they can collect both direct and diffuse sunlight and do not require an automated sun-tracking system. CPCCs are being investigated for use in commercial applications in which higher temperatures are required.
Transpired-Air Collectors
Transpired-air collectors are made of dark, perforated metal. The sun heats the metal, and a fan pulls ambient air through the holes in the metal, which heats the air. This technology has been used for pre-heating ventilation air and for crop drying.
Transpired-air collectors have achieved efficiencies of more than 70% in some commercial applications. Because they require no glazing or insulation, transpired air collectors are inexpensive to manufacture. All these factors result in a cost-effective source of solar heat. In fact, R&D Magazine recognized transpired-air collectors as one of the 100 most important technology innovations in 1995.
Solar Hot Water Supply and Solar Space Heating Conclusion Hot water supply and space heating represent a small portion of current and projected energy consumption on the Reservation. While these are applications that are readily addressed with solar energy, the small energy usage savings result in long payback. However, when combined with hot water supply in solar assisted air conditioning (covered Solar Air Conditioning section), hot water supply and space heating can be considered a by-product of the system whose primary function is cooling. Solar hot water supply and space heating applications will not be considered alone in economic assessment, but will be assessed in conjunction with solar air conditioning.
Solar Thermal Electricity Generation2 Another application of solar energy is solar thermal electricity generation. The scope of this study did not include solar thermal electric, but is included for information only.

Augustine Reservation Energy Feasibility Study Page 9 l:\augustine - programs\doe app#1 2005 jan20_05\reports\augustinereservationfeasibilitystudy0129.doc
While solar photovoltaics (PV) are better known, California actually gets far more of its electricity from solar thermal power plants. Nine distinct solar thermal power plants located in the Mojave Desert (Shown in picture above) total 360 megawatts, by far the largest central solar power station in the world. (That's enough electricity to power about 360,000 homes.)
These solar thermal power plants rely upon curved mirrored troughs that concentrate sunlight. The sun heats a liquid that creates steam to turn a traditional turbine. A more efficient technology is called the "stirling dish," which is powered by an entirely new kind of engine. Instead of the internal
combustion engine, which relies upon an explosion inside the engine walls to turn pistons, the dish stirling engine relies upon the sun to heat tubes filled with hydrogen that turn the crankshaft.
Figure 6-8: Solar Thermal Power Plants- Mojave Desert
Solar PV panels register efficiencies ranging from 9 to 15 percent. The solar thermal trough rankine cycle facilities are approximately 22 percent. Stirling solar dishes have been measured at efficiencies as high as 30 percent. (These efficiency numbers are based on calculations that convert the sun's energy into the equivalent of British Thermal Units, a universally recognized measuring unit of energy commonly referred to as "BTU's". One BTU is the same quantity of heat required to raise the temperature of one pound of water one degree Fahrenheit.)
Solar Thermal Electric Projected Use
Solar thermal electric capacity is predicted to increase worldwide. The cost of building, operating, and maintaining solar thermal electric systems has decreased dramatically -- in some cases by a factor of ten -- during the 1980s and ‘90s and is expected to continue dropping. Solar-thermal designs may be economically competitive with some conventional electricity-generating technologies. By 2010, some solar thermal electric technologies could be producing electricity at $0.06 to $0.07 per kilowatt hour (kWh).
What Does It Cost?3
Concentrating solar power technologies currently offer the lowest-cost solar electricity for large-scale power generation (10 megawatt-electric and above). Current technologies cost $2–$3 per watt. This results in a cost of solar power of 9¢–12¢ per kilowatt-hour. New innovative hybrid systems that combine large concentrating solar power plants with conventional natural gas combined cycle or coal plants can reduce costs to $1.5 per watt and drive the cost of solar power to below 8¢ per kilowatt hour.

Augustine Reservation Energy Feasibility Study Page 10 l:\augustine - programs\doe app#1 2005 jan20_05\reports\augustinereservationfeasibilitystudy0129.doc
Solar Thermal Electric Conclusion Solar thermal electric generation is most promising in large scale systems, e.g. greater than 10 MW. Solar thermal electric is not commercially available sized suitably for application on the Reservation. Solar thermal electric generation will not be considered with other technologies to assess economic viability.
6.3 SOLAR AIR CONDITIONING Cooling requirements dominate current and projected Reservation energy demand and consumption, and therefore represent great potential for energy savings and potential renewable energy application. Solar air conditioning techniques in current use include absorption and adsorption chilling, and desiccant cooling. These techniques are mature technologies independent of solar application.
Active Solar Cooling and Refrigeration4
It is possible to use solar thermal energy or solar electricity to operate or power a cooling appliance or a refrigerator. The following is a brief description of "active" solar cooling and refrigeration technologies. Active solar energy systems use a mechanical or electrical device to transfer solar energy absorbed in a solar collector to another component in the "system." It is possible to also cool a building or structure by using the natural processes of solar heat transfer (conduction, convection, and radiation). This is often referred to as "passive solar cooling," and is primarily an architectural technique. This brief focuses on active solar cooling systems. The American Solar Energy Society (ASES, see Source List below) is one source of information on passive solar cooling techniques.
Absorption Cooling and Refrigeration
Absorption cooling is the first and oldest form of air conditioning and refrigeration. An absorption air conditioner or refrigerator does not use an electric compressor to mechanically pressurize the refrigerant. Instead, the absorption device uses a heat source, such as natural gas or a large solar collector, to evaporate the already-pressurized refrigerant from an absorbent/refrigerant mixture. This takes place in a device called the vapor generator. Although absorption coolers require electricity for pumping the refrigerant, the amount is small compared to that consumed by a compressor in a conventional electric air conditioner or refrigerator. When used with solar thermal energy systems, absorption coolers must be adapted to operate at the normal working temperatures for solar collectors: 180° to 250°F (82° to 121°C). It is also possible to produce ice with a solar powered absorption device, which can be used for cooling or refrigeration.
Desiccant Cooling
Desiccant cooling systems make the air seem cooler by removing most of its moisture. In these systems, the hot, humid outdoor air passes through a rotating, water-absorbing wheel. The wheel absorbs most of the incoming air's moisture. This "desiccates" (heats and dries) the air. The heated air then passes through a rotating heat exchanger wheel, which transfers the heat to the exhaust side of the system. At the same time, the dried air passes through an evaporative cooler, further reducing its temperature. The heated exhaust air continues through an additional heat source (e.g., a solar heat exchanger), raising its temperature to the point that the exhaust air evaporates the moisture collected by the desiccant wheel. The moisture is then discharged outdoors. The various system components require electricity to operate, but they use less than a conventional air conditioner. Most desiccant cooling systems are intended for large applications, such as supermarkets and warehouses. They are also ideal for humid climates.

Augustine Reservation Energy Feasibility Study Page 11 l:\augustine - programs\doe app#1 2005 jan20_05\reports\augustinereservationfeasibilitystudy0129.doc
Solar Air Conditioning Conclusion Solar hot water driven absorption chilling is straightforward, mature technology, and lends itself well to hybrid application with cogeneration. Solar air conditioning will be included with other technologies in economic assessment of viability.
6.4 WIND TURBINE ELECTRICITY GENERATION The wind resource on the reservation has been measured and recorded since June 2003 at a height of 20 meters. Appendix O shows this wind data which indicates an annual mean wind speed of 3.0 meters/second (6.7 mph). This wind speed is considered not high enough to justify investment in a grid connected wind system installation according to accepted industry standards, but may be suitable for non-connected electrical and mechanical loads. The following is guidance from the American Wind Energy Association:
Basic Principles of Wind Resource Evaluation5
Wind resource evaluation is a critical element in projecting turbine performance at a given site. The energy available in a wind stream is proportional to the cube of its speed, which means that doubling the wind speed increases the available energy by a factor of eight. Furthermore, the wind resource itself is seldom a steady, consistent flow. It varies with the time of day, season, height above ground, and type of terrain. Proper siting in windy locations, away from large obstructions, enhances a wind turbine's performance.
In general, annual average wind speeds of 5 meters per second (11 miles per hour) are required for grid-connected applications. Annual average wind speeds of 3 to 4 m/s (7-9 mph) may be adequate for non-connected electrical and mechanical applications such as battery charging and water pumping. Wind resources exceeding this speed are available in many parts of the world.
Wind Power Density is a useful way to evaluate the wind resource available at a potential site. The wind power density, measured in watts per square meter, indicates how much energy is available at the site for conversion by a wind turbine. Classes of wind power density for two standard wind measurement heights are listed in the table below. Wind speed generally increases with height above ground.
Classes of Wind Power Density at 10 m and 50 m(a)
. 10 m (33 ft) 50 m (164 ft)
Wind Power Class
Wind Power Density (W/m2)
Speed(b) m/s (mph)
Wind Power Density (W/m2)
Speed(b) m/s (mph)
1 <100 <4.4 (9.8) <200 <5.6 (12.5)
2 100 – 150 4.4 (9.8)/5.1 (11.5) 200 - 300 5.6 (12.5)/6.4 (14.3)
3 150 – 200 5.1 (11.5)/5.6 (12.5) 300 - 400 6.4 (14.3)/7.0 (15.7)
4 200 – 250 5.6 (12.5)/6.0 (13.4) 400 - 500 7.0 (15.7)/7.5 (16.8)
5 250 – 300 6.0 (13.4)/6.4 (14.3) 500 - 600 7.5 (16.8)/8.0 (17.9)

Augustine Reservation Energy Feasibility Study Page 12 l:\augustine - programs\doe app#1 2005 jan20_05\reports\augustinereservationfeasibilitystudy0129.doc
6 300 – 400 6.4 (14.3)/7.0 (15.7) 600 - 800 8.0 (17.9)/8.8 (19.7)
7 >400 >7.0 (15.7) >800 >8.8 (19.7)
(a) Vertical extrapolation of wind speed based on the 1/7 power law
(b) Mean wind speed is based on the Rayleigh speed distribution of equivalent wind power density. Wind speed is for standard sea-level conditions. To maintain the same power density, speed increases 3%/1000 m (5%/5000 ft) of elevation. (from the Battelle Wind Energy Resource Atlas)
Figure 6-9: Classes of Wind Density at 10m and 50 m
In general, sites with a Wind Power Class rating of 4 or higher are now preferred for large scale wind plants. Research conducted by industry and the U.S. government is expanding the applications of grid- connected wind technology to areas with more moderate wind speeds.
Wind turbine Conclusion Wind turbine electricity generation is not viable based on low average wind speeds. Wind power will not be considered with other technologies to assess economic viability.
6.5 BIOMASS CONVERSION TO ELECTRICITY Biomass resources are organic non-fossil materials of biological origin including crop and forest residues, urban residues, municipal solid waste, manufacturing waste and landfill gas. Biomass resources can be considered for biofuels production or biomass power stations.
Potential biomass resources on the reservation include:
• Approximately 450 acres of land with light scrub vegetation. Assuming one ton of residue per acre yields 450 tons of residue initially with no continuous residue stream as currently planned.
• Existing Municipal Solid Waste stream from casino. Estimated waste stream is less than 20 tons/month or 240 tons/yr.
• Future Municipal Solid Waste stream from proposed retail development
• Future crop residue from proposed vineyard development
Landfill gas is excluded by assuming landfill development on the reservation is neither desired nor allowed.
For power station consideration, the following assumptions are used:
• Capacity factor: 65%
• Conversion efficiency: 35%.
• Capital cost: $1,865/kW
• Fixed O&M: $44/kW-year
• Variable costs: $0.0053/kWh
• 1000 cubic feet residue = 14 dry tons

Augustine Reservation Energy Feasibility Study Page 13 l:\augustine - programs\doe app#1 2005 jan20_05\reports\augustinereservationfeasibilitystudy0129.doc
• 1 dry ton = 1,100 kWh
Resulting production costs are $0.044/kWh to $0.067/kWh.
Assuming 20 tons/month existing Municipal Solid Waste:
20 tons/month x 1,100 kWh/ton = 22,000 kWh/month
Current average monthly consumption = 352,359 kWh/month
Proposed biomass generation with existing estimated MSW stream would produce 6.24 % of current kWh consumption.
Biomass Conversion to Electricity Conclusion With only marginal expected growth of biomass stream, biomass conversion to electricity is not considered viable for development on the reservation.

Augustine Reservation Energy Feasibility Study Page 14 l:\augustine - programs\doe app#1 2005 jan20_05\reports\augustinereservationfeasibilitystudy0129.doc
6.6 GEOTHERMAL ELECTRICITY GENERATION AND PROCESS HOT WATER PRODUCTION The map of California Geothermal Resources in Appendix XX shows that the Reservation is located in a region of Known or Potential Geothermal Resources. There are three primary applications for use of geothermal energy:
1. Electric Power Generation
2. Direct Use
3. Geothermal Heat Pumps
Electric power generation and direct use application require survey and verification of potential geothermal resources on the Reservation, while geothermal heat pump application is practical on the reservation without survey. Locating geothermal resources is expensive and risky just as in oil and gas exploration. Various survey techniques exist and are being researched for predicting geothermal resources in a given location, before the expense of a deep discovery well is necessary to verify geothermal resource.
Geothermal Power Plants6 Geothermal power plants generally use resources with temperatures greater than 250°F to generate power economically, although advanced systems can use resources as low as 190°F. Electricity is currently being produced economically in California, Hawaii, Nevada and Utah. Locating geothermal resources is expensive and risky just as in oil and gas exploration. This inherent risk results in most geothermal electric plant development sized greater than 5 MW, but plants in the 1 MW size range exist.
Typical Costs for Geothermal Power Plant
~$2,500/kW for Power Plant, $3000 - $5000/kW installed for small <1MWe plant
O&M: $0.01 - $0.03/kWh

Augustine Reservation Energy Feasibility Study Page 15 l:\augustine - programs\doe app#1 2005 jan20_05\reports\augustinereservationfeasibilitystudy0129.doc
Figure 6-10: Types of Geothermal Power Plants

Augustine Reservation Energy Feasibility Study Page 16 l:\augustine - programs\doe app#1 2005 jan20_05\reports\augustinereservationfeasibilitystudy0129.doc
Geothermal Direct Use Direct-use projects are practical throughout a larger area of the country because they use more widespread, low-temperature resources (generally between 70°F and 300°F) to heat and cool buildings, provide heat to dry food and lumber and support fish farming and greenhouses.
Approximately 1,300 direct use systems operate across the United States. Geothermal direct-use systems use a fairly simple and established technology that generally involves three basic elements:
• • A production system that brings water up through a well to the surface;
• • A delivery system that distributes hot water through pipes; and
• • A disposal system where the cooled water is injected back into the reservoir.
Applications for Direct Use include space heating, agricultural (green house and aquaculture), and industrial heating processes. A well is drilled into a geothermal reservoir to provide a steady stream of hot water. The water is brought up through the well, and a mechanical system—piping and pumps, a heat exchanger, and controls—delivers the heat directly for its intended use.
Geothermal fluids vary from resource to resource, but the low- to mid-temperature geothermal fluids used for direct-use typically contain lower levels of gases than the higher temperature fluids used for power production. Today, most geothermal direct-use applications circulate these fluids through closed-loop, emissions-free systems. Most geothermal fluids usually contain low, non-hazardous levels of hydrogen sulfide.
Figure 6-11: Direct Use District Heating System

Augustine Reservation Energy Feasibility Study Page 17 l:\augustine - programs\doe app#1 2005 jan20_05\reports\augustinereservationfeasibilitystudy0129.doc
Geothermal Heat Pumps (GHP) Geothermal heat pumps are practical across the country because they do not rely on the reservoirs of geothermal steam or hot water that are found only in certain states. Instead, heat pumps use the constant temperature of the earth at a much shallower depth to transfer heat to a building in the winter, and from a building to the earth to cool it in the summer. More than one million geothermal heat pumps (with a total capacity to generate approximately 8,600 MW of heat) are in operation across the country and their numbers are growing more than 20 percent a year.
The geothermal heat pump, also known as the ground source heat pump, is a highly efficient renewable energy technology that is gaining wide acceptance for both residential and commercial buildings. Geothermal heat pumps are used for space heating and cooling, as well as water heating. Its great advantage is that it works by concentrating naturally existing heat, rather than by producing heat through combustion of fossil fuels.
The technology relies on the fact that the Earth (beneath the surface) remains at a relatively constant temperature throughout the year, warmer than the air above it during the winter and cooler in the summer, very much like a cave. The geothermal heat pump takes advantage of this by transferring heat stored in the Earth or in ground water into a building during the winter, and transferring it out of the building and back into the ground during the summer. The ground, in other words, acts as a heat source in winter and a heat sink in summer.
The system includes three principal components:
• Geothermal earth connection subsystem
• Geothermal heat pump subsystem
• Geothermal heat distribution subsystem.

Augustine Reservation Energy Feasibility Study Page 18 l:\augustine - programs\doe app#1 2005 jan20_05\reports\augustinereservationfeasibilitystudy0129.doc
Figure 6-12: GHP Operation – Cooling Mode
GHP Components: Earth Connection
Using the Earth as a heat source/sink, a series of pipes, commonly called a "loop," is buried in the ground near the building to be conditioned. The loop can be buried either vertically or horizontally. It circulates a fluid (water, or a mixture of water and antifreeze) that absorbs heat from, or relinquishes heat to, the surrounding soil, depending on whether the ambient air is colder or warmer than the soil. Loop requirements are dependent on soil conductivity (k-factor), determined by soil sample analysis.
A horizontal ground loop might be considered for burial under the existing large runoff collection basins adjacent to the casino. Construction costs would be reduced by allowing a large horizontal loop with minimal excavation. Performance would be enhanced by installation in close proximity to the water table.

Augustine Reservation Energy Feasibility Study Page 19 l:\augustine - programs\doe app#1 2005 jan20_05\reports\augustinereservationfeasibilitystudy0129.doc
Figure 6-13: Typical Commercial Vertical and Horizontal Loop Fields
GHP Components: Heat Pump
For heating, a geothermal heat pump removes the heat from the fluid in the Earth connection, concentrates it, and then transfers it to the building. For cooling, the process is reversed.
GHP Components: Heat Distribution
Conventional ductwork is generally used to distribute heated or cooled air from the geothermal heat pump throughout the building.
In addition to space conditioning, geothermal heat pumps can be used to provide domestic hot water when the system is operating. Many residential systems are now equipped with desuperheaters that transfer excess heat from the geothermal heat pump's compressor to the house's hot water tank. A desuperheater provides no hot water during the spring and fall when the geothermal heat pump system is not operating; however, because the geothermal heat pump is so much more efficient than other means of water heating, manufacturers are beginning to offer "full demand" systems that use a separate heat exchanger to meet all of a household's hot water needs. These units cost-effectively provide hot water as quickly as any competing system.
Geothermal Conclusion Geothermal power plant and direct use applications require the financial risk of locating and verifying adequate geothermal resources. Load forecast for the Reservation of approximately 2.3 MW with planned growth would lead to consideration of a geothermal power plant in the small 1-2 MW range, with higher capital costs per kW than for a larger plant. A larger power plant could be considered for the potential of selling excess power to the market, but this falls outside of the stated goals of the Augustine Band. Direct use applications are primarily heating applications that don’t exist and aren’t planned for the Reservation or can be served by less risky geothermal heat pumps. Geothermal power plant and direct use applications are not viable for the reservation unless projected development changes substantially.

Augustine Reservation Energy Feasibility Study Page 20 l:\augustine - programs\doe app#1 2005 jan20_05\reports\augustinereservationfeasibilitystudy0129.doc
Geothermal heat pump application is known to be technically feasible throughout the country. GHP technology is straightforward and mature, and a large installed base of GHP systems exists and is growing by 20% annually. Case studies exist for GHP installations near the Reservation, but caution must be exercised to utilize realistic economic performance figures. GHP application should be considered with other technologies to assess economic viability.
6.7 SOLAR DRYING AND PROCESSING Solar flat plate air panels or similar wall or roof mounted collectors can be applied to dry crops directly or to preheat air for conventional gas fired crop driers used for crops such as soybeans, nuts or raisins. With raisin production projected on the reservation in year five, this technology can be considered for application.
Raisin production projection: Cultivation of 200 acres producing 230 tons of grapes per annum dried to raisins using food driers, harvested beginning in year four.
Raisin Production Background7
Most raisins are sun-dried grapes. The grapes are harvested when they reach a minimum sugar content of 19% or higher. Harvest season starts around the end of August. Once the optimum sugar content is achieved, the grapes are promptly picked and laid-out on paper trays to sun-dry in the vineyards. It takes approximately three weeks for the grapes to dry. Grapes become raisins when their moisture content is reduced to about 15%. Raisin colors vary by drying process. For example, a dark purplish/black raisin is sun-dried. A light to medium brown raisin is mechanically dehydrated in special drying tunnels. A golden to bright yellow raisin is mechanically dried and treated with sulfur dioxide to retain color.
Solar Drying and Processing Conclusion Most (90%) raisins are produced using sun drying. If the Reservation plans to utilize mechanical drying then solar drying can be considered for application and included in economic assessment. Likewise, if surrounding vineyards or other crop sources might add to the projected mechanical drying load, solar drying and processing might become viable. With current projections, solar drying and processing will not be considered with other technologies to assess economic viability.
6.8 ENERGY CONSERVATION POLICIES, DESIGN AND INCENTIVES New facility development on the reservation will be built according to California Title 24 efficiency requirements as a minimum, and further measures should be considered in conjunction with consideration of self generation technologies. Important building energy efficiency systems can only be incorporated during construction, so must be included in the design process. Efficiency measures may add moderately to initial building costs, but generally are very cost effective with good payback, and better dollar-for-dollar payoff than investment in generation technologies. In short, efficiency measures in design should be first on the list. A wide range of guidance and design resources are available through the industry organizations like the US Green Building Council, US Department of Energy, California Energy Commission and others. Best practices for energy efficiency to consider include:
• Passive solar design including: Orientation, overhangs and shading
• Natural ventilation
• High efficiency lighting systems and controls

Augustine Reservation Energy Feasibility Study Page 21 l:\augustine - programs\doe app#1 2005 jan20_05\reports\augustinereservationfeasibilitystudy0129.doc
• High efficiency HVAC including variable air volume (VAV) air handling systems
• Daylighting design
• Building envelope
• High efficiency water-cooled chiller plant
• Energy Management and Control System (EMCS) for load shedding, peak shaving and demand control
• Thermal mass
• Insulation
Energy Conservation Policies, Design & Incentives Conclusion Energy conservation in current and future buildings should be a priority in planning Reservation development. Conservation and efficiency measures will be included in comparison with other technologies to assess economic viability.
6.9 COGENERATION Cogeneration refers to onsite generation of electricity combined with use of waste heat, for example a gas turbine electric generator with exhaust heat applied to a heat recovery hot water boiler. Cogeneration is economically viable throughout California, due to high electric and gas costs, and cost incentives available from the State of California Self-Generation Incentive Program enhance cogeneration viability. Microturbines and gas turbines less than 1 MW receive funding of up to $0.80/watt, and IC engines and larger gas turbines receive up to $0.60/watt. Cogen systems can provide very good energy efficiency, typically operating from 60-85% total thermal efficiency, compared to less than 40% electric grid efficiency. The best utility scale power plants can achieve greater than 50% efficiency, but cannot utilize waste exhaust energy. Cogen systems provide greatest economic benefit with high run hours at design loads, so system sizing to facility requirements is essential.
Table 6-1: Commercially Available Cogeneration Engines
Engine Type
Applicable Capacity
Fuel
Example Manufacturers
General Comments
Gas Turbine 1-2 MW Natural Gas
Solar Kawasaki
Higher capital cost, lower maintenance cost
Reciprocating (piston) Engine
500kW-2MW
Natural Gas
Caterpillar Waukesha
Lower capital cost, higher maintenance cost. Slow speed (900 RPM) best for longevity and low maintenance cost
Microturbine 60kW 250kW
Natural Gas
Capstone Ingersoll Rand
Higher capital cost, lower maintenance cost.
All are fueled by natural gas and all achieve low emissions that meet or exceed federal, state and local requirements.
Application of Heat For all engine types, hot water production for use primarily in hot water fired absorption chilling is the best application on the Reservation. The hot water system could also drive the relatively small domestic

Augustine Reservation Energy Feasibility Study Page 22 l:\augustine - programs\doe app#1 2005 jan20_05\reports\augustinereservationfeasibilitystudy0129.doc
hot water and space heating loads. A cogeneration hot water system also lends itself to hybrid with a solar hot water system.
Central Plant or Individual Building Systems The existing Casino is well suited to cogeneration, with stable and predictable load with 24/7 operation. The projected Tribal Government Center will have typical office schedule load pattern, and retail space will have load hours of approximately 9am to 9 pm. The existing Casino and office space HVAC equipment was not planned with cogeneration in mind, but is somewhat adaptable to utilize central plant output. Ignoring future development or load growth on the Reservation, a cogeneration plant sized for approximately 500kW - 1MW would be reasonable to consider for the Casino. In this size range, a reciprocating engine would likely provide the best return on investment.
Central plant installation refers to construction of single cogeneration plant intended to serve the Casino, Government Center, the retail space, and possibly the restaurant and even the residential units. Central plant construction provides the greatest opportunity for efficient plant design and operation. The projected load of 2MW is best suited to a central plant. Smaller plants are proportionally less cost effective since efficiency drops and installation and operating costs rise as size decreases. Central plants typically require four pipe systems (hot supply and return, cold supply and return) distributed to each building they serve.
Individual small cogeneration systems at individual buildings are less cost effective, but examples of similar systems operating successfully exist throughout California. In these smaller applications, microturbines are being widely used. Capstone Turbine promotes their microturbines as state-of-the-art and has sold the greatest number of systems, with their first commercial systems shipped in 1998. Ingersoll Rand promotes their microturbines as based on proven industrial components, and has fewer installed systems, with first shipments in about 2000. IR is a large industrial equipment corporation and has the advantage of worldwide distribution and service capability. Capstone has the advantage of a large installed system base and singular microturbine focus. Other manufacturers have developed systems and exited the market after equipment problems or inadequate market.Cogeneration Conclusion
Cogeneration Conclusion Cogeneration will be included with other technologies to assess economic viability.
6.10 HYBRIDS OF PRECEDING TECHNOLOGIES Hybrids of the preceding technologies should be considered where shared installation cost savings can be achieved and complementary operation provides operating and economic efficiencies. Hot water producing (and consuming) systems are candidates for hybrid configuration, and would be most applicable in a central plant arrangement. Caution must be exercised in ensuring economics are the priority, not technical achievement. Table
Table 6-2: Hybrid Cogeneration/Absorption Chilling/Solar Hot Water
Subsystem Major Components
Products Common Components
Energy source
Cogeneration Generator, heat recovery boiler
Electricity, hot water
HW piping, pumps, storage
Natural gas

Augustine Reservation Energy Feasibility Study Page 23 l:\augustine - programs\doe app#1 2005 jan20_05\reports\augustinereservationfeasibilitystudy0129.doc
Solar hot water Collectors Hot water Solar thermal
Absorption Chiller (hot water fired)
Chiller, cooling tower
Chilled water Hot water
Boiler Boiler Hot water
tank
Natural gas
The term hybrid can also be used to refer to the techniques used to provide reliable operation of off-grid systems, such as combined photovoltaic and wind systems with battery storage. Such systems must account for periods when each sub-system is not producing power. Large scale off-grid systems are not recommended for the Reservation and are not the subject of this section.
Hybrid Conclusion While hybrid systems have potential to provide capital cost savings and to enhance economic performance of discrete systems, hybrid costing information is difficult to estimate. Hybrids will not be separately included in assessment of economic viability, but conclusions regarding hybrid systems will be drawn based on analysis results and experience.
7.0 ECONOMIC EVALUATION
8.0 RECOMMENDATIONS XXXXXXXXXXXXXX

APPENDIX A - ENERGY DEMAND AND CONSUMPTION PROJECTION: ASSUMPTIONS AND CALCULATIONS

Augustine Reservation Energy Feasibility Study Page A-1
Appendix A l:\augustine - programs\doe app#1 2005 jan20_05\reports\augustinereservationfeasibilitystudy0129.doc
Energy Demand and Consumption Projection: Assumptions and Calculations
Assumptions:
Consumption:
Residential (per household):
6800 kWh/year, growing at 0.4 % annually
Therms: 430, dropping 1.3% annually
Commercial:
16.6 kWh/sq. ft., growing at 0.5% annually
Therms: 0.37, holding steady
Street Lighting Calcs
Street Type
Street Width
Pole Height (Ft) Watts
SpacingMin (Ft)
SpacingMax (Ft)
Street
Length
Calc.
No. Poles
ActualNo. Poles
Total Watts
AverageDaily Hours Days
Annual kWh
Interior
3/4 Mile Local Res. 28-34 15 70 150 175 3960 22.6 23 1610 10 365 5876.5
Exterior
1 Mile
Minor Arterial 40-75 32 250 160 200 5280 26.4 27 6750 10 365 24637.5
Source: California Energy Demand, Staff Report, June 2000
Street Lighting Calculations
RV Park Calculations
Electric Demand Calculations
Electric Consumption Calculations
Cooling Tons Calculations

Augustine Reservation Energy Feasibility Study Page A-2
Appendix A l:\augustine - programs\doe app#1 2005 jan20_05\reports\augustinereservationfeasibilitystudy0129.doc
Gas Demand Calculations
Gas Consumption Calculations

Augustine Reservation Energy Feasibility Study Page B-1 l:\augustine - programs\doe app#1 2005 jan20_05\reports\augustinereservationfeasibilitystudy0129.doc
APPENDIX B – IID ELECTRIC RATE SCHEDULES, INTERCONNECTION REQUIREMENTS AND SERVICE AREA MAP
IID GL SCHEDULE

Augustine Reservation Energy Feasibility Study Page B-2 l:\augustine - programs\doe app#1 2005 jan20_05\reports\augustinereservationfeasibilitystudy0129.doc
IID NM SCHEDULE

Augustine Reservation Energy Feasibility Study Page B-3 l:\augustine - programs\doe app#1 2005 jan20_05\reports\augustinereservationfeasibilitystudy0129.doc
IID INTERCONNECTION AND NET ENERGY METERING REQUIREMENTS

Augustine Reservation Energy Feasibility Study Page B-4 l:\augustine - programs\doe app#1 2005 jan20_05\reports\augustinereservationfeasibilitystudy0129.doc

Augustine Reservation Energy Feasibility Study l:\augustine - programs\doe app#1 2005 jan20_05\reports\augustinereservationfeasibilitystudy0129.doc
APPENDIX C – WEATHER DATA FOR COACHELLA, CA
Month Avg. High
Avg. Low
Mean Avg. Precip
Record High
Record Low
Jan 71°F 39°F 55°F 0.72 in 92°F (1971) 17°F (1972)
Feb 76°F 43°F 60°F 0.63 in 100°F (1986) 20°F (1990)
Mar 81°F 48°F 65°F 0.43 in 102°F (1988) 26°F (1971)
Apr 88°F 55°F 72°F 0.06 in 110°F (1989) 32°F (1999)
May 95°F 62°F 79°F 0.06 in 116°F (1983) 41°F (1951)
Jun 104°F 69°F 87°F 0.02 in 122°F (1990) 53°F (1971)
Jul 108°F 75°F 91°F 0.19 in 126°F (1995) 57°F (1994)
Aug 106°F 75°F 90°F 0.37 in 121°F (1997) 52°F (1993)
Sep 101°F 68°F 85°F 0.41 in 123°F (1950) 48°F (1993)
Oct 90°F 57°F 73°F 0.14 in 114°F (1980) 28°F (1971)
Nov 78°F 44°F 61°F 0.21 in 98°F (1997) 24°F (1994)
Dec 71°F 37°F 54°F 0.29 in 93°F (1958) 14°F (1990)
Source: Weather.com

Augustine Reservation Energy Feasibility Study l:\augustine - programs\doe app#1 2005 jan20_05\reports\augustinereservationfeasibilitystudy0129.doc
APPENDIX D – GLOSSARY Biofuels: Liquid fuels and blending components produced from biomass (plant) feedstocks, used primarily for transportation.
Biomass: Organic nonfossil material of biological origin constituting a renewable energy source.
Biomass gas: A medium Btu gas containing methane and carbon dioxide, resulting from the action of microorganisms on organic materials such as a landfill.
British thermal unit: The quantity of heat required to raise the temperature of 1 pound of liquid water by 1 degree Fahrenheit at the temperature at which water has its greatest density (approximately 39 degrees Fahrenheit).
Btu: The abbreviation for British thermal unit(s).
Btu conversion factors: Btu conversion factors for site energy are as follows: Electricity ..... 3,412 Btu/kilowatthour Natural Gas ..... 1,031 Btu/cubic foot Fuel Oil No.1 ..... 135,000 Btu/gallon Kerosene ..... 135,000 Btu/gallon Fuel Oil No.2 ..... 138,690 Btu/gallon LPG (Propane) ..... 91,330 Btu/gallon Wood ..... 20 million Btu/cord
Cogeneration: The production of electrical energy and another form of useful energy (such as heat or steam) through the sequential use of energy.
Cogeneration system: A system using a common energy source to produce both electricity and steam for other uses, resulting in increased fuel efficiency.
Cogenerator: A generating facility that produces electricity and another form of useful thermal energy (such as heat or steam), used for industrial, commercial, heating, or cooling purposes. To receive status as a qualifying facility (QF) under the Public Utility Regulatory Policies Act (PURPA), the facility must produce electric energy and "another form of useful thermal energy through the sequential use of energy" and meet certain ownership, operating, and efficiency criteria established by the Federal Energy Regulatory Commission (FERC). (See the Code of Federal Regulations, Title 18, Part 292.)
Combined heat and power (CHP) plant: A plant designed to produce both heat and electricity from a single heat source. Note: This term is being used in place of the term "cogenerator" that was used by EIA in the past. CHP better describes the facilities because some of the plants included do not produce heat and power in a sequential fashion and, as a result, do not meet the legal definition of cogeneration specified in the Public Utility Regulatory Policies Act (PURPA).
Concentrating solar power or solar thermal power system: A solar energy conversion system characterized by the optical concentration of solar rays through an arrangement of mirrors to generate a high temperature working fluid. Also see Solar rough, Solar power tower, or Solar dish. Concentrating

Augustine Reservation Energy Feasibility Study l:\augustine - programs\doe app#1 2005 jan20_05\reports\augustinereservationfeasibilitystudy0129.doc
solar power (but not Solar thermal power) may also refer to a system that focuses solar rays on a photovoltaic cell to increase conversion efficiency.
Concentrator: A reflective or refractive device that focuses incident insolation onto an area smaller than the reflective or refractive surface, resulting in increased insolation at the point of focus.
Conservation and other DSM: This Demand-Side Management category represents the amount of consumer load reduction at the time of system peak due to utility programs that reduce consumer load during many hours of the year. Examples include utility rebate and shared savings activities for the installation of energy efficient appliances, lighting and electrical machinery, and weatherization materials. In addition, this category includes all other Demand-Side Management activities, such as thermal storage, time-of-use rates, fuel substitution, measurement and evaluation, and any other utility-administered Demand-Side Management activity designed to reduce demand and/or electricity use.
Demand-side management (DSM): The planning, implementation, and monitoring of utility activities designed to encourage consumers to modify patterns of electricity usage, including the timing and level of electricity demand. It refers to only energy and load-shape modifying activities that are undertaken in response to utility-administered programs. It does not refer to energy and load-shaped changes arising from the normal operation of the marketplace or from government-mandated energy-efficiency standards. Demand-Side Management covers the complete range of load-shape objectives, including strategic conservation and load management, as well as strategic load growth.
Demand charge: That portion of the consumer's bill for electric service based on the consumer's maximum electric capacity usage and calculated based on the billing demand charges under the applicable rate schedule.
Dependable capacity: The load-carrying ability of a station or system under adverse conditions for a specified period of time.
EIA: The Energy Information Administration. An independent agency within the U.S. Department of Energy that develops surveys, collects energy data, and analyzes and models energy issues. The Agency must meet the requests of Congress, other elements within the Department of Energy, Federal Energy Regulatory Commission, the Executive Branch, its own independent needs, and assist the general public, or other interest groups, without taking a policy position. See more information about EIA at http://www.eia.doe.gov/neic/aboutEIA/aboutus.htm
Electric energy: The ability of an electric current to produce work, heat, light, or other forms of energy. It is measured in kilowatthours.
Electric power: The rate at which electric energy is transferred. Electric power is measured by capacity and is commonly expressed in megawatts (MW).
Energy: The capacity for doing work as measured by the capability of doing work (potential energy) or the conversion of this capability to motion (kinetic energy). Energy has several forms, some of which are easily convertible and can be changed to another form useful for work. Most of the world's convertible energy comes from fossil fuels that are burned to produce heat that is then used as a transfer medium to mechanical or other means in order to accomplish tasks. Electrical energy is usually measured in kilowatthours, while heat energy is usually measured in British thermal units (Btu).

Augustine Reservation Energy Feasibility Study l:\augustine - programs\doe app#1 2005 jan20_05\reports\augustinereservationfeasibilitystudy0129.doc
Energy conservation features: This includes building shell conservation features, HVAC conservation features, lighting conservation features, any conservation features, and other conservation features incorporated by the building. However, this category does not include any demand-side management (DSM) program participation by the building. Any DSM program participation is included in the DSM Programs.
Energy efficiency: Refers to programs that are aimed at reducing the energy used by specific end-use devices and systems, typically without affecting the services provided. These programs reduce overall electricity consumption (reported in megawatthours), often without explicit consideration for the timing of program-induced savings. Such savings are generally achieved by substituting technically more advanced equipment to produce the same level of end-use services (e.g. lighting, heating, motor drive) with less electricity. Examples include high-efficiency appliances, efficient lighting programs, high-efficiency heating, ventilating and air conditioning (HVAC) systems or control modifications, efficient building design, advanced electric motor drives, and heat recovery systems.
Kilowatthour (kWh): A measure of electricity defined as a unit of work or energy, measured as 1 kilowatt (1,000 watts) of power expended for 1 hour. One kWh is equivalent to 3,412 Btu.
Kilowatt (kW): One thousand watts.
Kilowatt-electric (kWe): One thousand watts of electric capacity.
Passive solar heating: A solar heating system that uses no external mechanical power, such as pumps or blowers, to move the collected solar heat.
Photovoltaic and solar thermal energy (as used at electric utilities): Energy radiated by the sun as electromagnetic waves (electromagnetic radiation) that is converted at electric utilities into electricity by means of solar (photovoltaic) cells or concentrating (focusing) collectors.
Photovoltaic cell (PVC): An electronic device consisting of layers of semiconductor materials fabricated to form a junction (adjacent layers of materials with different electronic characteristics) and electrical contacts and being capable of converting incident light directly into electricity (direct current).
Photovoltaic module: An integrated assembly of interconnected photovoltaic cells designed to deliver a selected level of working voltage and current at its output terminals, packaged for protection against environmental degradation, and suited for incorporation in photovoltaic power systems.
Power: The rate at which energy is transferred. Electrical energy is usually measured in watts. Also used for a measurement of capacity.
Power (electrical): An electric measurement unit of power called a voltampere is equal to the product of 1 volt and 1 ampere. This is equivalent to 1 watt for a direct current system, and a unit of apparent power is separated into real and reactive power. Real power is the work-producing part of apparent power that measures the rate of supply of energy and is denoted as kilowatts (kW). Reactive power is the portion of apparent power that does no work and is referred to as kilovars; this type of power must be supplied to most types of magnetic equipment, such as motors, and is supplied by generator or by electrostatic equipment. Voltamperes are usually divided by 1,000 and called kilovoltamperes (kVA). Energy is denoted by the product of real power and the length of time utilized; this product is expressed as kilowathours.

Augustine Reservation Energy Feasibility Study l:\augustine - programs\doe app#1 2005 jan20_05\reports\augustinereservationfeasibilitystudy0129.doc
Watt (W): The unit of electrical power equal to one ampere under a pressure of one volt. A Watt is equal to 1/746 horsepower.

Augustine Reservation Energy Feasibility Study l:\augustine - programs\doe app#1 2005 jan20_05\reports\augustinereservationfeasibilitystudy0129.doc
APPENDIX E – PHOTOVOLTAICS: GENERAL INFORMATION FROM USDOE TRIBAL ENERGY CENTER
Solar Cells and Photovoltaic Arrays Solar cells convert sunlight directly into electricity and are made of semiconducting materials similar to those used in computer chips. When sunlight is absorbed by these materials, the solar energy knocks electrons loose from their atoms, allowing the electrons to flow through the material to produce electricity. This process of converting light (photons) to electricity (voltage) is called the photovoltaic effect. A typical solar cell measures 10 centimeters by 10 centimeters (about 4 inches square) and generates about 1 Watt of power at about 0.5 volts.
Individual solar cells can be connected in series in order to increase the voltage, or in parallel in order to increase the current into a module. Solar cells are typically combined into modules that hold about 40 cells, and about 10 of these modules are mounted in a photovoltaic (PV) array that can measure up to several meters on a side. These PV arrays can be mounted at a fixed angle facing south, or they can be mounted on a tracking device that follows the sun, allowing them to capture the most sunlight over the course of a day. About 10 to 20 PV arrays can provide enough power for a typical U.S. household, although some tribal residences may use less power. PV arrays can also be used for large electric utility or industrial applications. Hundreds of arrays can be interconnected to form a
single, large PV system.
A typical solar cell
Installing a PV array on a building
PV systems have few moving parts and are highly reliable. In fact, many PV arrays come with warranties that are good for 20 years or more. Flat-plate PV arrays without tracking have no moving parts, and even two-axis tracking requires only a relatively small number of low-speed moving parts. This tends to keep operation and maintenance (O&M) costs down. Indeed, some early kilowatt-scale first-of-a-kind plants demonstrated O&M costs around half a cent per kilowatt-hour, which is minimal.
In many PV systems, energy will not be used as it is produced but may be required at night or on cloudy days. If tapping into the utility grid is not an option, a battery backup system will be necessary. About 80% of the energy channeled into the battery backup can be reclaimed. Like PV cells, batteries are direct-current devices and are directly compatible only with dc loads. However, batteries can also serve as a power conditioner for these loads by regulating power; this allows the PV array to operate closer to its optimum power output. Most batteries must also be protected from overcharge and excessive discharge, which can cause electrolyte loss and can even damage or ruin the battery plates. Protection is usually achieved using a charge controller, which also maintains system voltage. Most charge controllers also have a mechanism that prevents current from flowing from the battery back into the array at night.

Augustine Reservation Energy Feasibility Study l:\augustine - programs\doe app#1 2005 jan20_05\reports\augustinereservationfeasibilitystudy0129.doc
Photovoltaic Materials Crystalline silicon (c-Si) is the leading commercial material for photovoltaic cells, and is used in several forms: single-crystalline or monocrystalline silicon, multicrystalline or polycrystalline silicon, ribbon and sheet silicon and thin-layer silicon. Crystalline and flexible thin-film solar cells
Thin film PV cells use layers of semiconductor materials only a few micrometers thick, attached to an inexpensive backing such as glass, flexible plastic, or stainless steel. Semiconductor materials for use in thin films include amorphous silicon (a-Si), copper indium diselenide (CIS), and cadmium telluride (CdTe). Amorphous silicon has no crystal structure and is gradually degraded by exposure to light, although certain processing techniques can reduce this effect. Because the quantity of semiconductor material required for thin films is far smaller than for traditional PV cells, the cost of thin film manufacturing is far less than for crystalline silicon solar cells, but thin-film solar modules also produce less power than crystalline-silicon solar modules. For these reasons, a one-kilowatt thin-film PV system will be larger than a one-kilowatt crystalline-silicon PV system, but the two systems may be competitively priced.
Cystalline and flexible thin-film solar cell
Building-Integrated Photovoltaics (BIPV)
Building-integrated solar electric systems produce electrical power from sunlight and are also an integral part of the building. One advantage of incorporating solar electric materials into a roof, skylight, or awning is that it can reduce the cost of the system. Blending solar electric features into the structure of a building takes advantage of high reliability and reduces the overall cost of the system because the solar components perform two functions-they replace traditional building materials such as tile, brick, or glass and they generate electricity-while also taking advantage of the existing structural elements of the building.
Building-integrated solar electric systems combine function
with aesthetics.

Augustine Reservation Energy Feasibility Study l:\augustine - programs\doe app#1 2005 jan20_05\reports\augustinereservationfeasibilitystudy0129.doc
Another advantage of blending solar with traditional building materials is aesthetics. Some building owners believe they can't use solar because it isn't compatible with traditional architecture. Because solar modules now come in a variety of styles, colors, and sizes, it's possible to integrate solar modules into almost any structural design. For example, buildings with standing-seam metal roofs can use solar module material referred to as "thin film" that can be rolled out inside the standing seams. Commercial or residential buildings with traditional roof shingles can use solar modules that resemble traditional roof shingles. Solar panels can also be rolled out onto a flat surface to cover a porch or awning, and more traditional panels can be used as the porch cover itself. Solar modules can also be used inside glass or other transparent material to provide additional daylight to the building's interior. Some businesses are now using solar panels to cover their parking
lots to provide shade for customer vehicles. As long as the basic principles are followed so that panels are orientated to the south without obstructions from other building parts or landscaping, today's solar materials offer a variety of possibilities for building integration.
Solar electric panels can be integrated into roofing materials, providing a functional, attractive
roof that also generates electricity (the home on the right has a PV roof).
Concentrating Photovoltaic Systems Some photovoltaic (PV) cells are designed to convert a high percentage of sunlight into electricity when they are exposed to concentrated sunlight. These cells are typically mounted in a "concentrator" that uses an inexpensive plastic lens or reflective surfaces to focus sunlight onto a cell at up to 1000 times the normal strength of sunlight, referred to as "1000 suns."
Concentrating PV systems benefit from the cost savings of using less solar cell material per kilowatt, since each solar cell produces much more power than a typical solar cell. However, they also require sophisticated tracking systems to keep them pointed at the sun, and only work well in areas with plentiful direct sunlight. Unlike flat-plate solar modules, concentrating systems won't work well in cloudy
climates. Because of the sophistication of the tracking system, concentrating PV systems are usually used in large commercial or industrial settings, although they could provide power to a local community or small town.
Concentrating PV systems use inexpensive lenses to focus
ght onto solar celsunli ls.
Concentrating PV systems use inexpensive lenses to focus sunlight
onto solar cells.
Cost-Effective Photovoltaic Applications The most cost-effective photovoltaic (PV) applications are for small loads such as emergency call boxes, irrigation controls and sign lighting. Other cost-effective PV applications include water pumping or general residential use that avoids line extension or the use of remote diesel generators. In some cases, PV systems may be the best way to bring power to remote villages.
Line extensions often cost $20,000 or more per mile, so if parts of your tribal lands are far from the electrical grid, a PV system may be the most cost-effective way to bring power there. Keep in mind that line extensions involve a high initial cost with poor cost recovery (due to the small load that the line may serve), require a lot of time to install, and usually have to subsidized. PV systems also involve high initial

Augustine Reservation Energy Feasibility Study l:\augustine - programs\doe app#1 2005 jan20_05\reports\augustinereservationfeasibilitystudy0129.doc
costs, but they can be installed quickly and they are often cheaper than cost of the line extension, and require no fuel to operate.
Also, if your tribe trucks in fuel to remote areas of the tribal lands, the delivered cost of that fuel may be very high (including the driver's time and the cost of the fuel for the truck), so a PV system that at least reduces the amount of fuel used at a remote site can be cost-effective, while also reducing noise and pollution from the engine/generator alternative.
Reducing Electrical Loads with Photovoltaic Systems In grid-connected systems, solar energy has the advantage of being available during the times when electricity use is greatest. That means that photovoltaic solar electric systems may be used to reduce your tribe's peak electric loads and, in many parts of the United States, can also contribute to meeting utility peak loads, as depicted in the maps.
Energy produced each year, in kilowatt-hours, for a one-kilowatt photovoltaic solar electric system
Effective load-carrying capacity of a photovoltaic solar electric system, based on comparing solar electric power output with utility electrical load profiles over the course of each day throughout the year.

Augustine Reservation Energy Feasibility Study l:\augustine - programs\doe app#1 2005 jan20_05\reports\augustinereservationfeasibilitystudy0129.doc
Photovoltaic System Configurations
Photovoltaic (PV) solar power systems can be put together in a number of ways, ranging from simple to complex, depending on their use. The systems can produce either direct-current (DC) just like a battery, or can convert that current into alternating current (AC), as is used in most households. The main configurations are as follows: DC Direct-Drive PV Systems— For off-grid DC loads that can use intermittent power DC PV Systems with Battery Storage—For DC loads that need a steady power supply Off-Grid AC PV Systems—For off-grid households and other AC applications. These systems also incorporate batteries. Utility-Connected AC PV Systems—For displacing power that would otherwise be purchased from a utility, using the power grid as a backup source, or selling power to the grid.
A simple DC direct-drive system that pumps water for cattle
DC Direct-Drive PV Systems Some applications, such as water pumping for cattle or irrigation, can run on DC power and achieve their purpose while operating only part of the time. These applications use a PV array connected directly to a pump, which feeds a water tank or trough. The system must be sized to ensure that the water in storage doesn't run dry during extended periods of cloudy weather (unless the need for water is also reduced during cloudy weather). A simple controller can regulate the voltage supply to the pump and shut the pump off when the water storage tank is full.
DC System with Battery Storage
DC PV Systems with Battery Storage Many applications can use DC power, but require a steady power supply. Lighting applications are a good example — these systems are often used for flashing warning lights. The systems require a controller to govern the flow of electricity to and from the batteries while maintaining a steady flow of power to the application. Note that using energy-efficient lighting will greatly reduce the cost of the PV system.
Solar lighting in the PJKK federal building parking lot
A good example of a DC PV system with battery storage is found outside the Prince Jonah Kuhio Kalanianiole (PJKK) federal building in Hawaii. DC PV systems are installed on top of the parking lot light poles, using two 48-watt solar panels per lamp and a 90 amp-hour battery to provide 12 hours of power per night to two 30-watt fluorescent lamps that produce 2,500 lumens each.
Small individual DC systems have many applications, such as providing power for home systems, public area lighting, schools, health clinics, pumping water and water purification, as well as rural telephony and micro-enterprise development.

Augustine Reservation Energy Feasibility Study l:\augustine - programs\doe app#1 2005 jan20_05\reports\augustinereservationfeasibilitystudy0129.doc
Off-Grid AC PV Systems Many electrical appliances require AC power. To power a typical off-grid household, most people prefer to use a standard AC wiring system and AC appliances, which means
that the power system must produce AC power. For PV systems, that means that an inverter must be used to convert the DC power into AC. A typical off-grid AC PV system includes the PV modules, a bank of batteries, a controller, and an inverter.
Solar home lighting in Brazil
A solar-powered water pumping station for
irrigation
A Typical Inverter
Grid-Connected PV System In most buildings that have access to the electrical grid, the preferred configuration is to connect the PV system directly into the building wiring on the customer's side of the meter. In this configuration, the PV system can be used to supplement the grid during the day while the grid meets the building's power needs at night. And if the PV system produces more power during the day than is needed, the excess power can be fed back into the power grid, turning the meter backwards! In many states, the building owner can earn credit on the power bill for any power fed back into the grid — a concept known as net metering.
An off-gird AC solar power system

Augustine Reservation Energy Feasibility Study l:\augustine - programs\doe app#1 2005 jan20_05\reports\augustinereservationfeasibilitystudy0129.doc
Grid-connected systems save money by eliminating the use of battery banks. Instead, the inverter controls the flow of power between the PV system, the building (or other AC load), and the power grid. These units typically include safety features to disconnect the system from the grid in the event of a power failure on the gird, in order to avoid powering lines on which utility crews are working. However, some utilities also require outside disconnect switches, extra meters, and other equipment. The disadvantage of removing the batteries is if the utility goes down, so does your own power system.
Example of a utility-connected PV system
The Presidio Thoreau Center is an excellent example of a utility-connected PV system and has integrated a 1.25-kilowatt PV array into the skylights over the building's atrium. Spaces between the PV cells allow daylight into the atrium.
The Presidio Thoreau Center atrium from above and below.

Augustine Reservation Energy Feasibility Study l:\augustine - programs\doe app#1 2005 jan20_05\reports\augustinereservationfeasibilitystudy0129.doc
Designing a Photovoltaic System
Designing a Photovoltaic System To design a photovoltaic (PV) solar power system, it is important to estimate or measure the load and to obtain the best solar resource data available.
An excellent place to start is PVWATTS, a Web-based performance calculator for grid-connected photovoltaic systems that can be used for locations throughout the United States. This calculator was developed to permit non-experts to quickly obtain performance estimates for grid-connected photovoltaic systems.
One of the tools used within this calculator is a Solar Atlas data map. The Solar Atlas data map allows the user to select a region of interest in order to calculate the solar resource potential for that area. PVWATTS also allows the user to input user-specified PV system and cost of electricity data. The output is monthly energy production and value from the PV system for the specified region. See the Solar Resource section for more solar resource information.
PV design tools are available to assist in sizing and configuring the system; choosing between on-grid and off-grid configurations; estimating the power output; analyzing the building energy needs; modeling shading, temperature, and thermal performance; performing an economic analysis; calculating emissions benefits, estimating seasonal weather impacts, and comparing the available PV modules. Typical software tools include PVSYST, PV DESIGN PRO, WATSUN PV, PV CAD, PV FORM, BLCC, HOMER, ENERGY-10, and AWNSHADE. Some tools are available for free but most require a user feel.
Information about these and other design tools are available on the following Web sites:
• DOE Building Energy Software Tools Directory: Energy Simulation Tools
• UCLA Schools of Arts and Architecture: Energy Tools Design Directory

Augustine Reservation Energy Feasibility Study l:\augustine - programs\doe app#1 2005 jan20_05\reports\augustinereservationfeasibilitystudy0129.doc
APPENDIX F – NET METERING FAQ (HOME POWER MAGAZINE)
Net Metering: Questions and Answers
Q. What is net metering?
A. In most states, consumers can install small, grid-connected renewable energy systems to reduce their electricity bills using a protocol called net metering. Under net metering, electricity produced by the renewable energy system can flow into the utility grid, spinning the existing electricity meter backwards. Other than the renewable energy system, no special equipment is needed. Even in the absence of net metering, consumers can use the electricity they produce to offset their electricity demand on an instantaneous basis. But if the consumer happens to produce any excess electricity (beyond what is needed to meet the customer's own needs at the moment), the utility purchases that excess electricity at the wholesale or 'avoided cost' price, which is much lower than the retail price. Net metering simplifies this arrangement by allowing the consumer to use any excess electricity to offset electricity used at other times during the billing period.
Q. Why is net metering important?
A. There are three reasons net metering is important. First, as increasing numbers of primarily residential customers install renewable energy systems in their homes, there needs to be a simple, standardized protocol for connecting their systems into the electricity grid that ensures safety and power quality. Second, many residential customers are not at home using electricity during the day when their systems are producing power, and net metering allows them to receive full value for the electricity they produce without installing expensive battery storage systems. Third, net metering provides a simple, inexpensive, and easily-administered mechanism for encouraging the use of renewable energy systems, which provide important local, national, and global benefits.
Q. What are the benefits and costs of net metering?
A. Net metering provides a variety of benefits for both utilities and consumers. Utilities benefit by avoiding the administrative and accounting costs of metering and purchasing the small amounts of excess electricity produced by these small-scale renewable generating facilities. Consumers benefit by getting greater value for some of the electricity they generate, by being able to interconnect with the utility using their existing utility meter, and by being able to interconnect using widely-accepted technical standards. The only cost associated with net metering is indirect: the customer is buying less electricity from the utility, which means the utility is collecting less revenue from the customer. That's because any excess electricity that would have been sold to the utility at the wholesale or 'avoided cost' price is instead being used to offset electricity the customer would have purchased at the retail price. In most cases, the revenue loss is comparable to having the customer reducing electricity use by investing in energy efficiency measures, such as compact fluorescent lights and efficient appliances. The bill savings for the customer (and corresponding revenue loss to the utility) will depend on a variety of factors, particularly the difference between the 'avoided cost' and retail prices. In general, however, the difference will be between $5 - $10 a month for a residential-scale photovoltaic (PV) system (2 kW), and between $25 - $50 a month for a farm-scale wind turbine (10 kW).
Moreover, any revenue losses associated with net metering are at least partially offset by the administrative and accounting savings, which are not included in the above figures.

Augustine Reservation Energy Feasibility Study l:\augustine - programs\doe app#1 2005 jan20_05\reports\augustinereservationfeasibilitystudy0129.doc
Q. Can I really use my existing meter to take advantage of net metering?
A. The standard kilowatt-hour meter used by the vast majority of residential and small commercial customers accurately registers the flow of electricity in either direction. This means the 'netting' process associated with net metering happens automatically-the meter spins forward (in the normal direction) when the consumer needs more electricity than is being produced, and spins backward when the consumer is producing more electricity than is needed in the house or building.
Q. How can I be sure that these small-scale generating systems are safe?
A. During the last decade there has been tremendous technological progress in the design of the equipment that integrates small-scale generators with the utility grid. Called 'inverters' because they were originally designed only to 'invert' the DC electricity produced by solar arrays and wind turbines to the AC electricity used in our homes and businesses, these devices have evolved into extremely sophisticated power management systems. Inverters now include all the necessary protective relays and circuit breakers needed to synchronize safely and reliably with the utility grid, and to prevent 'islanding' by automatically shutting down when the utility grid suffers an outage. Moreover, this protective equipment operates automatically, without any human intervention needed. Most new inverters comply with all nationally-recognized codes and standards, including the National Electrical Code (NEC), Underwriters Laboratories (UL), and the Institute of Electrical and Electronic Engineers (IEEE). These systems are now operating safely and reliably in every state in the nation.
Q. What is the current status of net metering?
A. Currently, many states have some form of net metering (see accompanying table). Germany, Japan, and Switzerland also have net metering. Many state net metering rules were enacted by state utility regulators pursuant to state implementation of the federal PURPA statute. In recent years many states have enacted net metering laws legislatively..

Augustine Reservation Energy Feasibility Study l:\augustine - programs\doe app#1 2005 jan20_05\reports\augustinereservationfeasibilitystudy0129.doc
APPENDIX G – CALIFORNIA SOLAR RESOURCES
The sun is a direct source of energy — as anyone who has gotten a sunburn can attest. Using renewable energy technologies can convert that solar energy into electricity, heating, and even cooling. But solar energy varies by location and by the time of year.
To give you a general idea of what solar resources are in your state, we are providing maps of the yearly average. The solar resources are expressed in watt-hours per square meter per day (Wh/m2/day). Think of that as roughly a measure of how much energy falls on a square yard over the course of an average day.
These maps show the total solar energy falling on the Earth. Different solar technologies will convert that energy in different ways, and not all of that can be converted directly into useful energy. For reference, we will give you examples of what your state's resource means in terms of producing electricity.
It is interesting to remember that solar resources are greatest in the middle of the day — the same time that utility customers have the highest demand, especially during the summer months.
California Solar Resource
Flat-Plate Collector
Flat-plate solar systems are, simply put, flat panels that collect sunlight and convert it to either electricity or heat. These technologies include photovoltaic (PV) arrays and solar water heaters. This map shows how much solar radiation reaches a flat-plate collector which is installed in a tilted position, for example, on a roof. A general rule of thumb is that a flat-plate collector gets the most sun if it is tilted towards the south at an angle equal to the latitude of the location.
What does the map mean? Mainly, it means that, for flat-plate collectors, California has very good solar resources, and the entire state can effectively use these technologies. The southern portion of the state has particularly good resources. Let's say you installed a PV array with a collector area equal to the size of a football field. In one of

Augustine Reservation Energy Feasibility Study l:\augustine - programs\doe app#1 2005 jan20_05\reports\augustinereservationfeasibilitystudy0129.doc
your state's better locations, you would produce around 1,248,000 kWh per year. This is enough to power 125.2 average homes.
Because of their simplicity, flat-plate collectors are often used for residential and commercial building applications. They can also be used in large arrays for utility applications.
Solar Concentrator
Solar concentrators are typically mounted on tracking systems in order to always face the sun. This allows these collectors to capture the maximum amount of direct solar rays. The solar resource for concentrators varies much more across the United States than the flat-plate solar resource. Most northern states cannot use solar concentrators effectively, but this resource is even greater than the flat-plate resource in some areas of the southwestern United States.
The map shows that, for concentrating collectors, California has a widely varying resource. The southern portion of the state has some of the nation's best resources, but the far northwest would not be able to use many of these technologies. How much power would a concentrating system produce? Let's look at a solar trough electricity system with a collector area of 200,000 square meters — a system that would cover roughly 150 acres. In the state's best areas, this system would produce about 71,175,000 kWh per year — enough to power 7,143 homes.
Because these systems require tracking mechanisms, solar concentrators are generally used for large-scale applications such as utility or industrial use. But they can also be used in small-scale applications, including remote power applications.

Augustine Reservation Energy Feasibility Study l:\augustine - programs\doe app#1 2005 jan20_05\reports\augustinereservationfeasibilitystudy0129.doc
APPENDIX H – INCENTIVE FUNDING INFORMATION
California Incentives for Renewable Energy
Self-Generation Incentive Program (SGIP)
Last DSIRE Review: 01/13/2005
Incentive Type: State Rebate Program
Eligible Technologies: Photovoltaics, Wind, Fuel Cells, Cogeneration, Other Distributed Generation Technologies
Applicable Sectors: Commercial, Industrial, Residential
Rebate: Between $1.00/watt and $4.50/watt depending on technology and fuel
Max. Limit: Maximum system size = 5 MW; incentive payment is capped at 1 MW
Authority 1: Assembly Bill 970 (2001)
Date Enacted: 3/27/01
Expiration Date: 12/31/04
Authority 2: Assembly Bill 1685 (2003)
Date Enacted: 10/12/03
Expiration Date: 1/1/08
Summary:
On March 27, 2001, the California Public Utilities Commission (CPUC) announced new incentive programs to encourage residential and commercial electricity customers to install grid-tied renewables and clean distributed-generation (DG) systems. The Self-Generation Incentive Program (SGIP) offers incentives to encourage customers to produce electricity with microturbines, small gas turbines, wind turbines, photovoltaics (PV), fuel cells and internal combustion engines. The incentive payments range from $1/W - $4.50/W, depending on the type of system, and will be funded through the end of 2007. AB 1685 of 2003 provided funding of approximately $500 million and extended the program expiration date from December 31, 2004, to January 1, 2008. The bill also expanded some program requirements, as well as the defintions of "ultra clean" and "low-emission" DG. On December 16, 2004, the CPUC approved a decision adopting a number of important modifications to the SGIP. The decision includes the following provisions:
1. A new incentive structure and payment amounts eliminated the percentage of project-cost cap (effective for all projects not already holding an approved conditional reservation on the date of the decision).

Augustine Reservation Energy Feasibility Study l:\augustine - programs\doe app#1 2005 jan20_05\reports\augustinereservationfeasibilitystudy0129.doc
2. The SGIP rebate will be considered the "last rebate" applied in cases where other incentives will be obtained. Projects receiving incentives based on future performance of the system are not eligible to receive a SGIP rebate.
3. The maximum eligible system size was increased to 5 MW, although the incentive payment remains capped at 1 MW.
4. The annual maximum Corporate/Government Parent limit per service territory was increased from 1 MW to 4 MW. (This provision is subject to clarification by the CPUC).
5. Recommendations for an exit strategy and a declining rebate schedule recommendation will be developed with public input.
6. The SGIP procedures and rules handbook will be modified to (a) address the certification of projects to meet new emission standards required by AB 1685, (b) eliminate the requirement that proponents of projects reapply for incentives in the subsequent funding cycle, and (c) include procedural or financial mechanisms to deter inappropriate reservation requests.
Click here to view an announcement of these changes and answers to frequently asked questions. The December 2004 CPUC decision is not clear concerning the new incentive amounts granted for several technology categories. The SGIP Working Group has requested clarification from the CPUC. In the meantime, the following technologies and corresponding incentive amounts apply:
• PV (Level 1) - $3.50/W
• Fuel cells using renewable fuels (Level 1) - $4.50/W
• Fuel cells using non-renewable fuels (Level 2) - $2.50/W PG&E, SCE, and SoCal Gas will administer the incentive program in their service territories, and the San Diego Regional Energy Office will administer the program in SDG&E's territory. Customers of PG&E, SDG&E, SCE and SoCal Gas should contact their program administrator for an application, program handbook and additional eligibility information. Program Administrator Contact Information: Pacific Gas & Electric (PG&E) Web: www.pge.com/selfgen Phone: 415-973-6436 Email: [email protected] Fax: (415) 973-2510 Mailing Address: Self-Generation Incentive Program P.O. Box 770000 Mail Code B27P San Francisco, CA 94177-001 San Diego Regional Energy Office (administrator for San Diego Gas & Electric, or SDG&E)

Augustine Reservation Energy Feasibility Study l:\augustine - programs\doe app#1 2005 jan20_05\reports\augustinereservationfeasibilitystudy0129.doc
Web: www.selfgen.sdenergy.org Contact: Nathalie Osborn, Program Manager Phone: (858) 244-1193 Phone 1-866-SDENERGY Fax: (858) 244-1178 Email: [email protected] Address: San Diego Regional Energy Office Attn: SELFGEN Program Manager 8520 Tech Way Suite 110 San Diego, CA 92123 Southern California Edison (SCE) Web: www.sce.com/sgip Phone: 1-800-736-4777 or (626) 302-8436 Fax: (626) 302-6253 Email: [email protected] Address: Program Manager Self-Generation Incentive Program Southern California Edison 2131 Walnut Grove Avenue, 3rd Floor, B 10 Rosemead, California 91770 Southern California Gas Company (SoCalGas) Web: www.socalgas.com/business/selfgen Phone: 1-866-347-3228 Email: [email protected] Fax: (213) 244-8222 Address: Self-Generation Incentive Program Administrator Southern California Gas Company 555 West Fifth Street, GT22H4 Los Angeles, CA 90013-1011
Contact:
Valerie Beck
California Public Utilities Commission
Energy Division
State Building
350 McAllister Street
San Francisco, CA 94102
Phone: (415) 703-2125
E-Mail: [email protected]
Web site: http://www.cpuc.ca.gov

Augustine Reservation Energy Feasibility Study l:\augustine - programs\doe app#1 2005 jan20_05\reports\augustinereservationfeasibilitystudy0129.doc
APPENDIX I – CALIFORNIA PROPERTY TAX EXEMPTION FOR SOLAR SYSTEMS
Last DSIRE Review: 01/12/2005
Incentive Type: Property Tax Exemption
Eligible Technologies: Solar Water Heat, Solar Space Heat, Solar Thermal Electric, Solar Thermal Process Heat, Photovoltaics, Solar Mechanical Energy
Applicable Sectors: Commercial, Industrial, Residential
Amount: 100% of project value
Max. Limit: No limit
Authority 1: CA Revenue and Taxation Code, Section 73
Date Enacted: 1/1/99
Expiration Date: 12/31/05
Summary:
According to the California Revenue and Taxation Code, section 73, when assessing property for property tax purposes, active solar energy systems installed between January 1, 1999 and January 1, 2006 are not subject to property taxes. Active solar energy system means a system that uses solar devices, which are thermally isolated from living space or any other area where the energy is used, to provide for the collection, storage, or distribution of solar energy. Active solar energy system does not include solar swimming pool heaters or hot tub heaters. Active solar energy systems may be used for any of the following: domestic, recreational, therapeutic, or service water heating; space conditioning; production of electricity; process heat; and solar mechanical energy Contact your county assessor to claim the exemption if you believe that your qualifying solar energy system has been subjected to property tax.
Contact:
Tax Specialist - BOE
California State Board of Equalization
P.O. Box 942879
Sacramento, CA 94279-0090
Phone: (800) 400-7115
Web site: http://www.boe.ca.gov

Augustine Reservation Energy Feasibility Study l:\augustine - programs\doe app#1 2005 jan20_05\reports\augustinereservationfeasibilitystudy0129.doc
APPENDIX J – SOLAR OR WIND ENERGY SYSTEM CREDIT - CORPORATE
Last DSIRE Review: 08/24/2004
Incentive Type: Corporate Tax Credit
Eligible Technologies: Photovoltaics, Wind
Applicable Sectors: Commercial, Industrial
Amount: 7.5%, or $4.50 per watt of rated peak generating capacity, whichever is less
Terms: 7-year carry forward
Website: http://www.consumerenergycenter.org/ renewable/tax_credit.html
Authority 1: California Revenue & Taxation Code § 23684
Date Enacted: 10/8/01
Effective Date: 1/1/01
Expiration Date: 1/1/06
Summary:
California's Solar or Wind Energy System Credit (SB17x2) was approved by the Governor on October 8, 2001. The law provides personal and corporate income tax credits for the purchase and installation of photovoltaic or wind driven systems with a peak generating capacity of up to 200 kilowatts. After January 1, 2004 and before January 1, 2006, the tax credit is equal to 7.5% of the net installed system cost after deducting the value of any municipal, state, or federal sponsored financial incentives, or $4.50 per watt of rated peak generating capacity, whichever is less. A 15% tax credit was available Jan 1, 2001 - Dec 31, 2003. The California Franchise Tax Board (FTB) administers the program in consultation with the California Energy Commission (Commission). The solar or wind system must be certified by the Commission. A five-year warranty is required of each system. Taxpayers claiming the credit cannot sell the electricity produced by the system, but may utilize California’s net metering law, if eligible. California form FTB 3508 must be completed and attached to your California tax return. The Solar or Wind Energy System Credit Worksheet can be used to determine the tax credit amount. These form are available on the Commission's Website, which may be accessed by clicking on the Website listed above.
Contact:
Tax Specialist - FTB
California Franchise Tax Board
PO Box 942840

Augustine Reservation Energy Feasibility Study l:\augustine - programs\doe app#1 2005 jan20_05\reports\augustinereservationfeasibilitystudy0129.doc
Sacramento, CA 94240-0040
Phone: (800) 852-5711
Phone 2: (916) 845-6500
Web site: http://www.ftb.ca.gov/
Information Specialist - CEC
California Energy Commission
Renewable Energy Program
1516 Ninth Street, MS-45
Sacramento, CA 95814
Phone: (800) 555-7794
Phone 2: (916) 654-4058
Fax: (916) 653-2543
E-Mail: [email protected]
Web site: http://www.consumerenergycenter.org

Augustine Reservation Energy Feasibility Study l:\augustine - programs\doe app#1 2005 jan20_05\reports\augustinereservationfeasibilitystudy0129.doc
APPENDIX K – NET METERING Last DSIRE Review: 11/23/2004
Incentive Type: Net Metering Rules
Eligible Technologies: Photovoltaics, Landfill Gas, Wind, Fuel Cells, Anaerobic Digestion
Applicable Sectors: Commercial, Industrial, Residential
Limit on System Size: 1 MW
Limit on Overall Enrollment: One-half of one percent of a utility's peak demand
Treatment of Net Excess: Granted to utility annually
Utilities Involved: IOUs; Municipal utilities are allowed to permit either net metering or co-metering
Website: http://www.consumerenergycenter.org/ erprebate/net_metering.html
Authority 1: AB 58 in 9/02
Date Enacted: 1/1/96; amended 1998, 2000, 2001, 2002
Authority 2: California Public Utility Code 2827, as amended, including AB 29X in 4/01
Authority 3: AB 1214 (2003)
Summary:
California's net metering law requires that all three of California’s investor-owned electric utilities (PG&E, SCE, and SDG&E), and rural cooperatives, allow net metering for all customer classes for systems up to 1,000 kW (1 MW). Municipal utilities are allowed to permit either net-metering or co-metering, and both the Los Angeles Department of Water and Power, the largest municipal utility in the nation, and the Sacramento Municipal Utility District (SMUD) offer net metering. Eligible systems include solar electric and wind facilities, or a hybrid system of both. In addition, Assembly Bill 2228, signed by the Governor in September 2002, provides that biogas electrical customer-generated facilities up to 1 MW are eligible for net metering until January 1, 2006, under a pilot program. The pilot program limits biogas digester generation to 5 MW per energy service provider service territory; that is, each of the three major IOUs must only offer net metering to the first 5 MW of digester systems. Additionally, the new law provides for retail cost recovery of revenue loss from net-metered digesters. The 2002 net metering amendments (AB 58) also: (a) limit the total amount of net metering to one-half of one percent (0.5%) of a utility's peak demand; (b) exempt net metering from "exit fees" or "departing load fees"; © prohibit inter-class cost shifting that results from net metering; (d) allow municipal utilities to permit either net-metering or co-metering, which credits customers for generation on a "time-of-use" basis for the generation value of their production; (e) require the California Energy Commission to establish a separate rebate for public sector affordable housing projects of up to 75% of total installed costs for these projects; (f) establish that the Treasurer should consider net metering and co-metering projects as sustainable

Augustine Reservation Energy Feasibility Study l:\augustine - programs\doe app#1 2005 jan20_05\reports\augustinereservationfeasibilitystudy0129.doc
building methods or distributed energy technologies for purposes of evaluating low-income housing projects; (g) grandfather in projects permitted prior to December 31, 2002, and completed before September 30, 2003; (h) permit wind energy projects up to 50 kW to net meter; and (i) require wind energy projects from 50 kW up to 1 MW to utilize "wind energy co-metering" which provides for time-of-use pricing and credits. AB 1214, enacted in October 2003, added fuel cells to the list of technologies eligible for net metering until the total cumulative rated generating fuel cell capacity reaches 45 megawatts within the service territory for an electrical corporation with a peak demand above 10,000 megawatts, or until the capacity reaches 22.5 megawatts within the service territory of for an electrical corporation with a peak demand of 10,000 megawatts or below. The maximum total capacity throughout all service territories is limited to 112.5 megawatts. This provision expires January 1, 2006. Net metering customers are allowed to carry forward kWh credits for up to 12 months. Any net excess generation at the end of each 12-month period is granted to the utility. Customers subject to time-of-use rates are entitled to deliver electricity back to the system for the same time-of-use (including real-time) price that they pay for power purchases. However, TOU customers choosing to net meter must pay for the metering equipment capable of making such measurements. California does not allow any new or additional demand charge, standby charge, customer charge, minimum monthly charge, interconnection charge, or other charge that would increase an eligible customer-generator's costs beyond those of other customers in the rate class to which the eligible customer-generator would otherwise be assigned. The CPUC has explicitly ruled that technologies eligible for net metering (up to 1 MW) are exempt from interconnection applications fees, as well as from initial and supplemental interconnection review fees.

Augustine Reservation Energy Feasibility Study l:\augustine - programs\doe app#1 2005 jan20_05\reports\augustinereservationfeasibilitystudy0129.doc
APPENDIX L – PVWATTS OUTPUT
Station Identification
City Los Angeles
State: CA
Latitude: 33.93° N
Longitude: 118.40° W
Elevation: 32 m
PV System Specifications
AC Rating: 250.0 kW
Array Type: Fixed Tilt
Array Tilt : 33.9°
Array Azimuth: 180.0°
Energy Specifications
Cost of Electricity: 10.3 ¢/kWh
Energy Production
Month
Energy(kWh)
Energy Value
($)
1 31640 3258.92
2 34740 3578.22

Augustine Reservation Energy Feasibility Study l:\augustine - programs\doe app#1 2005 jan20_05\reports\augustinereservationfeasibilitystudy0129.doc
3 39869 4106.51
4 41126 4235.98
5 43199 4449.50
6 41437 4268.01
7 44677 4601.73
8 45815 4718.94
9 38344 3949.43
10 37826 3896.08
11 33073 3406.52
12 31371 3231.21
Year 463118 47701.15

Augustine Reservation Energy Feasibility Study l:\augustine - programs\doe app#1 2005 jan20_05\reports\augustinereservationfeasibilitystudy0129.doc
APPENDIX M – CA GEOTHERMAL RESOURCE MAP

Augustine Reservation Energy Feasibility Study l:\augustine - programs\doe app#1 2005 jan20_05\reports\augustinereservationfeasibilitystudy0129.doc
APPENDIX N – RESERVATION UTILITY BILL DATA

Augustine Reservation Energy Feasibility Study l:\augustine - programs\doe app#1 2005 jan20_05\reports\augustinereservationfeasibilitystudy0129.doc
APPENDIX O – RESERVATION WIND RESOURCE DATA

Augustine Reservation Energy Feasibility Study l:\augustine - programs\doe app#1 2005 jan20_05\reports\augustinereservationfeasibilitystudy0129.doc
APPENDIX P – RESERVATION AERIAL PHOTO

Augustine Reservation Energy Feasibility Study l:\augustine - programs\doe app#1 2005 jan20_05\reports\augustinereservationfeasibilitystudy0129.doc
ENDNOTES
1 http://www.eere.energy.gov/solar/sh_basics.html/active 2 http://www.consumerenergycenter.org/renewable/basics/solarthermal/thermal.html 3 http://www.energylan.sandia.gov/sunlab/overview.htm#cost 4 http://www.eere.energy.gov/consumerinfo/factsheets/ac2.html 5 http://www.awea.org/faq/basicwr.html 6 http://www.eere.energy.gov/geothermal/powerplants.html 7 http://www.nationalraisin.com/faq.shtml

Augustine Band of Cahuilla Indians ANALYSIS OF ENERGY CONSERVATION OPTIONS
1.0 Introduction This project has been funded by a generous grant from the U.S. Department of Energy in accordance with the Department’s “First Steps toward Developing Renewable Energy and Energy Efficiency on Tribal Lands” program. This report completes the second of three phases in that project. In the first phase, we evaluated an array of alternative energy resources and made an initial assessment of the feasibility for implementing them on the Reservation. In this phase we have considered the feasibility of various possible approaches to conservation of energy. In the final phase, which is underway concurrently, we investigate the economics of photovoltaic systems for use in providing electricity to current and future residences and businesses on the Reservation. Although the idea of conserving energy is applauded by most of us, what that means and how it should be achieved are more complicated questions. The purpose of this discussion is to evaluate policy and investment options available to the Tribal government of the Augustine Band of Cahuilla Indians that could have the effect of reducing energy consumption on the Tribe’s reservation substantially below the level that would be consumed under current policies, making stipulated assumptions about the future development of the Reservation. The Augustine Band has made conservation the cornerstone of its energy policy. It appears to us that greater social utility comes from reducing energy use than from alternative energy production, although both have important roles in a thoughtful energy strategy. For the reasons that follow, we conclude in this report that the Augustine Band should adopt the International Energy Conservation Code, regulate building operations and maintenance and use energy pricing to create incentives for behavioral changes that will reduce energy consumption on the Reservation. Current energy conservation policies include the International Building Code. The Augustine Band has not explicitly adopted the International Energy Conservation Code. One of the purposes of this analysis is to consider whether it should be adopted, with or without changes. We also describe below various approaches to evaluating energy conservation and conclude that for the Tribe’s current purposes, commercial energy consumed per unit of economic output and residential energy consumed per capita are the most useful measures. For government functions, other than the operation of utilities and tribally-owned business ventures, we suggest that energy consumption per employee is the best available measure. For the sole business venture currently operating on the Reservation, the Augustine Casino, we suggest a goal of reducing energy consumption by 20 percent per unit of economic output within 6 years as a challenging but achievable tribal objective. In the third phase of the project, we will consider how to further reduce the Casino’s reliance on energy from carbon-based, non-renewable sources by replacing
1

grid-supplied energy with a photo-voltaic system or by selling off-setting amounts of such electricity to the local utility. The combination of conservation and alternative energy resource development is expected to reduce the carbon footprint of the Casino by 40 percent. 2.0 Background The production and delivery of energy is a global enterprise. By 2005, thirty (30) percent of the Nation’s energy was imported. Although we use energy more than twice as efficiently as we did in 1950 (that is, each Btu of energy used produces more than twice as much economic output), the total national consumption of energy continues to rise inexorably, even while domestic supplies decline. Nearly all of our increased consumption has been met with foreign energy, especially imported oil. Since 1970, domestic production of energy has increased only slightly. With respect to natural gas, imports as a proportion of total consumption have increased from 4.2 percent in 1987 to 15.9 percent in 2005. Residential and commercial energy use has expanded continuously since 1950. It is in the residential and commercial arenas, of course, that the Tribe can have the greatest impact. Since 1973, most of this increase has been in the form of electricity and related losses. In fact, the highest rate of increase in energy use in residential and commercial buildings has been in losses. Losses in the industrial sector of the economy are also very important. In 2005, energy losses nearly equaled the total energy content of the all of the natural gas used in the U.S. Industry and were within 20 percent of total petroleum usage in industry. Thus, reducing transmission and other losses is a crucial element of energy conservation. This can be aided by putting the source of energy near to the end user, that is, by decentralizing energy production. However, decentralized production may sacrifice economies of scale that attend centralized generation by utilities. This provides another perspective on why conservation is important; a great deal of the energy we produce is simply wasted during transmission or conversion or from other inefficiencies. Decisions about conservation and alternative energy resource development cannot be made in the abstract. Local conditions and policies have profound effects on the economics of such policies and projects. The Augustine Band’s Reservation includes approximately 502 acres of allotted1 and unallotted land. The Band also owns approximately 36 acres of contiguous non-trust land. It has developed a roughly 34,000 square foot casino and associated offices, storage, parking and other ancillary facilities on about 20 acres of the Reservation. Approximately 93 percent of the total electricity currently consumed on the Reservation is attributable to the casino.
1 Under previous federal law, individual Native Americans were permitted to take possession of allotments of land held in trust by the Department of Interior. Four such allotments totaling approximately 160 acres were granted on the Augustine Reservation.
2

Over the next five years, the Tribe contemplates developing on the Reservation a tribal government center, housing, a small retail center, 200 acres of agricultural uses, interior streets and street lighting, and a small visitor center associated with the tribal cemetery. Over twenty years, they expect to approve additional retail and housing development, a recreational vehicle park, and a free-standing restaurant. The public utility that provides electricity to the Reservation is the Imperial Irrigation District (IID). Compared with the investor-owned utilities (Southern California Edison, San Diego Gas and Electric, Pacific Gas and Electric) that provide power to most of the State, IID has low prices. Recently, however, prices have been increasing a roughly twice the rate of regional consumer price inflation. Rates are expected to continue to increase at higher than trend during the next five years as IID amortizes its investment in new production facilities needed to accommodate growth in its customer base. The predominant land use in areas near the Reservation has, until recently, been agriculture, including grapes, citrus, melons, dates, nursery products, turf and vegetables. However, there has recently been a rapid conversion of agricultural land to more intensive uses, primarily housing. A regional airport is located within a mile of the Reservation boundary. Nearby residential and related commercial development is expected to continue, although at a somewhat more moderate pace, for the foreseeable future. The recent decline in median housing prices in the Coachella Valley of more than 30 percent, although causing severe short-term disruption in housing starts, has restored the balance between household incomes and housing prices, which will eventually support a return to growth in both housing and the regional economy generally. Thus, the historic tendency of high population growth in the Coachella Valley is projected by the Coachella Valley Council of Governments (CVAG) to continue through 2035. The Riverside County Center of Demographic Research estimates that Riverside County growth from 2005 through 2035 will average 4 percent per annum, about four times that projected for the State as a whole. These projections, combined with increasing costs of developing new electricity infrastructure, provide support for the assumption that near-term electricity costs will increase at a rate above trend. IID’s rates are also influence by local political considerations. The District provides water and electricity to customers throughout Imperial County and in portions of Riverside County, primarily the eastern end of the Coachella Valley. It’s governing board, however, is comprised exclusively of Imperial Valley representatives for whom the water supply responsibility of the District is paramount in recognition of the importance of agriculture to that County’s economy. It is believed by some IID customers in the Coachella Valley that IID in effect subsidizes water prices through higher electricity rates. Whatever their cause, rate increases will have the effect of shortening the payback period for investments in conservation. This will expand the range of conservation requirements that can be imposed on new and existing development that are consistent with the Tribe’s economic development objectives.
3

Local meteorological conditions are also important to consider in determining the kinds of conservation requirements and incentives to include in the Tribe’s conservation strategy. The Coachella Valley, in which the Reservation is located, is an intense desert environment. It is located in the Sonoran Desert biome and within the rain shadow of the San Jacinto, San Gorgonio and Santa Rosa Mountains. The Desert is characterized by low moisture levels and precipitation that is infrequent and unpredictable. The low humidity results in comparatively wide temperature fluctuations. The Reservation is virtually flat and is entirely below sea level, with an average elevation of approximately -90 feet. The mean annual precipitation is about four inches, concentrated in the winter, although high intensity rainfall can occur during the summer monsoon season, sometimes resulting in flash floods in areas near the Reservation.
During the winter, overnight temperatures in the 20-30ºF range are common. Summer temperatures are quite hot with daily maximums averaging in excess of 100º F and occasionally exceeding 120º F. Historical mean temperature data for the weather station nearest the Reservation are shown in Figure 1, below:
Figure 1: Mean temperatures, Thermal Airport
THERMAL AIRPORT, CALIFORNIA (Source: U.S. Weather Service) Period of Record : 6/ 1/1950 to 7/31/2003 Jan Feb Mar Apr May Jun Jul Aug Sep Oct Nov Dec AnnualAverage Max. Temp. (˚F) 70.5 74.8 79.6 86.7 93.9 102.5 106.7 105.4 101 91.2 78.8 70.8 88.5
Average Min. Temp. (˚F) 38.6 42.8 48.3 55 62.8 69.3 75.8 75.1 68.7 57.2 44.7 37.9 56.4
Source: U.S. Weather Service Strong winds cross the desert floor. The western end of the Coachella Valley is the location of large commercial wind farms. Less concentrated but still strong winds can be observed further east in the Valley, including on the Reservation. A 20 meter anemometer on the Reservation recorded mean annual wind speeds of 3.0 meters per second. It is likely that a taller anemometer would have recorded higher wind speeds. The proximity of the airport suggests that wind turbines could be inconsistent with Federal Aviation Administration requirements for flight path clearance, although a preliminary investigation of that potential obstacle suggests that it may be surmountable.
Blowing sand and PM-10 materials can cause problems with exposed mechanical and electrical equipment. This could present challenges for both solar and wind devices, although experience elsewhere suggest that these obstacles can be overcome with good design and maintenance. Solar, air temperature, humidity, dew point and wind data recorded at the nearby Indio weather station during a recent 11-month period are shown above in Figure 2. High maximum and mean temperatures during June, July, August and September make conservation both necessary and economic.
4

Figure 2: Meteorological data: Coachella Valley Weather Data (Source: U.S. Weather Service)
Solar Vapor Air Temperature Relative Humidity Wind Rad Ave Max Min Ave Max Min Ave
Dew point Run DATE
Ly/dy mBars Degrees Fahrenheit Fº Ave. mph mi.
4/02 606 9.1 83 60 71 54 21 35 42 8.1 193 5/02 685 9.3 91 65 78 45 15 29 42 9.4 226 6/02 713 10.1 102 74 89 36 12 22 45 9/2 221 7/02 651 15.2 105 75 91 63 18 31 55 7.4 177 8/02 604 12.9 104 71 90 48 16 27 50 6.6 159 9/02 484 11.4 100 74 87 43 16 27 47 6.8 163
10/02 391 9.8 85 61 73 51 22 36 44 7.7 184 11/02 291 7.1 80 52 66 51 19 33 34 5.7 138 12/02 257 7.1 68 41 55 70 28 49 35 5.1 122 1/03 292 7.4 78 48 62 59 22 39 36 4.9 118 2/03 350 7.9 70 47 59 65 28 46 36 5.6 134
Totals/ mean
484 9.7 88 61 74 53 20 34 42 6.9 166
3.0 Energy Conservation Options
In theory, at least, energy conservation should be achievable through: (1) changes in energy consuming practices of individuals; (2) changes in business, government and non-profit sector practices related to energy consumption; (3) changes in the design and operation of buildings; (4) changes in the landscaping around buildings; (5) changes in vehicle design; (6) changes in the inputs for power generation facilities; (7) improvements in the efficiency of generation and transmission of energy; (8) increases in the efficiency of conversions from one form of energy to another; (9) increased occupancy densities in the built environment; and (10) reductions in population. We focus here on the first four of these options. In a later phase of this project, we will consider items 6 and 8 in the context of a proposed photovoltaic project. Although they are equally consequential, options 5, 7 and 10 are effectively beyond the reach of the Augustine Band and are therefore not considered here.
3.1 Interdependence of Options.
The analysis of conservation policy options is complicated by the fact that the primary options available to the Tribe will affect each other and the economic efficiency of alternative energy resource development projects such as the planned photovoltaic system. Examples of these interrelationships include:
1) The greater the reduction in energy use resulting from conservation, the smaller the carbon footprint that will need to be offset by the PV system. Therefore, to
5

the extent energy conservation measures are successful in reducing energy consumption, some economies of scale could be lost to the PV system or other alternative energy resource projects.
2) The greater the R-value of insulation requirements for buildings, the greater the initial cost of construction per square foot of floor area, the lower the operating cost of such buildings, and the higher their debt service requirement. This is true of many non-behavioral conservation measures.
3) The greater the passive thermal efficiency of the building envelope, the greater the likelihood of indoor air quality degradation that could result from unhealthy concentrations of vapors from toxic building materials. Thus, thermal efficiency requires a corresponding investment in non-toxic building materials and finishes, with corresponding increases in capital investment.
4) Increasing vegetative shading of buildings during warm weather reduces cooling demand but also generally decreases access to solar electric sources when they are most needed for cooling in the desert environment. Moreover, the vegetation that provides the greatest cooling effect tends also to require the most water.
5) Price-induced conservation may cause demand to lessen and conventional energy prices to fall, encouraging consumption of hydrocarbon-based energy and increasing the payback period for alternative energy systems. This effect will be important only if conservation policies are adopted on a much larger scale than the Reservation, of course.
6) In the short term, widespread subsidies for alternative energy cause demand for alternative energy equipment and expertise to rise, creating shortages, increasing prices, vitiating the effects of subsidies on demand and allowing inefficient equipment manufacturers and installers to survive. This problem is particularly acute in California where recently enacted deep subsidies are largely being capitalized by equipment vendors and installers.
These diverse examples suggest that energy planning for Native American communities needs to proceed thoughtfully. With respect to both capital and life cycle costs of conservation options, an additional step in the analysis is to estimate the effects on the economic feasibility of the Tribe’s economic development strategy and projects. 3.2 Benchmarks For purposes of this analysis, we will use the following performance benchmarks:
1) For the Casino, recent (calendar year 2006) performance has been ________ kilowatt hours of energy per $1 million of net revenues (amounts wagered less payouts, plus other revenues). The natural gas consumption benchmark is ____ therms per $1 million of net revenues [quantities deleted to protect proprietary information].
2) We have established a benchmark of 9,600 kWh per capita for electricity and 480 therms of gas per capita per annum, assuming electricity is used for air conditioning, refrigeration, other appliances and lighting, and that natural gas is
6

used for cooking, space heating and hot water. This benchmark will be revised based on actual usage once there occupied housing units on the Reservation.
Our combined objective is to reduce the demand of the Casino for carbon-based, non-renewable energy by 40 percent (20 percent through conservation and 20 percent through substitution) per unit of economic output (measured as net revenues) in six years. If and when residential units are constructed on the Reservation, our objective will be to design, construct and use such structures in a manner that achieves annual energy use 35 percent below the benchmark. We recognize that these benchmarks are somewhat arbitrary in the sense that they are not based on any qualitative evaluation of minimum energy needs for various land uses. That is, achieving the targeted improvement over benchmark will not necessarily mean that we have done all that is possible to reduce the energy footprint of the Reservation. However, we believe that, on balance, these targets will move the Tribe in the right direction while we develop more sophisticated future targets based on our experience with actual projects and policies. 3.3 Discussion of Policy Options 3.3.1 Changes in energy consuming habits of individuals Because energy in the United States has, until recently, been very inexpensive, and because, also until recently, there has been little attention given by the political leadership of the Country to the need for conservation, most Americans have life styles that are highly energy inefficient compared with their counterparts in other developed countries. Beginning with the first oil shock in 1973, there have been fitful and inconsistent attempts by governments and non-governmental organizations to increase our awareness of the need for conservation and techniques for doing it. At first glance, these efforts appear to have resulted in a small reduction in energy use per capita over the past three decades. However, this is probably due primarily to the transformation of the U.S. economy from manufacturing to services and mandated improvements in vehicular fuel economy. Now, however, we appear to be at a tipping point in energy consumption behavior. Price increases, the increasing scientific consensus concerning global warming, media attention to the effects of global warming on both the natural environment and, potentially, on the global economy, and the connection between carbon fuel dependence and terrorism appear to have made most people more open to life style changes. There remains, however, a conspicuous absence of effective political leadership on this issue. Consumers’ energy consumption behavior can be influenced in several ways: (1) through incentives that reward individual conservation; (2) through penalties for energy use; (3) through education; and (4) through normative energy pricing.
7

3.3.1.1 Incentives Governments in the U.S. have been increasingly turning to incentives to convince their citizens to adopt environmentally benign behavior. The federal government’s approach to date has been to give tax credits for a portion of the cost of alternative energy systems. This obviously provides benefits exclusively to taxpayers, at least initially. Since the Tribe does not currently impose taxes, it does not have any way to create its own tax- based incentives for energy conservation. Once development of the Reservation begins in earnest, the Tribe should impose a tax regime, in part to give it the means of implementing energy conservation and other policies. The State of California has recently implemented an aggressive rebate program for anyone, whether or not a tax payer, who installs qualified alternative energy equipment. California public utilities are also required to provide rebates to households that reduce their energy usage by a stipulated amount under the previous year’s usage. Incentives need not be in the form of tax reductions or direct rebate payments. Zoning requirements can be used to similar effect. For example, developers of Reservation property could be given density bonuses, more favorable parking ratios and site coverage ratios, and other variances in exchange for design and building operations features that conserve energy. 3.3.1.2 Penalties Penalties for the inefficient use of energy can also help to change consumer behavior. Tiered pricing systems, in which residential natural gas and electricity users pay a comparatively low rate for some low level of monthly usage and progressively more for amounts above the lower tiers, can be somewhat effective if the utility companies use the media to educate their customers about the program. In California, utility companies have come to depend on the revenues from charges at the highest tiers of pricing and thus have done little to inform their customers about their pricing policies. 3.3.1.3 Education Energy consumer education can be an effective way to reduce per capita energy consumption. It works best when the educational message is consistent with what the consumer sees in terms of incentives, penalties and pricing along with consistent support and reinforcement from the political, scientific, spiritual and business leadership of the Country. To date, only the scientific community has been widely supportive of conservation. Recently, a number of business leaders, including the CEOs of several major oil companies, have acknowledged the reality of global warming and the need to take steps to reduce our reliance on conventional energy sources. Political and religious leaders have been mostly unwilling to be conspicuous advocates of conservation, but
8

there are some modest signs that this may be changing. In any case, there is an opportunity for the Augustine Band to take a local leadership role by adopting policies and practices that set a very high standard of energy efficiency and environmental sensitivity. Such an approach could help to educate local elected officials and citizens about the policy techniques that can lead to dramatically lower per capita energy consumption. Because the Tribe has only 8 members, education for tribal members can be accomplished informally. By adopting exemplary policies now, while there is only one adult member of the Tribe, the Augustine Band can establish the framework for a sustainable community in the future. If the generation of Tribal members now approaching adulthood grow up in a community that assumes energy conservation as a given, they will be more accepting of its implications for personal lifestyles. With respect to the roughly 400 employees of the Tribe, a more formal educational process may be warranted. About 90 percent of the Tribe’s employees work in the Augustine Casino which is a large and energy inefficient structure. Other employees work in modular offices near the Casino, which are also highly inefficient structures. Finally, both employees and customers mostly drive or are driven to the Casino because public transportation is not readily available to the site. 3.3.1.4 Pricing Currently, the Augustine Band has no effective control over energy prices on the Reservation. Because all of the activities on the Reservation are Tribally controlled, this is not of great concern since the Tribe can mandate energy conservation in all of its ventures if it wishes. In the future, however, it is possible that the families of Tribal members will live on the Reservation and that both Tribal members and others may operate businesses on the Reservation. If and to the extent that this occurs, control over energy pricing could be an important conservation tool. The Tribe plans to develop a 1.0 MW photovoltaic system that will be connected to the external grid. For as long as it is connected to the grid, prices on the Reservation will continue to be determined primarily by the Imperial Irrigation District (IID). If the Tribe’s utility is severed from the grid, then the Tribe could set prices consistent with its conservation objectives. Currently, IID does not have a tiered pricing system for commercial users. Thus, businesses are not penalized for inefficiencies in their electricity use. Or, conversely, there is only a limited incentive for them to invest in energy conserving equipment, design or behavior. If the Tribe established an its own electric utility, it would likely lose the economies of scale available to IID. Whether this could be offset through the transmission efficiencies that would result from reduced distances between the supply and users of its power, or by other efficiencies is not clear but seems unlikely. Thus, in the short term at least electricity would probably be much more expensive if the Tribal photovoltaic utility were the sole source of power on the Reservation.
9

A possible alternative would be for the Tribe to tax Reservation-based businesses based on their electricity usage. This would, in effect, add a price to the bill paid to IID. Such a tax could be tiered to encourage efficiency. If the tax rate were too high (higher than the economic advantage of a Reservation location), businesses would likely choose to locate off the Reservation. 3.3.2 Changes in business, government and non-profit sector practices related to energy consumption. Rather than, or in addition to, using pricing to affect the energy use of businesses, Tribal government and non-profits operating on the Reservation, the Tribe could directly regulate business practices. For example, the Tribe could adopt an energy efficiency code that requires specific thermostat settings in buildings, periodic maintenance of equipment, prescribed maintenance for landscaping, building occupancy, and the like. Such regulatory impositions could be difficult to enforce and might be seen as overreaching by energy consumers. 3.3.3 Changes in the design and operation of buildings; The conventional way in which governments influence energy conservation is by regulating the design and, to a lesser extent, operation of buildings through building and occupancy codes. This approach includes regulation of construction, building operations, community planning. 3.3.3.1 Regulation of Site Development and Building Design
3.3.3.1.1 Design versus performance standards. Design standards are comparatively straightforward and economical to enforce but limit building techniques and materials to what is contemplated by the applicable code or other policy expression. Performance standards tend to be more expensive to enforce because they may require judgment or testing on the part of the enforcement officials, but they more easily accommodate new solutions to conservation objectives. Although building technologies tend to change very slowly because they require contractors, laborers, building materials vendors, lenders, building code officials and consumers all to accept them, governments have some interest in encouraging such changes to the extent that they enable energy efficiency and other public objectives. As a consequence of the tension between the need for certainty provided by prescriptive design standards and the flexibility offered by performance standards, most code enforcement agencies have adopted building codes that are a
10

compromise between the two approaches. Thus, builders are generally assured that if they build to prescribed design standards they can be assured of passing inspections. On the other hand, if they can demonstrate that a new building material or system meets the code’s performance standards, then it will also be approved without regard for whether it meets design prescriptions. Of course, building codes are updated frequently, so today’s performance-based solution may become tomorrow’s prescribed design standard.
3.3.4 Changes in the landscaping around buildings Attention to the landscaping near buildings can have dramatic effects on energy usage, particularly for cooling the interior of structures by reducing heat gain through walls and roofs. In the extreme desert temperatures of the Coachella Valley, landscaping can be the least expensive and simplest of energy conservation measures. However, if maintaining landscaping in this environment requires large amounts of water, then some of the energy conservation benefits may be eroded because it takes energy to pump water and because other environmental concerns may be sacrificed. However, well-conceived landscaping may have other important aesthetic and environmental benefits It is also important to recognize that only certain plant species can survive in the desert without inordinate care and this limits to some extent what can be done. Most desert plants, for example, have relatively small leaf surfaces. Both individual leaves and the overall leaf surface presented by desert natives tend to be limited as a defense against unsustainable evapo-transpiration rates. This means that such species do not provide the same degree of shade that species adapted to more temperate climates might provide. For this and other reasons the conventional advice on energy conserving landscaping must be adapted to circumstances on the Reservation. Planting large-leafed deciduous trees on the south and western faces of a building, for example, works very well in temperate climates where the leaf cover is virtually complete in the summer and disappears in the winter, exactly as required to provide for seasonal heating and cooling needs. In the desert, such species would not survive and, in any case, would be less effective because the desert hot season is much longer than the leafy period of such trees.
Evapo-transpiration from leaves extracts heat from surrounding air, cooling it. Dense shrubs around a home can reduce cooling requirements up to 24 percent; a mature wide canopy shade tree can cut cooling costs by as much as 40 percent. In the Coachella Valley, both the shading and evapo-transpiration effects of plantings are valuable through much of the year.
It is important to know where the sun is in the sky when temperatures are warmest so that plants can be positioned to block solar radiation striking the building during that time. Because the summer sun is high in the sky, most sunlight warms the east and west walls and the roof. Most sunlight in the winter strikes the south wall.
Ground covers, although not providing shade to building surfaces, decrease heat around a structure and on walls and windows by reducing radiation from non-building services.
11

Among the species of trees and vines best adapted to desert landscaping are the following:
Acacias. Tree species native to Australia and to Southwestern United States, Mexico, Texas and South America. All have a tolerance to heat and are low to moderate water users once established. Require deep watering to establish root system. Some species are deciduous. A. aneura, Mulga, evergreen and thornless, grows to 20' height by 15–20' width.. Hardy to 24o F. Australia. A. craspedocarpa, Leatherleaf Acacia, at 10–15' with gray-green leaves is a good alternate for oleander. Evergreen, hardy to 18o F. Native to Australia. A. saligna, Blue Leaf Wattle and A. salcinia, willow acacia, hardy to 20o F. Evergreen. Both have dark green foliage. 15–30' with yellow catkins in late winter and spring. A. stenophylla, Shoestring Acacia, with strong vertical graceful, stringy, soft gray-green evergreen growth, can reach 25–30' height, 15–20' canopy width. Hardy to 18o F. A. smallii (A. minuta), Sweet Acacia, hardy to 20o F. Deciduous to semi-deciduous, multi-trunk or standard form that grows to 20–25' height and spread. A. penatula, Sierra Madre Acacia, native to Mexico with a fern-like growth similar to Albizia julibrissin, silk tree, forms a low 20–30' wide evergreen canopy and 15–20' height. Cold hardy to 20o F.
African sumac. Leaves medium-green. A dense wide-spreading tree with a slight weeping or drooping habit. Mature trees of 20–25' may be twice as wide as they are high. Trees are ideal for small garden. Reddish stems most attractive. 20o F. Native to South Africa. Low to moderate moisture needs.
Bougainvillea. Thick foliage and climbing character provide exceptional shading of walls. Tolerates full sun. B. brasiliensis (B. spectablilis). Must have full sun. 20o F. B. ‘California Gold’,. B. ‘Jamaica White’. 30o F. B. ‘Orange King’. Attractive foliage. B. A sunny location ideal, hardy to 30o F. All are low water users.
Cajeput. Melaleuca quinquenervia. Swamp tea tree. Slender, 20–35' evergreen tree with spongy, light colored bark. Thinning may be required with age. Tolerates high wind speeds. Deep water to avoid shallow rooting. Low to moderate water use. Cold tender at 28o F.
12

California Pepper Tree. Schinus molle, California pepper tree. Medium sized, 30–35' round-headed evergreen. 20o F. South American origin. Low to moderate water user depending on soil type.
Carob. Ceratonia siliqua, carob, St. John’s bread tree. A large canopy, spreading evergreen, 20–40'. Slow to start. Round headed form, densely branched; compound leaves of shiny deep green make dense shade. Plant males. Females develop long brown seed pods. Low water user. Deep water to encourage deep rooting. Drip ideal in any location. 18–22o F.
Catclaw. Macfadyena unguis–cati, catclaw yellow trumpet. Partly deciduous with slender shoots that cling to any surface. Rapid, can spread to 30–40' vertically or horizontally. Start with gallon size, plants adapt better to transplanting with smaller size. Takes heat and drought. Sun or partial shade. Hardy. Low water use.
Chaste Tree. Vitex agnus–castus, chaste tree. Deciduous, to 15–25', with gray green, dense, foliage. Hardy. Full sun. Native to southern Europe. Low water user.
Chinese Pistachio. Pistacia chinensis, Chinese pistachio. Rapid growing, medium sized 30–40', deciduous. Bright green compound leaves. Tolerates a wide variety of conditions. 15o F. Low to moderate water needs.
Citrus. Any of the orange, lemon or grapefruit varieties can be grown in the desert environment.
Creeping Fig. F. pumila, Evergreen, self-clinging. Juvenile leaves are small and mature leaves large. Sun or partial shade. Tough. 20o F. Low water use.
Crepe myrtle.
Desert Ironwood. Olneya tesota, desert ironwood. Gray-green foliage and trunk character. Lavender, pea-like flowers copius in the spring attract bees in abundance. Slow growth to 25–30'. Hardiness is in the 26o F range before foliage damage. Thorns limit utility in high traffic areas.
Desert Willow. Chilopsis linearis. Has 3 definite seasons: deciduous during the winter months. The light, airy 25–30' height with multiple-trunks provide structure for graceful, stooping, light-green leaves and the white, pink, lavender and purple flower clusters. Most preferred soil is one with good drainage. Deep watering with low to moderate applications. Full sun. Takes extreme heat and cold. 0o F.
Feather Tree. Lysiloma microphylla var. Thornberi. Dappled shade effect for under planting is most effective in the mini-oasis area around the home. With age at 6–10 years, the multi-stem growth can reach 15–20'. At 25o F. goes deciduous and at 20o F. branch damage can occur. Feather tree requires low to moderate water with good drainage and in full sun.
13

Flameleaf Sumac. R. lanceolata, prairie flameleaf sumac. Valued deciduous tree native to West Texas. 12-15’ tall, 10’ wide. Foliage turns to red and orange in fall. 0–5oF.
Jacaranda. Jacaranda mimosifolia (J. acutifolia), jacaranda - Large, 30–45' round headed semi-evergreen with lacy, fern-like green leaves. Good drainage required. Do not over water. Deep water to reduce surface root development. Hardy to 20o F.
Jerusalem Thorn. Parkinsonia aculeata, ratama, bigota. Small 25' deciduous, for hot, sunny dry places. Zig-zagging, bright green branches and fern-like foliage hold masses of small, bright yellow flowers in early summer. Wide tolerance to wind, heat and drought. Most effective growth with adequate water. 25o F. Low water use.
Mesquites. Prospis species, mesquite. The North American mesquites such as P. velutina, velvet mesquite, grow to 30' height and width, foliage is gray-green, deciduous, and stems develop thorns. P. glandulosa var. glandulosa, honey mesquite, is rapid growing to a similar size, thorny has bright green foliage. Both species are hardy to 15o F, and have low water use needs after becoming established. P. alba, Argentine mesquite, is thorny, upright, rapid-growing, lush, dark green, fern-like foliage, nearly evergreen and hardy to 15o F. P. alba ‘Colorado’, a clone of P. alba, Argentine mesquite, is semi-deciduous, consistently thornless, drought tolerant. However, performs well in turf with deep watering and is cold hardy to 10o F. To 30–35' height and width. P. chilensis, Chilean mesquite, has similar growing habit. Both selections grow rapidly at first.
Ornamental olives. Olea europaea. Round headed 20–30' evergreen. Distinctive gray-green foliage on graceful, yet gnarled branches. O. ‘Swan Hill’ fruitless selection prime choice. 15o F. Low water requirement.
Palo verde. Cercidium species. Blue-green bark, naturally developed multiple trunks with widely spreading 25–35' growth pattern. Height to 35’. C. floridum, blue palo verde, usually blooms first. C. microphyllum, littleleaf palo verde, at 20', more dwarf-like and a stiffer look, has pale yellow flowers. C. praecox, palo brea also known as Sonoran palo verde, has more upright structure and thornier branches. 25o F. All tolerate extremes in heat, full sun, react better to well-drained soils such as sand, loam, gravel or decomposed granite.
Silk Tree (Mimosa Tree) Albizia julibrissin. Small, deciduous, 20–25'. Low to moderate water—deep watering essential. Hardy to 15o F.
Texas Ebony. Pithecellobium flexicaule. The density of growth, dark green foliage, spiny twigs provide good sun barrier for walls. Native to Texas and New Mexico. Hardy in desert areas. Growth even though slow becomes more picturesque in maturity. Mature height at 20–30' and spread of 15–20'. Low to moderate water sustains good growth. Good drainage and deep-watering important. Trees adapt to many soils. Plant in full sun. Takes extremes in heat and cold to 20o F.
14

Grape. Vitis pomifera. Deciduous, clinging, medium green foliage. Vigorous growth to 10–20'. Needs fruit support. Prune in winter. Hardy. Low to moderate water needs.
Willow Pittosporum. Pittosporum phillyraeoides. Evergreen, handsome, light gray-green, pendulous. Height to 15–30'. 15o F. Low water user.
Wisteria. Wisteria floribunda. ‘Longissima Alba’. Pure white flowers that cascade in spikes to 48" long. Deciduous, displays bright green foliage. Hardy. W. f. ‘Royal Purple’, Deciduous, twining, woody with bright green foliage. W. sinensis, Chinese wisteria, deciduous, medium green foliage. Grows 10–30'. Full sun. Low to moderate water use. Hardy.
These and other floral species can be useful in plantings designed to conserve energy. The primary point to be made here is that plants must be selected with care to achieve desired shade effects without causing other environmental problems. The Tribe could adopt either performance or prescriptive standards for landscaping or require landscaping design review as part of the development entitlement process.
More generally, site planning is of importance to energy conservation in part because the orientation of buildings on sites can substantially affect the efficiency of passive building design features. The placement of landscaping can also affect the efficiency of active solar systems. This can create conflicts in site planning objectives. On hot days, towering trees reduce the heat gain of buildings by shading them from direct exposure to sunlight and by trapping comparatively cool air around structures. On the other hand, roof-top solar collectors can lose considerable efficiency if they are shaded during part of the day. This dilemma can be mitigated by a centralized solar system detached from individual structures. Such an approach will, however, increase transmission losses in the system.
Landscaping. Landscaping choices can both positively and negatively affect the conservation metrics of any development. In general, hardscape materials such as concrete and steel tend to absorb thermal radiation during the day and radiate it at night, thus increasing the ambient air temperature in its environment. Dark colored materials tend to absorb thermal radiation, while light-colored materials reflect it. Flat and shinny surfaces reflect more sunlight than do irregular and dull surfaces. Therefore, Tribal policy should encourage the reduction of hardscape associated with all buildings and other uses. We should also encourage the use of reflective coatings on building surfaces. These measures will help to reduce the “heat island” effects of development.
4.0 Prevailing Practice An informal survey of municipal and state jurisdictions in the United States indicates that a rapidly growing number of such governments have adopted one of the iterations of the International Energy Conservation Code, sometimes with modifications which are usually minor in character. In general, it is through building codes that governments have attempted to achieve energy conservation. In California, Title 24 has been the prevailing
15

standard among municipalities. But an increasing number of California cities have adopted or area considering standards that go considerably beyond the Title 24 requirements.
Two Santa Monica Municipal Code ordinances aim at higher environmental and resource performance of buildings than state requirements. These performance-based ordinances require building projects to meet or exceed a performance target, but allow complete flexibility in the methods used. The targets have been set to reduce resource or environmental impacts, using cost-effective and well-proven design and construction strategies. Santa Monica’s two building performance ordinances focus on reducing energy consumption and runoff of untreated storm water.
The City of Santa Monica requires lower annual energy consumption than California’s 2001 Title 24 regulation. Their Municipal Code requires comparatively stringent annual non-renewable energy budgets, as shown in Figure 2.
Figure 3: City of Santa Monica Energy Targets
Building Occupancy Energy Target (% 2001 Title 24 Standard)
Multi-family residences 90% Hotels and motels 85% Office 85% Light industrial 85% Retail 90%
Source: City of Santa Monica, 2007
These annual energy conservation targets are based on computer simulations of typical buildings that comply with Santa Monica’s zoning and building ordinances, and the 2001 Title 24 regulation.
California’s Title 24 regulation is still applicable in the City. However, Santa Monica’s ordinance requires use of computer simulations following Title 24’s performance approach to demonstrate that non-residential buildings meet the energy conservation target.
Cities outside of California have also been aggressive in improving on traditional code requirements. The City of Austin, Texas, has been a pioneer in municipal involvement in promoting green building techniques and standards. The City claims to have created the world’s first (1991) residential green building rating system. By 1995, the City had added a commercial building rating program. Begun in 1985 as a city-wide Energy Efficiency initiative, The Austin Green Building Program is a leader in institutionalized green building programs. They try to enable builders and owners to gain access to green building information through an on-line information service and various outreach efforts. By March, 2006 the Austin Green Building program had certified more than 5,500
16

homes, more than 2,300 multi-family un its and 40 commercial projects. The program is operated by Austin Energy, a municipal utility.
Incentives are also used by governments to encourage energy conservation. Public subsidies for “weatherization” have been commonly available in urban areas for several decades and an increasing number of state governments have adopted or are considering subsidies for alternative energy equipment and installation. King County (Washington) has implemented a program to provide grants to the owners of new and renovated buildings that achieve the silver, gold or platinum LEED standard and meet certain other recycling, irrigation and surface water runoff standards. The Grants are for $15,000 for silver, $20,000 for gold and $25,000 for platinum. Most utilities and their public regulators have developed programs to encourage energy conservation, but investments in this area have generally lagged efforts in alternative energy resource development. Unfortunately, there has been a widespread perception among public officials that asking Americans to conserve energy is politically damaging or ineffective.
5.0 Policy Recommendations
The discussion of conservation policy options in Section 4, above, suggests the considerable range of energy conserving options available to households, businesses and governments. New products and techniques are becoming available at a rapid pace as Americans respond to increased concerns about global warming and other forms of environmental degradation. The goal of the Augustine Band to play a constructive role in energy conservation on its Reservation can therefore best be achieved by adopting policies that recognize both the need for large increases in energy efficiency and the rapidly changing technological and behavioral environment in which we govern. In recognition of this, the Augustine Band has adopted a policy framework with three elements: 1) Adoption of the 2006 International Energy Conservation Code, with modifications as necessary to accommodate the other policies described below; 2) Adoption of an energy conservation point system to be used to evaluate proposed development projects. 3) Adoption of the Energy Conservation Incentives Program described below. 4) Designation of the Tribe’s Environmental Coordinator to exercise responsibility for implementing the Tribe’s energy conservation policies. The Augustine Band is in an exceptional position to demonstrate leadership in environmental issues generally and energy conservation in particular. This is in part because the Reservation, although located in a rapidly urbanizing area is, itself, almost entirely undeveloped. Thus, except for its existing casino, the Tribe is free to capture the comparative economics of new green construction as opposed to the more difficult problems presented by retrofitting. Secondly, the Reservation’s location in the Coachella
17

Valley presents among the world’s best solar exposures, making both solar thermal and photovoltaic applications technically feasible. Relatedly, the desert environment’s extreme temperatures make the economics of both conservation and alternative energy compelling. 5.1 Adoption of the IECC The Tribe should adopt the International Energy Conservation Code in its most recent form and should provide in its adopting resolution for automatic updates as new generations of the Code are issued. 5.2 Energy Conservation Point System Proposed developments on the Reservation will be evaluated in accordance with the following rating system. A minimum of 50 points will be required for the issuance of a building permit by the Tribe. Alternatively, a “Platinum” rating by the Leadership in Energy and Alternative Design (LEED) Building Rating System will be accepted by the Tribe. No certificate of occupancy will be issued unless and until a pre-occupancy inspection demonstrates that the project has been constructed in accordance with the rated plans and specifications. Figure 4: Building Design Rating System
DESIGN ATTRIBUTE POINTSPart 1: Site Plan (1) At least 80 percent of roof area is flat or slopes to the south.¹ 2 (2) At least 50 percent of the roof area slopes to the south (if no points claimed under (1). 1
(3) For single-family residences, asphalt, concrete and other hardscape features will cover less than 5 percent of the total site. 1
(4) For single-family residences, at least 90 percent of that portion of the site not covered by building footprints will be covered by vegetation. 1
(5) For multi-family residential developments, asphalt, concrete and other hardscape features other than buildings and covered parking will cover less than 50 percent of the total site.
2
(6) For multi-family residential developments, at least 40 percent of the site not covered by buildings and covered parking will be covered by vegetation. 1
(7) For office, medical, educational and other business premises other than retail and industrial developments, at least 30 percent of the site area other than the areas covered by buildings and covered parking, are covered by vegetation.
2
(8) For office, medical, educational and other business premises other than retail and industrial developments, at least 50 percent of uncovered parking surfaces are shaded by trees or other vegetation.
2
(9) For office, medical, educational and other business premises other than retail and industrial developments, at least 50 percent of paved parking areas area covered.
2
18

(10) Buildings are oriented so that at least one-third of the total perimeter of each building faces due south or within ten degrees of due south, and Landscaping Plan criterion (2) is satisfied.
2
(11) If the project will require the demolition of existing buildings, the demolition will be conducted using deconstruction techniques resulting in not less than 80 percent of the demolished building being recycled.
2
12) Building orientation is consistent with a natural lighting and ventilation plan approved by the Tribe. 2
13) Provided secure bicycle storage on site. 1 14) Install Clarifiers or Oil/Water Separators on Drains from Service Bays & Parking Areas 1
15) Provide Space for Recycled Material Storage & Handling Systems 1 16) Provide pedestrian and bicycle access separated from vehicular access 1 TOTAL SITE PLANNING 24 Part 2: Landscaping Plan (1) At least 90 percent of new plants proposed are native species and no invasive, non-native species are proposed. 2
(2) During the period from and including April to and including October of each year, landscape materials will provide not less than 80 percent shade to all southern and western wall exposures and not less than 50 percent of all roof areas.
2
(3) If an external air conditioning unit is proposed, it will be completely shaded by landscaping features without blocking air flow to the unit. 1
(4) At least 90 percent of planted areas are served by a drip irrigation system. 1 (5) All planted areas (interior and exterior) use water sensors to control irrigation. 1
(6) At least 90 percent of the materials used in the site hardscape are recycled. 2 (7) All buildings include dual plumbing systems to permit non-treated water to irrigate landscaping. 3
8) All of the landscaping is designed to provide habitat for native fauna. 1 9) At least 90 percent of landscape products and materials are recycled. 1 10) Landscaping is chosen and designed to eliminate the need for pesticides, herbicides and fertilizers. 1
TOTAL LANDSCAPING 15 Part 3: Building Design and Materials (1) At least 80 percent of the total estimated electricity needs of each building will be provided from photovoltaic sources. 2
(2) All interior and exterior lighting is natural (through windows, skylights or translucent building materials), conducted natural (light tubes, etc.) or fluorescent.
1
(3) At least 80 percent of work spaces have sufficient natural light between the hours of 9:00 AM and 5:00 PM to not require artificial lighting (alternative to (2), above).
2
(4) All built-in appliances will meet Energy Star standards approved by the Tribe. 1
19

(5) All toilets meet water conservation standards approved by the Tribe. 1 (6) At least 80 percent of the estimated hot water needs of the building will be met from solar thermal sources. 1
(7) Each building has a vegetative roof (at least 70 percent vegetative cover) 1 (8) Materials used for interior finishing meet or exceed volatile organic compounds standards established by the Tribe. 2
(9) A least 90 percent of wood used in the development comes from renewable forests. 1
(10) At least 90 percent of construction waste is recycled. 1 (11) All windows are double-paned. All south- and west-facing windows are triple-paned. 2
(12) Glass portions of the building envelope use a loggia construction technique approved by the Tribe (alternative to 11, above). 3
(13) At least 20 percent of the window area of the building is operable. 2 (14) Prismatic louvers are used to reflect infrared radiation from glass surfaces while permitting the entrance of diffuse light. 1
(15) Heliostatic reflectors are used to introduce natural lighting into the building interior. 1
(16) At least 50 percent of roof surfaces are devoted to solar applications (solar thermal and/or photovoltaics). 3
(17) Use of animated prismatic tiles to distribute natural light throughout interior of building. 1
(18) At least 20 percent of the roof area of each building is devoted to skylights. 1
(19) Reflective ceiling panels are used in conjunction with reflective louvers to direct natural light deeper into the building interior. 1
(20) An interior atrium is used to admit natural light into the building. 4 (21) Water feature(s) designed to reflect light and moderate building humidity. 1
(22) Use of light walls to distribute light within the building. 1 (23) Use of electronically controlled exterior blinds to reflect solar thermal radiation and to suppress light pollution at night. Add one point if blinds also serve as solar collectors.
2/3
(24) Cogeneration is used to provide heating and cooling in each building. 2 (25) All artificial lighting is controlled by motion sensors and programmable switches. 1
26) All hot water transmission lines are insulated. 1 TOTAL BUILDING DESIGN 40/41
5.1.1.3 Options for site development policies.
Site development choices affect energy conservation is several ways. First, building orientation can affect the efficiency of passive and active solar systems by providing more or less optimal solar exposures. Second, landscaping can enhance the thermal efficiency of structures by reducing or increasing the thermal energy that reaches exterior building surfaces. Thus, deciduous plants can
20

decrease the amount of solar radiation hitting structures during the hot seasons and increase it during the mild winter months. These two factors may compete with one another to some extent. Surrounding a building with tall trees will make it easier to cool in hot weather but it may also block access to the sun for active solar applications. Finding the right balance between these objectives is a policy goal that can be best addressed on a case-by-case basis. In practice, of course, the line between performance and design standards is not perfectly clear or important.
5.1.1.4 Design standards. Examples of construction standards for site development include: solar easements to guarantee access to sunlight; restrictions on hardscape such as asphalt and concrete; swimming pool standards or restrictions; and restrictions on plant species. Design standards are essentially prescriptions about how sites should be developed, the materials to be used and so on.
5.1.1.6 Performance standards. Examples of performance standards for landscaping might include outdoor water use limits; solar performance of roof configuration; effects of hardscape on ambient air temperature; and residential density requirements.
5.1.2 Options for building design and construction policies.
5.1.3 Design standards. Construction standards are generally set forth by
governments in the form of building codes. The Tribe has previously adopted the International Building Code. The organization that publishes that code also has developed an International Energy Conservation Code.
5.1.4 Performance standards. Generally, performance can be evaluated using two
types of calculations:
• Net present value of investments required (life cycle cost analysis). • Energy demand analysis: how much energy is saved over the life of the
investments? Of course, design and performance standards are not mutually exclusive, for two reasons: (1) the two can be offered in the alternative (projects can either meet the design or the performance standard); or a design standard can include performance requirements for particular equipment (for example, a requirement to use photovoltaic equipment for low surge electrical applications could be combined with a performance standard for the equipment). 5.0 Prevailing Practice An informal survey of municipal and state jurisdictions in the United States indicates that at least a plurality of such governments have adopted one of the iterations the
21

International Energy Conservation Code, sometimes with modifications which are usually minor in character. In general, it is through building codes that governments have attempted to achieve energy conservation. However, public subsidies for “weatherization” have been commonly available in urban areas for several decades and an increasing number of state governments have adopted or are considering subsidies for alternative energy equipment and installation. Most utilities and their public regulators have developed programs to encourage energy conservation, but investments in this area have generally lagged efforts in alternative energy resource development. Unfortunately, there has been a widespread perception among public officials that asking Americans to conserve energy is politically damaging or ineffective. 6.0 Policy Options and Recommendations 6.1 Evaluation of Regulatory Options:
6.1.1 Regulation of Building Operations
6.1.1.1 Tribal properties.
The Tribe has a greater ability to control the operation of building systems in structures that are occupied by its employees or tribal members. In those buildings, the Tribe may want to impose prescriptive requirements concerning thermostat settings or performance requirements such as maximum energy use per employee per month. Operational effects can also be achieved through design prescriptions. Motion detector light switches, programmable thermostats, light-sensitive window shades and the like can replace human behavior in the management of energy use. Regulation of thermostat settings will be of greatest importance during hot weather, typically from April through October. During that period the Tribe might prescribe minimum thermostat settings of 78 degrees during periods of building occupancy. Alternatively, a standard minimum of 68 percent of outdoor temperature but not less than 75 degrees F could be imposed. These are comparatively high minimums, in recognition of the exceptionally high differential between indoor and outdoor temperatures during the hottest days in the Coachella Valley. 6.1.1.2 Properties not owned by the Tribe.
If the Tribe or a tribally-owned venture becomes a utility, pricing can be used as a highly efficient method for influencing the energy consumption habits of energy consumers. A great many utilities, including all of those in California, use tiered pricing for residential customers to discourage excess consumption and encourage conservation. Such systems work best if there are no practical alternatives to purchasing power from the utility, as is generally the case in urban California. To be effective, such incentives must be applied fairly to all users.
22

6.1.2 Regulation of Vehicular Use and Promotion of Circulation by Means That Do Not Use Hydrocarbon Fuels.
We have not discovered any regulatory agency or employer that attempts to require employees or residents to use particular forms of transportation as an energy conservation strategy. However, a fair amount of public and private resources are devoted to encouraging people to make responsible transportation choices, especially public transit. Currently, the Augustine Casino is the only significant traffic generator on the Reservation. The Casino’s roughly 400 person workforce and 1000 daily customers generate roughly 1000 vehicle trips per day. For competitive reasons, the Casino could not feasibly require its customers to use modes of transportation to the Casino other than their personal vehicles. The site is not now well-served by public transit and the Casino does not have a busing program. The Casino’s employees tend to live in nearby communities, particularly Coachella, Indio and surrounding unincorporated areas. The Casino could consider providing buses or vans to transport employees to and from designated pick-up spots. Given the high cost of gasoline, this could be seen by employees as a significant benefit to them. Transportation choices can be influenced by the extent to which options such as roads, bike and walking paths, public transit and the like are available to the people whose choices we wish to influence. A land use philosophy sometimes called “New Urbanism” attempts to promote ecologically sensitive transportation choices through community design principles that make pedestrian and bicycle movement safer and more convenient. Bicycle and pedestrian paths separated from vehicular traffic are part of such solutions. Of equal importance is the combination of retail, commercial and residential land uses into small nodes, so that residents of these communities can live close to where they work, shop and entertain themselves. Running counter to these impulses is the general tendency of American businesses to seek economies of scale through agglomeration of the production and other facilities into larger and larger units. In some non-industrial businesses, of course, electronic infrastructure can allow workers to work from home, the ideal solution from an energy consumption standpoint. To the extent the Tribe permits the development of additional businesses on the Reservation, it could require through either performance criteria or specific prescriptions that employers exert themselves to reduce the use of automobiles by their employees during commutes to Reservation job sites.
6.1.3 Access to Solar Resources
The Augustine Reservation’s location in a flat area of the Coachella Valley affords it exceptional access to solar radiation. In order to permit maximum utilization of this natural resource, it may make sense to regulate the design of buildings and the height of landscaping adjacent to roof areas that could be used for solar hot water or photovoltaic arrays. However, this must be balanced against the potentially important cooling effects provided by deciduous trees
23

during the hottest months of the year. That is, the same radiation that can be used to power solar systems creates exceptional demands on building cooling systems during the hot summer months when peak daytime temperatures over 110° F are common. Trees can also reduce landscape watering requirements, with attendant savings on the electricity used to treat and pump such water. Trees and other greenscape can also reduce absorption and re-radiation of heat from exterior surfaces, especially built surfaces like concrete and asphalt.
The City of Davis, California, appears to have pioneered the concept of solar easements in residential development. Solar easements grant a legal right to a property owner to have a defined amount of access to sunlight. If neighbor permits trees on his or her property to grow to a height that cast a shadow on the property owner’s solar equipment then, under defined circumstances, the property owner will have a legal basis for collecting damages from or seeking an injunction against the offending party. In practice this remedy appears to be little used in Davis, although that may because its availability is sufficient to deter violations of the solar easement.
The need for solar easements for individual property owners could be obviated by providing power to the Reservation community from one or more centralized photovoltaic and solar hot water facilities. Such centralization introduces some inefficiency in the system by increasing losses of current during the transmission of photo electricity or heat during the transmission of solar hot water. Centralized production also introduces administrative requirements for maintenance, price-setting, billing and collection of revenues. In a distributed (decentralized) system, each property owner would be responsible for his or her own maintenance. If such individual systems are connected to the off-Reservation grid, all of the administrative functions would be performed by the non-Tribal utility.
6.2 Incentives Many governments in the developed world now provide subsidies in the form of tax deductions, tax credits or other financial rewards to persons who install equipment designed to reduce energy consumption or to permit the use of alternative fuels. Market conditions determine the extent to which these subsidies benefit energy consumers as opposed to the vendors of equipment and services. Recently, one effect of these subsidies, enhanced by rapidly rising energy prices, has been to stimulate demand beyond the capacity of vendors to manufacture and install photovoltaic systems. This has allowed vendors in at least some markets to capitalize much of the value of the subsidies into the selling prices of equipment and installation services. It has also, however, stimulated the entrance of many manufacturers, financiers and installer contractors into the industry, which should eventually bring prices down, both because supply will catch up with demand and because innovation and consolidation will increase the efficiency and reduce the manufacturing cost per unit of output of photovoltaic systems.
24

Since the Augustine Band does not currently assess taxes of any kind on the Reservation, the most common form of providing subsidies, tax credits and accelerated depreciation, are not available to the Tribe. In lieu of tax incentives, the Tribe could provide regulatory incentives such as density bonuses, direct subsidies of equipment purchases, or cash payments to property owners. 7.0 PROPOSED POLICIES
7.1 Tribal Policy.
Energy conservation is given priority by the Augustine Band over alternative energy resource development because: (1) the initial capital requirements are less per unit of energy saved; (2) conservation measures generally have low or no energy input costs (e.g., energy used in the manufacture of equipment); and (3) many conservation measures have low or no operating or maintenance costs.
7.2 Energy Code.
The Tribe will adopt the 2006 International Energy Conservation Code (IECC). Although the International Energy Conservation Code is not perfect, the Tribe has already adopted the other International codes. The IEEC thus has the advantage of being well integrated into the other codes. It is informed by a reasonable balance between prescriptive and performance-based policies. It is also familiar to the construction industry, meaning that its future effect on construction costs should be minimal. This Code will be subject, however, to the policies in Section 2.2, below.
7.3 Energy utility.
The Tribe will engage in a study to determine the economic and administrative feasibility of centralized solar electricity and hot water utilities. Based on the study, the Tribe will either require all commercial electricity and hot water users to purchase these items from the Tribal utility or will require that all buildings constructed on the Reservation to offset at least 50 percent of their electricity and hot water use from solar sources.
7.4 Street lighting.
All street lighting on the Reservation will be photovoltaic. 7.5 Tribal buildings.
Buildings on the Reservation owned by the Tribe will be constructed in accordance the IECC, consistent with the policies of Section 7.2. In addition, the Tribe will impose operating standards on each tribally-owned building other than residential buildings.
25

7.6 Residential units constructed by the Tribe. In addition to the requirements of the IECC and Section 7.2, the Tribe will require that residential units be oriented and their roofs be designed in a manner consistent with optimal solar exposure.
7.7 Tribal commercial development.
7.7.1 Existing commercial development. The Tribe will require the managers of existing tribally-owned commercial development on the Reservation to engage a qualified consultant to conduct an impartial analysis of the economic feasibility of solar electric and/or hot water retrofit. For purposes of this Section, “Tribally-owned” means any building and business that is owned directly by the Augustine Band or by an agency or majority-owned venture of the Tribe.
7.7.2 Future commercial development. Each commercial project proposed for
construction on the Reservation shall be subject to Tribal review prior to the issuance of a building permit. The objective of this review will be to determine whether the design of the project includes all economically feasible energy conservation features.
7.8 Private residential development. The Tribe will require all residences developed on
the Reservation to install a solar hot water system and to offset at least 50 percent of their electricity needs form their own photovoltaic system or be connected solely to a Tribal electric utility, if one exists.
7.9 Private commercial development. Private commercial development means any
development comprising offices, retail stores, entertainment venues, warehouses, storage facilities, vehicle sales, facilities for recreational vehicles, schools, manufacturing facilities or facilities in which any other business is conducted and which are operated by private parties. Each commercial project proposed for construction on the Reservation shall be subject to Tribal review prior to the issuance of a building permit. The objective of this review will be to determine whether the design of the project includes all economically feasible energy conservation features.
7.10 Accommodation of new energy-conserving technologies. At least every 5 years,
the Tribe will update its energy conservation code and other policies to ensure that useful new energy conserving technologies are permitted in Reservation development projects.
7.11 Administration and sanctions. At least initially, the Tribe will engage one or more
contract building inspectors to review proposed building plans and ensure compliance with the IEEC and other applicable International codes.
7.12 Incentives. The Tribe will not provide incentives to property owners who install
alternative energy equipment at this time. If and when the market for such
26

equipment comes into better balance, the Tribe will consider such incentives if they can be demonstrated to b e necessary.
7.13 Project review. Review by the Tribe of proposed private development projects will
include an initial conference between the Tribe and the developer, review of conceptual site plans, landscape plans and designs and any required special studies, final review of working drawings, construction inspections, and final approval of the completed project. The details of this process will be the subject of a Tribal Code to be adopted by the Tribe.
7.14 Resolving policy conflicts. In the event that two or more polices adopted by the
Tribe are determined to be in conflict, the policy that best ensures the conservation of energy will be enforced.
7.15 Sanctions for non-compliance. [Reserved]
27

Exhibit 1: Summary of State Energy Conservation Codes¹
STATE RESIDENTIAL CODES
Residential Code: REScheck shows compliance:
Enforcement Status:
Approximate Stringency:
Residential Code Notes:
Alaska State Specific Code No Voluntary With Amendments
As stringent as the 2006 IECC
The Building Energy Efficiency Standard (BEES) uses the 2006 International Energy Conservation Code, with Alaska Specific Amendments. This is the mandatory minimum energy efficiency standard for construction using state financing programs.
Alabama State Specific Code No Voluntary With Amendments
As stringent as the 2000 IECC
Residential Energy Code for Alabama (RECA), a voluntary state developed code equivalent to the IECC 2000 without SHGC 0.40 is contingent upon local adoption. Four jurisdictions have adopted the International codes, including IECC 2000 without tampering with the low solar heat gain low-e window requirements.
Arkansas State Specific Code Yes Mandatory With Amendments
Less stringent than the 2003 IECC
Amendment excludes compliance to the .40 SHGC in hdd areas less than 3,500.
American Samoa
None No None Without Amendments
No Information
None.
Arizona 2000 IECC Yes Voluntary Without Amendments
As stringent as the 2000 IECC
California State Specific Code No Mandatory With Amendments
More stringent than the 2003 IECC
State-developed code, Part 6 of Title 24, which exceeds 2003 IECC is mandatory statewide as of Oct. 1, 2005.
Colorado 93 MEC Yes Voluntary Without Amendments
As stringent as the 93 MEC
1993 MEC for hotels, motels, and multifamily dwellings, mandatory in any area that does not adopt or enforce local codes.
Connecticut 2003 IECC Yes Mandatory Without Amendments
As stringent as the 2003 IECC
District of Columbia
2000 IECC Yes Mandatory Without Amendments
As stringent as the 2000 IECC
Delaware 2000 IECC Yes Mandatory Without Amendments
As stringent as the 2000 IECC
Florida State Specific Code No Mandatory With Amendments
More stringent than the 2000 IECC
State-developed code (Chapter 13 of the Florida Building Code), which exceeds 2000 IECC is mandatory statewide.
Georgia 2000 IECC Yes Mandatory With Amendments
As stringent as the 2000 IECC
2000 IECC with Georgia State Supplements and Amendments 2003, 2005 and 2006. Also an
28

Errata to the Amendment package.
Guam 93 MEC Yes Mandatory Without Amendments
As stringent as the 93 MEC
1993 MEC.
Hawaii None Yes Voluntary Without Amendments
No Information
Honolulu and Maui County require R-19 or equivalent in roofs of new residences. Hawaii County requires R-19 in the roofs and R-11 in the walls for homes that are centrally air conditioned. Kaui County currently does not have residential energy code provisions.
Iowa 2006 IECC Yes Mandatory Without Amendments
As stringent as the 2006 IECC
Idaho 2003 IECC Yes Mandatory Without Amendments
As stringent as the 2003 IECC
2003 IECC
Illinois None Yes Voluntary Without Amendments
No Information
None - The state of Illinois supports a Home Energy Rating System.
Indiana State Specific Code No Mandatory With Amendments
As stringent as the 92 MEC
Indiana Energy Conservation Code (1992 Model Energy Code with Indiana amendments)
Kansas 2003 IECC Yes Mandatory Without Amendments
As stringent as the 2003 IECC
2003 IECC or energy-efficiency disclosure form
Kentucky 2000 IECC Yes Mandatory With Amendments
As stringent as the 2000 IECC
2000 IECC for exterior building envelope only
Louisiana 2006 IRC Yes Mandatory Without Amendments
As stringent as the 2006 IRC
Effective 01/01/2007 2006 IRC with direct reference to 2006 IECC. Can use REScheck to show compliance to the 2006 IECC.
Massachusetts State Specific Code Yes Mandatory With Amendments
More stringent than the 95 MEC
1995 MEC with amendments
Maryland 2003 IECC Yes Mandatory Without Amendments
As stringent as the 2003 IECC
Maine 2003 IECC No Mandatory With Amendments
As stringent as the 2003 IECC
Michigan State Specific Code No Mandatory With Amendments
Less stringent than the 92 MEC
Michigan Uniform Energy Code Part 10 Rules, less stringent than 1992 MEC.
Minnesota State Specific Code Yes Mandatory With Amendments
More stringent than the 95 MEC
Minnesota State Building Code, based on the 1995 MEC
Missouri None No None Without Amendments
No Information
None statewide. State-owned single-family and multi-family residential buildings must comply with the latest edition of the MEC or ANSI/ASHRAE Standard 90.2-1993.
29

Commonwealth of the Northern Mariana Islands
State Specific Code No Mandatory Without Amendments
No Information
State-developed code, which adopts the 1989 CABO One- and Two-Family Dwelling Code is mandatory for all new and remodeled residential buildings.
Mississippi PRIOR 92 MEC No Voluntary Without Amendments
Less stringent than the PRIOR 92 MEC
State energy code, based on ASHRAE Standard 90-1975, is adopted by local jurisdictions.
Montana 2003 IECC Yes Mandatory With Amendments
As stringent as the 2003 IECC
2003 IECC with amendments: (1) Basement wall insulation maybe delayed until space is finished. (2) Log walls are exempt from R-value requirements. (3) All residential buildings must have an energy component label, listing insulation levels, window and heating and water heating efficiencies to be placed in/on the electrical panel.
North Carolina State Specific Code Yes Mandatory With Amendments
As stringent as the 2003 IECC
State-developed code, modeled on the 2003 IECC with amendments & Chapter 11 of 2003 IRC with amendments. Prescriptive statewide requirements of SHGC 0.40 & U-value of 0.4 or better, trade-off between building envelope and HVAC equipment not allowed.
North Dakota 93 MEC Yes Voluntary Without Amendments
As stringent as the 93 MEC
1993 MEC is contingent on adoption by local jurisdiction
Nebraska 2003 IECC Yes Mandatory Without Amendments
As stringent as the 2003 IECC
New Hampshire 2000 IECC Yes Mandatory With Amendments
As stringent as the 2000 IECC
2000 IECC
New Jersey 2006 IECC Yes Mandatory With Amendments
Less stringent than the 2006 IECC
On 2/20/07, NJ adopted the 2006 IECC with amendments. A six month interim period allows compliance to their previous code or new code. When showing compliance to their new energy code using REScheck, the 2003 IECC code option should be used rather than 2006 IECC and compliance should exceed 2003 IECC by two percent or more.
Previous code was based on 1995 CABO MEC with New Jersey modifications. Compliance using REScheck can be shown using NJ's version as the code option.
New Mexico 2003 IECC Yes Mandatory Without Amendments
As stringent as the 2003 IECC
July 1, 2004 IECC 2003 became effective.
Nevada 2003 IECC Yes Mandatory Without
As stringent as the 2003
The cities of Las Vegas, North Las Vegas, Henderson,
30

Amendments IECC Mesquite, Boulder City, and Clark County have adopted the 2003 IECC with an effective date of August 1, 2005. Washoe County, Reno and Sparks will enforce the 2003 IECC for residential and commercial buildings as of July 1, 2005. Carson City/County has adopted and is enforcing the 2003 IECC as of January 1, 2005.
New York 2001 IECC Yes Mandatory With Amendments
As stringent as the 2001 IECC
2001 IECC w/amendments.
Ohio 2003 IECC Yes Mandatory Without Amendments
As stringent as the 2003 IECC
Chapter 13 of the 2005 Ohio Building Code.
Oklahoma 2003 IECC Yes Voluntary Without Amendments
As stringent as the 2003 IECC
2003 IECC is mandatory for jurisdictions without codes and for all state owned and leased facilities.
Oregon State Specific Code No Mandatory With Amendments
More stringent than the 2000 IECC
State-developed code that exceeds 2000 IECC is mandatory statewide.
Pennsylvania 2006 IECC Yes Mandatory With Amendments
As stringent as the 2006 IECC
2006 IECC and/or 2006 IRC, Chapter 11.
Allowed prescriptive include: (1) The prescriptive methods for detached residential buildings contained in the current version of the ‘‘International Energy Conservation Code’’ compliance guide containing State maps, prescriptive energy packages and related software published by the United States Department of Energy, Building Energy Codes Program or (2) ‘‘Pennsylvania’s Alternative Residential Energy Provisions."
Puerto Rico State Specific Code No Mandatory With Amendments
Less stringent than the 95 MEC
The Code for Energy Conservation in Puerto Rico, based on ASHRAE/IESNA 90.1-1989, is mandatory for the entire island of Puerto Rico.
Rhode Island 2003 IECC Yes Mandatory Without Amendments
As stringent as the 2003 IECC
South Carolina 2003 IECC Yes Mandatory Without Amendments
As stringent as the 2003 IECC
South Dakota None No None Without Amendments
No Information
None.
Tennessee 92 MEC Yes Voluntary Without Amendments
As stringent as the 92 MEC
Local jurisdictions have the option of upgrading the energy efficiency code to 2000 IECC with 2001 Amendments.
Texas 2001 IECC Yes Mandatory Without Amendments
As stringent as the 2001 IECC
2000 IECC with 2001 Supplement
Utah 2006 IECC Yes Mandatory Without
As stringent as the 2006
31

Amendments IECC
Virginia 2003 IECC Yes Mandatory Without Amendments
As stringent as the 2003 IECC
U.S. Virgin Islands
None No None Without Amendments
No Information
None.
Vermont State Specific Code Yes Mandatory With Amendments
As stringent as the 2000 IECC
Based upon the 2000 IECC and Vermont's amendments.
Washington State Specific Code No Mandatory With Amendments
More stringent than the 2003 IECC
State-developed and implemented code. Most recent updates effective July 1, 2007. Exceeds 2003 IECC standards for most homes.
Wisconsin State Specific Code Yes Mandatory With Amendments
More stringent than the 95 MEC
State-developed code (COMM 22), which meets or exceeds 1995 MEC for 1-2 family dwelling (can use REScheck when use of WI code is designated); Multi-family dwellings must meet compliance with 2000 IECC (can use REScheck when use of 2000 IECC code is designated)
West Virginia 2003 IRC Yes Mandatory Without Amendments
As stringent as the 2003 IRC
2003 IRC with reference to 2003 IECC for compliance.
Wyoming None No Voluntary Without Amendments
As stringent as the PRIOR 92 MEC
The ICBO Uniform Building Code, which is based on the 1989 MEC, may be adopted and enforced by local jurisdictions.
Commercial State Codes
Commercial Code: COMcheck shows compliance:
Enforcement Status:
Approximate Stringency:
Commercial Code Notes:
Alaska None No None Without Amendments
No Information
None statewide. All public facilities must be designed to comply with the thermal and lighting energy standards adopted by the Alaska Department of Transportation and Public Facilities under AS44.42.020(a)(14).
Alabama None Yes Mandatory Without Amendments
As stringent as the ASHRAE 01
The Alabama Building Energy Conservation Code (ABECC) is a mandatory building code for state government buildings, administered by the Alabama Building Commission. The latest version of the Code (ABECC 2004) , which is based on ASHRAE/IESNA 90.1 – 2001, was adopted in March 2005 and was implemented by the Alabama Building Commission in September 2005.
Arkansas 2003 IECC Yes Mandatory Without Amendments
As stringent as the 2003 IECC
ASHRAE/IESNA 90.1-2001, which is referenced by the 2003 IECC.
American Samoa
None No None Without Amendments
No Information
None.
32

Arizona ASHRAE 99 Yes Voluntary Without Amendments
As stringent as the ASHRAE 99
State-owned or -funded buildings, must comply with ASHRAE/IESNA 90.1-1999.
California State Specific Code No Mandatory With Amendments
More stringent than the ASHRAE 04
State-developed code, Part 6 of Title 24, which meets or exceeds ASHRAE/IESNA 90.1-2004, is mandatory statewide as of Oct. 1, 2005.
Colorado 2003 IECC Yes Voluntary Without Amendments
As stringent as the 2003 IECC
Voluntary state provisions are based on 2003 IECC with reference to ASHRAE 90.1-2001
Connecticut 2003 IECC Yes Mandatory Without Amendments
As stringent as the 2003 IECC
2003 IECC with reference to ASHRAE 90.1-2001.
District of Columbia
2000 IECC Yes Mandatory Without Amendments
As stringent as the 2000 IECC
including reference to ASHRAE 90.1-1999
Delaware ASHRAE 99 Yes Mandatory Without Amendments
As stringent as the ASHRAE 99
ASHRAE 90.1-1999 provided that the respective county and municipality government shall exclude agricultral structures from the provisions.
Florida State Specific Code No Mandatory With Amendments
More stringent than the ASHRAE 01
State-developed code, which meets or exceeds ASHRAE/IESNA 90.1-2001 is mandatory statewide.
Georgia 2000 IECC Yes Mandatory With Amendments
More stringent than the 2000 IECC
2000 IECC with Georgia State Amendments to include ASHRAE 90.1-2004 with Georgia Amendments became effective Jan. 1, 2006
Guam ASHRAE 89 Yes Mandatory Without Amendments
As stringent as the ASHRAE 89
ASHRAE/IESNA 90.1-1989.
Hawaii None Yes Voluntary Without Amendments
No Information
Honolulu, Maui, and Kaui County require compliance with ASHRAE 90.1-1999. Hawaii County requires compliance with ASHRAE 90.1-1989.
Iowa 2006 IECC Yes Mandatory Without Amendments
As stringent as the 2006 IECC
2006 IECC with reference to ASHRAE 90.1-2004
Idaho 2003 IECC Yes Mandatory Without Amendments
As stringent as the 2003 IECC
2003 IECC
Illinois 2001 IECC Yes Mandatory Without Amendments
As stringent as the 2001 IECC
2000 IECC with the 01 Supplement
Indiana State Specific Code No Mandatory With Amendments
stringent than the 90A90B
Indiana Energy Conservation Code (1992 Model Energy Code with Indiana amendments)
Kansas 2003 IECC Yes Mandatory Without Amendments
As stringent as the 2003 IECC
2003 IECC
Kentucky 2003 IECC Yes Mandatory With Amendments
As stringent as the 2003 IECC
33

Louisiana ASHRAE 01 Yes Mandatory With Amendments
As stringent as the ASHRAE 01
No economizers are required.
Massachusetts State Specific Code Yes Mandatory With Amendments
More stringent than the 2001 IECC
Elements from both the ASHRAE/IESNA 90.1-1999 and the International Energy Conservative Code (IECC), with state specific amendments.
Maryland 2003 IECC Yes Mandatory Without Amendments
As stringent as the 2003 IECC
Maine ASHRAE 01 Yes Mandatory With Amendments
As stringent as the ASHRAE 01
ASHRAE/IESNA 90.1-2001
Michigan ASHRAE 99 Yes Mandatory With Amendments
As stringent as the ASHRAE 99
ASHRAE 90.1-1999 is the current standard. The new rules were effective March 13, 2003.
Minnesota State Specific Code Yes Mandatory With Amendments
More stringent than the ASHRAE 89
Minnesota State Building Code, based on ASHRAE/IESNA 90.1-1989
Missouri None No None Without Amendments
No Information
None, except state-owned buildings must comply with ASHRAE/IESNA 90.1-1989.
Commonwealth of the Northern Mariana Islands
State Specific Code No Mandatory Without Amendments
No Information
State-developed code, which adopts the 1991 Uniform Building Code is mandatory for all new and remodeled multi-family and commercial buildings.
Mississippi None No None Without Amendments
No Information
90-1975 is mandatory for state-owned buildings, public buildings, and high-rise buildings only.
Montana 2003 IECC Yes Mandatory Without Amendments
As stringent as the 2003 IECC
2003 IECC with reference to ASHRAE 90.1-2001
North Carolina State Specific Code Yes Mandatory With Amendments
More stringent than the 2000 IECC
State-developed code, modeled on the 2003 IECC with amendments including ASHRAE/IESNA 90.1-2004.
North Dakota ASHRAE 89 Yes Voluntary Without Amendments
As stringent as the ASHRAE 89
ASHRAE/IESNA 90.1-1989 is contingent on adoption by local jurisdiction
Nebraska 2003 IECC Yes Mandatory Without Amendments
As stringent as the 2003 IECC
2003 IECC with reference to ASHRAE 90.1-2001
New Hampshire 2000 IECC Yes Mandatory Without Amendments
As stringent as the 2000 IECC
2000 IECC with reference to ASHRAE 90.1-1999
New Jersey ASHRAE 04 Yes Mandatory With Amendments
As stringent as the ASHRAE 04
On 2/20/07 NJ adopted ASHRAE/IESNA 90.1-2004 with minor modifications.
A six month interim period allows users to show compliance to NJ's previous code or current energy code. Previous code was based on ASHRAE 90.1-1999.
New Mexico 2003 IECC Yes Mandatory Without Amendments
As stringent as the 2003 IECC
July 1, 2004 IECC 2003 became effective.
34

Nevada 2003 IECC Yes Mandatory Without Amendments
As stringent as the 2003 IECC
New York 2001 IECC Yes Mandatory With Amendments
As stringent as the 2001 IECC
2001 IECC w/amendments.
Ohio ASHRAE 04 Yes Mandatory Without Amendments
As stringent as the ASHRAE 04
ASHRAE 90.1-2004 became effective Sept. 6, 2005. Can show compliance to either 2003 IECC or 90.1-04.
Oklahoma 2003 IECC Yes Mandatory Without Amendments
As stringent as the 2003 IECC
2003 IECC is mandatory for jurisdictions without codes and for all state owned and leased facilities.
Oregon State Specific Code No Mandatory With Amendments
More stringent than the ASHRAE 99
State-developed code that meets or exceeds ASHRAE/IESNA 90.1-1999 is mandatory statewide.
Pennsylvania 2006 IECC Yes Mandatory With Amendments
As stringent as the 2006 IECC
2006 IECC with reference to ASHRAE 90.1-2004
Puerto Rico State Specific Code No Mandatory With Amendments
Less stringent than the ASHRAE 89
The Code for Energy Conservation in Puerto Rico, based on ASHRAE/IESNA 90.1-1989, is mandatory for the entire island of Puerto Rico.
Rhode Island 2003 IECC Yes Mandatory Without Amendments
As stringent as the 2003 IECC
With reference to ASHRAE 90.1-2001
South Carolina 2003 IECC Yes Mandatory Without Amendments
As stringent as the 2003 IECC
2003 IECC with reference to ASHRAE 90.1-2001
South Dakota None No None Without Amendments
No Information
None.
Tennessee 90A90B No Voluntary Without Amendments
As stringent as the 90A90B
Local jurisdictions have the option of upgrading the energy efficiency code to 2000 IECC with 2001 amendments.
Texas 2001 IECC Yes Mandatory Without Amendments
As stringent as the 2001 IECC
2000 IECC with 2001 Supplement
Utah 2006 IECC Yes Mandatory Without Amendments
As stringent as the 2006 IECC
with reference to ASHRAE 90.1-2004
Virginia 2003 IECC Yes Mandatory With Amendments
As stringent as the 2003 IECC
2003 IECC with reference to ASHRAE 90.1-2004 effective November 2005
U.S. Virgin Islands
None No None Without Amendments
No Information
None.
Vermont State Specific Code Yes Mandatory With Amendments
More stringent than the 2004 IECC
Based on 2004 IECC with amendments to include ASHRAE 90.1-2004
Washington State Specific Code No Mandatory With Amendments
More stringent than the ASHRAE 01
State-developed code that meets or exceeds ASHRAE/IESNA 90.1-2001. Most recent updates effective July 1, 2007.
Wisconsin State Specific Code Yes Mandatory With Amendments
As stringent as the 2000 IECC
2000 IECC w/amendments; can use COMcheck for building envelope, but not for HVAC or lighting. Set the code to be used
35

with the "2000 IECC". Multi family buildings (3 stories or less, 3 dwellings or more) are considered commercial buildings in Wisconsin. REScheck may be used with these buildings if program is set for use with the "2000 IECC".
West Virginia 2003 IECC Yes Mandatory Without Amendments
As stringent as the 2003 IECC
Wyoming None No Voluntary Without Amendments
As stringent as the PRIOR 90A90B
The ICBO Uniform Building Code, which is based on the 1989 MEC, may be adopted and enforced by local jurisdictions.
NOTES: ¹ Source: U.S. Department of Energy
36