august 2017 company overview...august 2017 company overview webster city square.com/investors iowa,...
TRANSCRIPT

August 2017 Company Overview
WEBSTER CITY Iowa, U.S.SQUARE.COM/INVESTORS
2
Cautionary statementThis document contains forward-looking statements within the meaning of Section 27A of the Securities Act of 1933, as amended, and Section 21E of the Securities Exchange Act of 1934, as amended, which statements involve substantial risks and uncertainties. All statements other than statements of historical fact could be deemed forward-looking, including, but not limited to, statements regarding possible or assumed future results of operations; the business plans and strategies of Square, Inc. (the “Company”); the Company’s ability to cross-sell and up-sell its products; and information concerning expansion into new markets. Such statements are subject to a number of risks, uncertainties, and assumptions, and investors are cautioned not to place undue reliance on these statements. Actual results could differ materially from those expressed or implied, and reported results should not be considered as an indication of future performance.
Risks that contribute to the uncertain nature of the forward-looking statements include, among others, risks associated with developing and delivering products and services to address the rapidly evolving market for payments and point-of-sale, financial, and marketing services; the Company’s ability to expand its product portfolio and market reach and deal with the substantial and increasingly intense competition in its industry; the Company’s ability to retain existing sellers, attract new sellers, and increase sales to all sellers; changes to the rules and practices of payment card networks and acquiring processors; the Company’s history of generating net losses; possible fluctuations in the Company’s results of operation and operating metrics; and the effect of management changes and business initiatives, as well as other risks listed or described from time to time in the Company's filings with the Securities and Exchange Commission (the “SEC”), including the Company’s most recent filing on Form 10-Q, which is on file with the SEC and available on the investor relations page of the Company's website. Except as required by law, the Company assumes no obligation to update any of the statements in this document.
This document includes certain non-GAAP measures not based on generally accepted accounting principles. These non-GAAP measures are in addition to, not a substitute for or superior to, measures of financial performance prepared in accordance with GAAP. The non-GAAP measures used by the Company may differ from the non-GAAP measures used by other companies. Reconciliations between GAAP and these non-GAAP measures are included in the appendix to this document. In addition, unless otherwise indicated, such non-GAAP measures and other metrics such as Adjusted Revenue, Adjusted EBITDA, Adjusted EBITDA margin, non-GAAP operating expenses, GPV, active sellers, revenue retention rate, and payback period exclude the impact of Starbucks.

3
Investment thesis
Massive Market Opportunity
Unique and Scalable Assets
Powerful Business Model

4
The checklist to start a business is dauntingPAYMENTS POINT OF SALE RECEIPTS EMPLOYEES
ANALYTICS FINANCE INVOICES MARKETING
5
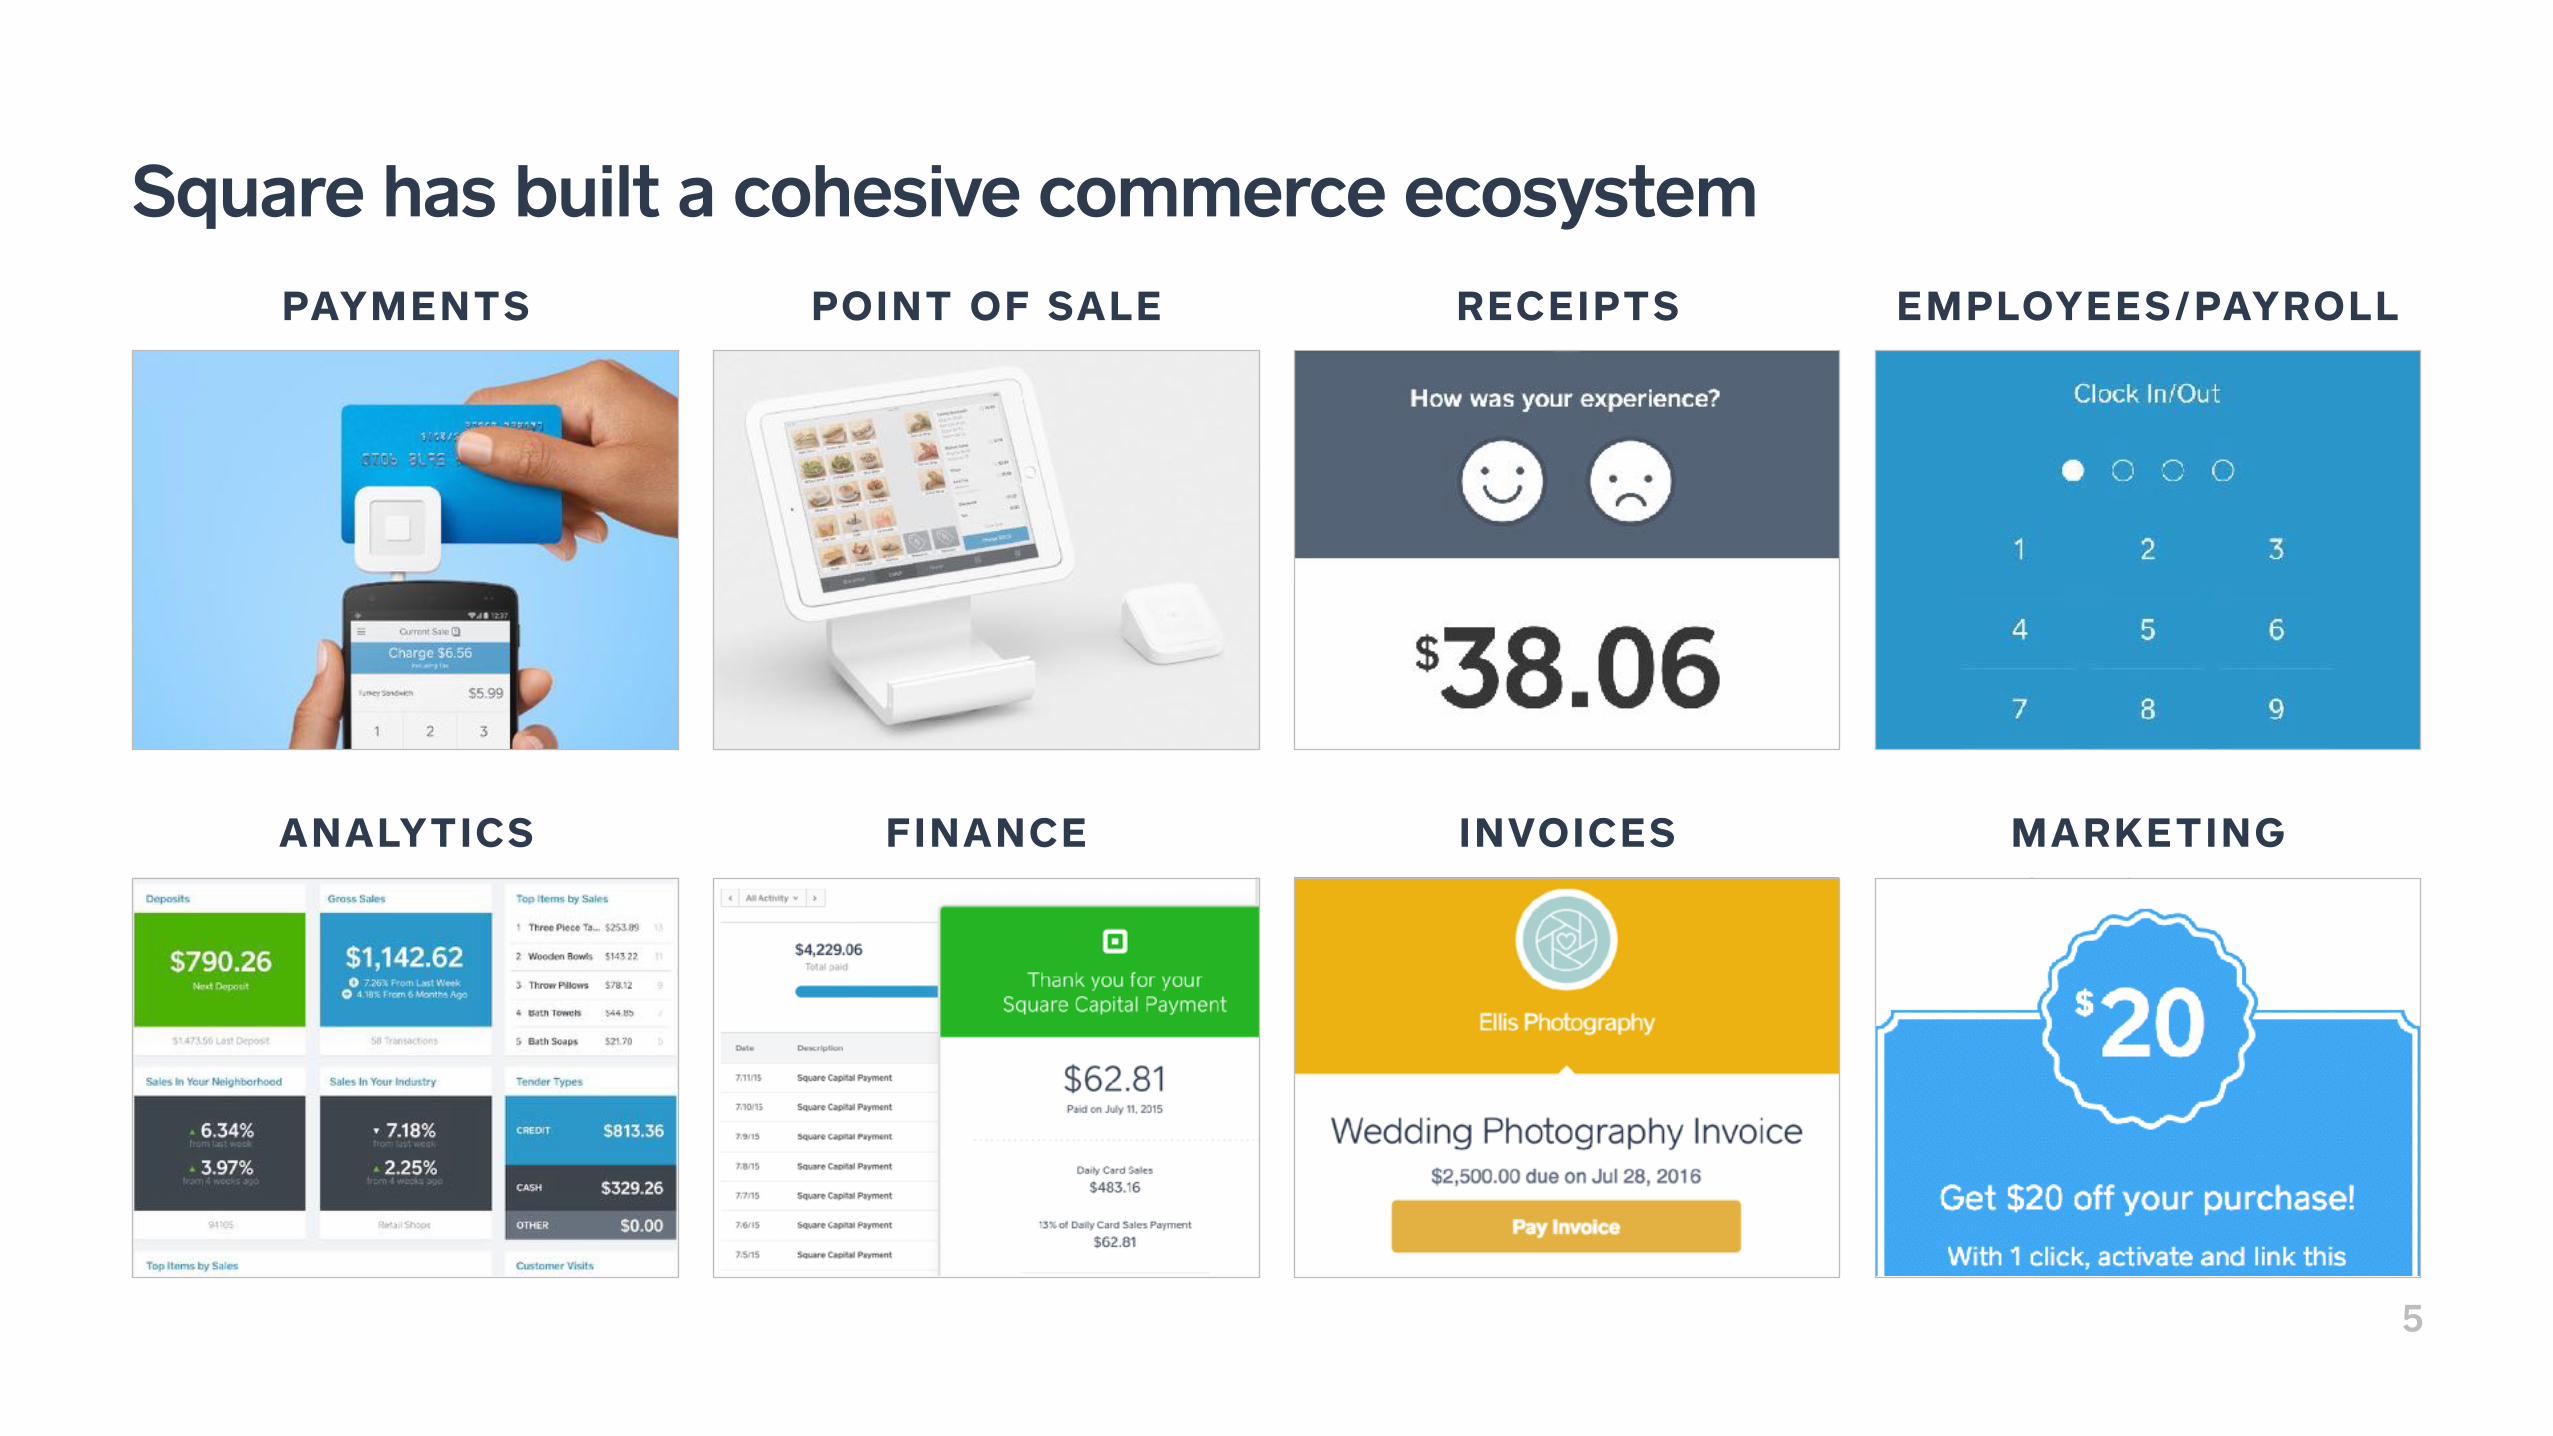
Square has built a cohesive commerce ecosystemPAYMENTS POINT OF SALE RECEIPTS EMPLOYEES/PAYROLL
ANALYTICS FINANCE INVOICES MARKETING
6
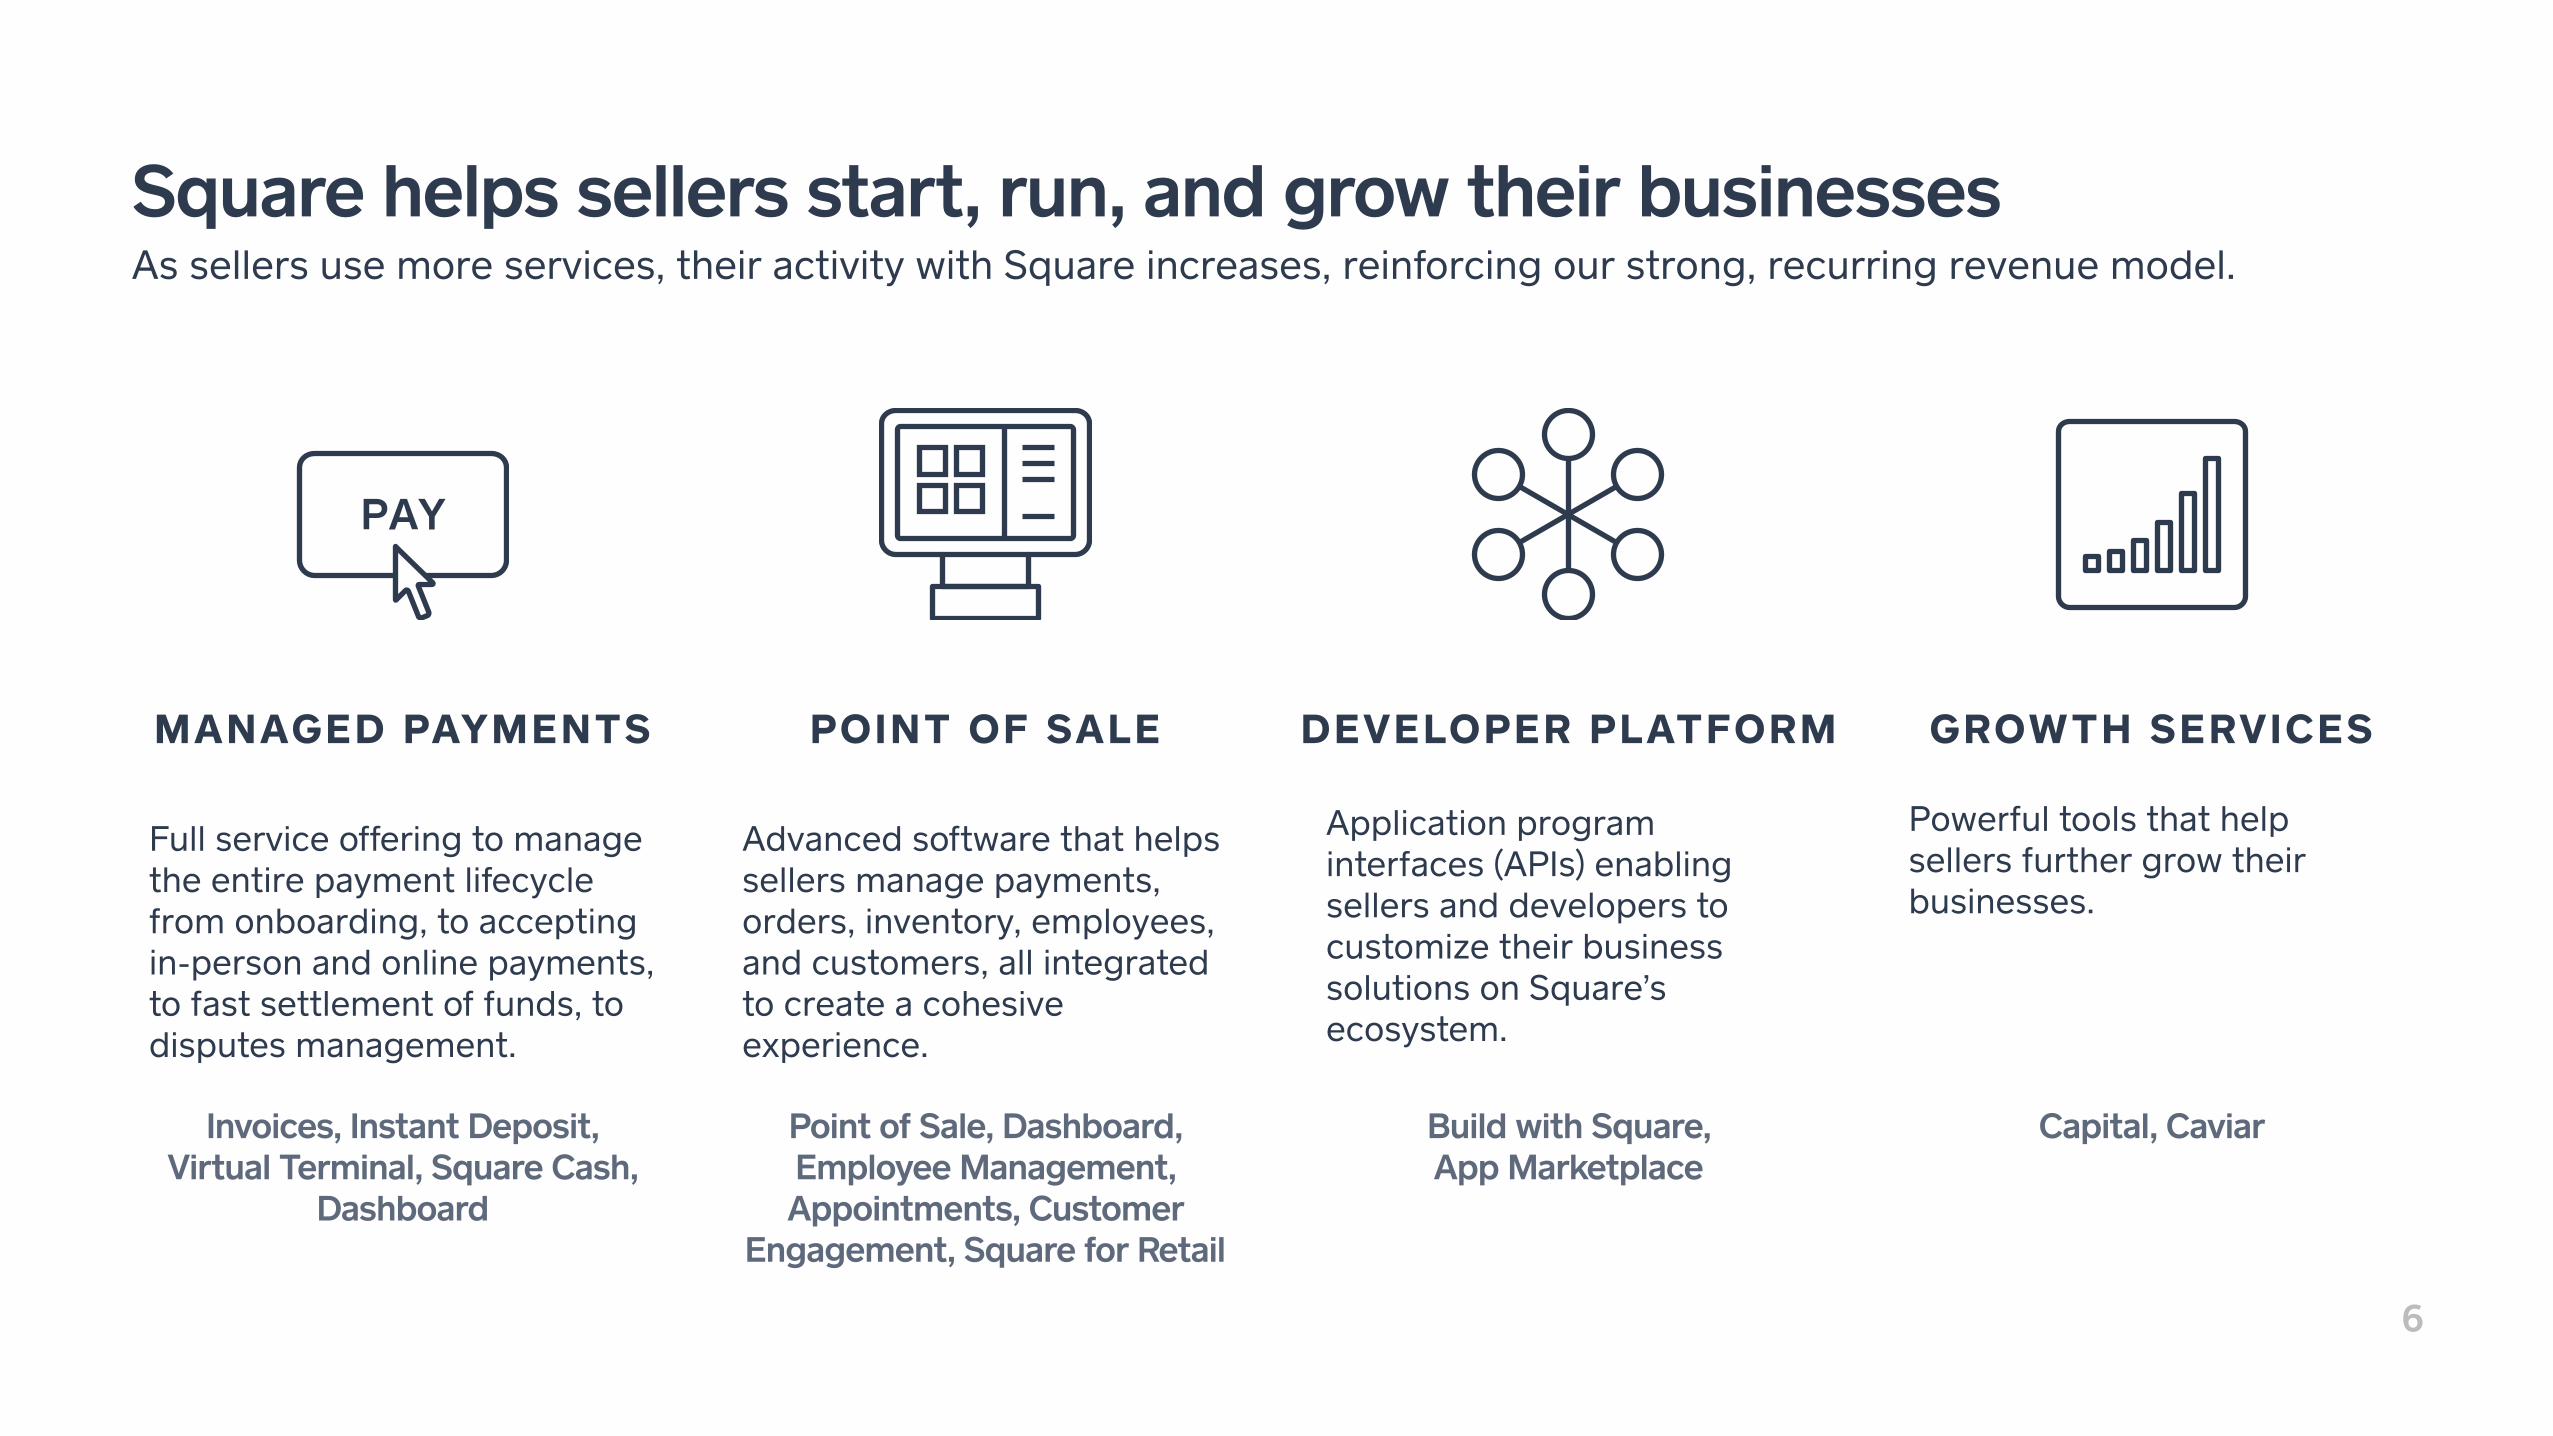
Square helps sellers start, run, and grow their businesses As sellers use more services, their activity with Square increases, reinforcing our strong, recurring revenue model.
Full service offering to manage the entire payment lifecycle from onboarding, to accepting in-person and online payments, to fast settlement of funds, to disputes management.
Advanced software that helps sellers manage payments, orders, inventory, employees, and customers, all integrated to create a cohesive experience.
Application program interfaces (APIs) enabling sellers and developers to customize their business solutions on Square’s ecosystem.
Powerful tools that help sellers further grow their businesses.
Invoices, Instant Deposit, Virtual Terminal, Square Cash,
Dashboard
Point of Sale, Dashboard, Employee Management, Appointments, Customer
Engagement, Square for Retail
Build with Square, App Marketplace
Capital, Caviar
MANAGED PAYMENTS POINT OF SALE DEVELOPER PLATFORM GROWTH SERVICES
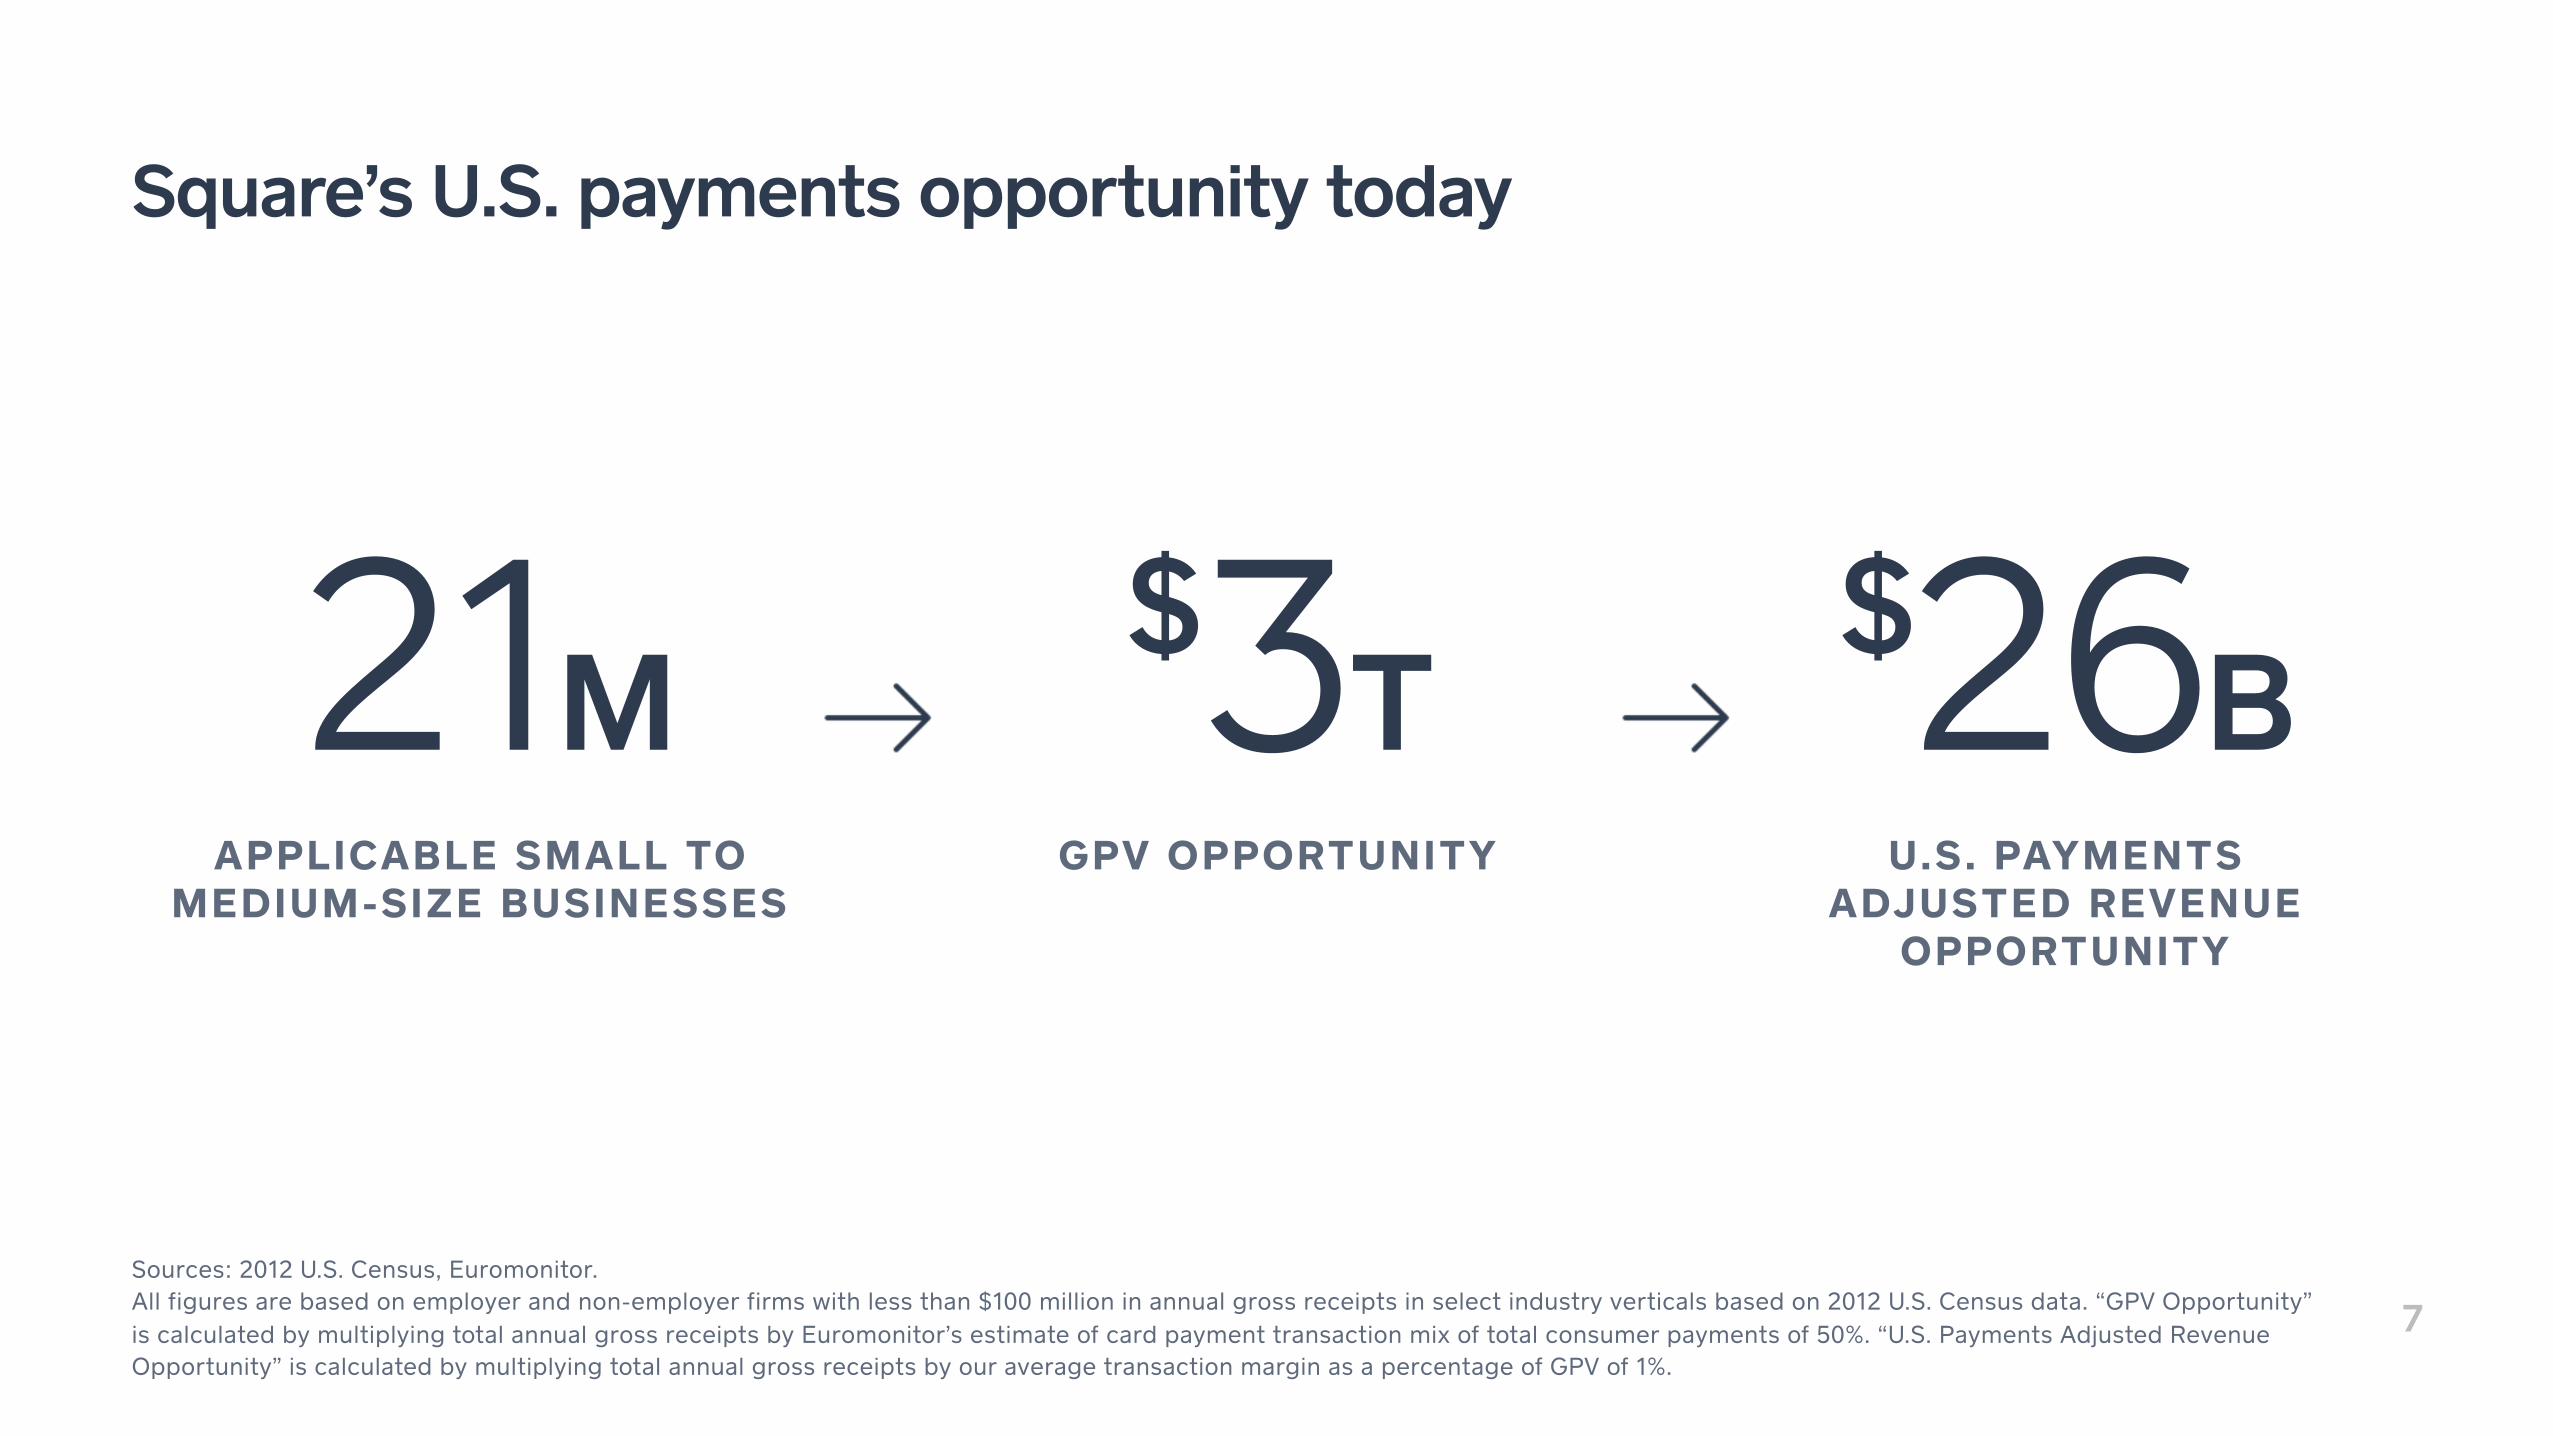
7Sources: 2012 U.S. Census, Euromonitor. All figures are based on employer and non-employer firms with less than $100 million in annual gross receipts in select industry verticals based on 2012 U.S. Census data. “GPV Opportunity” is calculated by multiplying total annual gross receipts by Euromonitor’s estimate of card payment transaction mix of total consumer payments of 50%. “U.S. Payments Adjusted Revenue Opportunity” is calculated by multiplying total annual gross receipts by our average transaction margin as a percentage of GPV of 1%.
Square’s U.S. payments opportunity today
21M$26B
APPLICABLE SMALL TO MEDIUM-SIZE BUSINESSES
U.S. PAYMENTS ADJUSTED REVENUE
OPPORTUNITY
$3TGPV OPPORTUNITY
8
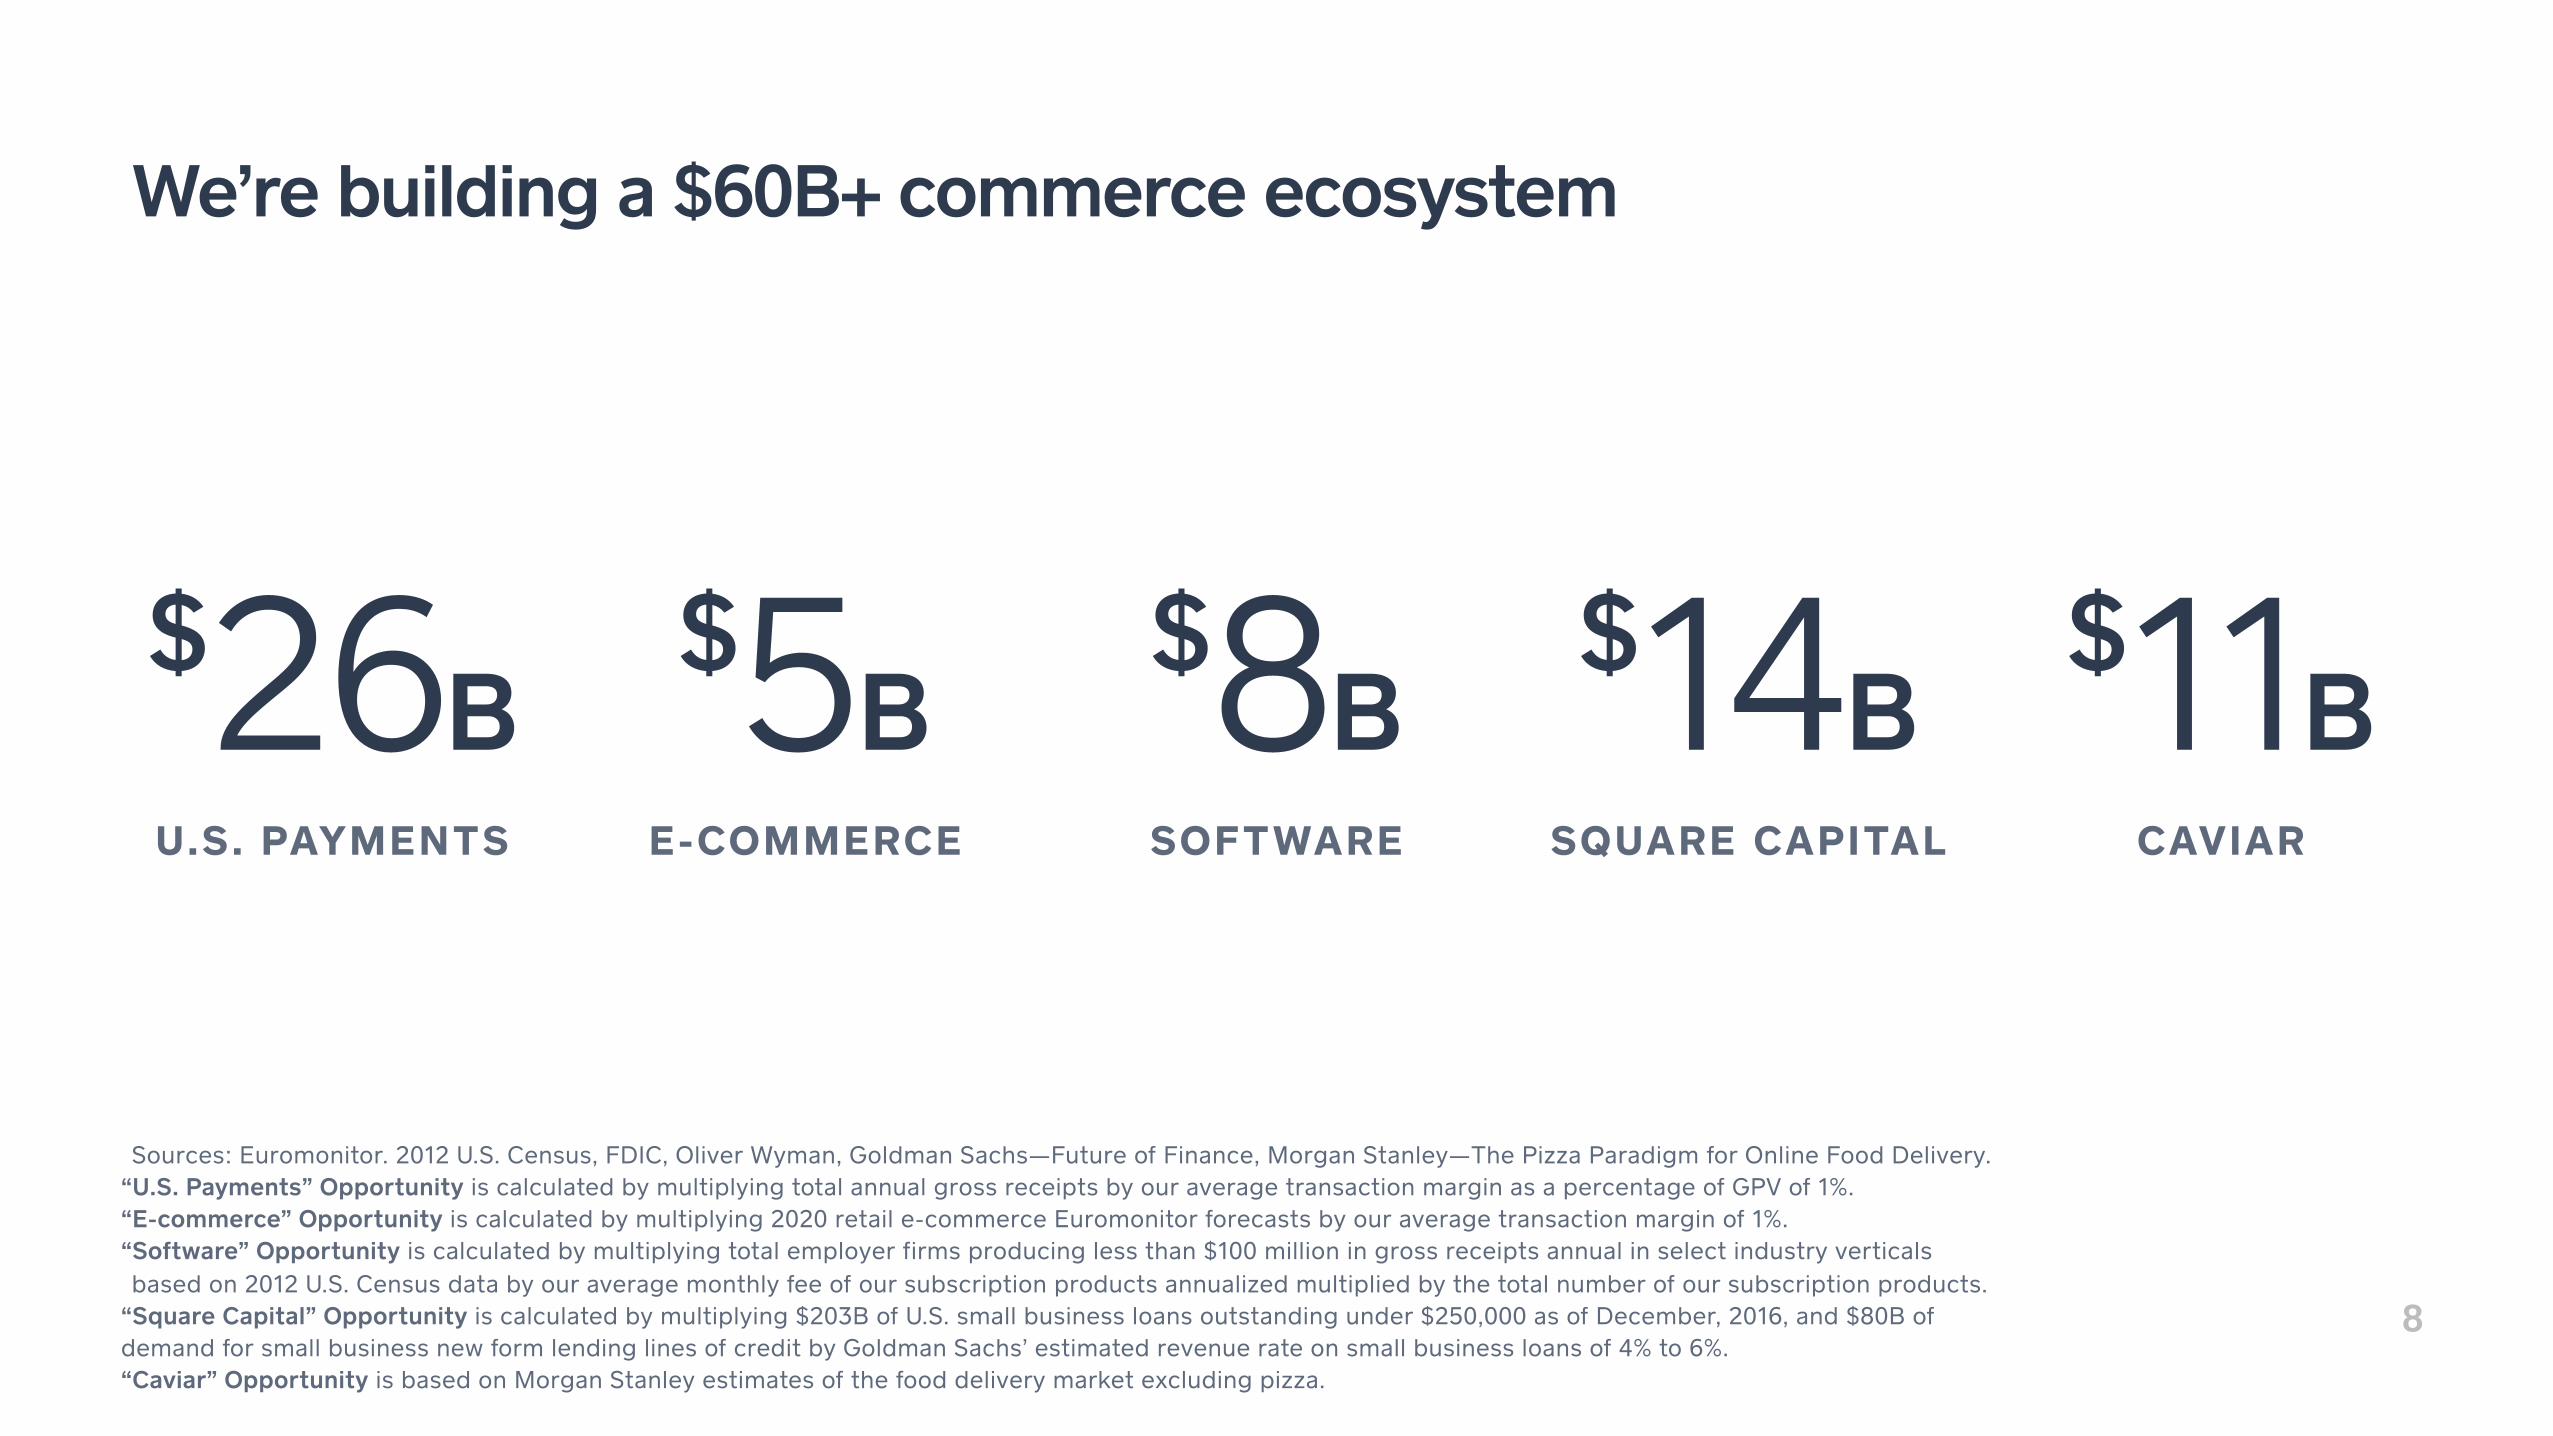
We’re building a $60B+ commerce ecosystem
Sources: Euromonitor. 2012 U.S. Census, FDIC, Oliver Wyman, Goldman Sachs—Future of Finance, Morgan Stanley—The Pizza Paradigm for Online Food Delivery. “U.S. Payments” Opportunity is calculated by multiplying total annual gross receipts by our average transaction margin as a percentage of GPV of 1%. “E-commerce” Opportunity is calculated by multiplying 2020 retail e-commerce Euromonitor forecasts by our average transaction margin of 1%. “Software” Opportunity is calculated by multiplying total employer firms producing less than $100 million in gross receipts annual in select industry verticals based on 2012 U.S. Census data by our average monthly fee of our subscription products annualized multiplied by the total number of our subscription products.
“Square Capital” Opportunity is calculated by multiplying $203B of U.S. small business loans outstanding under $250,000 as of December, 2016, and $80B of demand for small business new form lending lines of credit by Goldman Sachs’ estimated revenue rate on small business loans of 4% to 6%. “Caviar” Opportunity is based on Morgan Stanley estimates of the food delivery market excluding pizza.
$26BU.S. PAYMENTS
$5BE-COMMERCE
$8BSOFTWARE
$14BSQUARE CAPITAL
$11BCAVIAR

9Sources: 2012 U.S. Census, International Finance Corporation (IFC), The Nilson Report. U.S. small business is based on employer and non-employer firms with less than $100 million in annual gross receipts in select industry verticals based on 2012 U.S. Census data. Small business count figures based on U.S. Census and International Finance Corporation (IFC). Global Card Volume represents 2025 projection.
The global opportunity is potentially 6–7x that in the U.S.
SMALL BUSINESSES CARD VOLUME
U.S GLOBAL
125M
21M
U.S GLOBAL
$55T
$10T
10
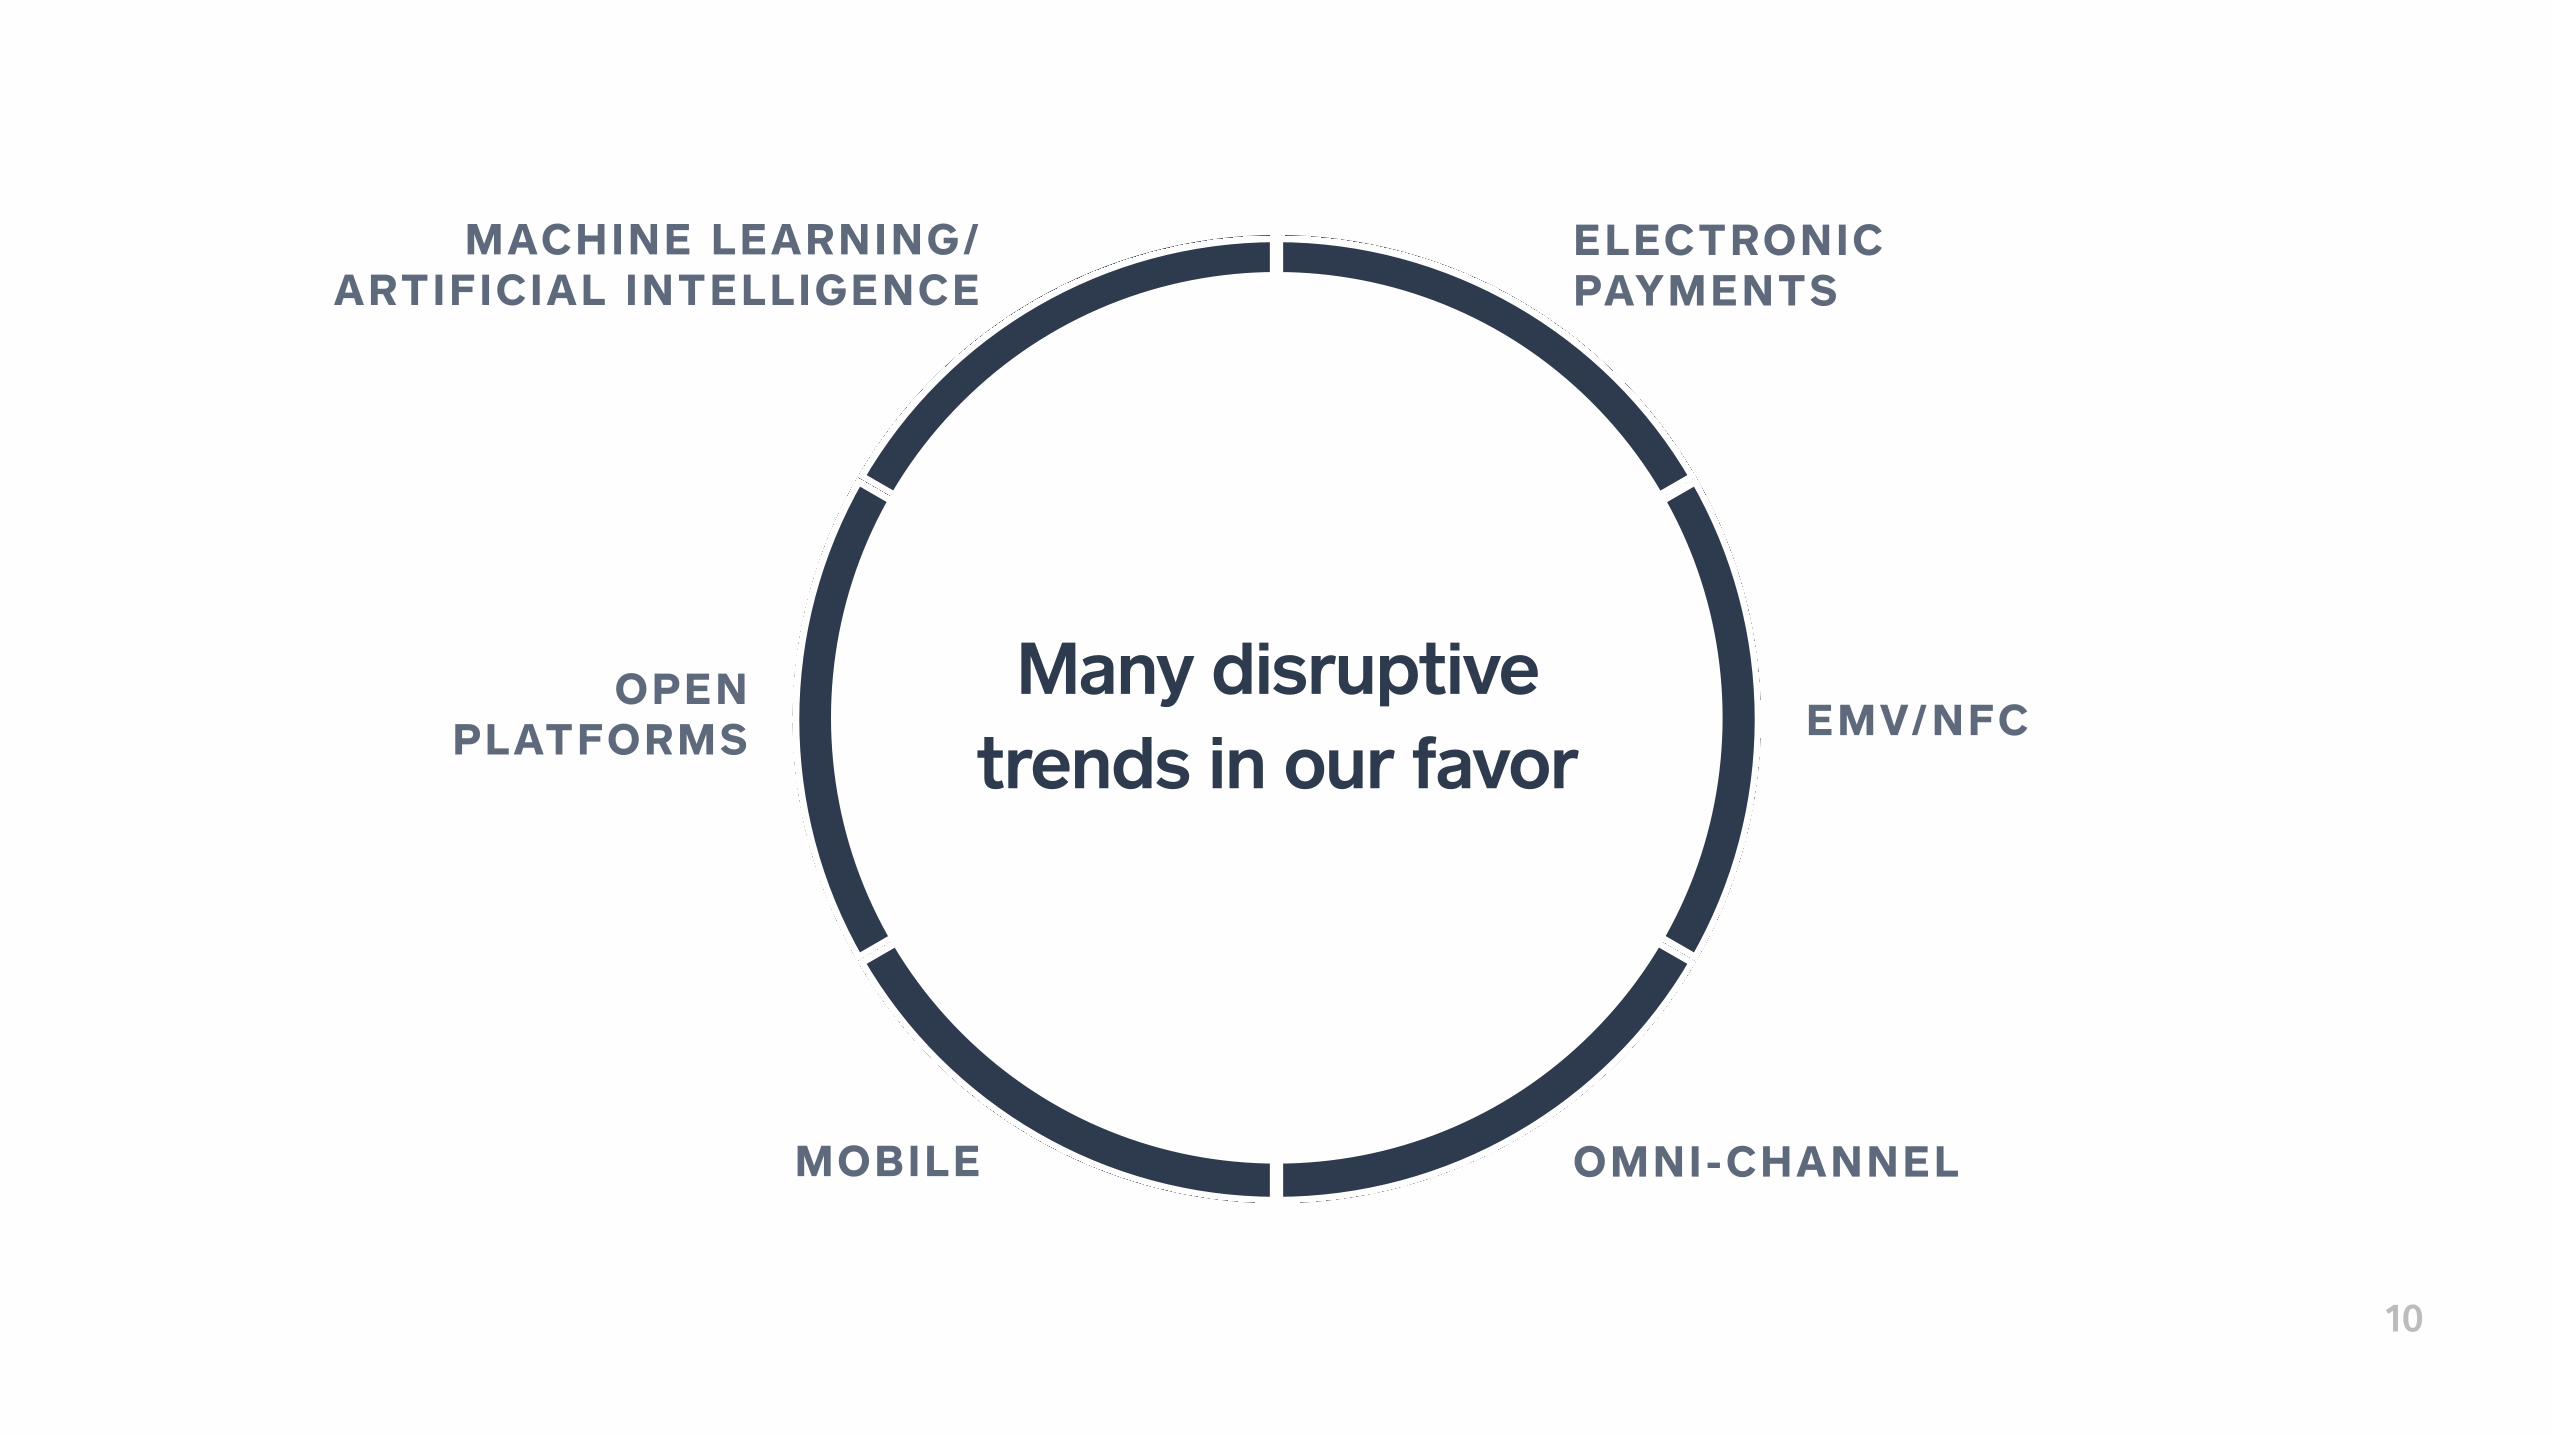
EMV/NFC
ELECTRONIC PAYMENTS
OMNI-CHANNELMOBILE
MACHINE LEARNING/ ARTIFICIAL INTELLIGENCE
OPEN PLATFORMS
Many disruptive trends in our favor

11Transaction loss rate and Square Net Promoter Score (NPS) represented as a trailing four-quarter average ended June 30, 2017. Banking NPS calculated by Satmetrix Systems, Inc., a third-party research firm.
Why Square wins: Unique assets, difficult to copy, and at scale
FOCUS ON TECHNOLOGY AND DESIGN Integrated, end-to-end: hardware, software, payments, and data
BREADTH OF MANAGED PAYMENTS Comprehensive, full-service offering that helps sellers manage the entire payment life cycle
DIFFERENTIATED RISK MANAGEMENT Transaction loss rate at ~0.1% of GPV while maintaining high acceptance rates
OMNI-CHANNEL CAPABILITIES Powerful solutions that enable sellers to accept both in-store and online payments
OPEN PLATFORM Flexible platform expands functionality that benefits sellers, developers, partners, and Square
STRONG BRAND 65 net promoter score, ~2x the average for banking service providers
BREADTH AND EFFICIENCY OF GO-TO-MARKET Quick and easy onboarding and ubiquitous and scalable distribution channels
PERSISTENT COMMUNICATION CHANNEL
Direct, ongoing interactions with sellers help us deliver offerings in the context of their usage

We lead with a strong brand. Our high NPS of 65 means our sellers recommend our services to others.
We also focus on direct and scalable marketing channels.
These include online display and search marketing, social media, direct mail, referral programs, television, direct sales, and others.
Square hardware products are available at over 36,000 retail stores.
We work with third-party developers who offer our solutions to their customers.
BRAND MARKETING RETAIL DISTRIBUTION PARTNERS
12Net Promoter Score (NPS) represented as a trailing four-quarter average ended June 30, 2017.
Scalable go-to-market strategy…
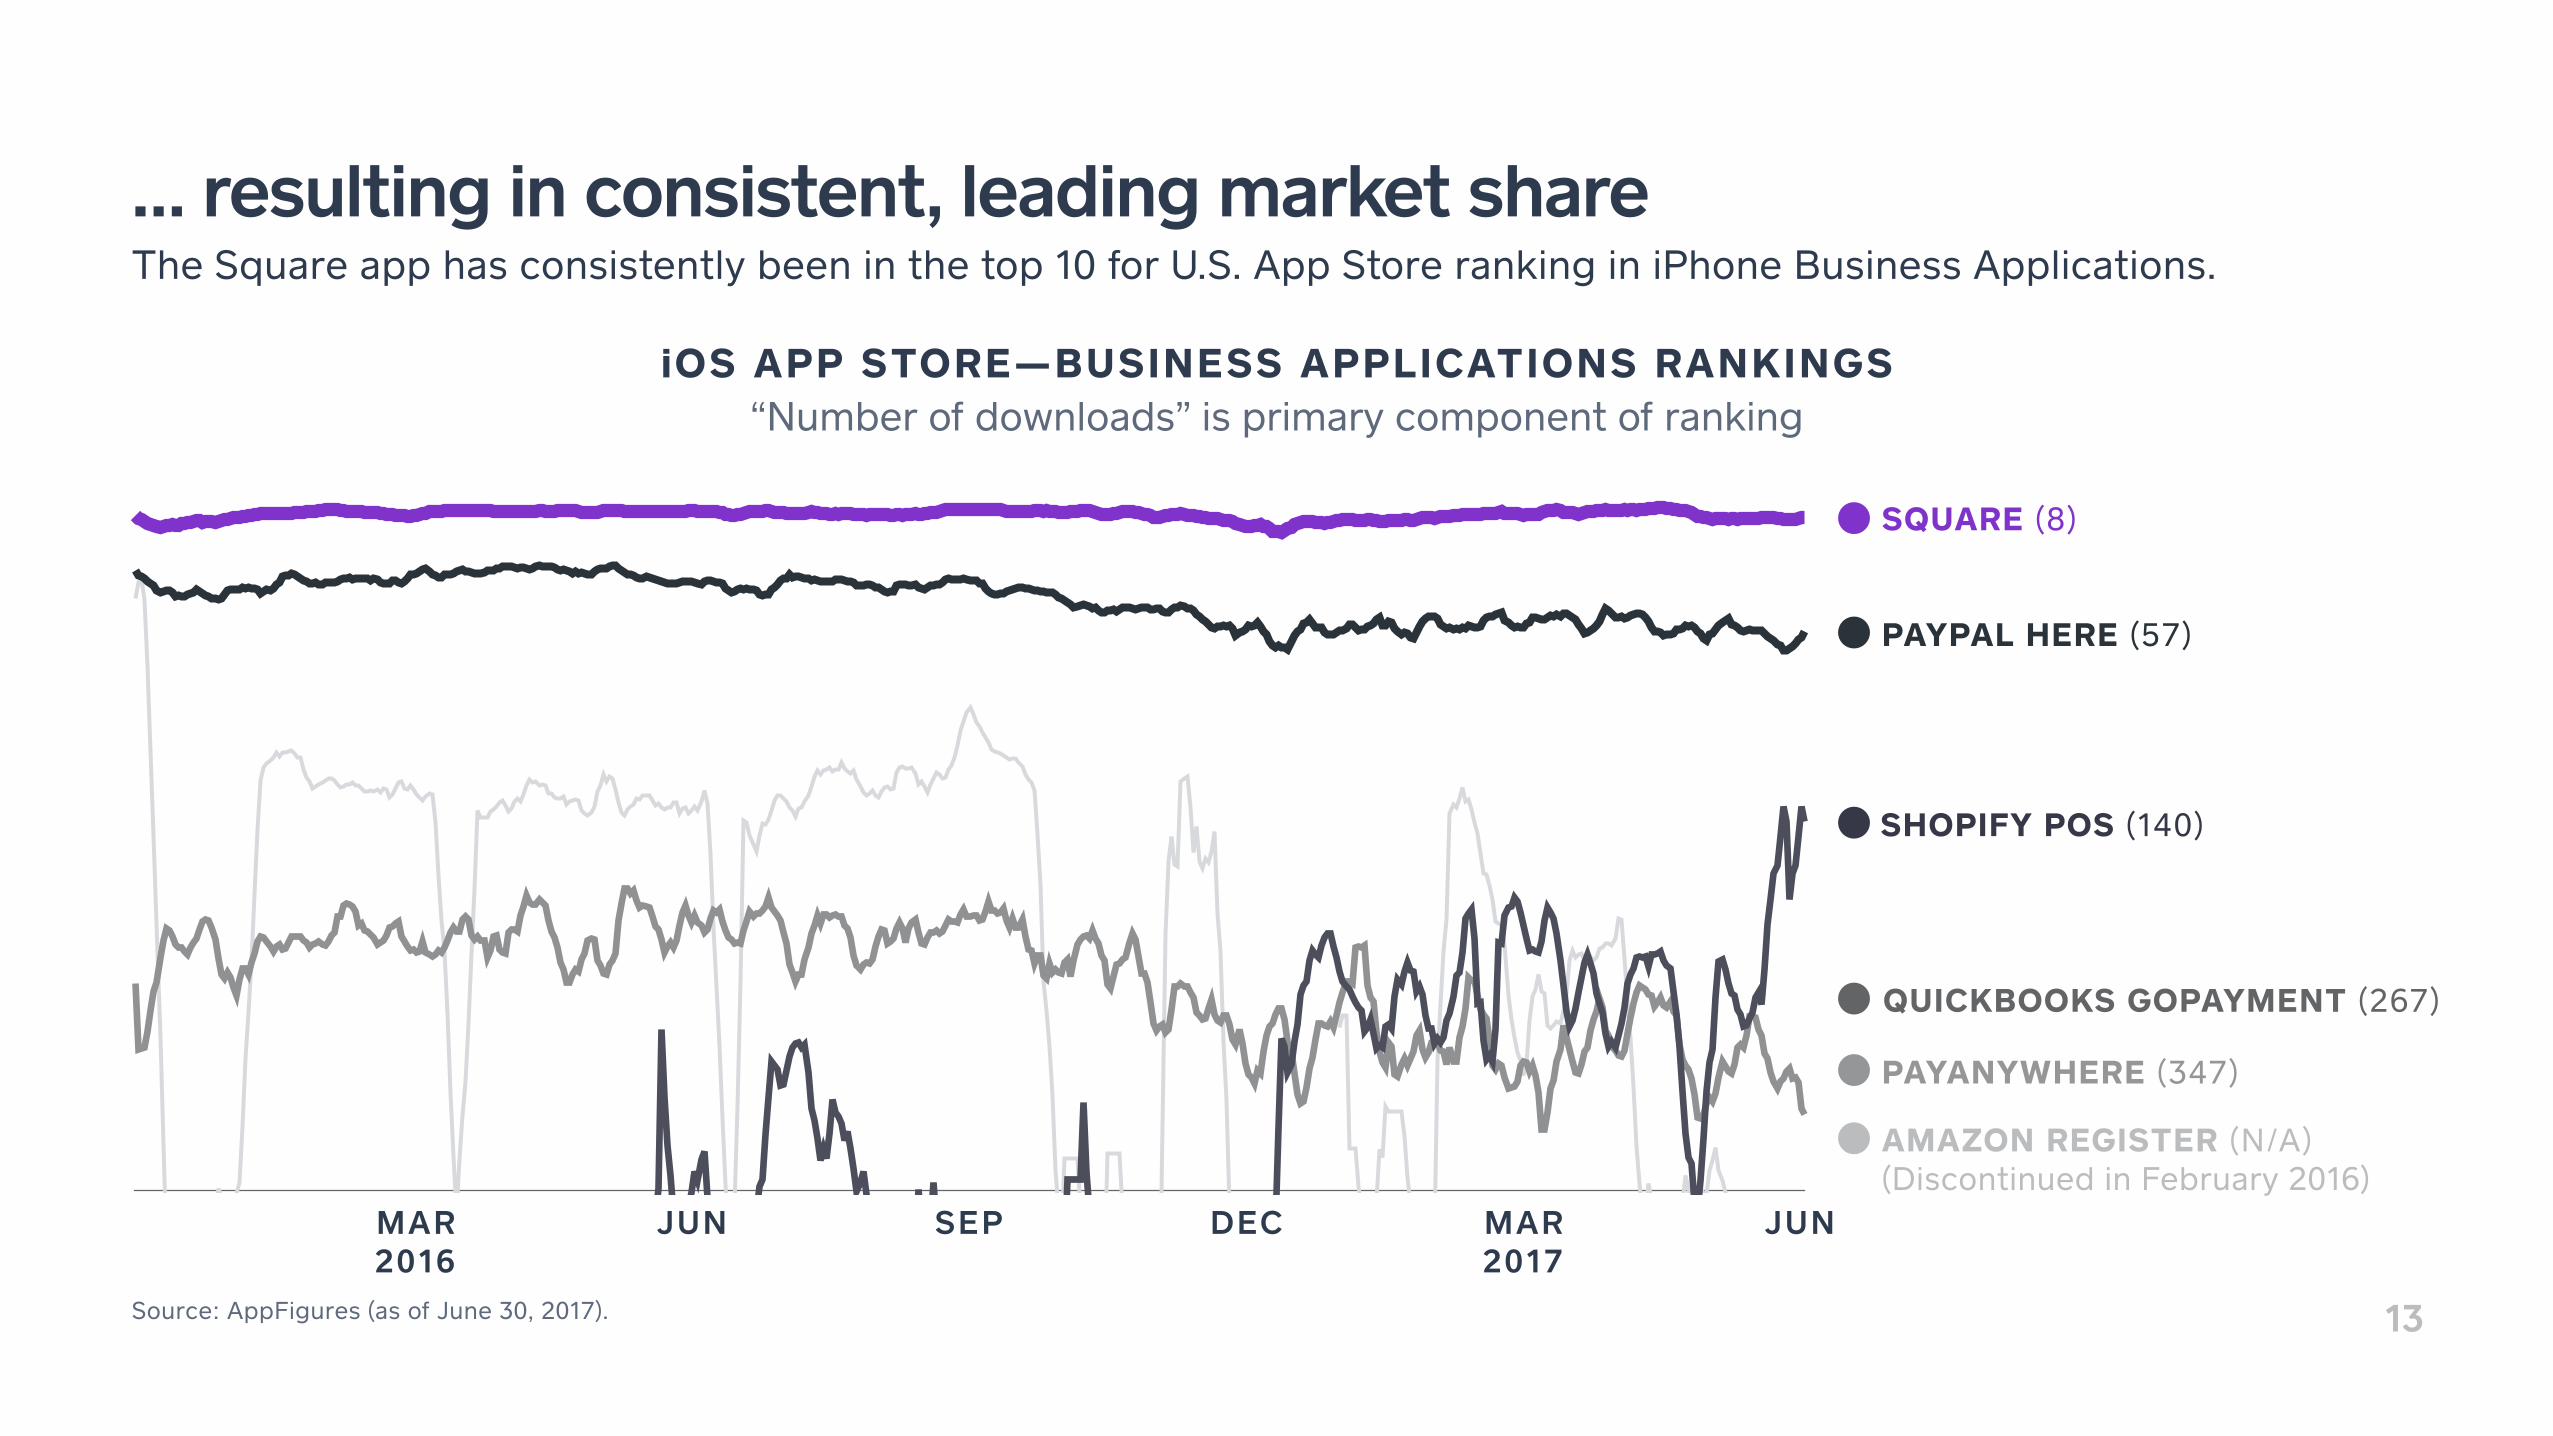
13Source: AppFigures (as of June 30, 2017).
… resulting in consistent, leading market share The Square app has consistently been in the top 10 for U.S. App Store ranking in iPhone Business Applications.
iOS APP STORE—BUSINESS APPLICATIONS RANKINGS “Number of downloads” is primary component of ranking
SQUARE (8)
PAYPAL HERE (57)
PAYANYWHERE (347)
QUICKBOOKS GOPAYMENT (267)
AMAZON REGISTER (N/A) (Discontinued in February 2016)
SHOPIFY POS (140)
MAR 2016
JUNMAR 2017
DECSEPJUN

14Source: AppFigures (as of June 30, 2017).
… across multiple devices
iPHONE BUSINESS APP RANKINGS iPAD BUSINESS APP RANKINGS
SQUARE (4)
SHOPIFY POS (39)
SHOPKEEP (141)
CLOVER GO (217)
REVEL (322)
QUICKBOOKS GOPAYMENT (130)
SQUARE (8)
PAYPAL HERE (57)
PAYANYWHERE (347)
QUICKBOOKS GOPAYMENT (267)
AMAZON REGISTER (N/A) (Discontinued in February 2016)
SHOPIFY POS (140)

15
A platform for developers to meet sellers’ needs
E-COMMERCE
Integrate Square on websites, enabling sellers to manage offline and online businesses.
IN-HOUSE
Integrate Square into a seller’s specialized POS to accept payments and access other services.
THIRD-PARTY APPS
Integrate Square with third-party apps and back-office solutions that bring additional functionality.
WIX E-COMMERCE
MAGENTO E-COMMERCE
WOOCOMMERCE E-COMMERCE
QUICKBOOKS ACCOUNTING
TOUCHBISTRO POINT OF SALE
XERO ACCOUNTING
VEND POINT OF SALE
LASER AWAY HAIR AND TATTOO REMOVAL
HAMPTON JITNEY TRANSPORTATION
PHILZ COFFEE COFFEEHOUSE

16Data points shown above are as of June 30, 2017. Active sellers defined as sellers with five or more payments in the last 12 months. See appendix for GAAP reconciliation to Adjusted Revenue and Adjusted EBITDA. Adjusted EBITDA margin is calculated as Adjusted EBITDA divided by Adjusted Revenue. Payback calculated as the number of quarters it takes for a cohort of sellers’ cumulative Adjusted Revenue (excluding hardware and Gift Cards revenue) to surpass our sales and marketing spending in the quarter in which we acquired that cohort. Revenue retention rate is calculated as year-over-year retention of Adjusted Revenue (excluding hardware and Gift Cards revenue) for our cohorts on average for the last four quarters.
Our business model provides a compelling investment opportunity
TREMENDOUS SCALE Millions of active sellers, $57 billion trailing four quarter GPV
SIGNIFICANT GROWTH 41% Adjusted Revenue year-over-year growth
ATTRACTIVE COHORT ECONOMICS
Positive Adjusted Revenue retention rate and 3-to-4 quarter payback
STRONG MARGIN TRAJECTORY
$36 million in Adjusted EBITDA, representing 15% margin

Financial Overview
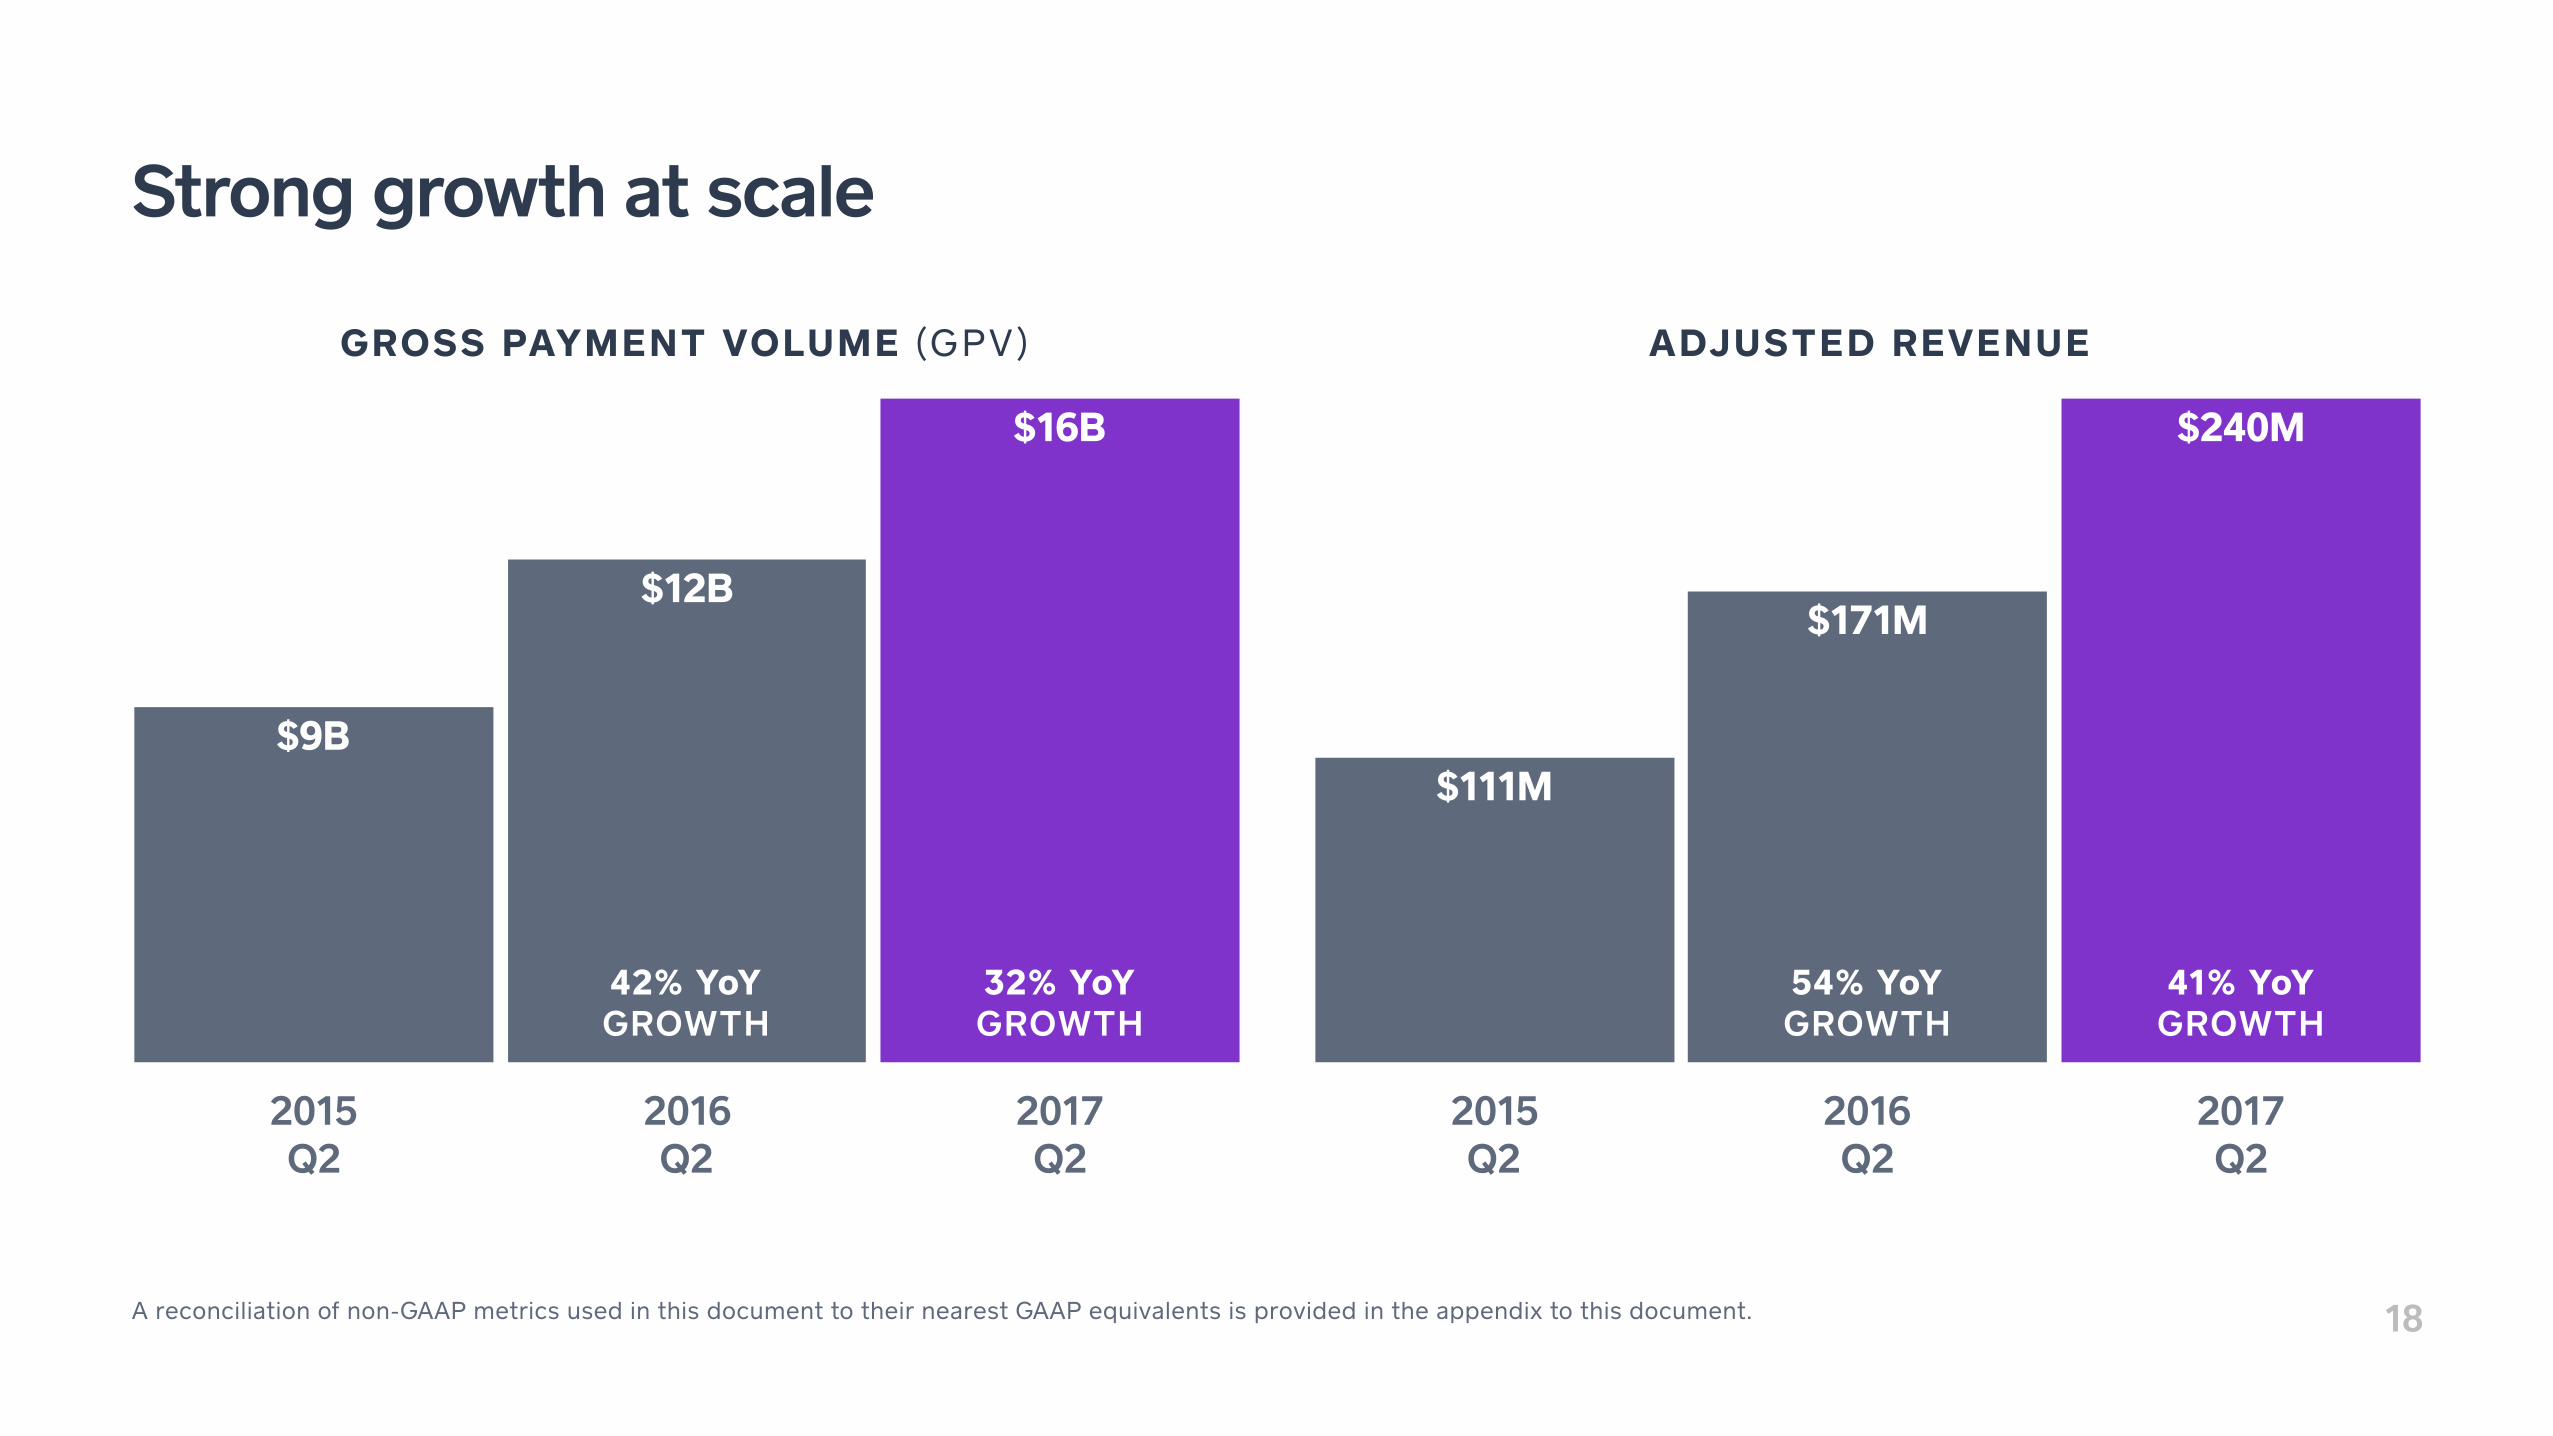
18A reconciliation of non-GAAP metrics used in this document to their nearest GAAP equivalents is provided in the appendix to this document.
Strong growth at scale
2015 Q2
2016 Q2
2017 Q2
$16B
$12B
$9B
32% YoY GROWTH
42% YoY GROWTH
GROSS PAYMENT VOLUME (GPV) ADJUSTED REVENUE
2015 Q2
2016 Q2
2017 Q2
$240M
$171M
$111M
41% YoY GROWTH
54% YoY GROWTH

19Payback calculated as the number of quarters it takes for a cohort of sellers’ cumulative Adjusted Revenue (excluding hardware and Gift Cards revenue) to surpass our sales and marketing spending in the quarter in which we acquired that cohort.
Attractive cohort economics highlights go-to-market efficiency Illustrative Cohort with a Three to Four Quarter Payback
Quarter 0 Quarter 1 Quarter 2 Quarter 3 Quarter 4
QUARTER PAYBACK
3–4
CUMULATIVE SUBSCRIPTION AND SERVICES-BASED REVENUECUMULATIVE COHORT TRANSACTION-BASED PROFITSALES AND MARKETING EXPENSE

20Revenue retention is calculated as year-over-year retention of Adjusted Revenue (excluding hardware and Gift Cards revenue) for our cohorts on average for the last four quarters ended June 30, 2017
Attractive cohort economics leads to strong visibility GPV by Annual Cohort
2012 2013 2014 2015 2016
2016 COHORT
2014 COHORT
2013 COHORT
PRE-2012 COHORT
2015 COHORT
REVENUE RETENTION
Positive
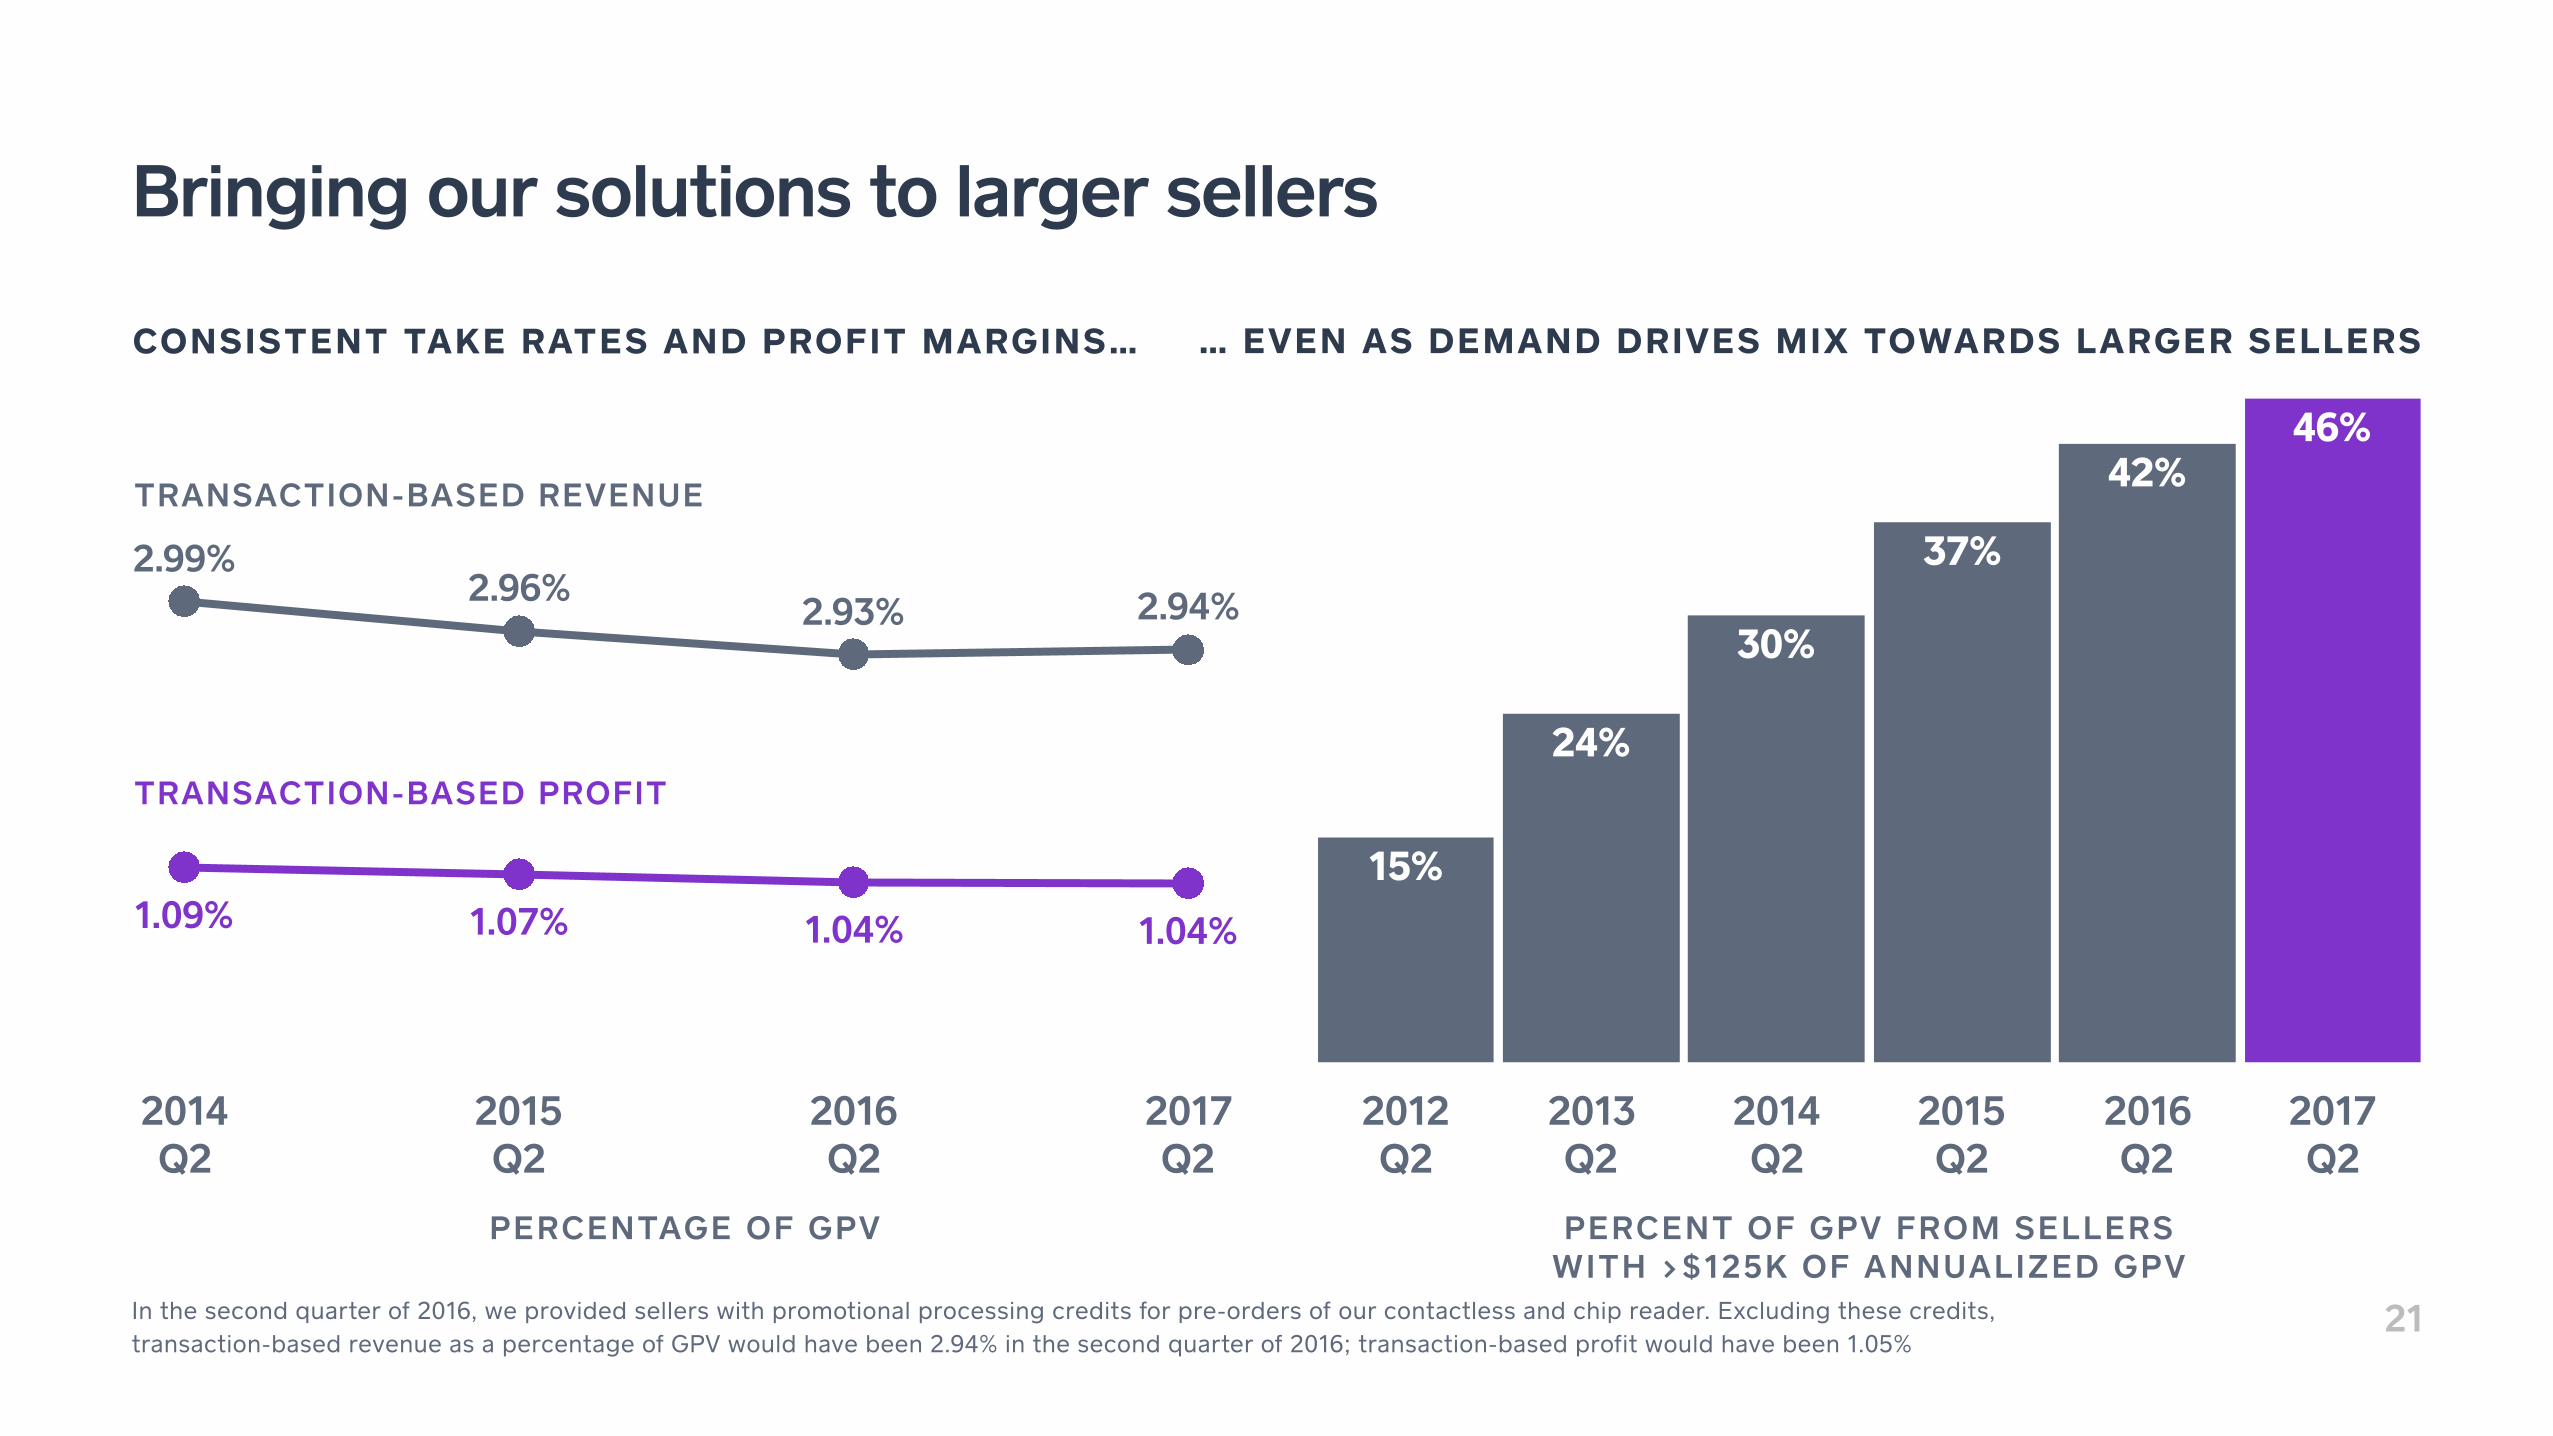
CONSISTENT TAKE RATES AND PROFIT MARGINS… … EVEN AS DEMAND DRIVES MIX TOWARDS LARGER SELLERS
21
Bringing our solutions to larger sellers
PERCENTAGE OF GPV PERCENT OF GPV FROM SELLERS WITH >$125K OF ANNUALIZED GPV
2012 Q2
2013 Q2
2014 Q2
2015 Q2
2016 Q2
2017 Q2
46%42%
37%
30%
24%
15%
TRANSACTION-BASED REVENUE
TRANSACTION-BASED PROFIT
2014 Q2
2015 Q2
2016 Q2
2017 Q2
2.99%2.96%
2.93% 2.94%
1.09% 1.07% 1.04% 1.04%
In the second quarter of 2016, we provided sellers with promotional processing credits for pre-orders of our contactless and chip reader. Excluding these credits, transaction-based revenue as a percentage of GPV would have been 2.94% in the second quarter of 2016; transaction-based profit would have been 1.05%

22“Products launched since 2014” primarily consists of Square Capital, Invoices, Instant Deposit, and APIs and excludes hardware revenue.
Our investments are creating meaningful vectors of growth
$3B
$2.8BANNUALIZED GPV FROM INVOICES IN Q1 2017
$1.8B SQUARE CAPITAL VOLUME SINCE LAUNCH IN MAY 2014 AS OF JUNE 2017
INSTANT DEPOSITS VOLUME SINCE LAUNCH IN AUGUST 2015 AS OF MARCH 2017
29%
2014 Q1
2015 Q1
2016 Q1
2017 Q1
1%
PRODUCTS LAUNCHED SINCE 2014 AS A PERCENTAGE OF ADJUSTED REVENUE

2015 Q2
2016 Q2
2017 Q2
72%79%
89%
23A reconciliation of non-GAAP metrics used in this document to their nearest GAAP equivalents is provided in the appendix to this document. Adjusted EBITDA margin is calculated as Adjusted EBITDA divided by Adjusted Revenue.
Investing in growth while benefiting from operating leverage
NON-GAAP OPERATING EXPENSES AS A PERCENTAGE OF ADJUSTED REVENUE
ADJUSTED EBITDA MARGINS
54% YoY GROWTH
2015 Q2
2016 Q2
2017 Q2
15%
7%
1%1%

Seller Case Studies

25
With 30 employees and 20 trucks, the company uses Square to accept mobile payments quickly and securely in the field.
The Scottish Plumber uses Mobile Payments, Capital, Invoices, and Employee Management.
JUX・TA・POSE uses Square for Retail, and with the help of Square Capital, it was able to open up a second location.
JUX・TA・POSE uses Square for Retail, Invoices, Capital, and Analytics.
Jack’s Bar-B-Que switched to Square to better manage previous pain points such as crashing systems, menu changes, and data visibility.
Jack’s Bar-B-Que uses Analytics, Build with Square, App Marketplace, and Employee Management.
LINDSAY & KALLIE WESLEY JUX・TA・POSE TAMPA, FL
DEREK MCGEOCH THE SCOTTISH PLUMBER CHICAGO, IL
NICK LYLES JACK’S BAR-B-QUE NASHVILLE, TN

square.com/investors

AppendixGAAP RECONCILIATION
28
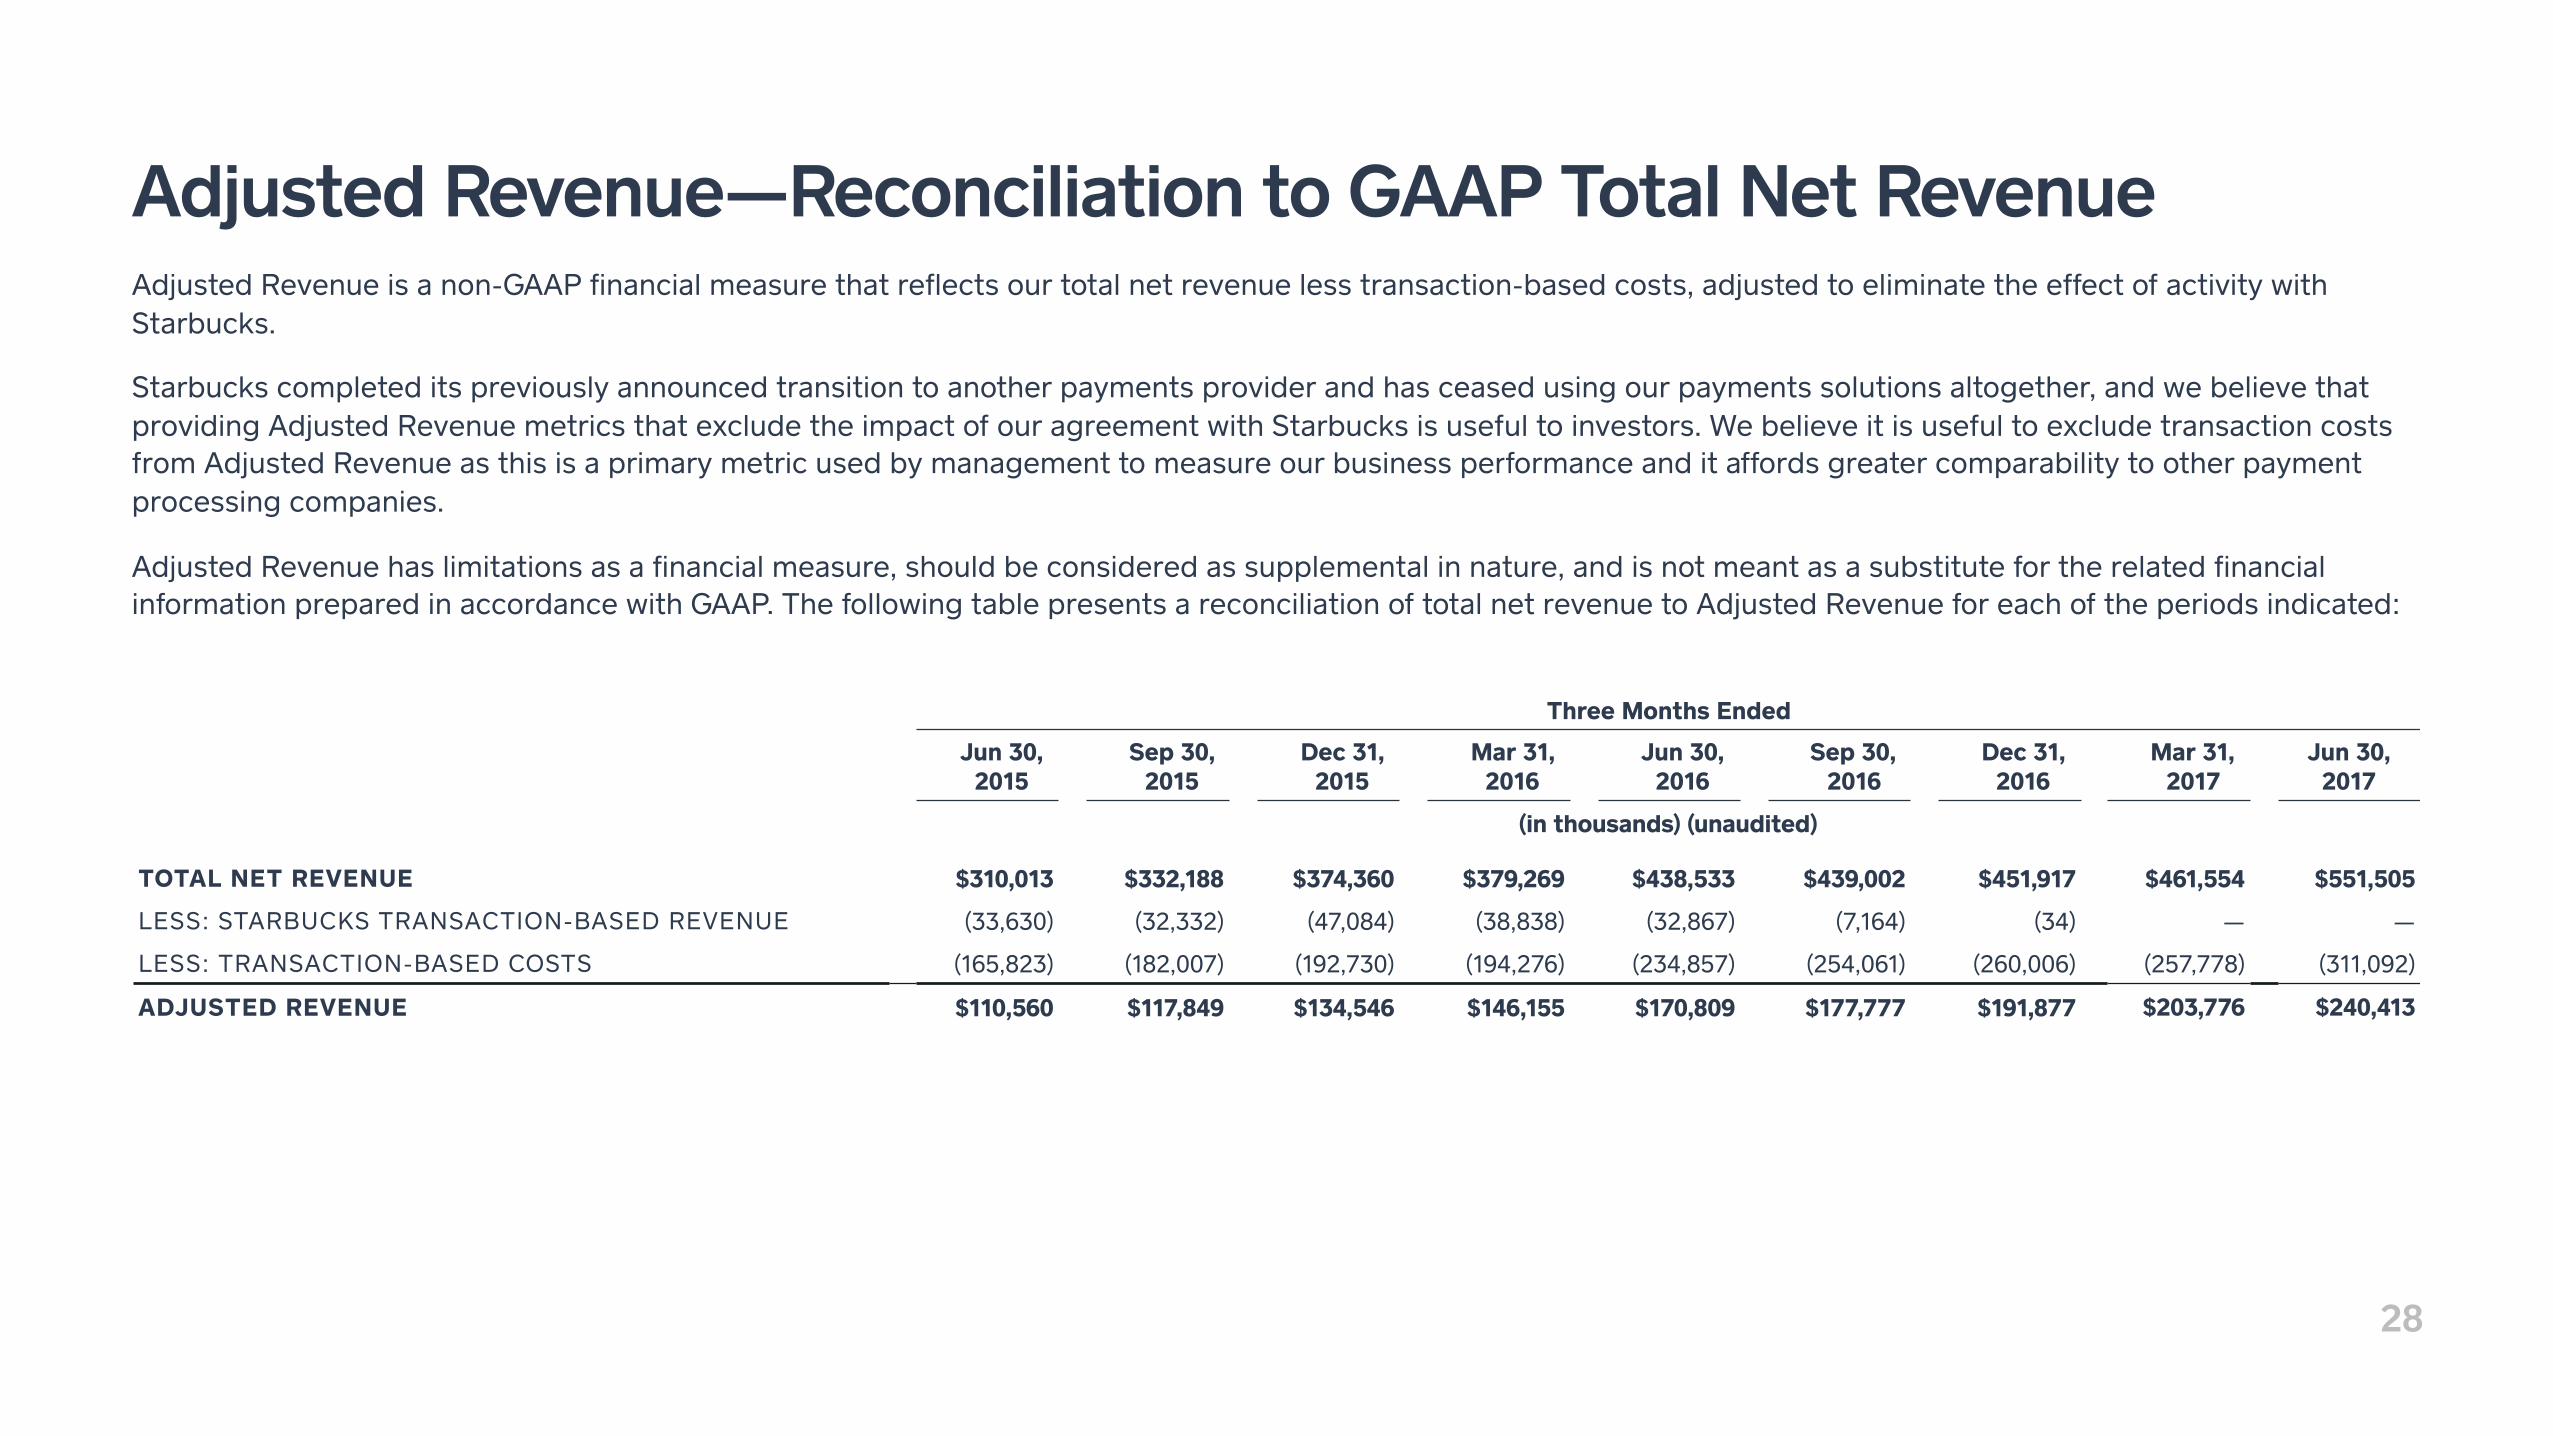
Adjusted Revenue—Reconciliation to GAAP Total Net Revenue Adjusted Revenue is a non-GAAP financial measure that reflects our total net revenue less transaction-based costs, adjusted to eliminate the effect of activity with Starbucks.
Starbucks completed its previously announced transition to another payments provider and has ceased using our payments solutions altogether, and we believe that providing Adjusted Revenue metrics that exclude the impact of our agreement with Starbucks is useful to investors. We believe it is useful to exclude transaction costs from Adjusted Revenue as this is a primary metric used by management to measure our business performance and it affords greater comparability to other payment processing companies.
Adjusted Revenue has limitations as a financial measure, should be considered as supplemental in nature, and is not meant as a substitute for the related financial information prepared in accordance with GAAP. The following table presents a reconciliation of total net revenue to Adjusted Revenue for each of the periods indicated:
Three Months Ended
Jun 30, 2015
Sep 30, 2015
Dec 31, 2015
Mar 31, 2016
Jun 30, 2016
Sep 30, 2016
Dec 31, 2016
Mar 31, 2017
Jun 30, 2017
(in thousands) (unaudited)
TOTAL NET REVENUE $310,013 $332,188 $374,360 $379,269 $438,533 $439,002 $451,917 $461,554 $551,505
LESS: STARBUCKS TRANSACTION-BASED REVENUE (33,630) (32,332) (47,084) (38,838) (32,867) (7,164) (34) — —
LESS: TRANSACTION-BASED COSTS (165,823) (182,007) (192,730) (194,276) (234,857) (254,061) (260,006) (257,778) (311,092)
ADJUSTED REVENUE $110,560 $117,849 $134,546 $146,155 $170,809 $177,777 $191,877 $203,776 $240,413

29
Adjusted EBITDA—Reconciliation to GAAP Net Loss Adjusted EBITDA is a non-GAAP financial measure that represents our net loss, adjusted to eliminate the effect of Starbucks transaction-based revenue and Starbucks transaction-based costs, before interest income and expense, provision or benefit for income taxes, depreciation, amortization, share-based compensation expense, other income and expense, the litigation settlement with Robert E. Morley, the gain or loss on the sale of property and equipment, and impairment of intangible assets. We have included Adjusted EBITDA in this document because it is a key measure used by our management to evaluate our operating performance, generate future operating plans, and make strategic decisions, including those relating to operating expenses and the allocation of internal resources. Accordingly, we believe that Adjusted EBITDA provides useful information to investors and others in understanding and evaluating our operating results in the same manner as our management and board of directors. In addition, it provides a useful measure for period-to-period comparisons of our business, as it removes the effect of certain non-cash items and certain variable charges.
Adjusted EBITDA has limitations as a financial measure, should be considered as supplemental in nature, and is not meant as a substitute for the related financial information prepared in accordance with GAAP. The following presents a reconciliation of net loss to Adjusted EBITDA for each of the periods indicated.
Three Months Ended
Jun 30, 2015
Sep 30, 2015
Dec 31, 2015
Mar 31, 2016
Jun 30, 2016
Sep 30, 2016
Dec 31, 2016
Mar 31, 2017
Jun 30, 2017
(in thousands) (unaudited)
NET LOSS ($29,620) ($53,930) ($48,289) ($96,755) ($27,345) ($32,323) ($15,167) ($15,090) ($15,962)
STARBUCKS TRANSACTION-BASED REVENUE 33,630 32,332 47,084 38,838 32,867 7,164 34 — —
STARBUCKS TRANSACTION-BASED COSTS 40,921 41,410 46,896 36,610 28,672 4,528 (49) — —
SHARE-BASED COMPENSATION EXPENSE 15,232 20,793 32,806 31,198 36,922 36,779 33,887 31,670 39,593
DEPRECIATION AND AMORTIZATION 6,410 6,570 9,100 9,118 9,018 9,681 9,928 9,437 9,125
LITIGATION SETTLEMENT EXPENSE, NET — — — 50,000 (2,000) — — — —
INTEREST AND OTHER (INCOME) AND EXPENSE 394 781 (772) (717) (327) 111 153 499 3,266
PROVISION FOR INCOME TAXES 1,152 932 1,244 339 312 230 1,036 509 472
LOSS (GAIN) ON SALE OF PROPERTY AND EQUIPMENT — — 30 (38) 169 (219) 39 — 2
ADJUSTED EBITDA $859 ($15,776) ($6,069) ($9,083) $12,554 $11,623 $29,793 $27,025 $36,496
30
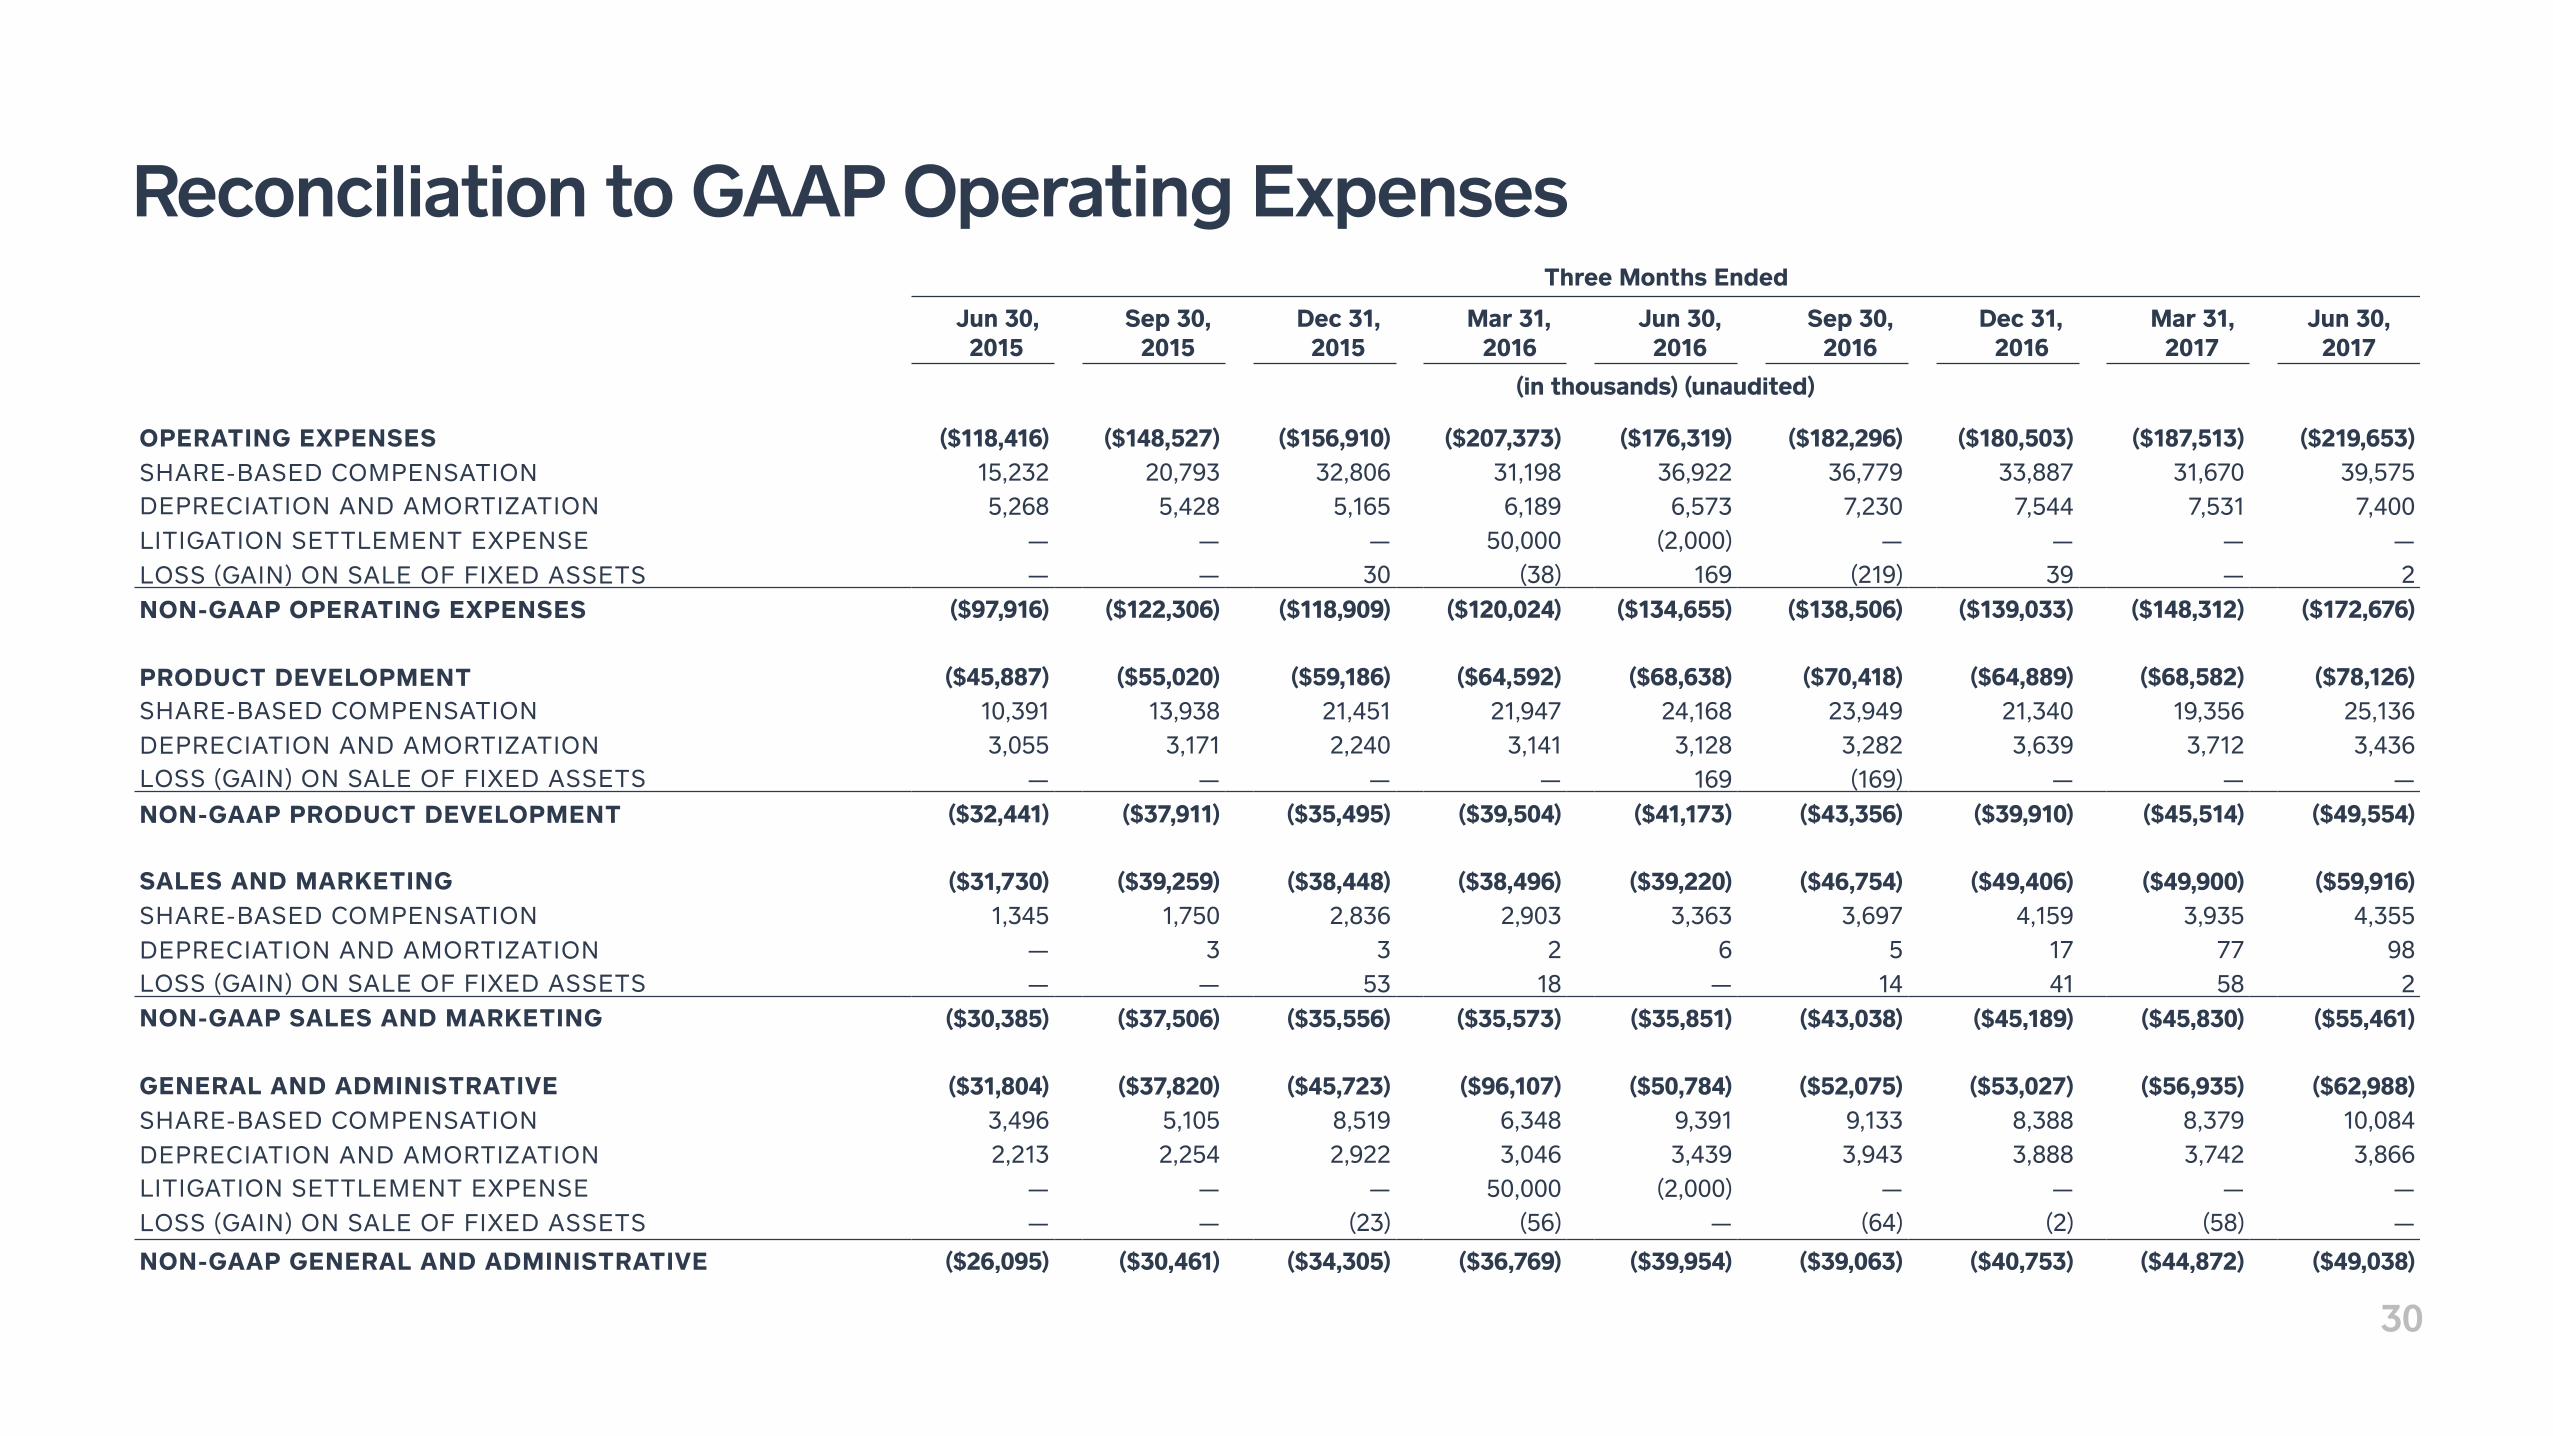
Reconciliation to GAAP Operating ExpensesThree Months Ended
Jun 30, 2015
Sep 30, 2015
Dec 31, 2015
Mar 31, 2016
Jun 30, 2016
Sep 30, 2016
Dec 31, 2016
Mar 31, 2017
Jun 30, 2017
(in thousands) (unaudited)
OPERATING EXPENSES ($118,416) ($148,527) ($156,910) ($207,373) ($176,319) ($182,296) ($180,503) ($187,513) ($219,653)SHARE-BASED COMPENSATION 15,232 20,793 32,806 31,198 36,922 36,779 33,887 31,670 39,575DEPRECIATION AND AMORTIZATION 5,268 5,428 5,165 6,189 6,573 7,230 7,544 7,531 7,400LITIGATION SETTLEMENT EXPENSE — — — 50,000 (2,000) — — — —LOSS (GAIN) ON SALE OF FIXED ASSETS — — 30 (38) 169 (219) 39 — 2NON-GAAP OPERATING EXPENSES ($97,916) ($122,306) ($118,909) ($120,024) ($134,655) ($138,506) ($139,033) ($148,312) ($172,676)
PRODUCT DEVELOPMENT ($45,887) ($55,020) ($59,186) ($64,592) ($68,638) ($70,418) ($64,889) ($68,582) ($78,126)SHARE-BASED COMPENSATION 10,391 13,938 21,451 21,947 24,168 23,949 21,340 19,356 25,136DEPRECIATION AND AMORTIZATION 3,055 3,171 2,240 3,141 3,128 3,282 3,639 3,712 3,436LOSS (GAIN) ON SALE OF FIXED ASSETS — — — — 169 (169) — — —NON-GAAP PRODUCT DEVELOPMENT ($32,441) ($37,911) ($35,495) ($39,504) ($41,173) ($43,356) ($39,910) ($45,514) ($49,554)
SALES AND MARKETING ($31,730) ($39,259) ($38,448) ($38,496) ($39,220) ($46,754) ($49,406) ($49,900) ($59,916)SHARE-BASED COMPENSATION 1,345 1,750 2,836 2,903 3,363 3,697 4,159 3,935 4,355DEPRECIATION AND AMORTIZATION — 3 3 2 6 5 17 77 98LOSS (GAIN) ON SALE OF FIXED ASSETS — — 53 18 — 14 41 58 2NON-GAAP SALES AND MARKETING ($30,385) ($37,506) ($35,556) ($35,573) ($35,851) ($43,038) ($45,189) ($45,830) ($55,461)
GENERAL AND ADMINISTRATIVE ($31,804) ($37,820) ($45,723) ($96,107) ($50,784) ($52,075) ($53,027) ($56,935) ($62,988)SHARE-BASED COMPENSATION 3,496 5,105 8,519 6,348 9,391 9,133 8,388 8,379 10,084DEPRECIATION AND AMORTIZATION 2,213 2,254 2,922 3,046 3,439 3,943 3,888 3,742 3,866LITIGATION SETTLEMENT EXPENSE — — — 50,000 (2,000) — — — —LOSS (GAIN) ON SALE OF FIXED ASSETS — — (23) (56) — (64) (2) (58) —
NON-GAAP GENERAL AND ADMINISTRATIVE ($26,095) ($30,461) ($34,305) ($36,769) ($39,954) ($39,063) ($40,753) ($44,872) ($49,038)