august 2015 trends - alaska dept of laborlabor.alaska.gov/trends/aug15.pdf2 august 2015 alaska...
TRANSCRIPT

2 ALASKA ECONOMIC TRENDSAUGUST 2015
AUGUST 2015Volume 35 Number 8
ISSN 0160-3345
Alaska Economic Trends is a monthly publica on dealing with a wide variety of economic issues in the state. Its purpose is to inform the public about those issues. Trends is funded by the Employment and Training Services Division of the Alaska Department of Labor and Workforce Development. It’s published by the Research and Analysis Sec on. Trends is printed and distributed by Assets, Inc., a voca onal training and employment program, at a cost of $1.37 per copy. Material in this publica on is public informa on, and with appropriate credit may be reproduced without permission.
Sam DapcevichCover Ar st
Sara WhitneyEditor
To request a free electronic or print subscrip on, e-mail [email protected] or call (907) 465-4500.Trends is on the Web at labor.alaska.gov/trends.
Dan RobinsonChief, Research and Analysis
Bill Walker,Governor
Heidi Drygas,Commissioner
ON THE COVER:The Carnival Spirit anchors in Sitka’s Crescent Bay. Photo courtesy of sitkaphotos.comOn page 4: A gull takes off at Tracy Arm. Photo by Flickr user Daniel CornwallFlickr license: crea vecommons.org/licenses/by-nc/4.0/legalcode
ALASKA DEPARTMENTof LABOR
and WORKFORCEDEVELOPMENT
TOURISM in SOUTHEAST
MOVERS to ALASKA
PAGE 4
PAGE 9By EDDIE HUNSINGER
A look at our newest residents
RENT OVER A DECADEPAGE 12
By KARINNE WIEBOLD
An overview of trends in four major Alaska rental markets
By CONOR BELL
Visitor-related jobs a key part of the region’s economy

3ALASKA ECONOMIC TRENDS AUGUST 2015
Departments collaborate to promote tourism
Heidi DrygasCommissioner, Labor
It’s the summer visitor season once again in Alaska. Next time you’re stuck behind an RV or trying to walk through throngs of shoppers on the wharf in Juneau, consider what a profound impact tourism has on Alaska’s economy. Tourism generates more than 14,000 jobs in Alaska and represents 11 percent of Southeast Alaska’s economic activity. It is the primary source of income for many coastal communities like Skag-way and Ketchikan. These tourism-related jobs and income are particularly important as federal investment and oil revenue de-cline. Our continued economic prosperity demands economic diversifi cation — tour-ism is a critical part of that effort.
This month’s Trends highlights economic impacts of tourism on Southeast, the epi-center of cruise ship traffi c. When it comes to cruise ship tourism, economic develop-ment policies are important because they determine how much value we retain in Alaska versus how much fl ows back to corporate offi ces in the Lower 48. This month, we are writing a joint Trends intro-duction because the departments of Labor and Commerce play complementary roles in maximizing the benefi ts of tourism for Alaska’s economy.
The Department of Commerce, Communi-ty, and Economic Development has a range of programs designed to create job and en-trepreneurship opportunities related to tour-ism. The department works with business partners to promote rural and cultural tour-ism and supports the development of re-gional tourism infrastructure. DCCED also sponsors AlaskaHost, a statewide customer service training program for employees of the hospitality and visitor services industry. DCCED collaborates with the Department of Labor Job Centers to expand AlaskaHost training programs with the goal of improv-ing Alaska’s hospitality industry while cre-ating local job opportunities.
The Department of Labor and Workforce Development has complementary pro-grams designed to promote Alaska Hire and good jobs in the tourism industry. In response to growing tourism around Nome, the NACTEC regional training center has started offering guide classes. Our SAVEC regional training center in King Salmon offers maritime and safety courses that help
prepare locals for work in tourism, includ-ing guided fi shing trips. We recently con-nected the village corporation of Gambell with Kawerak’s business development staff to consider how Gambell can maximize income from birding tourists. The depart-ment’s Wage and Hour and Workers’ Com-pensation staff also play a critical role by ensuring that tourism employers comply with the state’s labor laws. Our depart-ment’s staff recently investigated foreign-owned gift shops in Skagway that were attempting to avoid paying taxes and work-ers’ compensation. We won’t let perpetra-tors of fraud undercut legitimate Alaska businesses that play by the rules.
In many cases, visitors journey to Alaska for many of the same reasons most of us live here — Alaska is a special place with unparalleled scenery, outdoor opportu-nities, and bountiful resources. August Trends provides a snapshot of people mov-ing to Alaska and shows that many of our new neighbors are relatively young and well-educated.
In today’s economy, young professionals often choose a place to live rather than living wherever they can get a job. That means our state’s quality of life has eco-nomic value. DCCED’s Alaska Regional Development Organizations program sup-ports local efforts such as the Anchorage Economic Development Corporation’s Live.Work.Play. initiative, which is aimed at improving quality of life, including public schools, trails, and parks. Initiatives such as these serve the dual purpose of improving quality of life and generating economic value. Net migration into Alaska also provides an economic stimulus; an infl ux of well-educated workers is likely to lead to productivity increases among our workforce.
From tourism to Alaska Hire, our depart-ments have many opportunities to collabo-rate. Commerce and Labor will continue working together to maximize the positive impacts of the tourism industry and to institute the kind of public policies that en-sure Alaska remains the best place to live. Heidi Drygas is the Commissioner of Labor and Workforce Development. Chris Hladick is the Com-missioner of Commerce, Community, and Economic Development.
Follow the Alaska Department of Labor and Workforce Development on Facebook (facebook.com/alaskalabor) and Twi er (twi er.com/alaskalabor) for the latest news about jobs, workplace safety, and workforce development.
Chris HladickCommissioner,Commerce

4 ALASKA ECONOMIC TRENDSAUGUST 2015
Source: Alaska Department of Labor and Workforce Development, Research and Analysis Sec on
By CONOR BELL1 S A , 2014
Where the Tourism Jobs Are
Yakutat<10
Sitka340 Ketchikan
974Prince of
Wales-Hyder161
Juneau1,693
Wrangell39
Haines196
Petersburg50
Skagway822
Hoonah-Angoon
252
Tourism’s rise in Southeast Alaska was ed pri-marily to the development of cruise lines, which helped the region’s economies fl ourish and
con nue to transport the vast majority of Southeast’s visitors. Today, around a million people visit Southeast Alaska each summer, and most arrive by cruise ship.
Tourism was one of Alaska’s fi rst industries, and South-east was the fi rst visitor des na on. During the late 19th century, small numbers of tourists traveled north on steamships, sharing space with miners, fi shermen, and aspiring business owners in the new territory.
Throughout the next 100 years, the romance of Alaska sank deeper into the American consciousness. Many idealized the ruggedness of Alaska, and it became a point of pride even among Americans who had never seen it.
Though many miners returned home empty-handed, stories of Alaska’s natural beauty spread further a er the Klondike Gold Rush. Naturalists such as John Muir published detailed accounts of the territory. Si ng President Warren G. Harding traveled through Alaska
Visitor-related jobs a key part of the region’s economy
Tourism in SOUTHEAST

5ALASKA ECONOMIC TRENDS AUGUST 2015
shortly before his death. Hollywood began producing fi lms set in Alaska.
Steamships fall from favorThough acclaim for Alaska was widespread, steamships’ limited capacity and expense restricted the number of travelers to Southeast. Vaca oning by steamship was mostly limited to wealthy travelers, and it lacked the comforts available elsewhere. In 1929, a traveler-class round trip between Sea le and Skagway cost around $90, equiva-lent to about $1,250 in 2015.
The U.S. built the Alaska-Canada Highway during World War II, and though the Alcan increased traffi c into Alaska, most of its travelers went farther north to Southcentral or Fairbanks.
By the 1960s, streamship travel dwindled with the rise of air travel. The U.S. had a huge stock of aircra at the end of the war, and it pro-vided subsidies and discounts for emerging airlines to purchase sur-plus army airplanes.
Steamships couldn’t compete with the airlines’ rates, and sea trips took days rather than hours. Alaska Steamship Company, the last hold-out, ended passenger service in 1954. Though Juneau and Anne e Island had runways, Alaska’s tourist
traffi c was largely diverted from Southeast.
A er steamships became archaic, newly formed cruise line companies began to target a broader market. By building giant ships, they could provide trips at a lower cost per customer while expanding onboard ameni es, making travel to Alaska accessible to more Americans and returning the focus to Southeast.
In the second half of the 20th century, the growing number of visitors to Southeast tracked with the devel-opment of more and bigger cruise ships. The fi rst cruise
Employees of the Blue Fox Restaurant in Ketchikan pose behind the bar in the early-to-mid 20th century. Photo by the Skinner Founda on, Alaska Steamship Company, Alaska State Library
The steamship S.S. Aleu an docks in Juneau some me between 1939 and 1959. Steamships carried ini al visitors to Southeast Alaska, but they were phased out as air travel gained popularity and eventually, cruise ships off ered lower-cost trips with more ameni es. Photo courtesy of the Captain Lloyd H. “Kinky” Bayers Collec on, Alaska State Library

6 ALASKA ECONOMIC TRENDSAUGUST 2015
From Alaska Now, 1948by Herbert H. Hilscher“Basically there are fi ve classifi cations of travelers — and, from top to bottom, they all want to see Alaska. Yet the territory today is ill-prepared to roll out the welcome mat to any of these groups — except the least profi t-able. The fi ve classifi cations are:
1. “The wealthy, bored-with-life traveler. Minimum ex-penditure $100 per day.
2. “The society-conscious family with “means” that travels to the right places at the right times so daughter may meet the right people.
3. “The great American public that travels to have a good time, see things, do things, and meet people just as natural as themselves. They expect good service, good drinks, good food, and plenty of post-cards and souvenirs. The classifi cation includes the American schoolteacher and the business girl who travels for romance, thrills, and to do some of the things they [sic] can’t do at home.
4. “The dyed-in-the-wool sportsman and big-game hunter. He spends a sizable chunk of his money to get his trophies.
5. “The ‘rough-it’ crowd. The thousand-mile-canoe-trip-in-all-kinds-of-weather-without-a-bath-except-God’s-liquid-sunshine type. Women wearing men’s long-handled drawers, fl annel shirts, and tin pants. Men avoiding razors and smelling strongly of stale sweat. They usually travel without funds and ‘mooch’ their way along.
“As far as the recreation industry is concerned, only the fi rst four groups are important, and it is these groups Alaska must prepare for.”
Ea ng and Drinking15%
Retail15%
Amusement and Recrea on
22%
Accomoda on15%
Transporta on34%
Types of Tourism Jobs2 S A , 2014
Source: Alaska Department of Labor and Workforce Development, Research and Analysis Sec on
ships sailing the Inside Passage in the late 1960s could carry between 300 and 700 passengers. In 2016, Royal Caribbean’s Explorer of the Seas will set a new record in the state with its 3,840-passenger capacity.
Tourism vital to Southeast economyThe state had 14,056 visitor-related jobs in summer 2014, and though just a third of those were in South-east, they were a much bigger por on of the region’s summer economy at 11 percent versus the statewide 4 percent.
Southeast’s economy is highly seasonal, and most of its addi onal summer employment is ed to tourism. May through September of 2014 averaged 7,320 more jobs each month than the rest of the year. Of those ad-
di onal jobs, 4,570 were in visitor-related industries. (See the sidebar on page 8 for how we defi ned these industries.)
Other addi onal summer employment included sea-food processing (1,963 more jobs) and construc on (416 more jobs).
Summer visitors walk through downtown Skagway in front of the cruise ship dock. More than half of Skagway’s summer jobs are directly ed to tourism. Photo by Flickr user tommcb05
7ALASKA ECONOMIC TRENDS AUGUST 2015
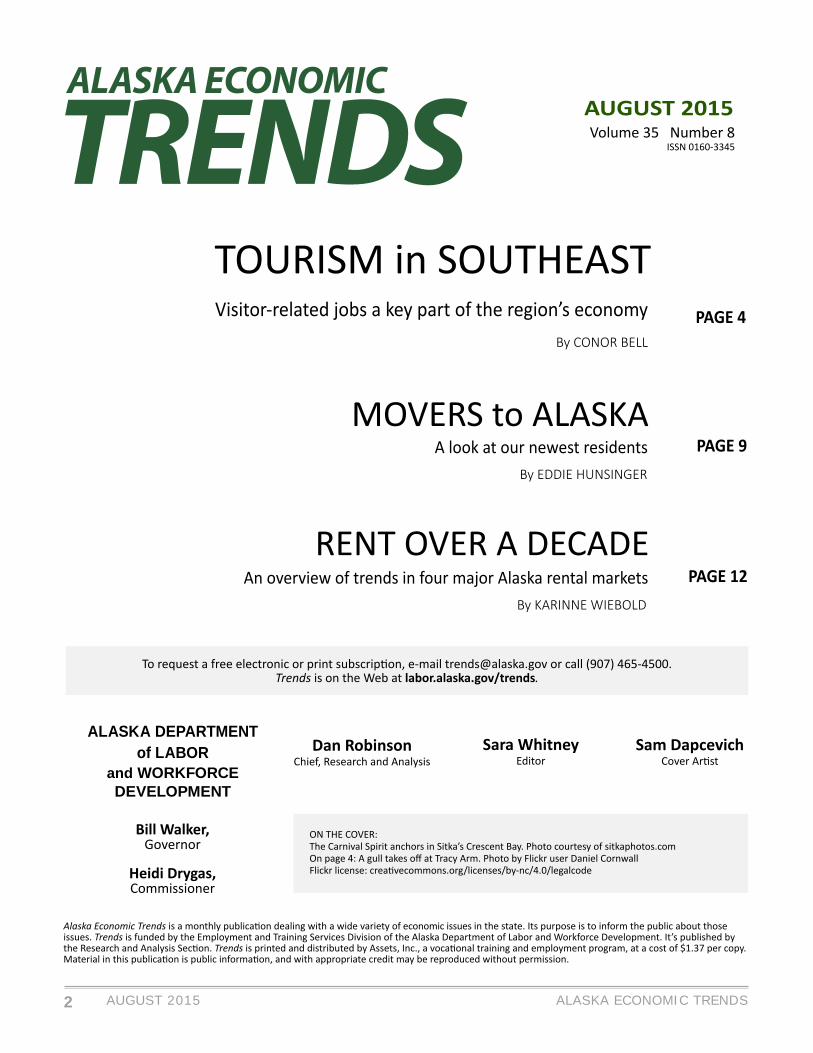
3 S A , A S 201410 Highest-Paying Tourism Occupa ons
Avg Summer Earnings*
1 Captains, Mates, and Pilots of Water Vessels $16,7812 Commercial Pilots $14,6433 Transportation Attendants, Except Flight Attendants $12,6804 Supervisors of Food Preparation and Serving Workers $11,8575 Sales and Related Workers $11,6436 Travel Guides $9,2067 Receptionists and Information Clerks $7,8758 Reservation and Transportation Ticket Agents $7,3059 Entertainment Attendants and Related Workers $7,228
10 Bookkeeping, Accounting, and Auditing Clerks $6,968
*These include workers who worked at any me during this period, even if it was just a short me. This makes the average lower than it would be if the data counted only those who worked the whole period from April 1 to Sept. 30. Source: Alaska Department of Labor and Workforce Development, Research and Analysis Sec on
4 S A , A S 201410 Most Common Tourism Occupa ons
WorkersAvg Summer
Earnings*1 Tour Guides and Escorts 395 $5,7902 Waiters and Waitresses 306 $4,6443 Retail Salespeople 276 $6,7754 Combined Food Prep and Serving Workers 208 $2,7065 Maids and Housekeepers 198 $4,3896 Cashiers 183 $4,7187 Transportation Attendants, Exc Flight Attendants 140 $12,6808 Captains, Mates, and Pilots of Water Vessels 138 $16,7819 Restaurant Cooks 121 $6,37410 Customer Service Representatives 113 $5,433
*These include workers who worked at any me during this period, even if it was just a short me. This makes the average lower than it would be if the data counted only those who worked
the whole period from April 1 to Sept. 30. Source: Alaska Department of Labor and Workforce Development, Research and Analysis Sec on
Most jobs are in Juneau, Ketchikan, and SkagwaySoutheast’s tourism jobs are concentrated in Juneau, Ketchikan, and Skagway at over three-quarters of the region’s visitor-related employment in 2014. Juneau had the most at 1,693. (See Exhibit 1.)
Though Skagway has a much smaller number of these jobs, the town’s economy is centered on tourism, with total summer employment far exceeding the year-round popula on. Hundreds of thousands of people visit the small town each summer to see the former mining camp. Fi y-three percent of Skagway’s sum-mer jobs are directly visitor-related, and the share is even higher if you include jobs resul ng from increased
spending by tourism businesses and employees.
Another indicator of how signifi cant tourist traffi c is to Skagway’s economy is its annual sales tax revenue. Skagway’s local sales tax of 3 percent, which goes up to 5 percent in the summer, pulled in $7 million in 2013, or $6,996 per year-round resident. Juneau, with a 5 percent sales tax year-round, ne ed just $1,305 per resident that year.
Though Juneau and Ketchikan had more visitor-related jobs overall, their economies are diversifi ed, with tour-ism jobs represen ng just 9 and 12 percent of their total summer employment, respec vely.
Hoonah-Angoon Census Area, which includes Gustavus and Glacier Bay, had the second-highest propor on in
8 ALASKA ECONOMIC TRENDSAUGUST 2015
Source: Alaska Department of Labor and Workforce Development, Research and Analysis Sec on
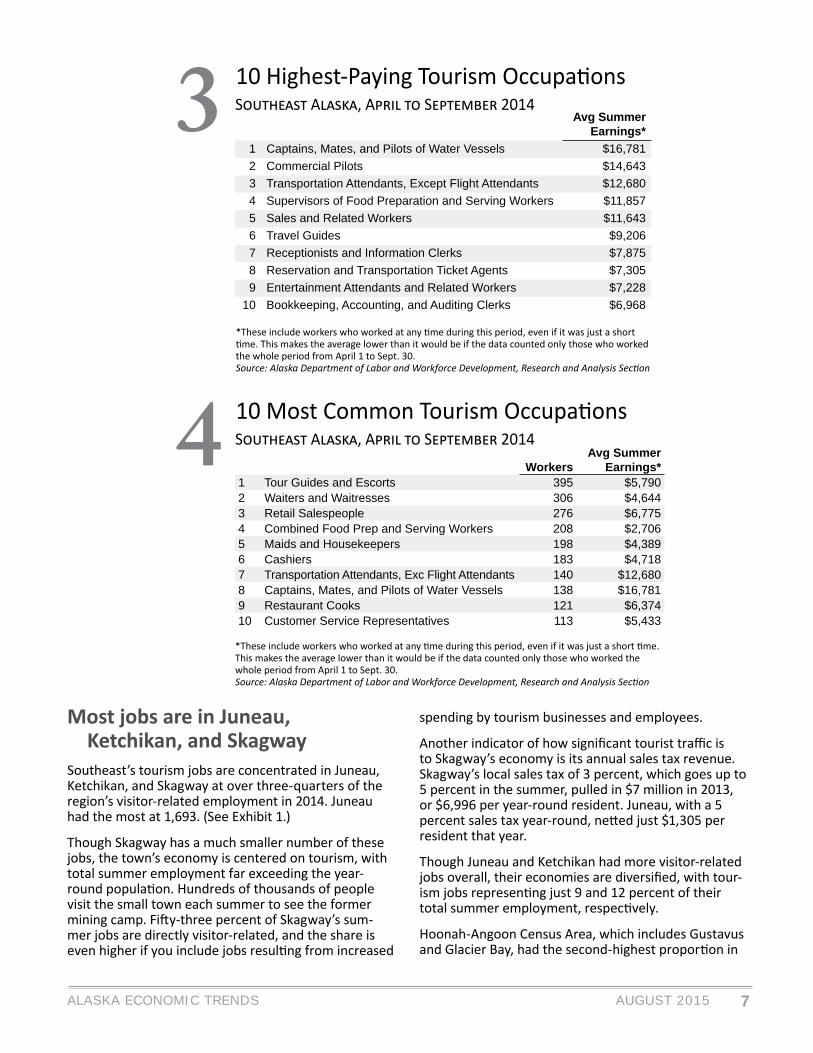
5 S , 2007-2014
Rebound A er RecessionAbout these numbersTourism’s effect on employment is hard to determine because there’s no offi cial “tourism industry” in the data. That’s because jobs are categorized by what a person or company does rather than for whom they do it. So, for example, a restaurant that caters to tour-ists is not easily distinguished from one that mainly serves locals. Here, we’ve approximated visitor-related employment by defi ning visitor-related industries as transportation, accommodation, food services, certain retail stores, and amusement and recreation industries. We only counted direct employment; jobs created to support visitor industry and those resulting from the increased demand that employment growth brings are outside the scope of this analysis.
Because bars and restaurants would have employees regardless of summer visitors, taking the difference between summer and winter is the closest way to de-termine how many jobs the seasonal infl ux creates. The seasonal change in the industries is defi ned as the av-erage level of employment in May through September against average levels in all other months of 2014.
Visitors’ effect on the economy extends outside these industries, however, as they use a range of other ser-vices. A small number of visitors also arrive during the winter. Locals may also patronize restaurants and bars more frequently during summer. Businesses may also hire workers in the off-season to prepare or take down infrastructure.
Most of this article defi nes summer employment as May to September. But for occupational counts and wages, the period is April through September, or second and third quarter, because of data limitations.
Southeast at 26 percent of all summer employment. Petersburg and Wrangell each had a handful of these jobs, and Yakutat had almost no tourism employment in 2014, as defi ned here, but hosted its fi rst cruise ships this year.
Transporta on dominatesThe largest chunk of Southeast’s tourism jobs, about a third, is in transporta on. These include work on ev-erything from whale-watching boats to tour buses and airlines. (See Exhibit 2.)
In Skagway, employment in scenic and sightseeing transporta on is 432 mes more common than in the na on as a whole, largely due to the White Pass and Yukon Route, a refurbished railway originally built dur-ing the Gold Rush.
The highest-paying occupa ons are also in transporta- on. The top-paying job group, which includes cap-
tains, mates, and pilots of water vessels, is also one of
the most common. (See exhibits 3 and 4.) These 138 workers made an average of $16,781 in summer 2014. Commercial pilots were second at $14,643, and non-fl ight transporta on a endants (who primarily work on whale-watching boats) came in third at $12,680. Almost all seasonal pilots fl y small planes, either for fl ightseeing or passage to rural Alaska.
The next-largest category, at 24 percent, was enter-tainment and recrea on, which encompasses tours and visitor experiences that range from ziplining to wil-derness expedi ons.
The rest were in retail, ea ng and drinking, and accom-moda on, each at 14 to 15 percent. These other cat-egories have signifi cantly lower earnings, partly due to more part- me or short-term employment. The most common workers in these categories are tour guides, waiters, and salespeople.
S ll bouncing back a er recessionVisitor-related industries took a major hit na onwide during the 2007-09 na onal recession. (See Exhibit 5.) While the rest of Alaska’s economy fared rela vely well, the bleak condi ons in the rest of the country s fl ed travel. U.S. vaca on expenditures tanked, and Southeast’s visitor-related industries shed more than 500 jobs in summer 2009. Alaska cruise travel dropped by less than a percentage point that year, though visi-tor expenditures declined more signifi cantly.
During summer 2010, cruise ship traffi c fell by 15 per-cent and employers cut another 200 jobs.
Visitors and jobs both rebounded in 2011 and have recovered alongside the na onal economy. Since 2011, the region’s visitor-related employment has been rising toward its 2008 high of 4,631, though that fi gure hasn’t yet been reached.
2,500
3,000
3,500
4,000
4,500
5,000
2007 2008 2009 2010 2011 2012 2013 2014

9ALASKA ECONOMIC TRENDS AUGUST 2015
By EDDIE HUNSINGERAbout these numbersThe American Community Survey collects so-cioeconomic data throughout the country on an ongoing basis. Due to limited sample sizes, data released in a combined fi ve-year format (such as the 2009 to 2013 data used here) are considered more reliable, especially for small areas. S ll, they o en have large margins of error.
The geographic mobility data presented in this ar cle are based on the following ques ons: “Did this person live in this house or apartment one year ago?” and “Where did this person live one year ago?”
Of the 735,000 people who live in Alaska today, more than 40,000 arrived in just the last year. Although the number who move here each year
is mostly balanced by the number who leave, newcom-ers signifi cantly and con nuously change the state’s makeup.
From large, close statesThe states that send the most people to Alaska are either close or have large popula ons (see Exhibit 1), a trend that has been steady over me. Likewise, when Alaskans leave, they typically move to these states. Over the most recent me period available, 2009 to 2013, Texas had the most Alaska-bound movers — but the top spot fl uctuates among Washington, California, and Texas.
Altogether, people moving here from other U.S. states or territories make up about 90 percent of our recent ar-rivals, and 10 percent come from other countries. Eleven percent were born in Alaska and are returning. (Just 40 percent of Alaska’s popula on was born in the state, far less than the na onal fi gure of 59 percent born in their current state of residence.)
Also many interna onal moversAlaska receives 3,000 to 5,000 movers from other countries each year. Na ons that send the most people, typically a few hundred per year, are the Philip-pines, Mexico, and Canada. Military deployments and bases overseas also aff ect migra on from foreign coun-
tries, and many movers in recent years were soldiers returning from Iraq and Afghanistan.
About 8 percent of newcomers aren’t U.S. ci zens, versus 3 percent of the current state popula on. (See Exhibit 2.) Of the nonci zens who moved here recently, it’s notable that about half moved from another state rather than from abroad. For comparison, about 40 percent of Washington’s nonci zen newcomers moved from another state, and for California the fi gure is just 20 percent.
Just over 80 percent of the recent arrivals ages 5 or older speak English at home — not much diff erent from the 84 percent of all Alaskans age 5-plus who do.
To popula on centers and basesAnchorage, Alaska’s biggest city and home to just over
A look at the demographics of our newest residents
Movers to ALASKA

10 ALASKA ECONOMIC TRENDSAUGUST 2015
3,172
2,588
1,023
1,710
2,003
1,269
2,596
1,934
2,000 - 4,000
1,000 - 2,000
500 - 1,000
0 - 500
1,329
Migra on to Alaska by State1 P , 2009 2013
Source: U.S. Census Bureau, American Community Survey
40 percent of the state’s popula on, was the des na- on for 44 percent of Alaska’s recent migrants, accord-
ing to the 2009 to 2013 American Community Survey.
Within Anchorage, the areas with the most newcom-ers were on or near Joint Base Elmendorf-Richardson, including the base itself (between 4,000 and 5,000 per year) as well as the lower Eagle River Valley (about 1,000 per year). The areas with the fewest newcomers included higher-income areas like Chugiak, the upper Eagle River Valley, and Turnagain, each with less than 100 per year.
In general, where people move in Alaska follows the distribu on of popula on across the state, but the loca ons of military bases also play an important role. Fairbanks North Star Borough, which is home to 14 percent of the state’s popula on and two major mili-tary bases, received an es mated 23 percent of annual migrants.
Movers are typically youngThroughout the country, people in their late teens
and early twen es move the most, and the oldest age groups tend to move the least. Thirty-fi ve percent of those who moved to Alaska from 2009 to 2013 were 20 to 29 years old, and just 4 percent were over age 60. If we were to look at the popula on moving from Alaska, it would have a similar age structure.
It’s important to note, though, that the aging of Alas-ka’s popula on will overwhelm the migra on-related changes at higher ages. With the aging of Alaska’s baby boomers, the 65-plus popula on will con nue to grow.
Slowly changing racial makeupTen percent of the new Alaskans from 2009 to 2013 were Hispanic, 10 percent were Asian or Pacifi c Is-lander, 7 percent were black, and just 4 percent were American Indian or Alaska Na ve. (See Exhibit 3.) About two-thirds were non-Hispanic white.
Altogether, the popula on that recently moved to the state is a bit more nonwhite and non-Na ve than Alaska’s total popula on and, based on analysis of popula on es mates by age and race, a bit more non-

11ALASKA ECONOMIC TRENDS AUGUST 2015
Source: U.S. Census Bureau, American Community Survey
white and non-Na ve than the popula on that le Alaska. Though the diff erences are slight, they con-tribute to a con nuously changing racial makeup of the state over me when coupled with diff ering birth rates by race.
More in military, collegeAbout 63 percent of the 16-plus newcomer popula- on were in the civilian labor force,1 and 12 percent
of those were unemployed, according to the 2009 to 2013 data. Sixteen percent were in the ac ve duty armed forces. In Alaska’s overall 16-plus popula on, about 69 percent were in the civilian labor force, of which 9 percent were unemployed. Just 3 percent were in the military.
New arrivals were also more likely to be in college than the current popula on. For those 16 and over, 16 percent who recently arrived were enrolled versus just 9 percent of Alaskans. Much of this is related to the greater tendency for young people to move.
Alaska’s recent arrivals tend to have higher levels of educa on, as well. Among newcomers 25 or older, 71 percent have some college and 34 percent have a de-gree. (See Exhibit 4.) For the state as a whole, it’s 64 percent and 28 percent.
The new arrivals tend to have lower incomes, though, as younger people are o en in school or earlier in their careers. Alaskans 15 and older had a median income of $30,947. The median income for recent movers from another state was $24,520, and for those who came from abroad it was $26,256.
1“In the labor force” means a person is either working or ac vely looking for work.
Similarly, the poverty rate for newcomers was higher than Alaska’s 10 percent overall, at 15 percent for those from another state and 16 percent for interna onal migrants.
Most Are U.S. Ci zens2 M A , 2009 2013
Source: U.S. Census Bureau, American Community Survey
Most Migrants Are White3 M A , 2009 2013
0
5,000
10,000
15,000
20,000
25,000
30,000
35,000
40,000
45,000
2+ races
AsianBlack
Some other race
Hispanic White
Non-HispanicWhite
Source: U.S. Census Bureau, American Community Survey
Most HaveGone to College4 M A
0%
10%
20%
30%
40%
50%
60%
70%
80%
90%
100%
Moved to Alaskain previous year
Graduate/professional degree
Bachelor's degree
Some college orassociate degree
Diploma/GED
No diploma

12 ALASKA ECONOMIC TRENDSAUGUST 2015
An overview of trends in four major Alaska rental markets
Rent Over a Decade
By KARINNE WIEBOLD
Every March, the Alaska Department of Labor and Workforce Development surveys about 15,000 Alaska landlords to gather residen al rental unit informa on in
coopera on with the Alaska Housing Finance Corpora on. The following sec ons give an overview of rental trends over the past decade for four of Alaska’s largest markets, including the latest survey results.
The rental amounts shown here are adjusted rent, which is the amount the tenant pays to the landlord each month plus any addi onal u lity costs. This allows for more accurate compari-sons between places. We also include the aff ordability index value, which tells you how many paychecks it would take to af-ford the area’s average rent, based on the area’s average wages.
The complete survey methods and results, which include more areas and detail on vacancies and aff ordability, are available at laborstats.alaska.gov/housing/housing.htm and www.ahfc.us/effi ciency/research-informa on-center/alaska-housing-market-indicators/.
AnchorageAverage adjusted rent in Anchor-age has been on a gradual rise over the last decade, increas-ing 46 percent from 2005 to 2015. Apartment rent increased 45 percent, up from $846 to $1,227, while single-family rent increased at a much faster rate of 59 percent, or from $1,288 to $2,044.
Single-family rental homes are scarce rela ve to apartments in Anchorage, and while houses are generally in high demand, they’re also more suscep ble to price and vacancy changes when local demand shi s.
The survey-wide average vacancy rate from 2005 to 2015 was 6.3 percent. Anchorage’s vacancy rate over this period averaged just 4.4 percent, and it has been below that since 2010.
Anchorage’s rental aff ordability index value has fl uctuated around 1.0 over the last decade. Before 2011, rent required a single average paycheck or slightly less, which increased to an average of 1.03 a er that as increases in rent outpaced increases in wages. While rents in Anchorage are fairly high, so are wages.
FairbanksRent in Fairbanks has been on the rise, in-creasing by 50 percent from 2005 to 2015, although it declined slightly in 2012 and 2015. Apartment rent has increased 39 percent over the period while single-family house rent has risen a signifi cant 73 per-cent, from $1,094 to $1,892. The high cost of u li es in the Interior is a signifi cant fac-tor in this jump.
Vacancies in Fairbanks have tradi onally been higher than the survey-wide average, at an average of 10.5 percent since 2005. The vacancy rate has gone up signifi cantly in the last couple of years, to 15.6 percent in 2014 and 16.0 percent in 2015. Slight popula on declines in 2013 and 2014,
Source: Alaska Department of Labor and Workforce Development, Research and Analysis Sec on
Con nued on page 14
$857 $935 $975 $1,022 $1,081 $1,116 $1,158 $1,178 $1,229 $1,250 $1,255
$0
$200
$400
$600
$800
$1,000
$1,200
$1,400
$1,600
$1,800
$2,000
$2,200
2005 2006 2007 2008 2009 2010 2011 2012 2013 2014 2015
Single-Family Apartment All unit types combined

13ALASKA ECONOMIC TRENDS AUGUST 2015
Matanuska-SusitnaRent in the Matanuska-Susitna Borough has gone up 48 per-cent since 2005. Unlike other areas, the increase was greater for apartments (45 percent) than single-family homes (41 percent).1 Single-family rents have had their ups and downs in Mat-Su, with small drops in 2008, 2009, 2012, and 2015.
Mat-Su’s average 10-year va-cancy rate was 5.8 percent, below the survey wide average of 6.3 percent. In 2015, Mat-Su’s vacancy rate of 3.3 percent was half the survey-wide 6.7 percent that year and on par with Juneau and Anchorage, two historically ght markets.
1The number of single-family units went up considerably over this period, so the change in the mix is the reason the overall increase is higher than the percent increase for each type of unit.
Mat-Su’s popula on and economy have grown rap-idly in the last decade, pu ng more pressure on the rental market, as seen in the low vacancy rate.
Ren ng is less aff ordable for Mat-Su residents than for those ren ng in Anchorage, Fairbanks, or Juneau. Although Mat-Su rents are a bit lower, so are wages. Mat-Su was at peak aff ordability in 2009 (1.08 pay-checks required), but has become increasingly less aff ordable since, climbing to an addi onal third of an income required to aff ord rent in 2015 (1.31).
JuneauJuneau is one of the most ex-pensive areas surveyed, but overall, its average rent has in-creased by just 27 percent since 2005. That’s much less than the other areas highlighted in this ar cle as well as the survey-wide increase, which was 43 percent. Juneau’s rent was higher in 2005 than Anchorage, Mat-Su, or Fairbanks, and while it remains slightly higher, the gap has narrowed.
Juneau apartment rent has increased 23 percent since 2005, rising from $1,009 to $1,240. Single-family house rent, on the other hand, has increased at more than twice that rate, from $1,242 in 2005 to $1,829 in 2015.
Vacancies in Juneau averaged a low 4.4 percent over the decade, the same rate as Anchorage. Juneau’s vacancy rate has been below average the last six years, hi ng 3.4 percent in 2015.
Juneau’s high average wage, coupled with more moderate growth in average rent, means Juneau’s rental housing has been more aff ordable in the past fi ve years than the fi ve before that, though index values appear to be creeping up. The current value is 1.16, or just over one monthly paycheck required to aff ord rent.
Ren ng in Juneau was most aff ordable from 2012 to 2014, when wages grew more than rents.
Source: Alaska Department of Labor and Workforce Development, Research and Analysis Sec on
Source: Alaska Department of Labor and Workforce Development, Research and Analysis Sec on
$818 $850 $879 $902 $897 $1,004 $1,046 $1,080 $1,108 $1,166 $1,214
$0
$200
$400
$600
$800
$1,000
$1,200
$1,400
$1,600
$1,800
$2,000
2005 2006 2007 2008 2009 2010 2011 2012 2013 2014 2015
Single-Family Apartment All unit types combined
$1,026 $1,085 $1,076 $1,125 $1,131 $1,149 $1,158 $1,155 $1,179 $1,259 $1,300
$0
$200
$400
$600
$800
$1,000
$1,200
$1,400
$1,600
$1,800
$2,000
2005 2006 2007 2008 2009 2010 2011 2012 2013 2014 2015
Single-Family Apartment All unit types combined

14 ALASKA ECONOMIC TRENDSAUGUST 2015
military movements, and an increase in rental housing stock with the construc on of new military housing are likely factors. It’s also possible that low interest rates in recent years have prompted some renters to purchase.
Like Anchorage, rentals in 2005 and 2006 were more aff ordable in Fairbanks, requiring just under one full paycheck, before rent increases outpaced wage increases.
Fairbanks’ aff ordability has been fairly consistent in the last seven years, remaining between 1.06 and 1.08 required month-ly paychecks.
FAIRBANKSContinued from page 12
$814 $872 $953 $996 $1,073 $1,108 $1,119 $1,120 $1,185 $1,224 $1,217
$0$200$400$600$800
$1,000$1,200$1,400$1,600$1,800$2,000
2005 2006 2007 2008 2009 2010 2011 2012 2013 2014 2015
Single Family Apartment All unit types combined
Source: Alaska Department of Labor and Workforce Development, Research and Analysis Sec on
Employment Scene
Prelim. RevisedSEASONALLY ADJUSTED 6/15 5/15 6/14United States 5.3 5.5 6.1Alaska Statewide 6.8 6.7 7.0NOT SEASONALLY ADJUSTEDUnited States 5.5 5.3 6.3Alaska Statewide 6.9 6.6 7.0Anchorage/Mat-Su Region 6.1 5.7 6.2 Municipality of Anchorage 5.5 5.1 5.6 Matanuska-Susitna Borough 8.3 7.9 8.3Gulf Coast Region 7.3 7.3 7.2 Kenai Peninsula Borough 7.6 7.6 7.3 Kodiak Island Borough 5.8 5.5 6.4 Valdez-Cordova Census Area 7.3 8.2 7.4Interior Region 6.8 6.2 7.1 Denali Borough 4.3 5.0 4.9 Fairbanks North Star Borough 6.0 5.3 6.1 Southeast Fairbanks Census Area 11.0 11.4 12.5 Yukon-Koyukuk Census Area 17.3 17.3 17.8Northern Region 12.3 11.6 12.3 Nome Census Area 13.9 13.1 13.5 North Slope Borough 6.9 6.2 6.8 Northwest Arctic Borough 17.6 17.1 18.1Southeast Region 6.3 6.1 6.5 Haines Borough 8.0 8.5 8.9 Hoonah-Angoon Census Area 12.1 13.4 10.9 Juneau, City and Borough 5.0 4.5 5.1 Ketchikan Gateway Borough 6.4 6.2 6.9 Petersburg Borough* 9.1 9.2 9.4 Prince of Wales-Hyder CA 12.0 12.5 12.5 Sitka, City and Borough 4.8 4.5 5.0 Skagway, Municipality 5.2 6.0 4.6 Wrangell, City and Borough 8.0 7.4 7.8 Yakutat, City and Borough 6.9 7.6 9.2Southwest Region 12.5 13.9 13.0 Aleutians East Borough 5.0 5.8 5.4 Aleutians West Census Area 4.5 6.5 5.8 Bethel Census Area 16.0 16.3 16.7 Bristol Bay Borough 3.7 6.6 3.8 Dillingham Census Area 9.5 9.7 9.3 Lake and Peninsula Borough 12.2 12.7 14.0 Kusilvak Census Area* 25.7 25.6 25.1
2 Unemployment RatesB
Unemployment RatesJ 2005 J 20151
Sources: Alaska Department of Labor and Workforce Development, Research and Analysis; and U.S. Bureau of Labor Sta s cs
*Wade Hampton Census Area was renamed Kusilvak Census Area, and Petersburg Census Area became a borough.
Sources: Alaska Department of Labor and Workforce Development, Research and Analysis; and U.S. Bureau of Labor Sta s cs
U.S.
Alaska
Seasonally adjusted
4%
6%
8%
10%
12%
2005 2006 2007 2008 2009 2010 2011 2012 2013 2014 2015

15ALASKA ECONOMIC TRENDS AUGUST 2015
Safety Minute
Protect yourself from pesticide exposure at homeMany of the pesticides available in your local gar-dening store can be just as harmful as commercial pesticides. Pesticides can enter your body in many ways, from simple contact through skin and clothes to breathing mist, dust, fumes, or smoke containing pesticides and chemicals. You can even poison your-self while eating if you don’t wash your hands after spraying a pesticide around your home.
It’s important to know which chemicals are in the pesticides you use and take the following measures to protect yourself from the harmful effects of expo-sure:
• While working with pesticides, be aware that chemicals may be on or in plants, soil, irrigation water, or air drifting from nearby applications.
• The minimum protection when working with pesticides should always be long sleeves, long pants, shoes, and socks, rubber gloves, and splash-proof eye protection, regardless of the toxicity level of the pesticide.
• Make sure you’re able to wash immediately if you’re accidentally exposed.
Contact the Alaska Occupational Safety and Health Consultation and Training Section at (800) 656-4972 or labor.state.ak.us/lss/oshhome.htm to learn more about chemicals used in pesticides or for any ques-tions about health and safety in the workplace.
Safety Minute is wri en by the Labor Standards and Safety Divi-sion of the Alaska Department of Labor and Workforce Develop-ment.
Employer Resources
Fidelity bonding helps employers, at-risk applicantsFidelity bonding is a form of business insurance. It offers a proven job placement tool that helps both employers and at-risk job applicants.
Bond coverage is available in Alaska at no cost to job seekers or employers. The bonds are issued in incre-ments of $5,000 and provide six months of insurance coverage, with larger bonds issued on a case-by-case basis. Employers may also use bonding to promote an employee to a more responsible position without exposing the company to risk.
Any at-risk job applicant is eligible for bonding ser-vices, including ex-offenders, recovering substance abusers, welfare recipients, those with poor fi nancial credit, economically disadvantaged youth, adults who lack a work history, and those who have been
dishonorably discharged from the military. Each year, between 18 and 25 Alaska employers take advan-tage of fi delity bonding.
There are no forms for the employer to sign and no processing to delay matters — the insurance goes into effect immediately.
Employers seeking bonding insurance can fi nd their nearest Alaska Job Center by visiting jobs.alaska.gov/offi ces/ or calling (877) 724-2539. For more in-formation about the program, visit labor.alaska.gov/bonding.
Employer Resources is wri en by the Division of Employment and Training Services of the Alaska Department of Labor and Workforce Development.