alaska economic trends june 2005 - alaska …labor.state.ak.us/trends/jun05.pdf2 alaska economic...
TRANSCRIPT


ALASKA ECONOMIC TRENDS JUNE 20052
June 2005Volume 25Number 6
ISSN 0160-3345
Alaska Economic
Trends is a monthly publication dealing
with a variety of economic-related
issues in the state.
Alaska Economic Trends is funded by the
Employment Security Division and published by
the Alaska Department of Labor and Workforce Development, P.O. Box 21149, Juneau, Alaska
99802-1149.
Printed and distributed by Assets, Inc., a vocational training and employment
program, at a cost of $1.44 per copy.
To contact us for more information,
to subscribe, or for mailing list changes or
back copies, [email protected]
Material in this publication is public
information and, with appropriate credit, may be reproduced without
permission.
Photo courtesy of Alaska Photo Library
Trends is available
on the Internet.See URL above.
http://almis.labor.state.ak.us
Frank H. Murkowski, Governor of AlaskaGreg O’Claray, Commissioner
Cover design by Sam Dapcevich
Email Trends authors at: [email protected]
June Trends authors are staff with the Research and Analysis Section,
Administrative Services Division,Alaska Department of Labor and Workforce Development
Subscriptions:[email protected]
(907) 465-4500
Contents:
Wage Records 4
Employment Scene 24Where do Alaskans Work?Comparing workforce distribution in Alaskawith the rest of the nation

ALASKA ECONOMIC TRENDS JUNE 2005 3
Connecting Alaskans with jobs through Workforce Information
by Governor Frank H. Murkowski
This month’s Trends cover article clearly
demonstrates how much we know about Alaska’s
workforce. We know how many people work year-round versus seasonally. We know where they work, how much they earn, and where they reside. We have this information by age group, gender, and industry.
What does this really tell us and how can we use it to improve the well-being of Alaskan workers? The information we compile helps Labor Commissioner Greg O’Claray, the Alaska Workforce Investment Board, and others, determine how to target our workforce training eff orts.
Our researchers use these data to assist the Alaska Workforce Investment Board to develop priority occupations for training. These priorities are derived on a number of criteria including demand, career potential, and workforce demographics. Based on the gaps identifi ed by our researchers and the Workforce Investment Board, my administration is engaged in a number of innovative workforce training actions that partner with the private sector to increase career opportunities for Alaskans. Here are two examples:
Commissioner Barton of Department of Transportation and Public Facilities and Commissioner O’Claray of the Department of Labor and Workforce Development met with representatives from construction contracting organizations and organized labor, and jointly determined that an administrative order encouraging apprentice utilization for heavy highway projects would benefi t contractors and workers. Apprenticeship is the most eff ective strategy for training Alaska’s workforce to work on highway construction projects, mining development and pipeline construction. I will sign an Administrative Order, eff ective July 1, 2005, encouraging 15% of heavy equipment operator, mechanic and service oiler hours to be set aside for apprentices. This administrative order will be a signifi cant step toward assuring we have trained Alaskans for future large construction projects.
The maritime industry is a critical component of Alaska’s economy and exciting careers await those with the right
training. To that end, I have just signed an agreement with Conoco/Philips, Polar Tankers and the Alaska Marine Exchange to dedicate 12 training slots for Alaskans each year on Polar Tankers’ vessels. Under the agreement, the Alaska Vocational Technical Center in Seward will provide initial classroom training, followed by Polar Tankers’ on-vessel training. Participants, upon completion of their training at AVTEC, earn the Coast Guard certifi cation Ordinary Seamen. Immediately a er training participants will ship out with Polar Tankers for 180 days of ship-board training that contributes to their next certifi cation as Able Bodied Seamen.
Alaska’s future is tied to the development of infrastructure to access our natural resources. A trained labor force of Alaskans working in Alaska is one of the most eff ective ways to grow the state’s economy. I am truly excited about our future!
Highlighting our economic vibrancy, we are almost ready to publish the 2004 Annual Report on Alaska’s international exports. The numbers are in, and I am proud of the consistent hard work and dedication shown by Alaskan exporters and their families. We set another record in 2004, almost $3.2 billion in exports. This is an astounding 15% more than the impressive 9% growth in 2003.
We are also exporting to more countries than ever. In 2004, Alaska exported products directly to 92 diff erent countries, the most in history. Diversifi cation in trading partners increases prices for our products and provides stability.
Asia remains our principal export region, with Japan, Korea, and China consuming two thirds of our products. China is steadily moving up on our list of trading partners, increasing their purchase of Alaska products by $100 million in the last two years alone.
Exports mean jobs. I want to extend my wholehearted thanks to the Alaskan companies whose hard work day in and day out resulted in this impressive growth in exports.
With the information we garner about Alaska’s workforce, we can do a be er job of connecting Alaskans with exciting careers in Alaska’s burgeoning industries. Our prospects are excellent. Our future is bright.

ALASKA ECONOMIC TRENDS JUNE 20054
f each of Alaska’s workers was employed in one job continuously throughout his working life, then the task of understanding the labor market would be simple. However,
we all know the labor market is much more fl uid. Workers are hired and separate from jobs continuously throughout the year. Some workers are employed in multiple jobs consecutively or concurrently over time. Some work only seasonally, and some come from other parts of the country and from around the world to work in Alaska. And workers earn higher wages as their years of experience and training accumulate.
Many of the labor market statistics currently published are simple snapshots of the labor market at a particular point in time. They don’t refl ect the dynamic nature of the labor force or how an individual worker’s labor market status will change over time.
Over the last several years, Alaska has been a national leader in the use of unemployment insurance (UI) wage records submitted quarterly by employers for each worker to better understand the Alaska labor market. Resident hire research, training program performance outcomes, age and gender related employment characteristics, and new hiring activity have all been reported on a regular basis by the Alaska Department of Labor and Workforce Development. Most of these reports are possible only through the analysis of wage records in conjunction with other types of demographic characteristics available for Alaska workers.
Alaska’s quarterly UI wage records provide detailed information about each worker including employer, industry, earnings, occupation, and place of work. Employers are required to report earnings and other information about each wage and salary worker covered by Alaska UI. UI wage record data are not available for the self employed, military and federal government workers. When coupled with secondary data sources, age, gender, and place of residence can be used to identify differences between worker populations.
Wage Records By Jeff Hadland
Using them to fill the data gaps for Alaska worker profiles
I
1 Quarters Worked in 2003Employees in Alaska
Note: Includes private sector, state and local government.
Source: Alaska Department of Labor and Workforce Development, Research and Analysis Section
51,10513.5%
58,30615.4%
52,91414.0%
215,44957.0%
One
Two
Three
Four
ALASKA ECONOMIC TRENDS JUNE 2005 5
This report provides the latest characteristics of workers by age and gender, along with some new economic measures using wage records that can be used to better understand the dynamics and condition of the Alaska labor market. Hiring, separations, turnover, attachment to labor force, years of experience with an employer or in an industry, the size of the low-wage labor force, and some new measures of economic conditions can be determined through longitudinal analysis of quarterly UI wage record information.
Alaska worker characteristics–a closer look
In 2003, more than 17,400 private sector, state government and local government employers had nearly 378,000 unique individuals working for them during one or more quarters of the calendar year. Average monthly employment for those industry sectors in 2003 was signifi cantly smaller—approximately 280,000, indicating the much larger number of workers that fl ow through the economy over the course of a year. Although about 71 percent of all workers employed in 2003 worked for just one employer, there were more than 540,000 unique employer-employee relationships. Some workers move from job to job over the year; however, about 91 percent of workers had only one or two employers during the year.
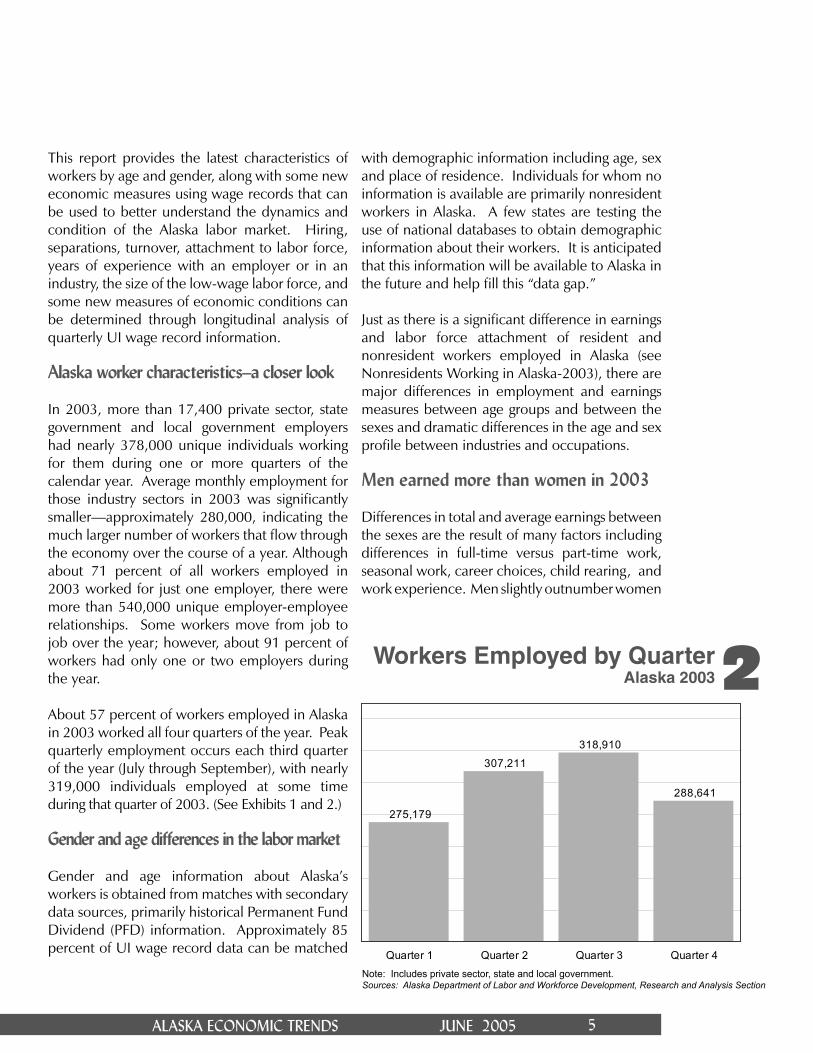
About 57 percent of workers employed in Alaska in 2003 worked all four quarters of the year. Peak quarterly employment occurs each third quarter of the year (July through September), with nearly 319,000 individuals employed at some time during that quarter of 2003. (See Exhibits 1 and 2.)
Gender and age differences in the labor market
Gender and age information about Alaska’s workers is obtained from matches with secondary data sources, primarily historical Permanent Fund Dividend (PFD) information. Approximately 85 percent of UI wage record data can be matched
with demographic information including age, sex and place of residence. Individuals for whom no information is available are primarily nonresident workers in Alaska. A few states are testing the use of national databases to obtain demographic information about their workers. It is anticipated that this information will be available to Alaska in the future and help fi ll this “data gap.”
Just as there is a signifi cant difference in earnings and labor force attachment of resident and nonresident workers employed in Alaska (see Nonresidents Working in Alaska-2003), there are major differences in employment and earnings measures between age groups and between the sexes and dramatic differences in the age and sex profi le between industries and occupations.
Men earned more than women in 2003
Differences in total and average earnings between the sexes are the result of many factors including differences in full-time versus part-time work, seasonal work, career choices, child rearing, and work experience. Men slightly outnumber women
2Workers Employed by QuarterAlaska 2003
Note: Includes private sector, state and local government.Sources: Alaska Department of Labor and Workforce Development, Research and Analysis Section
275,179
307,211
318,910
288,641
Quarter 1 Quarter 2 Quarter 3 Quarter 4

ALASKA ECONOMIC TRENDS JUNE 20056
in the Alaska labor force, men also outnumber women in the working age population. Although the percentages of the Alaska male and female population that worked in Alaska in 2003 are about the same, their total and average earnings profi les are very different. Based upon those workers for whom we have demographic data, men earned more than $5.6 billion of the $9.2 billion in wage and salary income in private sector, state government, and local government
jobs, or $2.1 billion more than women in 2003. Men were 52% of the workers and earned 62% of the wages. The largest discrepancy in total and average earnings between the sexes was in the peak earning years, age 40 to 54. (See Exhibit 3.)
In 2003, Alaska’s female workers earned on average $23,056, or 68.3 percent of that earned by male workers, a signifi cant improvement over the 66.4 percent rate found in 2001. Since 2001,
3 Employment and Earnings in 2003By Industry, age group, and sex
MALE FEMALETotal Total Average Total Total Average Female to male
By Industry Employment Wages Wage Employment Wages Wage earnings ratio
Natural Resources and Mining 11,123 $728,207,385 $65,469 1,743 $77,238,342 $44,313 67.7 Construction 20,953 722,618,150 34,488 2,905 67,558,091 23,256 67.4 Manufacturing 7,361 193,063,142 26,228 3,172 48,662,713 15,341 58.5 Trade, Transportation & Utilities 42,320 1,351,844,612 31,943 29,213 530,607,562 18,163 56.9 Information 4,229 197,105,153 46,608 3,506 115,428,510 32,923 70.6 Financial Activities 6,097 220,931,506 36,236 9,294 281,486,108 30,287 83.6 Professional and Business Svcs 13,813 465,812,009 33,723 11,318 261,089,695 23,069 68.4 Educational and Health Svcs 8,958 338,772,920 37,818 28,029 757,140,829 27,013 71.4 Leisure and Hospitality 16,053 218,403,008 13,605 18,312 190,850,144 10,422 76.6 Other Services 4,811 121,193,903 25,191 5,923 108,662,557 18,346 72.8 Public Administration 187 4,852,481 25,949 202 4,813,584 23,830 91.8 Nonclassifi able 72 1,167,274 16,212 31 163,597 5,277 32.6 Private Sector 135,977 4,563,971,544 33,564 113,648 2,443,701,733 21,502 64.1
Local Government 19,642 594,739,217 30,279 27,159 706,531,316 26,015 85.9 State Government 12,219 507,897,515 41,566 12,503 384,538,336 30,756 74.0 Total 167,838 5,666,608,277 33,762 153,310 3,534,771,384 23,056 68.3
By Age GroupLess than 16 2,466 7,621,521 3,091 2,601 7,079,538 2,722 88.1 Age 16-18 10,562 47,214,710 4,470 10,629 46,152,119 4,342 97.1 Age 19-24 23,315 339,023,294 14,541 21,816 261,993,517 12,009 82.6 Age 25-29 16,895 447,121,104 26,465 15,312 313,674,237 20,486 77.4 Age 30-34 17,879 605,990,212 33,894 15,731 384,423,730 24,437 72.1 Age 35-39 18,276 703,099,380 38,471 16,654 437,113,796 26,247 68.2 Age 40-44 21,425 917,792,312 42,837 19,734 560,833,044 28,420 66.3 Age 45-49 21,132 1,002,221,249 47,427 19,597 614,730,927 31,369 66.1 Age 50-54 17,028 834,096,980 48,984 15,220 492,075,873 32,331 66.0 Age 55-59 10,572 492,893,761 46,623 9,077 267,552,622 29,476 63.2 Age 60-64 5,251 199,685,748 38,028 4,410 109,723,465 24,881 65.4 Age 65-74 2,636 63,082,182 23,931 2,219 36,322,410 16,369 68.4 Age 75 and over 371 5,918,336 15,952 296 2,769,272 9,356 58.6 Unknown 30 847,488 28,250 14 326,833 23,345 82.6
Age 14-17 8,372 25,261,314 3,017 8,630 25,866,985 2,997 99.3 Age 18-21 16,412 161,502,169 9,840 15,812 135,580,204 8,575 87.1 Age 60 and over 8,258 268,686,266 32,536 6,925 148,815,148 21,490 66.0
Note: Demographic information obtained from recent Alaska PFD fi les.
Source: Alaska Department of Labor & Workforce Development, Research and Analysis Section

ALASKA ECONOMIC TRENDS JUNE 2005 7
both male and female average earnings have increased, but female earnings grew nearly twice the rate of men’s (6.5 percent vs. 3.5 percent over the two year period). (See Exhibit 4.)
Industry comparison
Women made up a disproportionate share of the workers in the Educational and Health Services (75.8%), Financial Activities (60.4%), Local Government (58.0%) and Other Services (55.2%) industry sectors in 2003. They were noticeably underrepresented in the Construction (12.2%) and Natural Resources and Mining (13.5%) industry sectors. (See Exhibit 5.)
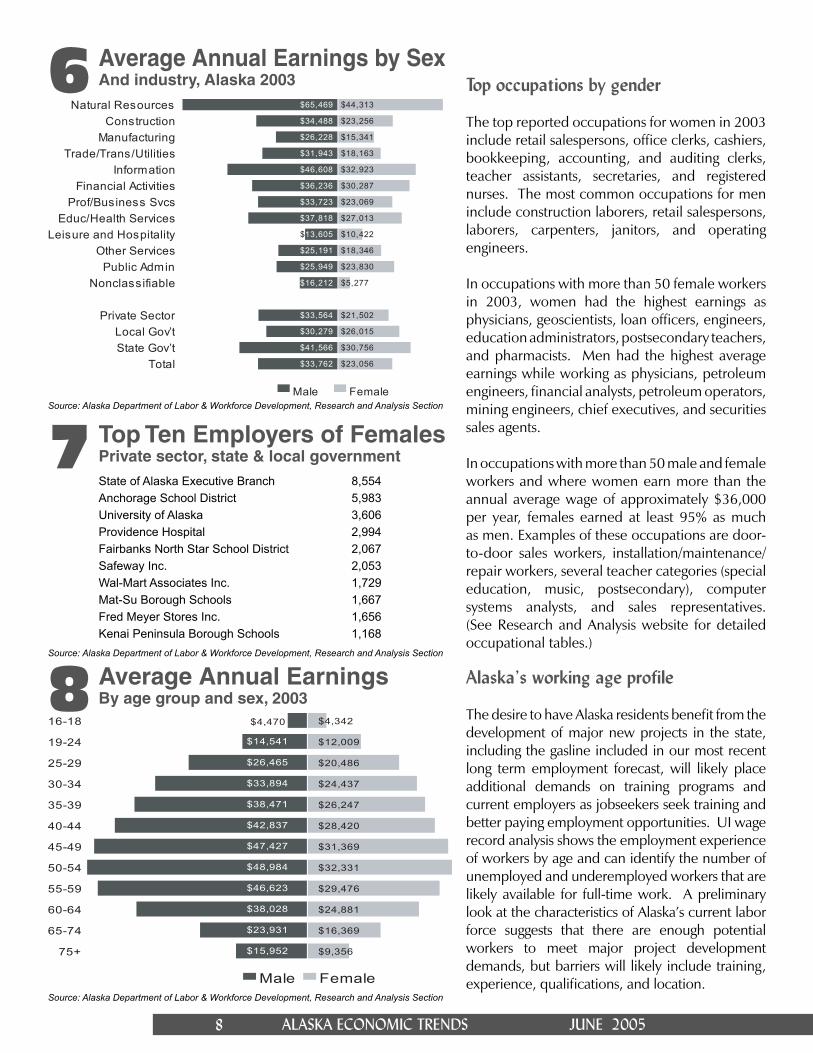
Women earned less than men in all major industry categories. Highest average earnings were paid to women working in the Natural Resources and Mining ($44,313) and Information industries ($32,923). Women came closest to achieving parity in earnings with men in Local Government, where women earned on average about 86% as much as men. (See Exhibit 6.)
Government, health care and retail trade employers were the top employers of women in 2003. The top three employers of women in Alaska were the State of Alaska, Anchorage School District and the University of Alaska. Top private
sector employers of women were Providence Hospital, Safeway, Wal-Mart, Fred Meyer, and Alaska Airlines. (See Exhibit 7.) Women earned the most in the 50 to 54 age group. (See Exhibit 8.)
4Gender Earnings Ratio1988 to 2003
Average Annual Earnings
1988 1990 1995 1997 1999 2001 2003
Male $24,232 $27,655 $29,261 $29,327 $30,066 $32,618 $33,762
Female 14,962 16,934 19,182 19,059 20,079 21,644 23,056
Ratio Female to Male Average Wage
61.7% 61.2% 65.6% 65.0% 66.8% 66.4% 68.3%
Source: Alaska Department of Labor & Workforce Development, Research and Analysis Section
5Male and Female EmploymentBy industry, 2003
Source: Alaska Department of Labor & Workforce Development, Research and Analysis Section
Natural Resources & Mining Construction
Manufacturing Trade, Transportation & Utilities
Information Financial Activities
Professional & Business Svcs Educational & Health Services
Leisure and Hospitality Other Services
Public Administration Nonclassifiable
Private Sector Local Government State Government
Total
0% 20% 40% 60% 80% 100%
Male Female
ALASKA ECONOMIC TRENDS JUNE 20058
8 Average Annual Earnings By age group and sex, 2003
7 Top Ten Employers of Females Private sector, state & local government
6 Average Annual Earnings by SexAnd industry, Alaska 2003
Source: Alaska Department of Labor & Workforce Development, Research and Analysis Section
State of Alaska Executive Branch 8,554 Anchorage School District 5,983 University of Alaska 3,606 Providence Hospital 2,994 Fairbanks North Star School District 2,067 Safeway Inc. 2,053 Wal-Mart Associates Inc. 1,729 Mat-Su Borough Schools 1,667 Fred Meyer Stores Inc. 1,656 Kenai Peninsula Borough Schools 1,168
Source: Alaska Department of Labor & Workforce Development, Research and Analysis Section
$4,470
$14,541
$26,465
$33,894
$38,471
$42,837
$47,427
$48,984
$46,623
$38,028
$23,931
$15,952
$4,342
$12,009
$20,486
$24,437
$26,247
$28,420
$31,369
$32,331
$29,476
$24,881
$16,369
$9,356
16-18
19-24
25-29
30-34
35-39
40-44
45-49
50-54
55-59
60-64
65-74
75+
Male Female
Top occupations by gender
The top reported occupations for women in 2003 include retail salespersons, offi ce clerks, cashiers, bookkeeping, accounting, and auditing clerks, teacher assistants, secretaries, and registered nurses. The most common occupations for men include construction laborers, retail salespersons, laborers, carpenters, janitors, and operating engineers.
In occupations with more than 50 female workers in 2003, women had the highest earnings as physicians, geoscientists, loan offi cers, engineers, education administrators, postsecondary teachers, and pharmacists. Men had the highest average earnings while working as physicians, petroleum engineers, fi nancial analysts, petroleum operators, mining engineers, chief executives, and securities sales agents.
In occupations with more than 50 male and female workers and where women earn more than the annual average wage of approximately $36,000 per year, females earned at least 95% as much as men. Examples of these occupations are door-to-door sales workers, installation/maintenance/repair workers, several teacher categories (special education, music, postsecondary), computer systems analysts, and sales representatives. (See Research and Analysis website for detailed occupational tables.)
Alaska’s working age profile
The desire to have Alaska residents benefi t from the development of major new projects in the state, including the gasline included in our most recent long term employment forecast, will likely place additional demands on training programs and current employers as jobseekers seek training and better paying employment opportunities. UI wage record analysis shows the employment experience of workers by age and can identify the number of unemployed and underemployed workers that are likely available for full-time work. A preliminary look at the characteristics of Alaska’s current labor force suggests that there are enough potential workers to meet major project development demands, but barriers will likely include training, experience, qualifi cations, and location.
Source: Alaska Department of Labor & Workforce Development, Research and Analysis Section
$65,469
$34,488
$26,228
$31,943
$46,608
$36,236
$33,723
$37,818
$13,605
$25,191
$25,949
$16,212
$33,564
$30,279
$41,566
$33,762
$44,313
$23,256
$15,341
$18,163
$32,923
$30,287
$23,069
$27,013
$10,422
$18,346
$23,830
$5,277
$21,502
$26,015
$30,756
$23,056
Natural ResourcesConstruction
ManufacturingTrade/Trans/Utilities
InformationFinancial Activities
Prof/Business SvcsEduc/Health Services
Leisure and HospitalityOther Services
Public AdminNonclassifiable
Private SectorLocal Gov’tState Gov’t
Total
Male Female
ALASKA ECONOMIC TRENDS JUNE 2005 9
Over each of the next ten years, approximately 11,000 Alaskans will reach age 16—generally considered working age. In addition to young workers entering the labor force, a signifi cant number of unemployed and underemployed workers at any given time represent a large, underutilized supply of labor. In 2004, the average number of unemployed was about 25,000 each month while more than 60,000 workers received Alaska UI benefi ts—about 51,000 of those UI claimants received their benefi ts in-state.
Each year a large number of young workers enter the labor force, and an approximately equal, and increasing, number of Alaskans approach retirement age. (See Population Projections, Alaska Economic Trends, February 2005). Although this presents an opportunity for young workers, it will place demands on training programs to fi ll the openings due to growth in employment, retirement of workers, and normal turnover resulting from job changes and normal out-migration.
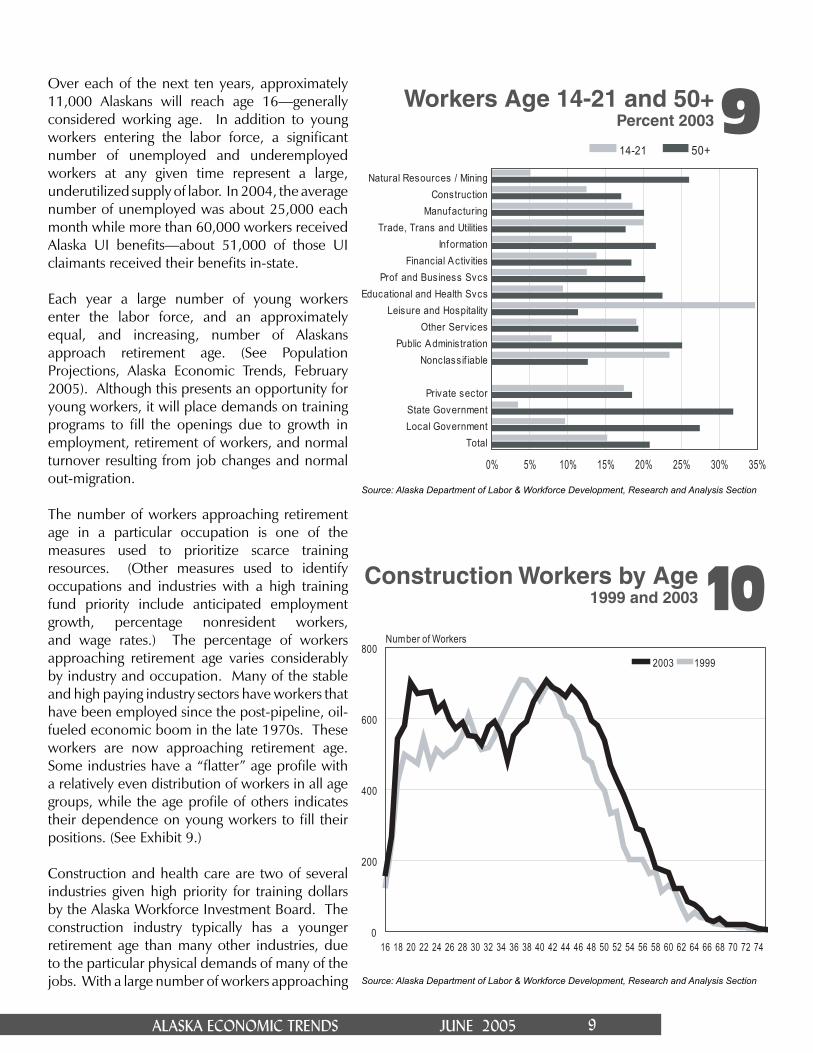
The number of workers approaching retirement age in a particular occupation is one of the measures used to prioritize scarce training resources. (Other measures used to identify occupations and industries with a high training fund priority include anticipated employment growth, percentage nonresident workers, and wage rates.) The percentage of workers approaching retirement age varies considerably by industry and occupation. Many of the stable and high paying industry sectors have workers that have been employed since the post-pipeline, oil-fueled economic boom in the late 1970s. These workers are now approaching retirement age. Some industries have a “fl atter” age profi le with a relatively even distribution of workers in all age groups, while the age profi le of others indicates their dependence on young workers to fi ll their positions. (See Exhibit 9.)
Construction and health care are two of several industries given high priority for training dollars by the Alaska Workforce Investment Board. The construction industry typically has a younger retirement age than many other industries, due to the particular physical demands of many of the jobs. With a large number of workers approaching
9Workers Age 14-21 and 50+Percent 2003
Natural Resources / MiningConstruction
ManufacturingTrade, Trans and Utilities
InformationFinancial Activ ities
Prof and Business SvcsEducational and Health Svcs
Leisure and HospitalityOther Services
Public AdministrationNonclassif iable
Private sectorState GovernmentLocal Government
Total
0% 5% 10% 15% 20% 25% 30% 35%
14-21 50+
Source: Alaska Department of Labor & Workforce Development, Research and Analysis Section
10Construction Workers by Age 1999 and 2003
16 18 20 22 24 26 28 30 32 34 36 38 40 42 44 46 48 50 52 54 56 58 60 62 64 66 68 70 72 74
0
200
400
600
800Number of Workers
2003 1999
Source: Alaska Department of Labor & Workforce Development, Research and Analysis Section

ALASKA ECONOMIC TRENDS JUNE 200510
11Workers by AgeSelected Industries, 2003
12 Workers by AgePrivate sector, state & local gov’t, 2003
13 Workers by AgeIn two older worker occupations, 2003
retirement age, new training programs have been established to meet the replacement and growth needs of that industry. The construction industry exhibits a “wave” of older workers that has continued to age over time, with a large number in their mid to late forties, and has also shown a marked increase in the number of young construction workers over the last several years. Exhibit 10 shows a comparison of the construction industry worker age profi le in 1999 versus 2003. The Construction and Health Care and Social Assistance age profi les are very similar while state and local government is facing an even more dramatic number of prospective retirees over the next few years. (See Exhibits 11 and 12.)
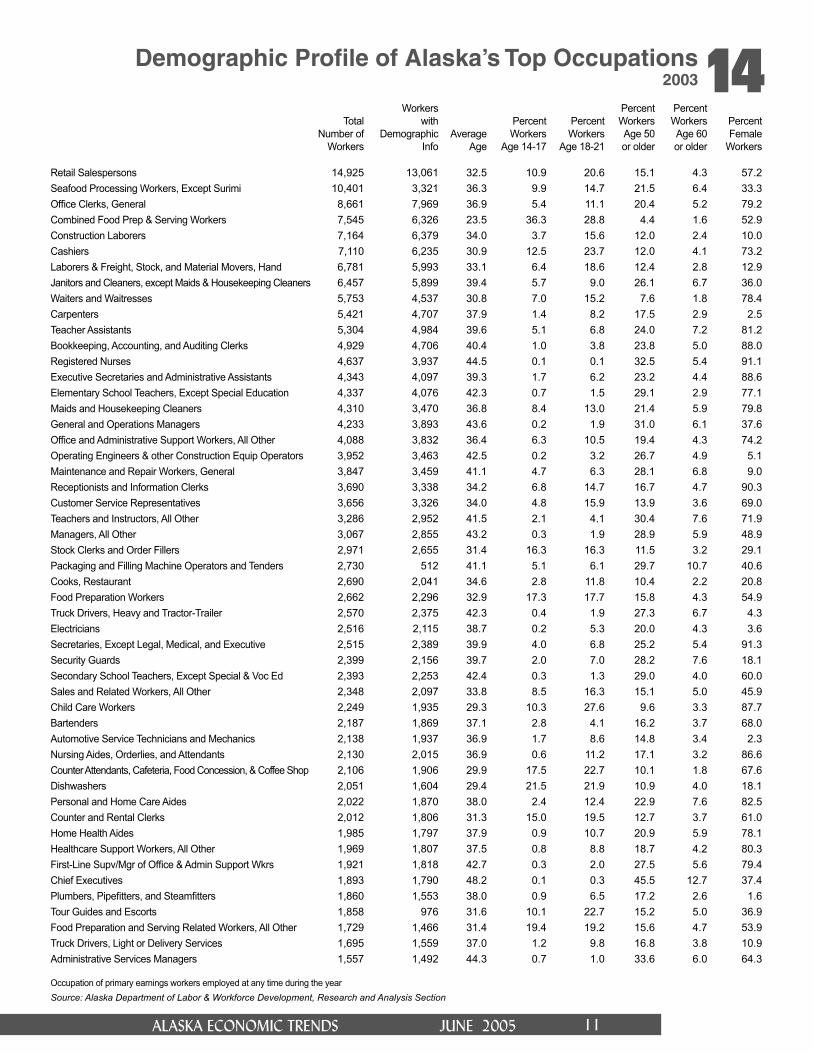
Occupations with the largest number of workers age 50 and over in 2003 were Retail Salespersons, Offi ce Clerks, Janitors and Cleaners, Registered Nurses, General and Operations Managers, Teacher Assistants, Elementary School Teachers, Bookkeeping Clerks, and Maintenance and Repair Workers.
Two benchmark occupations most associated with the health care and construction industry sectors are Registered Nurses and Operating Engineers. Surprisingly, these two occupations have very similar age profi les with a large number and percentage of older workers in their ranks. Nearly one-third of registered nurses were age 50 or older in 2003, while about 27 percent of operating engineers were that age. (See Exhibits 13 and 14.) Both occupations are facing considerable replacement needs due to retirements over the next several years.
Exhibit 15 shows the percent distribution of workers by age in major industry categories. Clearly, the training needs driven by an aging labor force vary across industries. Based upon a review of detailed industry sectors (tables available on the Research and Analysis website), industries with more than 100 workers and the largest percentages of workers age 50 and over include: Pipeline Transportation, Transit and Ground Passenger Transportation, Oil and Gas Extraction, State Government, Chemical Manufacturing, Private Households, Utilities, Forestry and Logging, Local Government, and
14 16 18 20 22 24 26 28 30 32 34 36 38 40 42 44 46 48 50 52 54 56 58 60 62 64 66 68 70 72 74 76 78 80 82 84
0
2
4
6
8Percent
Accommodation and Food ServicesConstructionHealth Care and Social Assistance
Source: Alaska Department of Labor & Workforce Development, Research and Analysis Section
14 16 18 20 22 24 26 28 30 32 34 36 38 40 42 44 46 48 50 52 54 56 58 60 62 64 66 68 70 72 74 76 78 80 82 84
0
1
2
3
4
5Percent
Private State Local
Source: Alaska Department of Labor & Workforce Development, Research and Analysis Section
14 16 18 20 22 24 26 28 30 32 34 36 38 40 42 44 46 48 50 52 54 56 58 60 62 64 66 68 70 72 740
50
100
150
200
250Workers
Registered Nurses Operating Engineers
Source: Alaska Department of Labor & Workforce Development, Research and Analysis Section
ALASKA ECONOMIC TRENDS JUNE 2005 11
Total Number of
Workers
Workers with
Demographic Info
Average Age
Percent Workers
Age 14-17
Percent Workers
Age 18-21
Percent Workers Age 50 or older
Percent Workers Age 60 or older
Percent Female
Workers
Retail Salespersons 14,925 13,061 32.5 10.9 20.6 15.1 4.3 57.2Seafood Processing Workers, Except Surimi 10,401 3,321 36.3 9.9 14.7 21.5 6.4 33.3Offi ce Clerks, General 8,661 7,969 36.9 5.4 11.1 20.4 5.2 79.2Combined Food Prep & Serving Workers 7,545 6,326 23.5 36.3 28.8 4.4 1.6 52.9Construction Laborers 7,164 6,379 34.0 3.7 15.6 12.0 2.4 10.0Cashiers 7,110 6,235 30.9 12.5 23.7 12.0 4.1 73.2Laborers & Freight, Stock, and Material Movers, Hand 6,781 5,993 33.1 6.4 18.6 12.4 2.8 12.9Janitors and Cleaners, except Maids & Housekeeping Cleaners 6,457 5,899 39.4 5.7 9.0 26.1 6.7 36.0Waiters and Waitresses 5,753 4,537 30.8 7.0 15.2 7.6 1.8 78.4Carpenters 5,421 4,707 37.9 1.4 8.2 17.5 2.9 2.5Teacher Assistants 5,304 4,984 39.6 5.1 6.8 24.0 7.2 81.2Bookkeeping, Accounting, and Auditing Clerks 4,929 4,706 40.4 1.0 3.8 23.8 5.0 88.0Registered Nurses 4,637 3,937 44.5 0.1 0.1 32.5 5.4 91.1Executive Secretaries and Administrative Assistants 4,343 4,097 39.3 1.7 6.2 23.2 4.4 88.6Elementary School Teachers, Except Special Education 4,337 4,076 42.3 0.7 1.5 29.1 2.9 77.1Maids and Housekeeping Cleaners 4,310 3,470 36.8 8.4 13.0 21.4 5.9 79.8General and Operations Managers 4,233 3,893 43.6 0.2 1.9 31.0 6.1 37.6Offi ce and Administrative Support Workers, All Other 4,088 3,832 36.4 6.3 10.5 19.4 4.3 74.2Operating Engineers & other Construction Equip Operators 3,952 3,463 42.5 0.2 3.2 26.7 4.9 5.1Maintenance and Repair Workers, General 3,847 3,459 41.1 4.7 6.3 28.1 6.8 9.0Receptionists and Information Clerks 3,690 3,338 34.2 6.8 14.7 16.7 4.7 90.3Customer Service Representatives 3,656 3,326 34.0 4.8 15.9 13.9 3.6 69.0Teachers and Instructors, All Other 3,286 2,952 41.5 2.1 4.1 30.4 7.6 71.9Managers, All Other 3,067 2,855 43.2 0.3 1.9 28.9 5.9 48.9Stock Clerks and Order Fillers 2,971 2,655 31.4 16.3 16.3 11.5 3.2 29.1Packaging and Filling Machine Operators and Tenders 2,730 512 41.1 5.1 6.1 29.7 10.7 40.6Cooks, Restaurant 2,690 2,041 34.6 2.8 11.8 10.4 2.2 20.8Food Preparation Workers 2,662 2,296 32.9 17.3 17.7 15.8 4.3 54.9Truck Drivers, Heavy and Tractor-Trailer 2,570 2,375 42.3 0.4 1.9 27.3 6.7 4.3Electricians 2,516 2,115 38.7 0.2 5.3 20.0 4.3 3.6Secretaries, Except Legal, Medical, and Executive 2,515 2,389 39.9 4.0 6.8 25.2 5.4 91.3Security Guards 2,399 2,156 39.7 2.0 7.0 28.2 7.6 18.1Secondary School Teachers, Except Special & Voc Ed 2,393 2,253 42.4 0.3 1.3 29.0 4.0 60.0Sales and Related Workers, All Other 2,348 2,097 33.8 8.5 16.3 15.1 5.0 45.9Child Care Workers 2,249 1,935 29.3 10.3 27.6 9.6 3.3 87.7Bartenders 2,187 1,869 37.1 2.8 4.1 16.2 3.7 68.0Automotive Service Technicians and Mechanics 2,138 1,937 36.9 1.7 8.6 14.8 3.4 2.3Nursing Aides, Orderlies, and Attendants 2,130 2,015 36.9 0.6 11.2 17.1 3.2 86.6Counter Attendants, Cafeteria, Food Concession, & Coffee Shop 2,106 1,906 29.9 17.5 22.7 10.1 1.8 67.6Dishwashers 2,051 1,604 29.4 21.5 21.9 10.9 4.0 18.1Personal and Home Care Aides 2,022 1,870 38.0 2.4 12.4 22.9 7.6 82.5Counter and Rental Clerks 2,012 1,806 31.3 15.0 19.5 12.7 3.7 61.0Home Health Aides 1,985 1,797 37.9 0.9 10.7 20.9 5.9 78.1Healthcare Support Workers, All Other 1,969 1,807 37.5 0.8 8.8 18.7 4.2 80.3First-Line Supv/Mgr of Offi ce & Admin Support Wkrs 1,921 1,818 42.7 0.3 2.0 27.5 5.6 79.4Chief Executives 1,893 1,790 48.2 0.1 0.3 45.5 12.7 37.4Plumbers, Pipefi tters, and Steamfi tters 1,860 1,553 38.0 0.9 6.5 17.2 2.6 1.6Tour Guides and Escorts 1,858 976 31.6 10.1 22.7 15.2 5.0 36.9Food Preparation and Serving Related Workers, All Other 1,729 1,466 31.4 19.4 19.2 15.6 4.7 53.9Truck Drivers, Light or Delivery Services 1,695 1,559 37.0 1.2 9.8 16.8 3.8 10.9Administrative Services Managers 1,557 1,492 44.3 0.7 1.0 33.6 6.0 64.3
Occupation of primary earnings workers employed at any time during the yearSource: Alaska Department of Labor & Workforce Development, Research and Analysis Section
14Demographic Profi le of Alaska’s Top Occupations2003

ALASKA ECONOMIC TRENDS JUNE 200512
Educational Services. Largest private employers of workers age 50 and over include: Providence Hospital, Safeway, BP Exploration, Wal-Mart, Alaska Airlines, Fred Meyer, Alyeska Pipeline, NANA Management, and Banner Health.
Youth and Older Workers
Young workers and older workers are alike in that they are more likely to be part-time, part-year, and/or low wage workers than other age groups. They play an important role for many employers—fi lling their seasonal or part-time hiring needs. However, these two groups differ in that young workers are often getting their fi rst work experience, while older workers are keeping themselves busy or making ends meet.
Work experience is important in that it can provide more information about future training and career paths, but will also give a better understanding of what every employer expects—dependability, timeliness, and an ability to learn.
While older workers generally have acquired a lifetime of skills and habits that can be applied to a job, young workers generally need more training.
Young Workers
In 2003, about 49,000 Young Alaskan workers age 14 to 21 earned about $348 million dollars. Although they represented 15.3% of total workers employed at some time during the year, they earned less than 4% of total wages for all age groups. For many young workers, employment is for the summer or part-time only.
In previous reports on youth, workers age 14 to 17 and workers age 18 to 21 have been considered separately because of their different characteristics. The younger age group includes those still in high school, while the older youth group includes those with a little more work experience, but still employed in one of their fi rst jobs or working while pursuing postsecondary education.
15 Worker DemographicsBy industry, 2003
Total Number of
Workers
Total Number of Workers with
Demographic InfoAverage
Age
Percent Workers
Age 14-17
Percent Workers
Age 18-21
Percent Workers Age 50 or older
Percent Workers Age 60 or older
Percent Female
Workers
Natural Resources 15,710 12,978 41.6 1.2 4.0 26.1 5.3 13.5 Construction 28,246 23,943 36.9 2.4 10.2 17.2 3.5 12.2 Manufacturing 24,385 10,602 37.1 6.9 11.8 20.2 5.1 30.1 Trade, Trans and Utilities 81,656 71,683 35.7 6.3 13.8 17.7 4.5 40.8 Information 8,200 7,740 38.7 4.3 6.3 21.7 4.1 45.3 Financial Activities 16,591 15,416 36.9 3.4 10.5 18.5 4.4 60.4 Prof & Business Svcs 30,124 25,205 37.7 3.1 9.5 20.3 5.3 45.0 Educ and Health Svcs 40,824 37,039 38.9 1.9 7.5 22.6 5.4 75.8 Leisure and Hospitality 44,441 34,458 30.8 16.6 18.2 11.4 3.1 53.3 Other Services 12,061 10,754 36.3 7.0 12.2 19.4 5.5 55.2 Public Administration 406 389 40.1 2.1 5.9 25.2 5.9 51.9 Nonclassifi able 183 102 34.7 9.8 13.7 12.7 2.9 30.1
Private Sector 302,827 250,309 36.4 5.9 11.6 18.6 4.5 45.4 Local Government 48,995 46,838 40.7 4.5 5.2 27.5 5.6 58.0 State Government 25,952 24,754 43.0 0.4 3.2 32.0 5.4 50.6 Total 377,774 321,901 37.5 5.3 10.0 20.9 4.7 47.7
Note: Demographic information obtained from recent Alaska PFD fi les.
Source: Alaska Department of Labor & Workforce Development, Research and Analysis Section

ALASKA ECONOMIC TRENDS JUNE 2005 13
High school age youth earned only about $51 million in 2003, or an average of about $3,000 per worker. Top occupations for the high school age youth include food service workers, retail salespersons, cashiers, seafood processing workers, and stock clerks. Top industries for these workers include restaurants, schools, grocery stores, tribal governments, and hotels. Top employers include Safeway, McDonald’s, Denali Foods, Alaska Commercial, Fred Meyer, and Subway.
College age youth, age 18 to 21, had signifi cantly higher total and average earnings than high school age youth. Total earnings for this group was $297 million in 2003, with average earnings totaling $9,200. Similar to high school age youth, these slightly older workers were employed as retail salespersons, food service workers, and cashiers, but also worked as laborers and construction laborers. Top industries include restaurants, government offi ces, hotels, and warehouse clubs/supercenters. Top employers were Wal-Mart, Fred Meyer, Safeway, and McDonald’s. (See Exhibits 16 and 17.)
Older workers age 60 and over
Workers age 60 and over fall into two categories, semi-retired and individuals at their earnings and professional peak. In 2003, this group earned more than $417 million and an average of $27,500, although the “younger” members of this age group had much higher average earnings than the oldest workers.
Older workers were most often employed as retail salespersons, offi ce clerks, janitors, teacher assistants, and cashiers. Top industry sectors for these workers include elementary and secondary schools, government offi ces, colleges, hospitals, seafood processing, and oil industry support. Major employers of older workers include Wal-Mart, Providence Hospital, Safeway, Alaska Airlines, and Laidlaw Transit.
Job tenure and work experience
Using each unique worker-employer relationship identifi ed in the third calendar quarter of 2004
16Top Ten Employersof 14 to 17-year olds, 2003
Safeway Inc 594 McDonalds Restaurants of Alaska 300 Denali Foods Inc 224 Interior Alaska McDonalds 219 AK Commercial Co 205 Fred Meyer Stores Inc 168 Subway of Alaska Inc 160 Restaurants Northwest Inc 158 Pizza Hut 116 McDonalds 112
Note: Demographic information obtained from recent Alaska PFD fi les.
Source: Alaska Department of Labor & Workforce Development, Research and Analysis Section
17Top Ten Employersof 18 to 21-year olds, 2003
Wal-Mart Associates Inc 607 Fred Meyer Stores Inc 558 Safeway Inc 481 McDonalds Restaurants of Alaska 216 Denali Foods Inc 204 Sears Roebuck and Co. 182 Alaska Commercial Co. 171 Costco Wholesale Corp. 159 Nana Management Services LLC 155 Pizza Hut 155
Note: Demographic information obtained through 2003 and 2004 PFD applications.
Source: Alaska Department of Labor & Workforce Development, Research and Analysis Section
18Workers with Five plus Yearswith same employer, Third Quarter 2004
Source: Alaska Department of Labor & Workforce Development, Research and Analysis Section
19.3%
25.7%8.8%
10.5%18.7%24.0%19.9%11.2%14.9%
6.9%14.9%47.0%38.1%
6.4%
Total
Natural ResourcesConstructionManufacturingTrade/Trans/UtilInformationFinancial Prof /Business SvcsEduc/Health SvcsLeisure/HospitalityOther ServicesState Gov'tLocal Gov'tOther/Misc
ALASKA ECONOMIC TRENDS JUNE 200514
Although Alaska’s UI wage records contain occupational information, changes in occupational coding systems over the seven year period and slight variations in employer reporting can make inter-quarter comparisons by detailed occupation less reliable. Long term analysis of experience by occupation is ongoing. Surprisingly, there was virtually no difference in average employer tenure by sex.
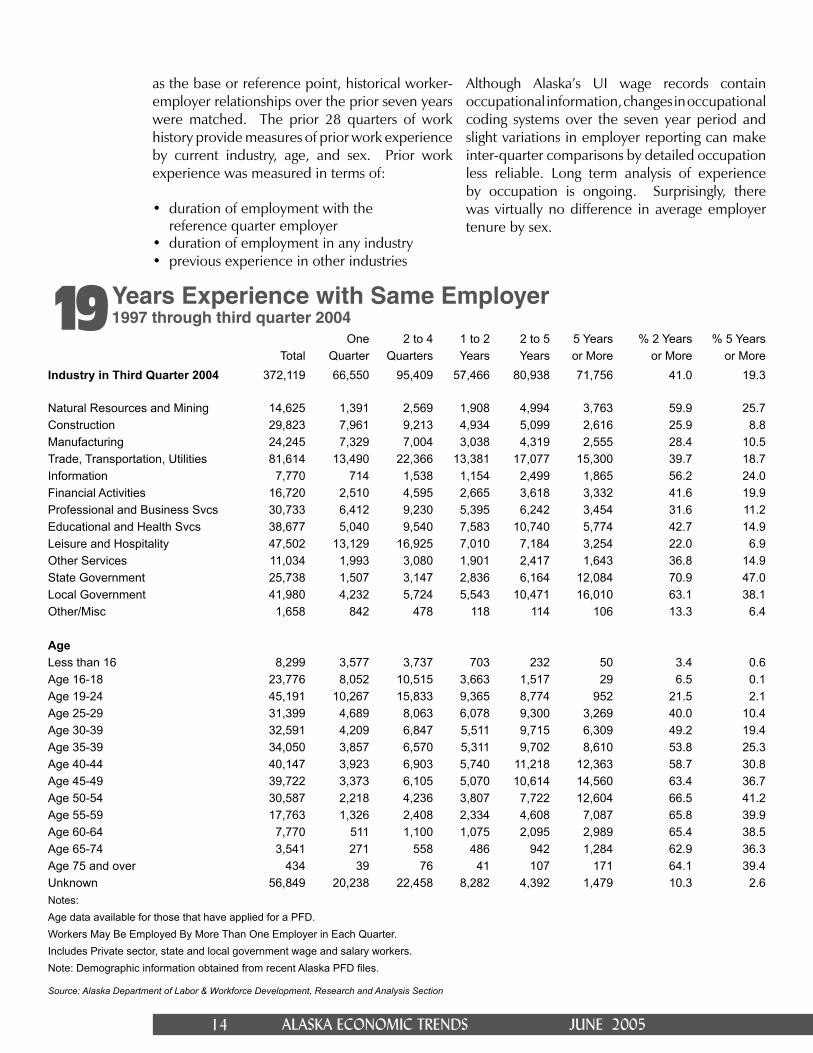
as the base or reference point, historical worker-employer relationships over the prior seven years were matched. The prior 28 quarters of work history provide measures of prior work experience by current industry, age, and sex. Prior work experience was measured in terms of:
• duration of employment with the reference quarter employer• duration of employment in any industry • previous experience in other industries
19 Years Experience with Same Employer1997 through third quarter 2004
One 2 to 4 1 to 2 2 to 5 5 Years % 2 Years % 5 Years Total Quarter Quarters Years Years or More or More or MoreIndustry in Third Quarter 2004 372,119 66,550 95,409 57,466 80,938 71,756 41.0 19.3
Natural Resources and Mining 14,625 1,391 2,569 1,908 4,994 3,763 59.9 25.7Construction 29,823 7,961 9,213 4,934 5,099 2,616 25.9 8.8Manufacturing 24,245 7,329 7,004 3,038 4,319 2,555 28.4 10.5Trade, Transportation, Utilities 81,614 13,490 22,366 13,381 17,077 15,300 39.7 18.7Information 7,770 714 1,538 1,154 2,499 1,865 56.2 24.0Financial Activities 16,720 2,510 4,595 2,665 3,618 3,332 41.6 19.9Professional and Business Svcs 30,733 6,412 9,230 5,395 6,242 3,454 31.6 11.2Educational and Health Svcs 38,677 5,040 9,540 7,583 10,740 5,774 42.7 14.9Leisure and Hospitality 47,502 13,129 16,925 7,010 7,184 3,254 22.0 6.9Other Services 11,034 1,993 3,080 1,901 2,417 1,643 36.8 14.9State Government 25,738 1,507 3,147 2,836 6,164 12,084 70.9 47.0Local Government 41,980 4,232 5,724 5,543 10,471 16,010 63.1 38.1Other/Misc 1,658 842 478 118 114 106 13.3 6.4
AgeLess than 16 8,299 3,577 3,737 703 232 50 3.4 0.6Age 16-18 23,776 8,052 10,515 3,663 1,517 29 6.5 0.1Age 19-24 45,191 10,267 15,833 9,365 8,774 952 21.5 2.1Age 25-29 31,399 4,689 8,063 6,078 9,300 3,269 40.0 10.4Age 30-39 32,591 4,209 6,847 5,511 9,715 6,309 49.2 19.4Age 35-39 34,050 3,857 6,570 5,311 9,702 8,610 53.8 25.3Age 40-44 40,147 3,923 6,903 5,740 11,218 12,363 58.7 30.8Age 45-49 39,722 3,373 6,105 5,070 10,614 14,560 63.4 36.7Age 50-54 30,587 2,218 4,236 3,807 7,722 12,604 66.5 41.2Age 55-59 17,763 1,326 2,408 2,334 4,608 7,087 65.8 39.9Age 60-64 7,770 511 1,100 1,075 2,095 2,989 65.4 38.5Age 65-74 3,541 271 558 486 942 1,284 62.9 36.3Age 75 and over 434 39 76 41 107 171 64.1 39.4Unknown 56,849 20,238 22,458 8,282 4,392 1,479 10.3 2.6Notes:Age data available for those that have applied for a PFD. Workers May Be Employed By More Than One Employer in Each Quarter.Includes Private sector, state and local government wage and salary workers. Note: Demographic information obtained from recent Alaska PFD fi les.
Source: Alaska Department of Labor & Workforce Development, Research and Analysis Section
ALASKA ECONOMIC TRENDS JUNE 2005 15
State government (47.0%), local government (38.1%), natural resources and mining (25.7%), and information (24.0%) industries had the largest percentage of workers with fi ve or more years of total experience with that employer. Leisure and Hospitality (6.9%), Construction (8.8%) and Manufacturing (10.5%) had the lowest percentage of workers with fi ve or more years of experience with the same employer. (See Exhibit 18.)
Previous work experience with the same employer varies considerably by age. The very youngest workers in 2004 are least likely to have signifi cant job tenure with the same employer, in part due to their age and the fact that they are likely to move from employer to employer as they gain work experience and apply their education. By age 50 to 54, job tenure peaks, with more than 66% of that age cohort having 2 or more years of experience with the same employer. (See Exhibit 19.)
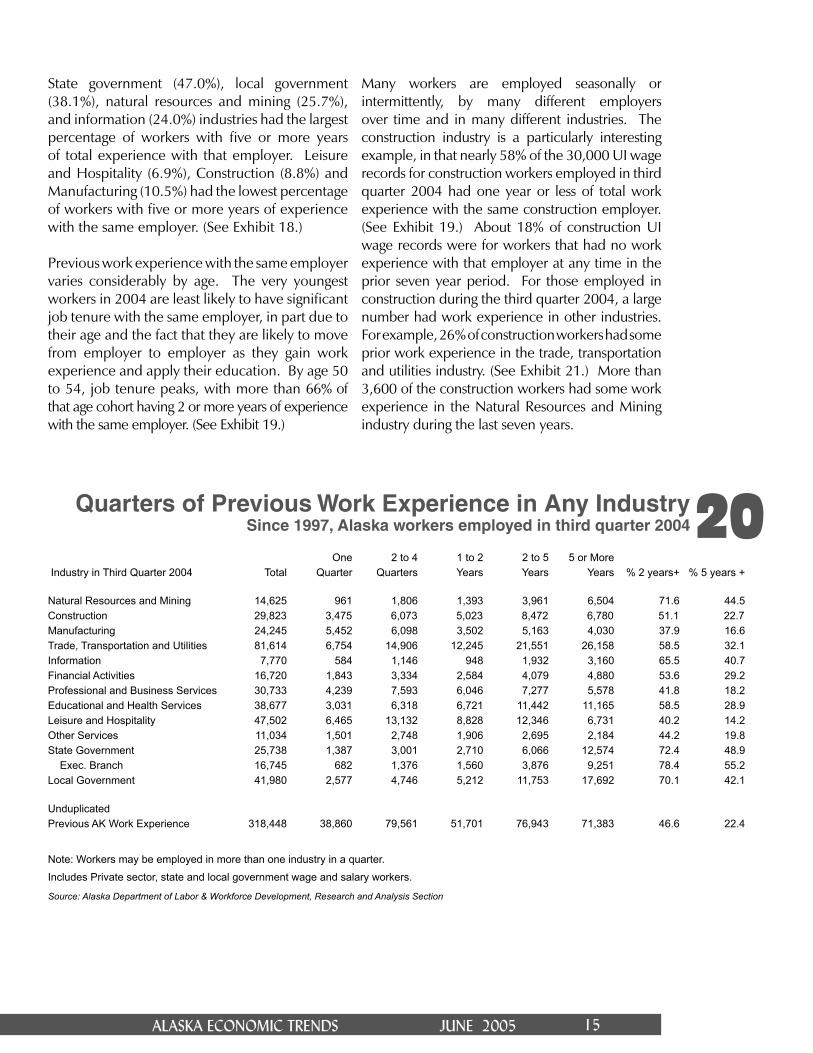
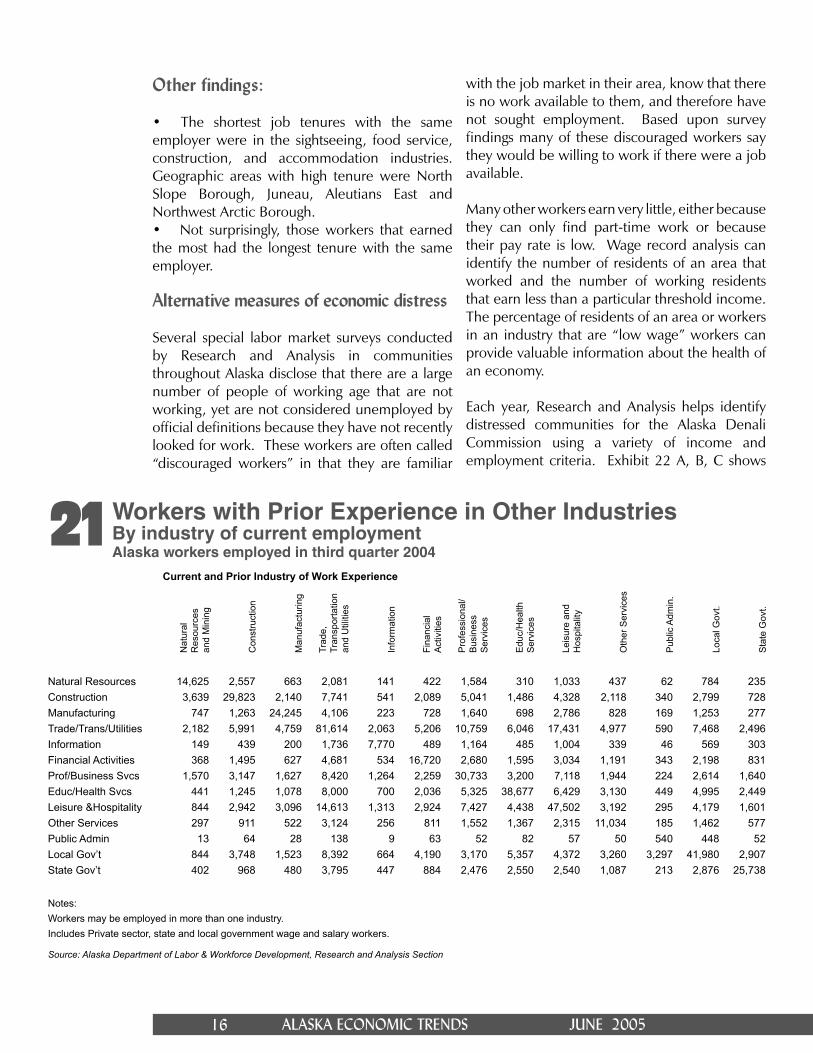
Many workers are employed seasonally or intermittently, by many different employers over time and in many different industries. The construction industry is a particularly interesting example, in that nearly 58% of the 30,000 UI wage records for construction workers employed in third quarter 2004 had one year or less of total work experience with the same construction employer. (See Exhibit 19.) About 18% of construction UI wage records were for workers that had no work experience with that employer at any time in the prior seven year period. For those employed in construction during the third quarter 2004, a large number had work experience in other industries. For example, 26% of construction workers had some prior work experience in the trade, transportation and utilities industry. (See Exhibit 21.) More than 3,600 of the construction workers had some work experience in the Natural Resources and Mining industry during the last seven years.
20 Quarters of Previous Work Experience in Any Industry Since 1997, Alaska workers employed in third quarter 2004
One 2 to 4 1 to 2 2 to 5 5 or More Industry in Third Quarter 2004 Total Quarter Quarters Years Years Years % 2 years+ % 5 years +
Natural Resources and Mining 14,625 961 1,806 1,393 3,961 6,504 71.6 44.5Construction 29,823 3,475 6,073 5,023 8,472 6,780 51.1 22.7Manufacturing 24,245 5,452 6,098 3,502 5,163 4,030 37.9 16.6Trade, Transportation and Utilities 81,614 6,754 14,906 12,245 21,551 26,158 58.5 32.1Information 7,770 584 1,146 948 1,932 3,160 65.5 40.7Financial Activities 16,720 1,843 3,334 2,584 4,079 4,880 53.6 29.2Professional and Business Services 30,733 4,239 7,593 6,046 7,277 5,578 41.8 18.2Educational and Health Services 38,677 3,031 6,318 6,721 11,442 11,165 58.5 28.9Leisure and Hospitality 47,502 6,465 13,132 8,828 12,346 6,731 40.2 14.2Other Services 11,034 1,501 2,748 1,906 2,695 2,184 44.2 19.8State Government 25,738 1,387 3,001 2,710 6,066 12,574 72.4 48.9
Exec. Branch 16,745 682 1,376 1,560 3,876 9,251 78.4 55.2Local Government 41,980 2,577 4,746 5,212 11,753 17,692 70.1 42.1
UnduplicatedPrevious AK Work Experience 318,448 38,860 79,561 51,701 76,943 71,383 46.6 22.4
Note: Workers may be employed in more than one industry in a quarter.
Includes Private sector, state and local government wage and salary workers.
Source: Alaska Department of Labor & Workforce Development, Research and Analysis Section
ALASKA ECONOMIC TRENDS JUNE 200516
Other findings:
• The shortest job tenures with the same employer were in the sightseeing, food service, construction, and accommodation industries. Geographic areas with high tenure were North Slope Borough, Juneau, Aleutians East and Northwest Arctic Borough. • Not surprisingly, those workers that earned the most had the longest tenure with the same employer.
Alternative measures of economic distress
Several special labor market surveys conducted by Research and Analysis in communities throughout Alaska disclose that there are a large number of people of working age that are not working, yet are not considered unemployed by offi cial defi nitions because they have not recently looked for work. These workers are often called “discouraged workers” in that they are familiar
with the job market in their area, know that there is no work available to them, and therefore have not sought employment. Based upon survey fi ndings many of these discouraged workers say they would be willing to work if there were a job available.
Many other workers earn very little, either because they can only fi nd part-time work or because their pay rate is low. Wage record analysis can identify the number of residents of an area that worked and the number of working residents that earn less than a particular threshold income. The percentage of residents of an area or workers in an industry that are “low wage” workers can provide valuable information about the health of an economy.
Each year, Research and Analysis helps identify distressed communities for the Alaska Denali Commission using a variety of income and employment criteria. Exhibit 22 A, B, C shows
21 Workers with Prior Experience in Other IndustriesBy industry of current employmentAlaska workers employed in third quarter 2004
Current and Prior Industry of Work Experience
Nat
ural
R
esou
rces
an
d M
inin
g
Con
stru
ctio
n
Man
ufac
turin
g
Trad
e,
Tran
spor
tatio
n an
d U
tiliti
es
Info
rmat
ion
Fina
ncia
l A
ctiv
ities
Pro
fess
iona
l/B
usin
ess
Ser
vice
s
Edu
c/H
ealth
S
ervi
ces
Leis
ure
and
Hos
pita
lity
Oth
er S
ervi
ces
Pub
lic A
dmin
.
Loca
l Gov
t.
Sta
te G
ovt.
Natural Resources 14,625 2,557 663 2,081 141 422 1,584 310 1,033 437 62 784 235Construction 3,639 29,823 2,140 7,741 541 2,089 5,041 1,486 4,328 2,118 340 2,799 728Manufacturing 747 1,263 24,245 4,106 223 728 1,640 698 2,786 828 169 1,253 277Trade/Trans/Utilities 2,182 5,991 4,759 81,614 2,063 5,206 10,759 6,046 17,431 4,977 590 7,468 2,496Information 149 439 200 1,736 7,770 489 1,164 485 1,004 339 46 569 303Financial Activities 368 1,495 627 4,681 534 16,720 2,680 1,595 3,034 1,191 343 2,198 831Prof/Business Svcs 1,570 3,147 1,627 8,420 1,264 2,259 30,733 3,200 7,118 1,944 224 2,614 1,640Educ/Health Svcs 441 1,245 1,078 8,000 700 2,036 5,325 38,677 6,429 3,130 449 4,995 2,449Leisure &Hospitality 844 2,942 3,096 14,613 1,313 2,924 7,427 4,438 47,502 3,192 295 4,179 1,601Other Services 297 911 522 3,124 256 811 1,552 1,367 2,315 11,034 185 1,462 577Public Admin 13 64 28 138 9 63 52 82 57 50 540 448 52Local Gov’t 844 3,748 1,523 8,392 664 4,190 3,170 5,357 4,372 3,260 3,297 41,980 2,907State Gov’t 402 968 480 3,795 447 884 2,476 2,550 2,540 1,087 213 2,876 25,738
Notes: Workers may be employed in more than one industry.Includes Private sector, state and local government wage and salary workers.
Source: Alaska Department of Labor & Workforce Development, Research and Analysis Section
ALASKA ECONOMIC TRENDS JUNE 2005 17
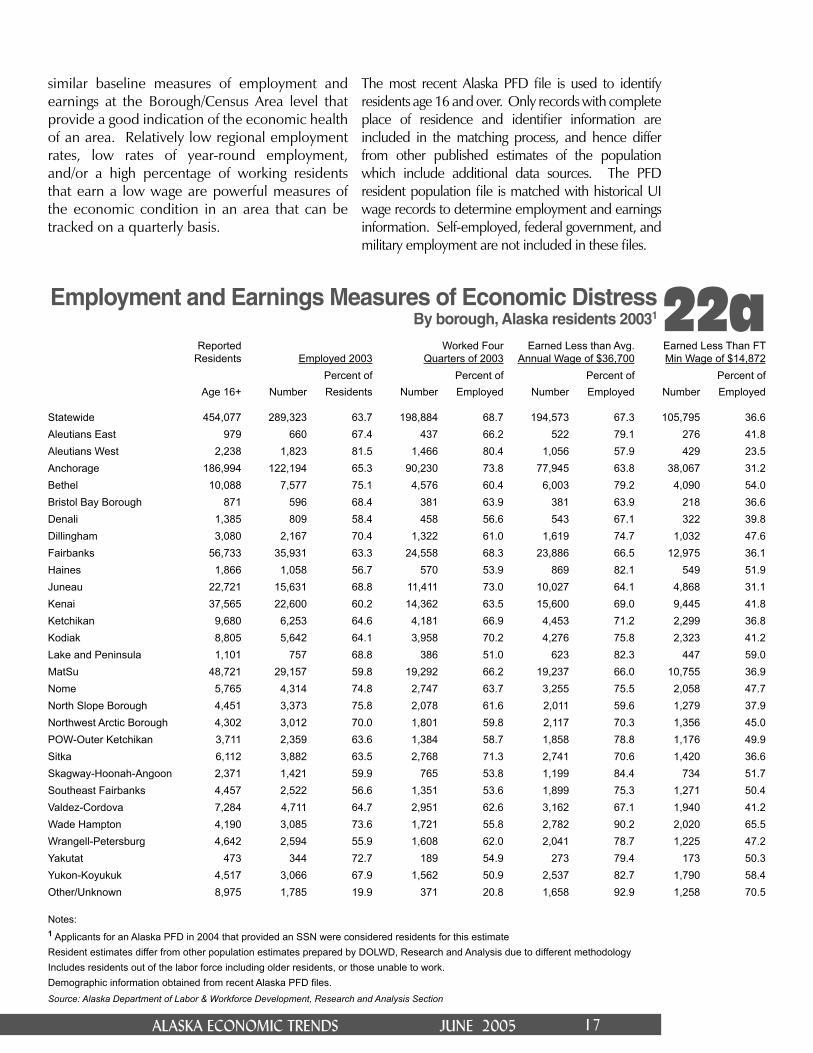
22a Employment and Earnings Measures of Economic Distress By borough, Alaska residents 20031
similar baseline measures of employment and earnings at the Borough/Census Area level that provide a good indication of the economic health of an area. Relatively low regional employment rates, low rates of year-round employment, and/or a high percentage of working residents that earn a low wage are powerful measures of the economic condition in an area that can be tracked on a quarterly basis.
The most recent Alaska PFD fi le is used to identify residents age 16 and over. Only records with complete place of residence and identifi er information are included in the matching process, and hence differ from other published estimates of the population which include additional data sources. The PFD resident population fi le is matched with historical UI wage records to determine employment and earnings information. Self-employed, federal government, and military employment are not included in these fi les.
Reported Residents Employed 2003
Worked Four Quarters of 2003
Earned Less than Avg. Annual Wage of $36,700
Earned Less Than FTMin Wage of $14,872
Percent of Percent of Percent of Percent ofAge 16+ Number Residents Number Employed Number Employed Number Employed
Statewide 454,077 289,323 63.7 198,884 68.7 194,573 67.3 105,795 36.6Aleutians East 979 660 67.4 437 66.2 522 79.1 276 41.8Aleutians West 2,238 1,823 81.5 1,466 80.4 1,056 57.9 429 23.5Anchorage 186,994 122,194 65.3 90,230 73.8 77,945 63.8 38,067 31.2Bethel 10,088 7,577 75.1 4,576 60.4 6,003 79.2 4,090 54.0Bristol Bay Borough 871 596 68.4 381 63.9 381 63.9 218 36.6Denali 1,385 809 58.4 458 56.6 543 67.1 322 39.8Dillingham 3,080 2,167 70.4 1,322 61.0 1,619 74.7 1,032 47.6Fairbanks 56,733 35,931 63.3 24,558 68.3 23,886 66.5 12,975 36.1Haines 1,866 1,058 56.7 570 53.9 869 82.1 549 51.9Juneau 22,721 15,631 68.8 11,411 73.0 10,027 64.1 4,868 31.1Kenai 37,565 22,600 60.2 14,362 63.5 15,600 69.0 9,445 41.8Ketchikan 9,680 6,253 64.6 4,181 66.9 4,453 71.2 2,299 36.8Kodiak 8,805 5,642 64.1 3,958 70.2 4,276 75.8 2,323 41.2Lake and Peninsula 1,101 757 68.8 386 51.0 623 82.3 447 59.0MatSu 48,721 29,157 59.8 19,292 66.2 19,237 66.0 10,755 36.9Nome 5,765 4,314 74.8 2,747 63.7 3,255 75.5 2,058 47.7North Slope Borough 4,451 3,373 75.8 2,078 61.6 2,011 59.6 1,279 37.9Northwest Arctic Borough 4,302 3,012 70.0 1,801 59.8 2,117 70.3 1,356 45.0POW-Outer Ketchikan 3,711 2,359 63.6 1,384 58.7 1,858 78.8 1,176 49.9Sitka 6,112 3,882 63.5 2,768 71.3 2,741 70.6 1,420 36.6Skagway-Hoonah-Angoon 2,371 1,421 59.9 765 53.8 1,199 84.4 734 51.7Southeast Fairbanks 4,457 2,522 56.6 1,351 53.6 1,899 75.3 1,271 50.4Valdez-Cordova 7,284 4,711 64.7 2,951 62.6 3,162 67.1 1,940 41.2Wade Hampton 4,190 3,085 73.6 1,721 55.8 2,782 90.2 2,020 65.5Wrangell-Petersburg 4,642 2,594 55.9 1,608 62.0 2,041 78.7 1,225 47.2Yakutat 473 344 72.7 189 54.9 273 79.4 173 50.3Yukon-Koyukuk 4,517 3,066 67.9 1,562 50.9 2,537 82.7 1,790 58.4Other/Unknown 8,975 1,785 19.9 371 20.8 1,658 92.9 1,258 70.5
Notes:1 Applicants for an Alaska PFD in 2004 that provided an SSN were considered residents for this estimateResident estimates differ from other population estimates prepared by DOLWD, Research and Analysis due to different methodologyIncludes residents out of the labor force including older residents, or those unable to work.Demographic information obtained from recent Alaska PFD fi les.Source: Alaska Department of Labor & Workforce Development, Research and Analysis Section
ALASKA ECONOMIC TRENDS JUNE 200518
22b Employment and Earnings Measures of Economic DistressBy age, Alaska residents 20031
Reported Residents Employed 2003
Worked Four Quarters of 2003
Earned Less than Avg. Annual Wage of $36,040
Earned Less Than FT Min Wage of $14,872
Percent of Percent of Percent of Percent ofAge 16+ Number Residents Number Employed Number Employed Number Employed
Male 232,234 148,494 63.9 100,575 67.7 87,610 59.0 48,546 32.7Female 221,775 140,796 63.5 98,297 69.8 106,936 76.0 57,232 40.6
Age 16 to 18 30,779 19,851 64.5 5,127 25.8 19,821 99.8 19,136 96.4Age 19 to 24 51,839 39,940 77.0 20,327 50.9 37,585 94.1 24,704 61.9Age 25 to 29 38,122 28,756 75.4 19,906 69.2 21,918 76.2 10,052 35.0Age 30 to 34 42,628 30,556 71.7 22,608 74.0 19,735 64.6 8,807 28.8Age 35 to 39 46,129 32,219 69.8 24,293 75.4 19,604 60.8 8,883 27.6Age 40 to 44 54,479 38,177 70.1 29,760 78.0 21,611 56.6 9,352 24.5Age 45 to 49 54,478 37,937 69.6 30,126 79.4 19,598 51.7 8,315 21.9Age 50 to 54 46,199 29,987 64.9 23,955 79.9 14,867 49.6 6,133 20.5Age 55 to 59 32,271 18,049 55.9 13,721 76.0 9,916 54.9 4,483 24.8Age 60 to 64 20,899 8,806 42.1 6,127 69.6 5,695 64.7 3,046 34.6Age 65 to 74 22,976 4,446 19.4 2,634 59.2 3,673 82.6 2,447 55.0Age 75 and Over 13,278 599 4.5 300 50.1 550 91.8 437 73.0
Notes:1 Applicants for an Alaska PFD in 2004 that provided an SSN were considered residents for this estimate.
Resident estimates differ from other population estimates prepared by DOLWD, Research and Analysis due to different methodology
Includes residents out of the labor force including older residents, or those unable to work.
Demographic information obtained from recent Alaska PFD fi les.
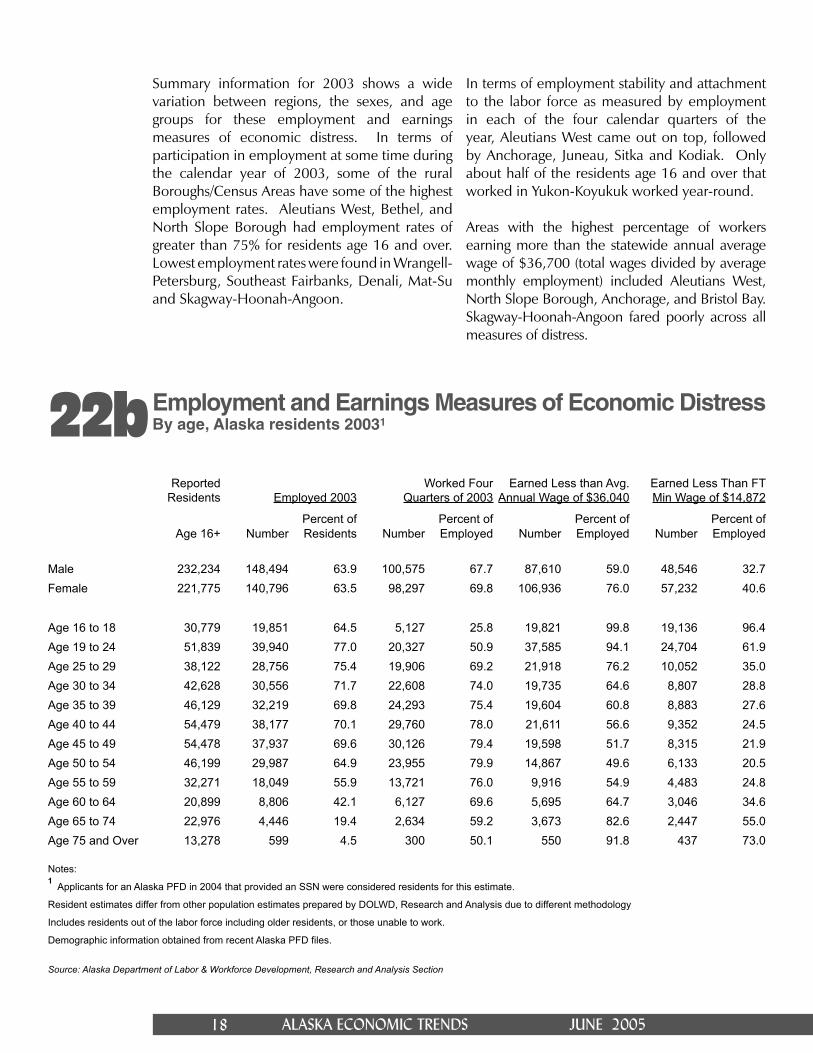
Summary information for 2003 shows a wide variation between regions, the sexes, and age groups for these employment and earnings measures of economic distress. In terms of participation in employment at some time during the calendar year of 2003, some of the rural Boroughs/Census Areas have some of the highest employment rates. Aleutians West, Bethel, and North Slope Borough had employment rates of greater than 75% for residents age 16 and over. Lowest employment rates were found in Wrangell-Petersburg, Southeast Fairbanks, Denali, Mat-Su and Skagway-Hoonah-Angoon.
In terms of employment stability and attachment to the labor force as measured by employment in each of the four calendar quarters of the year, Aleutians West came out on top, followed by Anchorage, Juneau, Sitka and Kodiak. Only about half of the residents age 16 and over that worked in Yukon-Koyukuk worked year-round.
Areas with the highest percentage of workers earning more than the statewide annual average wage of $36,700 (total wages divided by average monthly employment) included Aleutians West, North Slope Borough, Anchorage, and Bristol Bay. Skagway-Hoonah-Angoon fared poorly across all measures of distress.
Source: Alaska Department of Labor & Workforce Development, Research and Analysis Section

ALASKA ECONOMIC TRENDS JUNE 2005 19
23a Hires, New Hires and SeparationsThird quarter 2004, preliminary
When comparing the sexes, overall employment participation rates were comparable, but earnings were not. Only 24% of working women earned more than $36,700 compared with 41% of male workers. In terms of age, workers age 50 to 54 were the top performers with more than half of those workers earning more than the average annual wage.
New hire, separation, and turnover dynamics
Each time an employer fi lls a job, it represents a hiring opportunity for a jobseeker. New hires may be individuals fi lling a newly created or ongoing job.
Source: Alaska Department of Labor & Workforce Development, Research and Analysis Section
Total Wage New Percent Percent Separation Records Hires Hire New Hires Rehires Rate
Total 372,119 85,758 73,532 19.8 14.3 29.0
IndustryNatural Resources 14,625 1,921 1,639 11.2 14.7 18.4Construction 29,823 10,197 8,882 29.8 12.9 36.1Manufacturing 24,245 9,906 7,835 32.3 20.9 55.2Trade/Trans/Utilities 81,614 16,416 14,474 17.7 11.8 25.7Information 7,770 859 761 9.8 11.4 25.5Financial Activities 16,720 3,258 2,877 17.2 11.7 20.7Prof/Business Services 30,733 7,966 6,969 22.7 12.5 30.0Educ/Health Services 38,677 6,115 5,405 14.0 11.6 19.9Leisure and Hospitality 47,502 15,783 14,031 29.5 11.1 44.9Other Services 11,034 2,418 2,140 19.4 11.5 27.3Public Administration 540 179 118 21.9 34.1 31.9Local Government 41,980 7,625 5,835 13.9 23.5 21.0State Government 25,738 2,351 1,811 7.0 23.0 14.0
Executive Branch 16,745 1,077 878 5.2 18.5 8.5Other/Misc. 1,118 764 755 67.5 1.2 64.8
SexMale 165,412 34,862 29,214 17.7 16.2 26.6Female 149,179 27,257 23,238 15.6 14.7 24.5NA 57,528 23,639 21,080 36.6 10.8 47.4
Notes for exhibits 23 A, B, C:Workers may be employed by more than one employer in a quarter.Includes Private sector, state and local government wage and salary workers.Demographic information obtained from recent Alaska PFD fi les.
ALASKA ECONOMIC TRENDS JUNE 200520
23b Hires, New Hires and SeparationsThird quarter 2004, preliminary
Total Wage New Percent Percent Separation Records Hires Hire New Hires Rehires Rate
Total 372,119 85,758 73,532 19.8 14.3 29.0
Borough/Census AreaAleutians East 2,987 633 418 14.0 34.0 36.9Aleutians West 5,147 1,353 1,099 21.4 18.8 23.8Anchorage 155,769 30,342 27,191 17.5 10.4 22.7Bethel 8,224 2,654 2,030 24.7 23.5 32.4Bristol Bay Borough 2,988 1,638 1,283 42.9 21.7 80.6Denali Borough 3,049 955 864 28.3 9.5 45.9Dillingham 2,665 886 686 25.7 22.6 42.9Fairbanks 42,352 9,519 8,506 20.1 10.6 29.6Haines 1,441 398 203 14.1 49.0 43.9Juneau 19,219 3,484 2,901 15.1 16.7 24.1Kenai 26,041 6,574 5,647 21.7 14.1 36.0Ketchikan 9,552 2,711 2,100 22.0 22.5 33.9Kodiak 7,184 1,808 1,517 21.1 16.1 32.3Lake and Peninsula 1,661 734 544 32.8 25.9 58.4MatSu 22,568 5,227 4,511 20.0 13.7 29.5Nome 5,327 1,673 1,279 24.0 23.6 29.8North Slope Borough 10,849 1,710 1,384 12.8 19.1 22.8Northwest Arctic Borough 3,916 1,055 848 21.7 19.6 40.3POW-Outer Ketchikan 3,316 880 727 21.9 17.4 33.6Sitka 5,615 1,303 1,122 20.0 13.9 30.6Skagway-Angoon 2,672 623 523 19.6 16.1 51.0Southeast Fairbanks 3,397 867 775 22.8 10.6 38.4Valdez-Cordova 7,398 1,925 1,650 22.3 14.3 38.4Wade Hampton 2,848 900 637 22.4 29.2 35.5Wrangell-Petersburg 3,747 1,298 964 25.7 25.7 42.9Yakutat 559 219 169 30.2 22.8 35.8Yukon-Koyukuk 3,475 1,158 922 26.5 20.4 46.6Offshore 1,554 553 441 28.4 20.3 45.4Outside AK 2,486 546 480 19.3 12.1 21.9
Age GroupLess than 16 8,299 3,969 3,650 44.0 8.0 57.6Age 16-18 23,776 9,461 8,419 35.4 11.0 53.4Age 19-24 45,191 13,503 11,577 25.6 14.3 38.2Age 25-29 31,399 6,459 5,439 17.3 15.8 25.9Age 30-39 32,591 5,710 4,885 15.0 14.4 21.5Age 35-39 34,050 5,542 4,591 13.5 17.2 20.4Age 40-44 40,147 5,661 4,667 11.6 17.6 18.1Age 45-49 39,722 5,048 4,054 10.2 19.7 16.6Age 50-54 30,587 3,450 2,682 8.8 22.3 15.9Age 55-59 17,763 2,070 1,615 9.1 22.0 16.5Age 60-64 7,770 885 648 8.3 26.8 18.4Age 65-74 3,541 476 345 9.7 27.5 21.5Age 75 and over 434 83 59 13.6 28.9 28.1Unknown 56,849 23,441 20,901 36.8 10.8 47.5
Source: Alaska Department of Labor & Workforce Development, Research and Analysis Section

ALASKA ECONOMIC TRENDS JUNE 2005 21
23c Hires, New Hires and SeparationsThird quarter 2004, preliminary
Definition of hiring and other job transaction measures:
• Hire: A worker employed by a fi rm in the reference calendar quarter that was not employed by that fi rm in the prior quarter.• New Hire: A worker employed by a fi rm in the reference quarter that was not employed by that fi rm in any of the four previous quarters.• Separation: A worker employed by a fi rm in the reference quarter that was not employed by that same fi rm in the subsequent quarter.
Tracking and tabulating the number of workers that start and leave a job and their duration of employment provides important insight into the health of the economy, the quality of the labor force, and the ability of the economy to respond to change, such as major project development. Labor market analysts describe the study of the longitudinal analysis of employment status as “employment dynamics.”
For several years labor market analysts, the Bureau of Labor Statistics, and the U.S. Census Bureau through its Local Employment Dynamics (LED) have been looking at UI wage records as a new tool to measure hiring activity, job losses, turnover, multiple jobholding and other labor market transactions. Alaska utilizes detailed wage record information, rather than adjusted and summarized data, to measure what is called “Labor Market Dynamics”. Alaska tabulates and summarizes hiring data at the industry, area, and fi rm level by a variety of characteristics including residency, age, and sex. Information is further matched with training program participant records to determine placement rates and program success. This information is critical in identifying unmet training needs, and will become even more important in conjunction with major project development.
Source: Alaska Department of Labor & Workforce Development, Research and Analysis Section
Total Wage New Percent Percent Separation Records Hires Hire New Hires Rehires Rate
Total 372,119 85,758 73,532 19.8 14.3 29.0
Quarterly WageLess Than $2,500 112,323 52,956 46,226 41.2 12.7 52.9$2,500-$5,000 63,132 16,233 14,087 22.3 13.2 34.0$5,000-$7,500 56,332 7,622 6,247 11.1 18.0 20.1$7,500-$10,000 43,430 3,806 2,993 6.9 21.4 13.9$10,000-$12,500 30,275 1,924 1,457 4.8 24.3 11.1$12,500-$15,000 20,347 1,103 874 4.3 20.8 9.3$15,000-$20,000 23,634 1,102 862 3.6 21.8 9.1$20,000 and Higher 22,646 1,012 786 3.5 22.3 9.3
ALASKA ECONOMIC TRENDS JUNE 200522
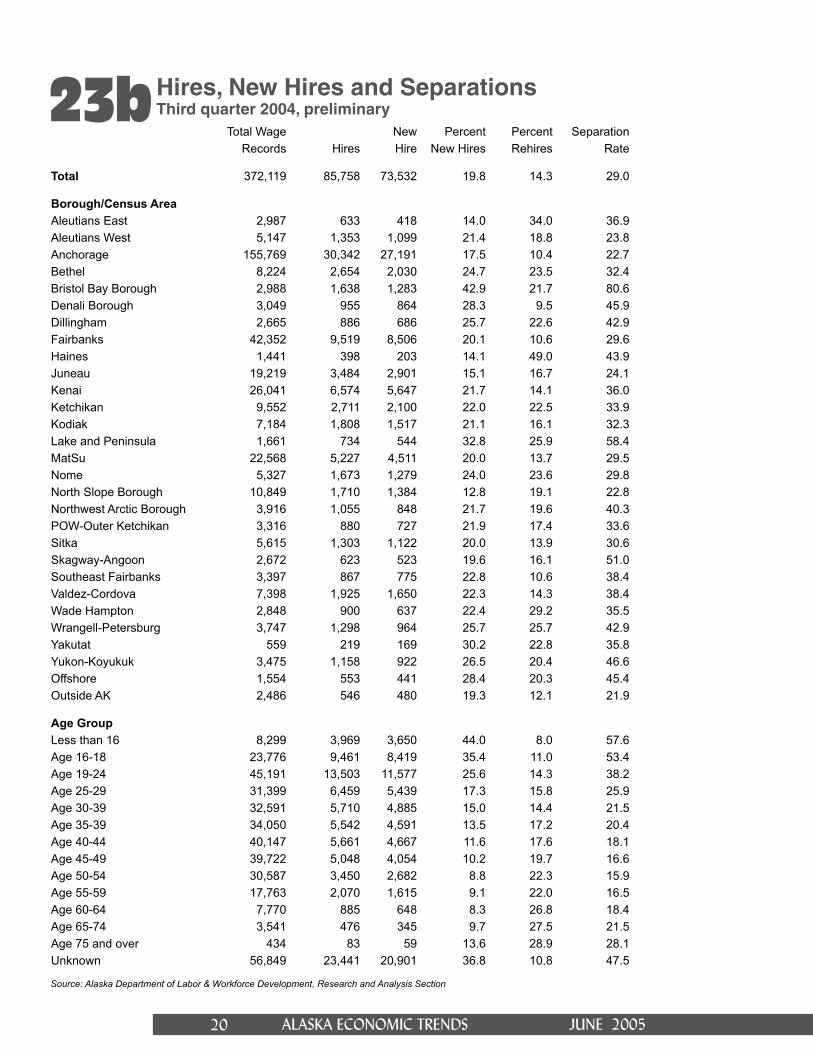
Alaska’s detailed data can also provide a clearer picture of labor supply and demand, determine occupations eligible for resident hire preference, help estimate the number of experienced workers available for major construction projects, identify unmet training needs and identify the current place and potential opportunities for special demographic groups.
With the most recent long term industry forecast anticipating construction on a gas pipeline and other major energy related developments to begin in about fi ve years, Alaska will be called upon to provide experienced workers to the developers of these major projects, or face the prospect of a large number of nonresidents of the state taking jobs that unemployed or underemployed Alaskans could fi ll. Alaska’s unique data sources provide the opportunity to understand where we are now, identify unmet training needs and plan for the labor demands of the next 10 years.
The third quarter of the year always brings on a fl ood of new hires, particularly in the seafood processing and construction industries. The third quarter of 2004 was no exception. Highest new hire rates occurred in those industries. Hiring was slightly higher for men than women in the quarter. Highest hiring rates occurred in the Bristol Bay Borough, again in response to a spike in seafood processing employment. New hire rates were highest for young workers, age 24 and younger. (See Exhibit 23 A, B, C.)
Alaskans for Jobs?
UI wage record analysis can provide a more complete picture of economic conditions in Alaska, especially for special worker groups, and small geographic areas than survey data.

ALASKA ECONOMIC TRENDS JUNE 2005 23
Where do Alaskans Work?
Comparing workforce distribution in Alaska with the rest of the nation
Alaska Employment
Sceneby
Neal Fried Economist
s Alaska’s economy as unique as we think it is? Possibly. One way to fi nd out is to compare the industrial lineup of our workforce with that of the rest
of the country. Over time, Alaska’s workforce has grown to increasingly resemble that of the nation, yet it remains distinct and will probably never fully conform. Given the youth and small size of Alaska’s economy, the expanse of its geography, and its natural resource endowment, the mix of industries where Alaskans work continues to differ signifi cantly in composition from that of our national counterparts. This article refers to industries with an atypical profi le relative to the rest of the country as the outliers. Other industry sectors can be viewed as conventional in their conformance to national employment rates, although in the cases of some one could argue that the industry composition fi ts neither category.
THE OUTLIERS
Oil hardly shows on the national radar screen
Last year the fi rms that identifi ed themselves as oil industry employers employed 2.7 percent of Alaska’s wage and salary workforce. (See Exhibit 1.) Although this sounds relatively small, it is not. On a national basis one tenth of one percent of
Ithe nation’s workforce was employed by the oil industry, meaning the likelihood of working in the oil industry in Alaska was 27 times greater than it was in the nation as a whole. Those are dramatically different odds. Alaska is the second largest oil producer in the nation and is responsible for 17 percent of all domestically produced oil, so the oil industry naturally falls on the list of Alaska’s outliers.
Manufacturing
Although the nation’s manufacturing industry is a mere shadow of its former self, it still draws more than twice as large a share of the workforce in the nation as it does in Alaska. Nearly 11 percent of the U.S. workforce is employed in manufacturing versus four percent in Alaska. And if you dig a bit deeper, the differences are more striking. For example, seventy percent of Alaska’s manufacturing workers are employed in seafood processing versus less than one percent nationally. In both Alaska and the rest of the country, manufacturing has lost employment share in the overall economy. Just ten years ago, fi fteen percent of the nation’s workforce went to work for manufacturers and in Alaska nearly eight percent. Steep losses in timber have been the biggest blow to Alaska’s manufacturing sector, while the nation’s losses have been far broader.
ALASKA ECONOMIC TRENDS JUNE 200524
Transportation—nearly twice as much in Alaska
Nearly seven percent of Alaska’s private sector workforce is tied to transportation versus four percent for the rest of the nation. Geography is almost surely the principal source of this disparity. Sparse populations are separated by great distances, permafrost and other arctic conditions and the road system is limited. What might involve a single delivery vehicle in most of the nation often requires a truck, ship, airplane and possibly a four-wheeler in Alaska. It is almost as if the term inter-modal transportation were coined for Alaska.
Elsewhere Financial Activities play a bigger role
Although Alaska is home to plenty of real estate, title and mortgage offi ces, banks, insurance companies, credit unions, security fi rms and others, their presence in Alaska falls below the national average. One primary difference is that Alaska is not home to any national or regional headquarters of fi nancial and insurance fi rms. In cities such as Seattle, Minneapolis, Houston or Portland, the presence of such headquarters is commonplace.
Professional and Business Services much larger in the rest of the nation
In the portion of this industry group that includes engineering, legal, accounting, waste services, travel agencies, landscaping services and others, the difference between Alaska and the nation is not that great. Disparities arise with business services that cater to larger corporate operations that are largely underrepresented or nonexistent in Alaska’s economy, such as call and telemarketing centers, consulting services, holding companies and computer design fi rms. Alaska’s much smaller economy simply is neither as specialized nor is it home to national or regional corporations.
Government is a major factor in Alaska
In 2004, more than a quarter of working Alaskans worked for some level of government, versus sixteen percent nationally. Just a decade ago it was 31 percent in Alaska. At the federal and state levels, Alaskans are more than twice as likely as their national counterparts to be working for government. Federal government employment rests on a large military presence and its role as the largest landlord in the state, along with its special relationship with Alaska Natives. Not unlike the federal government, state government has a large land and natural resource base to manage. It is also involved in some unusual responsibilities such as the Permanent Fund, the Alaska Railroad, Alaska Housing Finance Corporation and many airports. The state also carries many responsibilities that local governments take care of elsewhere, such as courts and jails. Local government presence in Alaska is just slightly higher than in the nation.
CONVENTIONAL–MORE LIKE THE REST OF AMERICA
Retail—it’s as good in Alaska as elsewhere
Not long ago the typical Alaskan returning from a trip to the outside was loaded down at the airport with every imaginable retail good. Today this is a much rarer sight because Alaskans can buy nearly anything they need either locally or from one of the state’s larger urban centers. Employment numbers confi rm this. Both nationally and in Alaska, a little over eleven percent of the workforce is employed in retail trade. It is Alaska’s largest private sector employer. During the meteoric growth of new retailers in the early 1990s and throughout much of the past 15 years, Alaska has caught up with the rest of the nation. As recently as 1989, who would have thought this possible?

ALASKA ECONOMIC TRENDS JUNE 2005 25
At the wholesale trade level, the story is quite different—Alaska has half as much representation as the rest of the country. It appears Seattle and other places in the country continue to perform this function for Alaska.
Leisure and Hospitality—more beds in Alaska but fewer eateries
Given the size of the state’s visitor sector, it is not surprising that proportionately more jobs in Alaska are dedicated to the accommodations industry—despite the extremely seasonal nature of Alaska’s business. But when it comes to eating and drinking places it appears Alaska has a bit of catching up to do. Given the relatively strong growth in this sector it would not be surprising for this to happen in the not-so-distant future.
Construction rates nearly the same
With all the federal dollars fl owing into Alaska for construction projects and steady employment growth during the past decade, observers of this industry might expect Alaska’s construction workforce to be proportionately larger than the nation’s, but the difference is relatively small. In 2004 it was slightly higher than the national average. Low interest rates and a relatively strong national economy over the past decade have kept the level of construction activity at healthy levels around the country.
Information and Other Services similar
The information industry is largely made up of the media, including television and radio stations, newspapers, cable companies, publishers, movie theaters and the telecommunications sector. The makeup of the other services industry is even more eclectic. It includes businesses that are involved in maintenance and repair of all kinds, funeral homes, laundries, civic, social, and political organizations, and others. For both of these industry categories, Alaska and the rest of the nation appear to consume services in similar proportions.
1Wage and Salary EmploymentComparing Alaska to National, 2004
Sources: Alaska Department of Labor & Workforce Development, Research and Analysis Section; U.S. Bureau of Labor Statistics
Industry Employment Alaska National
Natural Resources & Mining 3.3% 0.5% Logging 0.2% 0.1% Mining 3.2% 0.4% Oil & Gas Extraction 2.7% 0.1%Construction 5.8% 5.3%Manufacturing 4.0% 10.9% Wood Products Manufacturing 0.1% 0.4% Seafood Processing 2.8% 0.0%Trade 13.6% 15.7% Wholesale Trade 2.0% 4.3% Retail Trade 11.5% 11.4%Transporation/Warehouse/Utilities 6.8% 3.7% Air Transportation 2.1% 0.4%Information 2.2% 2.4%Financial Activities 4.8% 6.1%Professional & Business Services 7.7% 12.5%Educational & Health Services 11.4% 12.9% Health Care/Social Assistance 8.2% 10.8%Leisure & Hospitality 9.9% 9.5% Accommodation 2.6% 1.4% Food Servicess & Drinking Places 6.0% 6.7%Other Services 3.8% 4.1%Government 26.7% 16.4% Federal Government 5.6% 2.1% State Government 7.9% 3.8% Local Government 13.2% 10.6%
Employment Grows Again
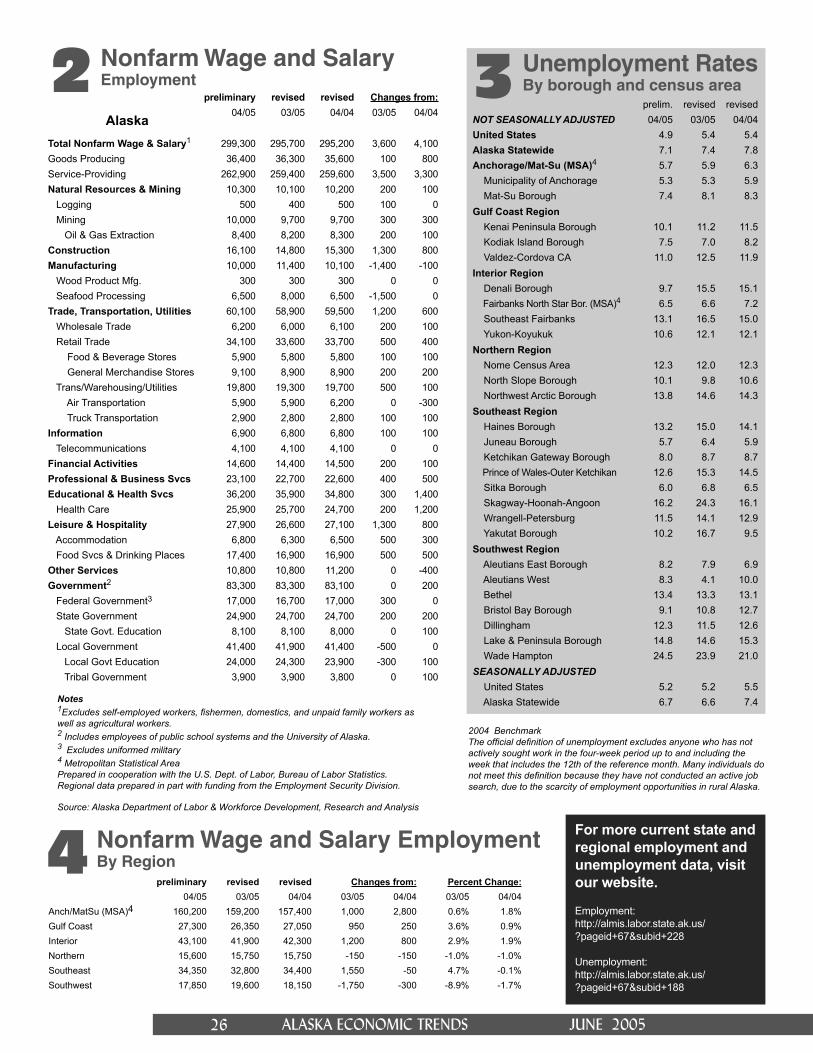
Total nonfarm payroll employment increased by 3,600 in April to 299,300. Payroll employment is up 4,100 over the year. (See exhibit 2.) The state’s unemployment rate continued to decline, falling three tenths of a percentage point to 7.1 percent, seven tenths of a point below 2004 levels. The seasonally adjusted rate was 6.7 percent, just a tenth of a percentage point above last month and the second lowest level since February 2002. (See exhibit 3.)
ALASKA ECONOMIC TRENDS JUNE 200526
2 Nonfarm Wage and SalaryEmployment
preliminary revised revised Changes from:
Alaska 04/05 03/05 04/04 03/05 04/04
Total Nonfarm Wage & Salary1 299,300 295,700 295,200 3,600 4,100Goods Producing 36,400 36,300 35,600 100 800Service-Providing 262,900 259,400 259,600 3,500 3,300Natural Resources & Mining 10,300 10,100 10,200 200 100 Logging 500 400 500 100 0 Mining 10,000 9,700 9,700 300 300 Oil & Gas Extraction 8,400 8,200 8,300 200 100Construction 16,100 14,800 15,300 1,300 800Manufacturing 10,000 11,400 10,100 -1,400 -100 Wood Product Mfg. 300 300 300 0 0 Seafood Processing 6,500 8,000 6,500 -1,500 0Trade, Transportation, Utilities 60,100 58,900 59,500 1,200 600 Wholesale Trade 6,200 6,000 6,100 200 100 Retail Trade 34,100 33,600 33,700 500 400 Food & Beverage Stores 5,900 5,800 5,800 100 100 General Merchandise Stores 9,100 8,900 8,900 200 200 Trans/Warehousing/Utilities 19,800 19,300 19,700 500 100 Air Transportation 5,900 5,900 6,200 0 -300 Truck Transportation 2,900 2,800 2,800 100 100Information 6,900 6,800 6,800 100 100 Telecommunications 4,100 4,100 4,100 0 0Financial Activities 14,600 14,400 14,500 200 100Professional & Business Svcs 23,100 22,700 22,600 400 500Educational & Health Svcs 36,200 35,900 34,800 300 1,400 Health Care 25,900 25,700 24,700 200 1,200Leisure & Hospitality 27,900 26,600 27,100 1,300 800 Accommodation 6,800 6,300 6,500 500 300 Food Svcs & Drinking Places 17,400 16,900 16,900 500 500Other Services 10,800 10,800 11,200 0 -400Government2 83,300 83,300 83,100 0 200 Federal Government3 17,000 16,700 17,000 300 0 State Government 24,900 24,700 24,700 200 200 State Govt. Education 8,100 8,100 8,000 0 100 Local Government 41,400 41,900 41,400 -500 0 Local Govt Education 24,000 24,300 23,900 -300 100 Tribal Government 3,900 3,900 3,800 0 100
3 Unemployment RatesBy borough and census area
prelim. revised revisedNOT SEASONALLY ADJUSTED 04/05 03/05 04/04United States 4.9 5.4 5.4Alaska Statewide 7.1 7.4 7.8Anchorage/Mat-Su (MSA)4 5.7 5.9 6.3 Municipality of Anchorage 5.3 5.3 5.9 Mat-Su Borough 7.4 8.1 8.3Gulf Coast Region Kenai Peninsula Borough 10.1 11.2 11.5 Kodiak Island Borough 7.5 7.0 8.2 Valdez-Cordova CA 11.0 12.5 11.9Interior Region Denali Borough 9.7 15.5 15.1 Fairbanks North Star Bor. (MSA)4 6.5 6.6 7.2 Southeast Fairbanks 13.1 16.5 15.0 Yukon-Koyukuk 10.6 12.1 12.1Northern Region Nome Census Area 12.3 12.0 12.3 North Slope Borough 10.1 9.8 10.6 Northwest Arctic Borough 13.8 14.6 14.3Southeast Region Haines Borough 13.2 15.0 14.1 Juneau Borough 5.7 6.4 5.9 Ketchikan Gateway Borough 8.0 8.7 8.7 Prince of Wales-Outer Ketchikan 12.6 15.3 14.5 Sitka Borough 6.0 6.8 6.5 Skagway-Hoonah-Angoon 16.2 24.3 16.1 Wrangell-Petersburg 11.5 14.1 12.9 Yakutat Borough 10.2 16.7 9.5Southwest Region Aleutians East Borough 8.2 7.9 6.9 Aleutians West 8.3 4.1 10.0 Bethel 13.4 13.3 13.1 Bristol Bay Borough 9.1 10.8 12.7 Dillingham 12.3 11.5 12.6 Lake & Peninsula Borough 14.8 14.6 15.3 Wade Hampton 24.5 23.9 21.0SEASONALLY ADJUSTED United States 5.2 5.2 5.5 Alaska Statewide 6.7 6.6 7.4
4 Nonfarm Wage and Salary EmploymentBy Region
preliminary revised revised Changes from: Percent Change: 04/05 03/05 04/04 03/05 04/04 03/05 04/04
Anch/MatSu (MSA)4 160,200 159,200 157,400 1,000 2,800 0.6% 1.8%Gulf Coast 27,300 26,350 27,050 950 250 3.6% 0.9%Interior 43,100 41,900 42,300 1,200 800 2.9% 1.9%Northern 15,600 15,750 15,750 -150 -150 -1.0% -1.0%Southeast 34,350 32,800 34,400 1,550 -50 4.7% -0.1%Southwest 17,850 19,600 18,150 -1,750 -300 -8.9% -1.7%
For more current state and regional employment and unemployment data, visit our website.
Employment:http://almis.labor.state.ak.us/?pageid+67&subid+228
Unemployment:http://almis.labor.state.ak.us/?pageid+67&subid+188
Notes 1Excludes self-employed workers, fi shermen, domestics, and unpaid family workers as well as agricultural workers.2 Includes employees of public school systems and the University of Alaska. 3 Excludes uniformed military4 Metropolitan Statistical Area Prepared in cooperation with the U.S. Dept. of Labor, Bureau of Labor Statistics.Regional data prepared in part with funding from the Employment Security Division.
2004 BenchmarkThe offi cial defi nition of unemployment excludes anyone who has not actively sought work in the four-week period up to and including the week that includes the 12th of the reference month. Many individuals do not meet this defi nition because they have not conducted an active job search, due to the scarcity of employment opportunities in rural Alaska.
Source: Alaska Department of Labor & Workforce Development, Research and Analysis

ALASKA ECONOMIC TRENDS JUNE 2005 27
Employer ResourcesProfessional staff at Alaska Job Centers provides employer customers many useful services at no cost through the Business/Employer Connection. Services include but are not limited to: recruiting, matching, prescreening and referring of qualifi ed applicants to jobs; free on-line job advertising through Alaska’s Job Bank at www.jobs.state.ak.us; customized interviewing (Many Job Centers have interview rooms for employers to conduct on site recruitments.), Rapid Response (If you are reducing workforce, changing its skill mix or anticipating a closure, Rapid Response services recognizes the needs of your business.), copies of required notices for your company.
The Business Connection web site at www.alaskaemployer.com allows an employer to post job advertisements and has links to the Alaska Employer Handbook, Employee Bonding, Tax Credits, Labor Standards and Safety, On-the-Job Training, Small Business Development, Labor Market Information, Alaska Job Centers, Job Training, Employment Security Tax, Trade Adjustment Assistance and more. Contact your local Alaska Job Center Business Services staff for more in-depth services to match your company’s needs.