august 19, 2014 - sanjac blogs | host for all sanjac...
TRANSCRIPT

August 19, 2014

Welcome New Employees
2
“We are what we repeatedly do. Excellence
then, is not an act, but a habit.” ~ Aristotle

Welcome New Employees
• Stephen Alexander, Electrical Technology Faculty
• Amy Arrowood, Maritime Faculty
• Chris Bahr, Accounting & Business Faculty
• Clay Buckley, Maritime Faculty
• William Buel, Engineering Design Graphics Faculty
3
• Sara Byars, Pharmacy Technology Faculty
• B. Wayne Chrisman, Non-Destructive Testing Faculty
• Ayman Elkass, Mathematics Faculty
• Noel Garcia, Welding Technology Faculty
• Susana Gonzalez, Safety Manager

Welcome New Employees
• Jonathon Green, Construction Management Faculty
• Barbara Guillory, Vocational Nursing Faculty
• Brian Himel, Instrumentation Technology Faculty
• Travis Johnson, Theater Faculty & Film Technical Director
4
• Kristine Kern, EMT Faculty/Clinical Coordinator
• Russell Kunz, Business Management Faculty
• Shelley McCaul, Massage Therapy Faculty
• Kerry Mix, Dean of Business and Technology
• Mary Myers, ADN Faculty

Welcome New Employees
• Jose Nellikappallil, Vocational Nursing Faculty
• Sarah Pinto, Dental Assisting Faculty
• Darryl Reeves, Process Technology Faculty
• Katherine Ryan, English Faculty
5
• Peter Sallay, Mathematics Faculty
• Charles Siegel, Diesel Technology Faculty
• Kelly Simons, Dean of Liberal Arts & Sciences
• David Turnquist, Real Estate Faculty
• Jamie Zahradnik, Dance Faculty

Strategic Leadership Team
• Laurel Williamson, Deputy Chancellor & College President
• Teri Crawford, Vice Chancellor of Marketing, Public Affairs, & Governmental Relations
• Allatia Harris, Vice Chancellor of Strategic Initiatives, Diversity, Workforce, and Community
• Brenda Jones, Provost, South Campus
6
• Ken Lynn, Vice Chancellor of Fiscal Affairs
• Bill Raffetto, Provost, North Campus
• Rob Stanicic, CIO
• Steve Trncak, Vice Chancellor of Human Resources
• Van Wigginton, Provost, Central Campus

All Eyes Are On Houston
7
• Fourth largest city in the U.S.
• Known for Medical Center and NASA
• Second largest Port in terms of international tonnage
• Second largest petrochemical complex in the world

San Jacinto College Is A Major Hub
San Jacinto College is in
the hub of the industries
that drive the Houston
economy:
• Energy
• Manufacturing
• Maritime
• Aerospace (NASA)
• Healthcare
• Transportation
8

Patrick Jankowski
Patrick Jankowski
Regional Economist and Vice President of Research
Greater Houston Partnership
9

Presented by
Patrick Jankowski
Vice President, Research
Houston Outlook

Follow me on Twitter @pnjankowski
Read my blog: www.houston.org/economy/blog
Connect with me: www.linkedin.com/in/pnjankowski

www.houston.org

Gross Regional Product

Fourth Largest U.S. Metro Economy
2012 Gross Domestic Product
Rank Metro Area $ Billions 1 New York 1,358.4
2 Los Angeles 765.8
3 Chicago 571.0
4 Houston 449.4
5 Washington 448.7
6 Dallas-Ft Worth 420.3
7 Philadelphia 364.0
8 San Francisco 360.4
9 Boston 336.2
10 Atlanta 294.6
Source: U.S. Bureau of Economic Analysis

Second Fastest Growing Economy

Employment Picture

Payroll Employment – June ’14
Geography 000s
Houston 2,843.7
Colorado 2,206.0
South Carolina 2,164.9
Louisiana 2,158.8
Alabama 2,046.7
Kentucky 1,965.3
Oregon 1,900.5
Connecticut 1,796.0
Oklahoma 1,721.6
Utah 1,518.8 Not listed: Alaska, Arkansas, Delaware, Hawaii, Idaho, Maine, Mexico, Mississippi, Montana, Nebraska, Nevada, New Hampshire, North Dakota, Rhode Island, South Dakota, Vermont, West Virginia, and Wyoming
Source: U.S. Bureau of Labor Statistics
More jobs than 29 states

Source: Texas Workforce Commission
Employment Growth by Sector

73.0%
77.2%
78.9%
82.2%
93.0%
126.6%
138.1%
160.7%
165.0%
208.6%
246.8%
Philadelphia
Miami
Los Angeles
Chicago
Atlanta
New York
San Francisco
Washington
Boston
Dallas
Houston
Source: U.S. Bureau of Labor Statistics
Seasonally unadjusted
Percent of jobs recovered through June ’14
Houston vs. the Top 10 Metros

2.2
2.3
2.4
2.5
2.6
2.7
2.8
2.9
3.0
Jan '04 Jan '05 Jan '06 Jan '07 Jan '08 Jan '09 Jan '10 Jan '11 Jan '12 Jan '13 Jan '14 Jan '15
Emp
loym
en
t (
Mil
lio
ns)
Source: Texas Workforce Commission
Total Nonfarm Payroll, Houston Metro Area, '04 - '15
Employment

Population

Most Populous U.S. Metros - 2013
Rank Metro Area Population 1 New York 19,949,502
2 Los Angeles 13,131,431
3 Chicago 9,537,289
4 Dallas-Fort Worth 6,810,913
5 Houston 6,313,158
6 Philadelphia 6,034,678
7 Washington 5,949,859
8 Atlanta 5,828,191
9 Miami 5,522,942
10 Boston 4,684,299
Fifth Most Populous Metro
Source: U.S. Census Bureau

137,692
111,749108,112
94,38687,265
68,513 64,909
42,204
23,23015,145
Houston New York Dallas-FortWorth
Los Angeles Washington,DC
Atlanta Miami Boston Chicago Philadelphia
New Residents, 7/12 – 7/13
Fastest Growing Population
Source: U.S. Census Bureau

Year Population Rank
’13 6,313,158 5th
’10 5,920,416 6th
’00 4,693,161 8th
’90 3,750,411 10th
’80 2,905,000 9th
’70 1,985,000 14th
Houston’s Rank Through the Years
Source: U.S. Census Bureau

Demographics

Other12,720 0.2%
Mixed Race180,434
2.9%Asian
418,2376.7%
Black1,037,595
16.5%
Hispanic2,228,634
35.5%
White2,406,315
38.3%
Race and Ethnicity
A Diverse Population
Source: U.S. Census Bureau

Houston is the nation’s future
Source: U.S. Census Bureau

A few words about population growth

A few words about population growth
The region adds 125,000 residents each year.
60,000 via natural increase
i.e., births minus deaths
25,000 via net international in-migration i.e., more people moving in than out
35,000 via net domestic in-migration i.e., more people moving in than out

A few words about population growth
The region adds 125,000 residents each year.
60,000 via natural increase
i.e., births minus deaths
25,000 via net international in-migration i.e., more people moving in than out
35,000 via net domestic in-migration i.e., more people moving in than out

A few words about population growth
The region adds 125,000 residents each year.
60,000 via natural increase
i.e., births minus deaths
25,000 via net international in-migration i.e., more people moving in than out
35,000 via net domestic in-migration i.e., more people moving in than out

A few words about population growth
The region adds 125,000 residents each year.
60,000 via natural increase
i.e., births minus deaths
25,000 via net international in-migration i.e., more people moving in than out
40,000 via net domestic in-migration i.e., more people moving in than out

A few words about population growth
The region adds 125,000 residents each year.
60,000 via natural increase
i.e., births minus deaths
25,000 via net international in-migration i.e., more people moving in than out
40,000 via net domestic in-migration i.e., more people moving in than out

If we built a wall around Houston and never allowed anyone to move here ever again . . .

There will be another 600,000 people living here in the next ten years.

What’s Driving Houston

0
10
20
30
40
50
60
70
80
90
100
110
120
'09 '10 '11 '12 '13 '14 '15
$/B
arre
l
Source: U.S. Energy Information Administration
WTI, Monthly Average Spot Price
Shale Drilling Unprofitable
Shale Drilling Profitable
High Oil Prices
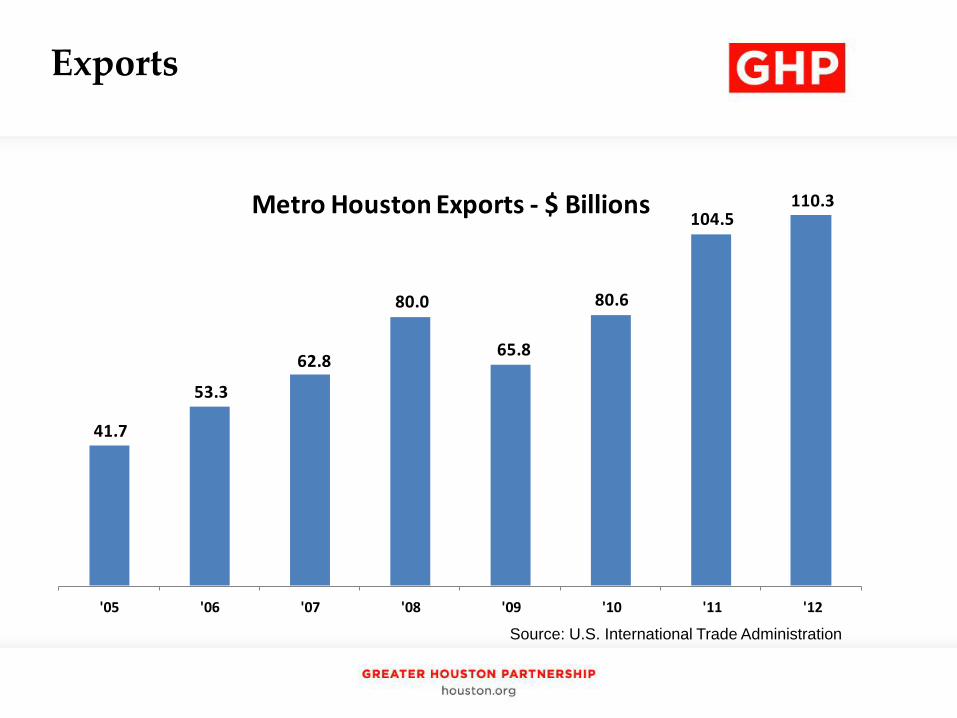
41.7
53.3
62.8
80.0
65.8
80.6
104.5110.3
'05 '06 '07 '08 '09 '10 '11 '12
Metro Houston Exports - $ Billions
Exports
Source: U.S. International Trade Administration

Cost of Living


Threats to Houston’s Growth

• External
–Collapsing oil prices
–Slowing growth overseas
–Moratorium on fracking
–U.S. recession
Possible Threats to Houston Growth

• External
–Collapsing oil prices
–Slowing growth overseas
–Moratorium on fracking
–U.S. recession
Possible Threats to Houston Growth

• Internal
–Transportation gridlock
–High housing costs
–Skilled worker shortages
Possible Threats to Houston Growth

• Internal
–Transportation gridlock
–High housing costs
–Skilled worker shortages
Possible Threats to Houston Growth

• NABE Survey of U.S. Economists
– 22% all respondents report workforce shortages
• Manpower Survey of U.S. Manufacturers
– 600,000 skilled worker shortages in manufacturing alone
Skilled Worker Shortages


Middle Skill Needs in Houston

High – 21%
Low – 38%
Middle – 41%
Distribution of Houston-Area Employment - 2012
Houston Workforce

25,630
17,632
9,8528,866
6,782
2,264 1,864 1,287
Blue Collar Sales & Office
Support
Managerial &
OfficeProfessionals
Health Care Food &
PersonalServices
STEM Community
Services & Arts
Education
Source: Addressing Houston’s Middle Skills Jobs Challenge , April 2014
Projected Average Annual Openings for Middle Sills jobs, ’12 – ’17
Workforce Needs


44.4
57.762.9
67.0
74.7
Less Than High School High School U.S. Average Associates Degree Bachelor's or Higher
Source: U.S. Bureau of Labor Statistics
By Educational Attainment, July ‘14
Labor Force Participation

9.6%
6.5%6.1%
5.3%
3.1%
Less Than High School U.S. Avg High School Associates Degree Bachelor's or Higher
Source: U.S. Bureau of Labor Statistics * U.S. unadjusted rate
By Educational Attainment, July ‘14
Unemployment Rate*

Earnings Potential

Where’s Houston headed?

6.313
2013 - U.S. CensusBureau
TX State DataCenter-Slow Growth
Houston GalvestonArea Council
Ray Perryman Woods & Poole TX State DataCenter-Fast Growth
Millions of Residents
Houston Metro Population Today

6.313
7.464 7.712 7.765 7.8698.334
2013 - U.S. CensusBureau
TX State DataCenter-Slow Growth
Houston GalvestonArea Council
Ray Perryman Woods & Poole TX State DataCenter-Fast Growth
Millions of Residents
Houston Metro Population in 2025

$349.7
$462.0
$573.2
$693.8
$822.4
$954.9
$1,087.5
'10 '15 '20 '25 '30 '35 '40
* '05 Constant Dollars Source: The Perryman Group, Summer 2014
Houston-Sugar Land-Baytown MSA 2010-2040($ Billions*)
Gross Regional Product

In summary . . .

Presented by
Patrick Jankowski
Vice President, Research
Houston Outlook

All Eyes Are On Houston
64

Good Fortune? Good Location?
• San Jacinto College is
well-positioned to
address the growing
employment
opportunities.
• San Jacinto College
stands poised at the
epicenter.
• San Jacinto College is
ready for the next phase
of the challenge. It takes
all of us.
65

Four Strategic Goals
Stay focused on the Strategic Goals:
— Student Success
— P-16 Pipeline
— Workforce and Economic Development
— Our People
Build on our work over the past
years and design the future of
Higher Education locally, in Texas,
and in the country.
66

67
“Education is the most
powerful weapon which you
can use to change the world.”
- Nelson Mandela

68
www.sanjac.edu