audited annual accounts, 2017
TRANSCRIPT
Focal points:
Mr M. Juneja
Assistant Executive Director
Resource Management Department
and Chief Financial Officer
tel.: 066513-2885
Mr N. Nelson
Director
Finance and Treasury Division
tel.: 066513-6410
Ms M. Mananikova
Chief
General Accounts Branch
tel.: 066513-2868
World Food Programme, Via Cesare Giulio Viola, 68/70, 00148 Rome, Italy
Executive Board
Annual session
Rome, 18–22 June 2018
Distribution: General
Date: 11 May 2018
Original: English
Agenda item 6
WFP/EB.A/2018/6-A/1
Resource, financial and budgetary matters
For approval
Executive Board documents are available on WFP’s website (https://executiveboard.wfp.org).
Audited annual accounts, 2017
The Secretariat is pleased to submit the Audited 2017 Financial Statements together with the
Audit Opinion and the Report of the External Auditor. The Financial Statements have been
prepared under International Public Sector Accounting Standards. The External Auditor has
completed the audit in accordance with the International Standards of Auditing, and has provided
an unqualified audit opinion.
This document is submitted to the Board in accordance with General Regulation XIV.6 (b) and
Financial Regulations 13.1 and 14.8, which provide for the submission to the Board of the audited
Financial Statements of WFP and an associated report of the External Auditor. The statements and
the report are presented in one document.
This document includes a Statement on Internal Control which provides specific assurance on the
effectiveness of internal control in WFP.
The Secretariat’s responses to the External Auditor’s recommendations are contained in “Report
on the implementation of the External Auditor’s recommendations” (WFP/EB.A/2018/6-I/1).

WFP/EB.A/2018/6-A/1 2
Draft decision*
The Board:
i) approves the 2017 Annual Financial Statements of WFP, together with the Report of
the External Auditor, pursuant to General Regulations XIV.6 (b);
ii) approves, in accordance with the Financial Regulation 10.6, the replenishment of the
Operational Reserve from the General Fund in the amount of USD 2.2 million, relating
to a drawdown from the Operational Reserve based on a forecast contribution that
did not materialize;
iii) notes the funding from the General Fund of USD 8,442,914 during 2017 for the
write off of receivables and commodities;
iv) notes post-delivery losses of commodities during 2017 forming part of operating
expenses for the same period.
* This is a draft decision. For the final decision adopted by the Board, please refer to the decisions and recommendations
document issued at the end of the session.

WFP/EB.A/2018/6-A/1 3
Page
Presentation 1
Draft decision 2
SECTION I 4
• Executive Director’s Statement 4
• Statement on Internal Control 15
• Statement I 21
• Statement II 22
• Statement III 23
• Statement IV 24
• Statement V 25
• Notes to the Financial Statements at 31 December 2017 26
SECTION II 74
• Audit Opinion 75
• Report of the External Auditor
on the Financial Statements of the World Food Programme
for the year ended 31 December 2017
77
APPENDIX I 95
Acronyms Used in the Document 97

WFP/EB.A/2018/6-A/1 4
Section I
Executive Director’s Statement
Introduction
1. In accordance with Article XIV.6 (b) of the General Regulations and Financial Regulation 13.1,
I have the honour to submit for the approval of the Executive Board (the Board) the financial
statements of the World Food Programme (WFP), prepared in accordance with the
International Public Sector Accounting Standards (IPSAS), for the year ended
31 December 2017. The External Auditor has given his opinion and report on the 2017
financial statements, both of which are also submitted to the Board as required by
Financial Regulation 14.8 and the Annex to the Financial Regulations.
Operational context
2. The World Food Programme was established in 1961 by the United Nations
General Assembly and Food and Agriculture Organization of the United Nations (FAO)
Conference as the United Nations system's food aid organization. WFP’s Strategic Plan for
2017–2021 aligns the organization’s work to the 2030 Agenda’s global call to action, which
prioritizes efforts to end poverty, hunger and inequality, encompassing humanitarian as well
as development efforts. Responding to emergencies and saving lives and livelihoods – either
through direct assistance, or by strengthening country capacities – remains at the heart of
WFP’s operations, especially as humanitarian needs become increasingly complex and
protracted. At the same time, WFP supports countries in ensuring no one is left behind by
continuing to build resilience for food security and nutrition and addressing the growing
challenges posed by climate change and rising inequality. WFP has more than 16,000 staff
worldwide of whom over 88 percent are based in the countries where the agency provides
assistance. WFP is governed by a 36-member Executive Board which provides
intergovernmental support, direction and supervision of WFP’s activities.
3. The financial year 2017 represents the first year of implementation of the 2017–2021
Strategic Plan, which aligns WFP’s work with the 2030 Agenda for Sustainable Development
and the Sustainable Development Goals (SDGs) endorsed by the United Nations in 2015.
The year 2017 was characterized by a continuation of the record number of emergencies
witnessed the previous year, primarily stemming from conflict. Six Level 3 and five Level 2
emergencies were active at year-end, including the four potential famines, which alone left
20 million people in Yemen, Somalia, South Sudan and Nigeria at risk. In 2017, WFP
responded to food security and nutrition needs in the context of conflict, climate change,
corruption and poor governance, along with the breakdown of food systems.
4. In 2017, WFP’s contribution revenue was at a record level of USD 6.0 billion. However, total
requirements were also higher than ever, standing at USD 9.8 billion. As a result of this
USD 3.8 billion funding gap, WFP has had to prioritize geographically, between households,
and across activities. However, WFP was able to achieve significant results. Given the
contributions received, and in partnership with national governments, United Nations
agencies, and over 1,000 non-governmental organization (NGO) partners, WFP was able to
directly reach 88.9 million people in 82 countries. While emergency response remained a
focus in 2017 – with the Level 3 and Level 2 emergencies accounting for 68 percent of the
total final programme of work – WFP’s response in nutrition, work with smallholders,
collaboration with national governments, and role in providing common services, among

WFP/EB.A/2018/6-A/1 5
others were significant. It is also worth noting that WFP continues to be one of the largest
distributors of cash and commodity vouchers in the humanitarian system, disbursing
USD 1.4 billion in 2017, an increase from USD 882 million in 2016.
Integrated Road Map
5. The year 2017 also witnessed the beginning of the roll-out of the Integrated Road Map,
including 12 countries which have begun implementation of their country strategic plans.
6. The four components of the Integrated Road Map (IRM) – the Strategic Plan (2017–2021), the
policy on country strategic plans (CSPs), the Financial Framework Review, and the Corporate
Results Framework – were approved by the Executive Board at the 2016 Second Regular
Session. The Integrated Road Map represents the transformative organizational change
required to meet the demands of the 2030 Agenda and operate within today’s
humanitarian-development-peace nexus. The design and implementation of holistic and
coherent portfolios – in close engagement with partners – will enhance the transparency,
effectiveness, efficiency and sustainability of WFP’s response.
7. The Financial Framework Review delivered the country portfolio budget structure,
mainstreamed resource-based implementation planning, and harmonized financial and
results frameworks. The architecture consolidates all of a country’s operations and
resources1 into a single structure for improved funds management and oversight. Critically,
it creates a clear line of sight from WFP strategic goals through activities to resources for
better performance reporting and accountability.
8. The first two waves of CSPs and interim country strategic plans (ICSPs) with country portfolio
budgets were approved by the Executive Board at the 2017 first regular and annual
sessions.2 Of the fourteen plans approved, twelve country offices3 transitioned to the
country strategic planning framework in 2017. The financial information on the twelve CSPs
pilot countries is presented in the Financial Statement V. Lessons learned over the course
of the year have served to refine the IRM framework and informed the development of
guidance and simplification of processes.
9. On 1 January 2018, an additional 53 country offices transitioned to the new framework. The
65 country offices operating under the IRM framework represent approximately 64 percent
of WFP’s annual 2018 programme of work. All country offices are expected to transition to
the new framework no later than January 2019.
10. The WFP Information Network and Global System (WINGS) accommodates and manages
both the current project system and the new IRM framework until the implementation
phase is complete. Financial Statement V clearly indicates the original and final budget
information and the framework that it applies to.
Financial analysis
Summary
11. WFP’s primary source of revenue is voluntary contributions from donors. WFP recognizes
contribution revenue when confirmed in writing and where the contributions are stipulated
for the current financial year. Contributions stipulated by donors for use in future periods
1 With the exception of service level and third-party agreements that are incidental to WFP’s programme of work and
pass-through activities.
2 Wave 1A CSPs include: Bangladesh, China, Colombia, Ecuador, El Salvador, Indonesia, Lao People’s Democratic Republic
and Zimbabwe. Wave 1B includes CSPs for Cameroon, Lebanon, Mozambique, Namibia and the United Republic
of Tanzania and the ICSP for the Sudan.
3 CSPs for Cameroon and Lebanon went live on 1 January 2018.

WFP/EB.A/2018/6-A/1 6
are recorded as deferred revenue. 2017 was a record year for both contribution revenue
recognized in 2017 and revenue deferred to future financial periods.
12. WFP’s primary expenses are for food commodities distributed and cash-based transfers.
Expenses are recognized when food commodities are delivered or cash-based transfers are
distributed. There is an inherent time lag between the recognition of revenue and the
recognition of expenses. Expenses in any one year may be higher or lower than the revenue
in that year as WFP utilizes or replenishes its fund balances.
13. Based on the nature of WFP’s operations the majority of its assets are current assets
expected to be realized within twelve months after the reporting date. Current assets are
expected to be significantly higher than current liabilities due to time lag between revenue
and expenses recognition as discussed above.
14. Finally, total fund balances and reserves comprise fund balances accumulated due to excess
of revenue over expenses (including gains and losses recognized directly in net assets) in
prior financial periods, and reserves established by the Board for funding specific activities
under specific circumstances.
Financial performance
15. Total revenue in 2017 was USD 6,430.9 million, an increase of USD 522 million or 9 percent
from the revenue of USD 5,908.9 million in 2016.
16. This increase in revenue in 2017 stems primarily from increased monetary contributions
received from major donors for the programmatic response to the Syrian Arab Republic and
Syrian refugees emergency and to potential famines in four countries (South Sudan, Nigeria,
Somalia, and Yemen).
17. The elements of other revenue amounting to USD 431.0 million in 2017 comprised:
a. currency exchange differences – USD 231.0 million gain;
b. return on investments – USD 51.0 million gain; and
c. other revenue, generated from provision of goods and services – USD 149.0 million.
4 111
551
103
4 7655 300
471138
5 9095 615
385 431
6 431
0
1 000
2 000
3 000
4 000
5 000
6 000
7 000
Monetary contributions In-kind contributions Other revenue Total
Figure 1. Revenue(in USD million)
2015 2016 2017

WFP/EB.A/2018/6-A/1 7
18. In 2017, WFP expenses were USD 6,219.2 million, an increase of USD 851.7 million or
16 percent from 2016.
19. Cash-based transfers distributed expense increased to USD 1,446.1 million from
USD 882.3 million in 2016. This 64 percent increase is largely due to the increase of the
cash-based transfers distributed in the response to the Syrian Arabic Republic and Syrian
refugees emergency and Somalia crisis.
20. Food commodities distributed in 2017 increased to 3.9 million mt from the 2016 level of
3.7 million mt with the corresponding value of USD 2,197.5 million, a 7 percent increase from
the previous year value of USD 2,051.1 million. 61 percent of the food commodities
distributed in tonnage and 57 percent in value are attributable to WFP’s large-scale
operations in the Syrian Arabic Republic and Syrian refugees emergency, Yemen, Ethiopia,
South Sudan, Malawi, Nigeria and Uganda.
21. Staff costs increased by 7 percent to USD 884.0 million. The increase in staff costs is mainly
due to an increase in the number of international professionals, national staff, and
consultants.
22. Contracted and other services increased to USD 759.5 million from USD 689.5 million in
2016, a 10 percent increase mainly due to the increase in expenses related to the services
rendered by cooperating partners in response to the Syrian Arabic Republic and Syrian
refugees emergency as well as due to South Sudan and Nigeria operations.
23. Other expenses category in Figure 2 above is composed of:
a. Supplies, consumables and other running costs – USD 174.4 million;
b. Depreciation and amortization costs – USD 47.7 million;
c. Other expenses – USD 43.7 million; and
d. Finance costs – USD 1.9 million.
Surplus
24. In 2017, the surplus of revenue over expenses was USD 211.7 million compared to a surplus
of USD 541.4 million in 2016. The decrease of USD 329.7 million reflects the timing of
revenue and expense recognition and the increase in spending of USD 851.7 million from
USD 5,367.5 million in 2016 to USD 6,219.2 million in 2017. This increase mainly reflects
679
1 784
636 797 645
275
4 816
882
2 051
641 827 690
277
5 368
1 446
2 198
664 884 760
268
6 219
0
1 000
2 000
3 000
4 000
5 000
6 000
7 000
Cash-based
transfers
distributed
Food
commodities
distributed
Distribution
and related
services
Staff costs Contracted and
other services
Other expenses Total
Figure 2. Expenses(in USD million)
2015 2016 2017

WFP/EB.A/2018/6-A/1 8
increased distribution to WFP beneficiaries (an increase in both cash-based transfers (CBTs)
and commodities distributed).
Financial position
TABLE 1. SUMMARY OF FINANCIAL POSITION AT 31 DECEMBER 2017
(USD million)
2017 2016
(restated)
Current assets 6 840.4 5 481.3
Non-current assets 1 139.1 1 140.7
Total assets 7 979.5 6 622.0
Current liabilities 2 253.8 1 065.2
Non-current liabilities 1 291.8 1 272.2
Total liabilities 3 545.6 2 337.4
Net assets 4 433.9 4 284.6
Fund balances 4 053.5 3 954.9
Reserves 380.4 329.7
Total fund balances and reserves 4 433.9 4 284.6
Total assets
25. Total assets increased in 2017 by USD 1,357.5 million or 20 percent from USD 6,622.0 million
at the end of 2016 to USD 7,979.5 million at the end of 2017. The increase in total assets is
mainly due to an increase in the current assets, namely an increase in cash, cash equivalents,
short-term investments and in current portion of contributions receivable.
26. Total cash, cash equivalents, and short-term investments of USD 2,475.2 million increased
by USD 521.1 million or 27 percent from USD 1,954.1 million in 2016. The increase is mainly
due to a 63 percent increase in cash and cash equivalents because of the increased donor
contributions. WFP’s cash, cash equivalents and short-term investments included in the
Programme Category Funds segment of USD 1,573.4 million cover three months of
operational activity (four months in 2016).
27. Total contributions receivable of USD 3,902.0 million increased by USD 656.7 million or
20 percent from USD 3,245.3 million in 2016. The increase is in the current portion of the
contributions receivable and is due to a significant increase in donor contributions in 2017.
28. The value of WFP’s food commodity inventory at the end of 2017 of USD 689.6 million
increased by USD 62.8 million or 10 percent from the 2016 value mainly due to an increase
in stocks held of 0.1 million mt or 10 percent from the 2016 stocks (1.0 million mt in 2016
compared to 1.1 million mt in 2017). Using the historical average of commodities
distributed, the 1.1 million mt of food commodity in inventory represents three months of
operational activity.
Total liabilities
29. Total liabilities increased by USD 1,208.2 million or 52 percent from USD 2,337.4 million in
2016 to USD 3,545.6 million in 2017, primarily due to the increase in deferred revenue of
USD 942.0 million and employee benefits liabilities of USD 175.5 million.

WFP/EB.A/2018/6-A/1 9
30. Deferred revenue reflects contributions revenue stipulated for future years. Deferred
revenue in 2017 increased by USD 942.0 million or 96 percent from USD 986.2 million at the
end of 2016 to USD 1,928.2 million at the end of 2017. Of the total deferred revenue of
USD 1,928.2 million, USD 1,550.0 million is stipulated for use in 2018, and the remaining
balance of USD 378.2 million is stipulated for use from 2019 and beyond.
Net assets
31. Net assets represent the difference between WFP’s total assets and total liabilities. At
31 December 2017, WFP’s net assets totalled USD 4,433.9 million, confirming a healthy
overall financial position. Of these net assets (Fund Balances and Reserves),
USD 3,692.8 million relate to the Programme’s projects, representing approximately
five months of operational activity (same as in 2016). The balance pertains to the
General Fund, Special Accounts, Reserves, Bilateral Operations and Trust Funds.
Operational fund balances relate to donor support primarily directed to specific
programmes in different stages of implementation, with expenses and related reduction in
fund balance only recognized when food commodities are delivered and cash-based
transfers are distributed. The increase in Reserves in 2017 was due to a USD 44.4 million
increase in the Programme Support and Administrative (PSA) Equalization Account, and a
USD 8.5 million increase in the Immediate Response Account partly offset by a
USD 2.2 million decrease in the Operational Reserve.
Budgetary analysis
Basis of the budget
32. The budget figures for direct project costs, CSP pilot costs and indirect costs (PSA budget)
disclosed in Financial Statement V – Statement of Comparison of Budget and Actual
Amounts are derived from the Programme of Work in the Management Plan (2017–2019)
and are broadly needs-based. Resources are made available for direct project costs when
contributions are confirmed by donors for approved projects and through advances from
4 665
2 244
479
1 030
33514
8 767
5 280
2 305
486916
454 33523
9 799
0
2 000
4 000
6 000
8 000
10 000
12 000
Food and
related DOC
CBT and
related DOC
Capacity
augmentation
Direct Support
Costs (DSC)
CSP Pilots
Costs
Regular PSA Critical
corporate
initiatives
TOTAL
Figure 3. Budget for the period ended 31 December 2017
(in USD million)
Original Budget Final Budget

WFP/EB.A/2018/6-A/1 10
the internal project lending facility. Resources are made available to meet indirect costs
through the approval of the Management Plan.
33. The 2017–2019 Management Plan, which was approved by the Board in November 2016,
presented the 2017 Programme of Work amounting to USD 8,766.8 million. This is disclosed
in Financial Statement V as “Original budget”. By the end of 2017, the final Programme of
Work included the unforeseen needs. The final 2017 Programme of Work was 12 percent
higher at USD 9,799.2 million, an increase of USD 1,032.4 million. This is disclosed in
Financial Statement V as “Final budget”.
34. The increase of USD 1,032.4 million is primarily the result of unforeseen requirements in
Nigeria and Somalia (USD 616 million, due to the conflict related emergencies that affected
both countries), followed by an increase in Uganda requirements (USD 123 million to cater
for the growing South Sudanese refugee response) and an increase in requirements for the
emergencies in South Sudan and Yemen (for the total of USD 183 million).
35. Additionally, L3 emergencies declared in 2017, as in the case for Bangladesh and the
Democratic Republic of the Congo (DRC), have also contributed to the increase in
requirements, where in Bangladesh, requirements increased by 57 percent to
USD 56 million – and in DRC by 18 percent to USD 37 million.
36. Final requirements have seen some significant decreases as well, as in the example for
Ethiopia, which showed the highest decrease at USD 239 million. This was primarily because
of increased involvement on the part of the Government, which allocated more resources
to areas where WFP operates, therefore reducing WFP’s coverage.
Utilization of the budget
37. WFP can use resources when contributions are confirmed to approved projects or CSPs, or
funds are provided through advance financing activities. Purchase of commodities from the
Global Commodity Management Facility can be made by projects using both sources.
Budgetary utilization within the year is constrained by the amount, timing and predictability
of contributions, as well as inherent operational constraints. In 2017, WFP’s final direct
5 280
2 305
486916
454 33523
9 799
2 880
1 474
311601
154334
16
5 770
0
2 000
4 000
6 000
8 000
10 000
12 000
Food and
related DOC
CBT and
related DOC
Capacity
augmentation
Direct Support
Costs (DSC)
CSP Pilots
Costs
Regular PSA Critical
corporate
initiatives
TOTAL
Figure 4. Utilization of the Final Budget for the period ended
31 December 2017
(in USD million)
Final Budget Utilization of Final Budget
Direct support
costs (DSC)

WFP/EB.A/2018/6-A/1 11
project and CSP pilots’ costs budget was USD 9,440.4 million. Utilization of the final budget
in 2017 was 59 percent (same as in 2016).
38. This utilization rate was reflected across the various budget components utilization rates as
outlined below.
➢ food and related direct operational costs (DOC) at 55 percent;
➢ cash-based transfers and related DOC at 64 percent;
➢ capacity augmentation at 64 percent;
➢ direct support costs (DSC) at 66 percent;
➢ country strategic plan (CSP) pilots’ costs at 34 percent.
39. Following the approval of the Strategic Plan (2017–2021), the first CSPs under the country
portfolio budgets were approved by the Board and piloted by WFP in 2017. The final budget
and actual figures for CSP pilots’ costs are disclosed in Financial Statement V – Statement of
Comparison of Budget and Actual Amounts by strategic results (SRs).
40. Cash-based transfers represented 26 percent of the original budget and 24 percent of the
final budget, while food transfers represented 53 percent of the original budget and
54 percent of the final budget. The largest CBT budget is attributable to the programmatic
response for the Syrian Arab Republic and Syrian refugees, mainly in Turkey and Lebanon,
while the largest operations of food were seen in Yemen and the Syrian Arab Republic.
41. The final PSA budget consisted of USD 335.4 million for regular expenditure and
USD 23.4 million for critical corporate initiatives. Of the final approved regular PSA budget
of USD 334.1 million (99.6 percent) was utilized by 31 December 2017. Of the final approved
critical corporate initiatives totalling USD 23.4 million, USD 15.7 million (67 percent) was
utilized at 31 December 2017.
Prioritized plan and actual utilization of final budget
2 806
1 269
339619
335
14
5 382
2 880
1 474
311601
154334
16
5 770
0
1 000
2 000
3 000
4 000
5 000
6 000
7 000
Food and
related DOC
CBT and
related DOC
Capacity
augmentation
Direct Support
Costs (DSC)
CSP Pilots
Costs
Regular PSA Critical
corporate
initiatives
TOTAL
Figure 5. Comparison of Prioritized Plan and Actuals
for the period ended 31 December 2017
(in USD million)
Prioritized Plan Utilization of Final Budget
Direct support
costs (DSC)

WFP/EB.A/2018/6-A/1 12
42. The actual costs are greater than the Prioritized Plan due to higher than expected
contributions revenue, driven by the increase in operational requirements to cope with
increased needs for relief operations in response to the Syrian refugee crisis, contributing
to the increase in CBTs and in countries like Yemen and the Syrian Arab Republic,
contributing to the increase in food transfers.
Enhancing transparency and accountability
43. WFP prepares financial statements in accordance with IPSAS to ensure timely, relevant and
useful financial reporting, thereby improving transparency and accountability in the
management of resources.
44. To ensure continued compliance with IPSAS, WFP assesses the impact and applies new
IPSAS standards and changes accounting policies when changes in IPSAS require. WFP
continues to work closely with other United Nations system organizations, through the
High-Level Committee on Management (HLCM) task force on IPSAS. This task force provides
a platform for discussion of IPSAS issues, with a view to achieving consistency in the
application of IPSAS developments and enhancing comparability of financial reporting. In
2017 the IPSAS Task Force meeting was hosted by WFP in its headquarters, Rome.
45. The Executive Management Group (EMG) meet regularly to discuss policy and strategic
issues, including review of selected IPSAS-based financial highlights, which cover key areas
of WFP’s financial performance and financial position.
46. WFP has implemented Committee of Sponsoring Organizations of the
Treadway Commission (COSO)-based internal control and enterprise risk management
(ERM) frameworks. The 2015 ERM policy and the 2016 Risk Appetite Statement set out the
vision for how risks are viewed within the organization and incorporate themes and issues
that emerge from operational risk analyses as well as quarterly Executive Management
Group meetings. All WFP offices continue to manage their respective risk registers,
escalating risks as required in line with existing managerial structures. Corporate risks
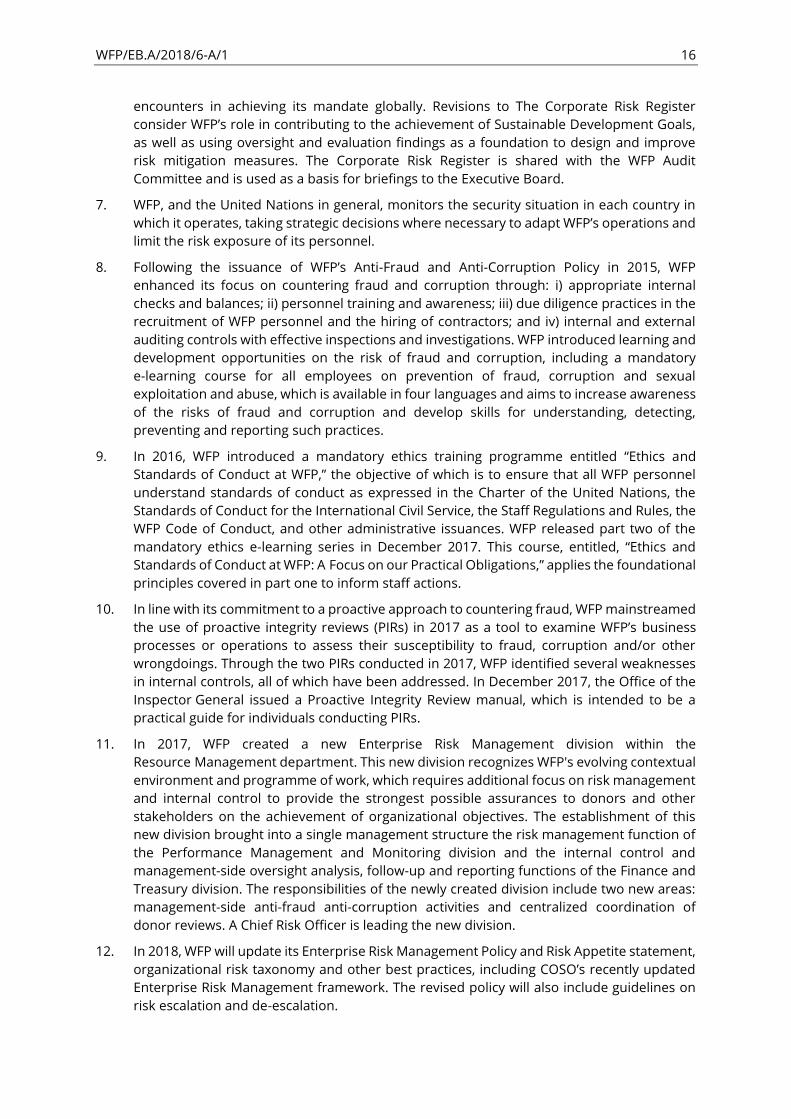
reflect the challenges that WFP encounters in achieving its mandate globally. With the
implementation of the Strategic Plan 2017–2021 and accompanying polices rolled out
through the Integrated Road Map, WFP is also strengthening its risk management culture
and practice. Revisions to the Corporate Risk Register, in order to assess challenges in
meeting the Strategic Goals set out in the Strategic Plan 2017–2021, make greater use of
day-to-day management processes as well as use oversight and evaluation findings as a
foundation to designing and improving risk mitigation measures.
47. The Assistant Executive Director, Resource Management and Chief Financial Officer a) serves
as steward for the internal control framework and monitors its implementation through
annual assurance statements from global management and oversight recommendation
follow-up, analysis and reporting; and b) ensures that a clear action plan exists for
addressing internal control issues raised in the annual Statement on Internal Control. This
Statement on Internal Control is issued with the annual financial statements and provides
specific assurance on the effectiveness of internal control.
48. As an important component of internal control, the Secretariat ensures effective follow-up
of the recommendations of the independent and external oversight bodies and reports
regularly to the EMG and the WFP Audit Committee on priority themes from oversight
findings, with emphasis on outstanding recommendations and action to address high-risk
recommendations.
49. WFP has adopted clear policies related to the public disclosure of the results of independent
evaluations, audits and inspections. Evaluation reports and the accompanying management
responses dating back to 2000 can be found on WFP’s public website. Since late 2012

WFP/EB.A/2018/6-A/1 13
internal audit and inspection reports are posted on WFP’s public website within thirty days
of their publication. In addition, annual updates to the Executive Board on Joint Inspection
Unit recommendations are available on the Executive Board’s public website.
Financial risk management
50. WFP’s activities expose it to a variety of financial risks including the effects of changes in
debt and equity market prices, foreign currency exchange rates, interest rates, and defaults
by debtors in meeting its obligations. WFP’s financial risk management policies focus on the
unpredictability of financial markets and seek to minimize potential adverse effects on the
financial performance of WFP.
51. Financial risk management is carried out by a central treasury function using guidelines set
out by the Executive Director who is advised by the WFP Investment Committee. Policies
cover foreign exchange, interest rate and credit risk, the use of derivative financial
instruments, and investing of excess liquidity.
52. In 2017, WFP continued its efforts to minimize and mitigate the potential financial risks
surrounding CBT operations. Building on the CBT related financial management, accounting
and procedural guidelines released in 2016 – which promoted and reinforced compliance
with the corporate Internal Control Framework, in 2017 WFP took an interdisciplinary
approach to enhance or streamline those existing CBT procedures, tools and key
assessments. To further heighten the organization’s ability to identify and manage the
potential financial risks surrounding CBT operations, 2017 also saw the launch of the Global
CBT Risk and Internal Control review. With the objective of performing an in-depth
assessment of existing as well as emerging CBT risks, controls and risk mitigating activities,
the review gathered its first set of risk relevant data in 2017. Moving forward, this initial set
of data, coupled with the information collected throughout 2018 will be aggregated and
serve as the foundation for further updates of CBT-relevant governance practices, policy
and guidelines as well as dissemination of global lessons learned and best practices, guiding
the organization towards a risk ready CBT future.
53. WFP’s employee benefit liabilities were USD 878.1 million at 31 December 2017. WFP sets
aside assets for the long-term employee benefit liabilities in the form of cash and long-term
investments (bonds and equities). In accordance with the current funding plan approved by
the Board in 2010, an incremental annual funding of USD 7.5 million is included in the
standard staff cost over a 15-year period starting in 2011, with a view towards achieving a
full funded status of the long-term employee benefit liabilities in 2025. WFP determines the
funding level based on the long-term employee benefit liabilities. As at 31 December 2017,
the level of assets set aside (USD 573.1 million) for the funding of the long-term employee
benefit liabilities (USD 841.2 million) represents a 68 percent funding level. This is an
increase from the 66 percent funding level in 2016 and is primarily due to an increase in
return on assets, which rose to 18.2 percent for the year on the back of a significant rise in
equity markets and resilient fixed income markets in 2017, partially offset by the growth in
the employee benefit liabilities. Based on the actuarial valuation results of this year, it is
projected that the fully funded status will be achieved in 2027. In early 2018, the
asset-liability study undertaken by the Secretariat will be finalized, and the outcomes of the
study will be used to evaluate the appropriateness of the current funding policy.
54. At the United Nations system level, the issue of the significant level of after-service health
insurance (ASHI) liabilities and the related funding was recognized. Pursuant to the
General Assembly (GA) resolution 68/244, in which the GA requested the Secretary-General
(SG) to undertake a survey of current healthcare plans for active and retired staff in the
United Nations system, the SG submitted a report on managing after-service health
insurance liabilities to the GA at its seventieth session (A/70/590). The report was largely

WFP/EB.A/2018/6-A/1 14
informed by the work of a United Nations inter-agency Working Group on ASHI, of which
WFP is an active member, and it explored options to increase efficiency of the health
insurance plans and contain the related costs. During the period since the its seventieth
session of the GA, the Working Group prioritized the recommendations endorsed by the GA
in relation to which its work stands to produce the greatest impact on ASHI liabilities in the
short term. Updates on previous recommendations and additional recommendations of the
Working Group were reviewed by the Advisory Committee on Administrative and Budgetary
Questions, requesting the SG to maintain the Working Group and report its finding to the
GA during its seventy-third session.
Sustainability
55. WFP’s financial statements are prepared on a going-concern basis. In making this
determination, WFP has considered the consequences of any potential significant reduction
in contributions and whether this would lead to a consequential reduction in the scale of
operations and number of people assisted. Having considered WFP’s projected activities and
the corresponding risks, I am confident that WFP has adequate resources to continue to
operate in the medium term.
56. My statement on sustainability is supported by: i) the requirements I put forward in the WFP
Management Plan (2018–2020); ii) the Strategic Plan (2017–2021) approved by the
Executive Board in 2016; iii) the net assets held at the end of the period and contributions
received in 2017; iv) the projected contributions levels for the year 2018; and v) the trend in
donor support that has been sustaining WFP’s mandate since its inception in 1963.
Administrative matters
57. WFP’s principal place of business as well as the names and addresses of its General Counsel,
actuaries, principal bankers and External Auditor are shown in Annex I to this document.
Responsibility
58. As required under Financial Regulation 13.1, I am pleased to submit the following financial
statements, which have been prepared under IPSAS. I certify that to the best of my
knowledge and information, all transactions during the period have been properly entered
in the accounting records and that these transactions together with the following financial
statements and notes, details of which form part of this document, fairly present the
financial position of WFP at 31 December 2017.
Statement I Statement of Financial Position at 31 December 2017
Statement II Statement of Financial Performance for the year ended 31 December 2017
Statement III Statement of Changes in Net Assets for the year ended 31 December 2017
Statement IV Statement of Cash Flow for the year ended 31 December 2017
Statement V Statement of Comparison of Budget and Actual amounts for the year ended
31 December 2017
Notes to the Financial Statements
David M. Beasley
Executive Director Rome, 22 March 2018

WFP/EB.A/2018/6-A/1 15
Statement on Internal Control
Scope of responsibility and purpose of internal control
1. The Executive Director of the World Food Programme is accountable to the Executive Board
for the administration of WFP and for the implementation of WFP programmes, projects and
other activities. Under Financial Regulation 12.1, the Executive Director is required to
establish internal controls, including internal audit and investigation, to ensure the effective
and efficient use of the resources of WFP and the safeguarding of its assets.
2. The system of internal control is designed to reduce and manage – rather than
eliminate - the risk of failure to achieve WFP’s aims and objectives. It can provide reasonable
but not absolute assurance that WFP’s objectives will be achieved. It is based on a
continuous process designed to identify the principal risks to the achievement of objectives,
to evaluate the nature and extent of those risks and to manage them effectively, efficiently
and economically.
WFP’s operating environment
3. The humanitarian imperative obliges WFP to respond when needed. This principle exposes
WFP to operating environments and situations with a high level of inherent risk, including in
terms of the security of its employees and beneficiaries, and, in some cases, the ability to
maintain the highest standards of internal control.
4. Internal control is an important role of management and an integral part of the overall
process of managing operations. It is the responsibility of WFP management at all levels to:
➢ establish a control environment and culture that promotes effective internal control,
prevents and deters abusive conduct, and sexual exploitation and abuse;
➢ identify and assess risks that may affect the achievement of objectives, including the
risk of fraud and corruption;
➢ specify and propose policies, plans, operating standards, procedures, systems and
other control activities to minimize, mitigate and/or limit the risks associated with
exposures identified;
➢ ensure an effective flow of information and communication so that all WFP personnel
have the information they need to fulfil their responsibilities; and
➢ monitor the effectiveness of internal control.
The internal control framework and enterprise risk management
5. In 2015, WFP revised its internal control framework to reflect guidance issued by the
Committee of Sponsoring Organizations of the Treadway Commission (COSO) in 2013. The
then Executive Director issued a circular on the internal control framework in four
languages. The revised framework is supported by guidance and tools to help managers
assess the effectiveness of internal control in their offices.
6. Following the 2015 approval of the revised Enterprise Risk Management Policy by the
Executive Board, WFP updated its Risk Appetite Statement in 2016, setting out the vision for
how risks are viewed within the organization and incorporating themes and issues that
emerged from operational risk analyses as well as quarterly Executive Management Group
meetings. WFP offices manage their respective risk registers, escalating risks as required in
line with existing managerial structures. Corporate risks reflect the challenges that WFP
WFP/EB.A/2018/6-A/1 16
encounters in achieving its mandate globally. Revisions to The Corporate Risk Register
consider WFP’s role in contributing to the achievement of Sustainable Development Goals,
as well as using oversight and evaluation findings as a foundation to design and improve
risk mitigation measures. The Corporate Risk Register is shared with the WFP Audit
Committee and is used as a basis for briefings to the Executive Board.
7. WFP, and the United Nations in general, monitors the security situation in each country in
which it operates, taking strategic decisions where necessary to adapt WFP’s operations and
limit the risk exposure of its personnel.
8. Following the issuance of WFP’s Anti-Fraud and Anti-Corruption Policy in 2015, WFP
enhanced its focus on countering fraud and corruption through: i) appropriate internal
checks and balances; ii) personnel training and awareness; iii) due diligence practices in the
recruitment of WFP personnel and the hiring of contractors; and iv) internal and external
auditing controls with effective inspections and investigations. WFP introduced learning and
development opportunities on the risk of fraud and corruption, including a mandatory
e-learning course for all employees on prevention of fraud, corruption and sexual
exploitation and abuse, which is available in four languages and aims to increase awareness
of the risks of fraud and corruption and develop skills for understanding, detecting,
preventing and reporting such practices.
9. In 2016, WFP introduced a mandatory ethics training programme entitled “Ethics and
Standards of Conduct at WFP,” the objective of which is to ensure that all WFP personnel
understand standards of conduct as expressed in the Charter of the United Nations, the
Standards of Conduct for the International Civil Service, the Staff Regulations and Rules, the
WFP Code of Conduct, and other administrative issuances. WFP released part two of the
mandatory ethics e-learning series in December 2017. This course, entitled, “Ethics and
Standards of Conduct at WFP: A Focus on our Practical Obligations,” applies the foundational
principles covered in part one to inform staff actions.
10. In line with its commitment to a proactive approach to countering fraud, WFP mainstreamed
the use of proactive integrity reviews (PIRs) in 2017 as a tool to examine WFP’s business
processes or operations to assess their susceptibility to fraud, corruption and/or other
wrongdoings. Through the two PIRs conducted in 2017, WFP identified several weaknesses
in internal controls, all of which have been addressed. In December 2017, the Office of the
Inspector General issued a Proactive Integrity Review manual, which is intended to be a
practical guide for individuals conducting PIRs.
11. In 2017, WFP created a new Enterprise Risk Management division within the
Resource Management department. This new division recognizes WFP's evolving contextual
environment and programme of work, which requires additional focus on risk management
and internal control to provide the strongest possible assurances to donors and other
stakeholders on the achievement of organizational objectives. The establishment of this
new division brought into a single management structure the risk management function of
the Performance Management and Monitoring division and the internal control and
management-side oversight analysis, follow-up and reporting functions of the Finance and
Treasury division. The responsibilities of the newly created division include two new areas:
management-side anti-fraud anti-corruption activities and centralized coordination of
donor reviews. A Chief Risk Officer is leading the new division.
12. In 2018, WFP will update its Enterprise Risk Management Policy and Risk Appetite statement,
organizational risk taxonomy and other best practices, including COSO’s recently updated
Enterprise Risk Management framework. The revised policy will also include guidelines on
risk escalation and de-escalation.

WFP/EB.A/2018/6-A/1 17
13. The newly established management-side anti-fraud anti-corruption function complements
the Inspector General’s independent anti-fraud anti-corruption activities. Following the
completion of a comprehensive fraud risk assessment by the Office of the Inspector General
in 2018, WFP will prepare an action plan to further integrate anti-fraud controls into
organizational frameworks and operational management.
Review of the effectiveness of internal control
14. The review of the effectiveness of WFP’s internal controls is informed by managers within
WFP who have the responsibility for the identification and maintenance of the internal
controls in their areas of responsibility. Explicit assurance is derived from:
a) Statements of assurance on the effectiveness of internal control signed by
135 senior WFP managers including the Deputy Executive Director; Assistant Executive
Directors; Chief of Staff; regional directors; country directors; directors of WFP Offices;
and directors of headquarters divisions. This is a 100 percent compliance rate.
Submissions were subject to at least one higher level of review. As in previous years,
managers were required to provide comments in support of “yes” as well as “no”
answers to facilitate a more refined global analysis of responses. The 2017 assurance
statement included a new question on the WFP Security Management Policy and
Framework of Accountability, as well as updated questions on ethics, staff handovers,
annual performance planning, risk assessment, change management and internal
communication.
b) The 2017 Assurance Opinion from the Office of the Inspector General, is based
primarily on the results of their internal audits, advisory assurance assignments and
follow-up reviews. These results did not disclose any significant weaknesses in the
internal control, governance and risk management processes in place across WFP that
would seriously compromise the achievement of WFP’s objectives.
c) Other evidence includes oversight recommendations and agreed actions from
Internal Audit, External Audit and the United Nations Joint Inspection Unit; corporate
risk register and global risk profile reports; and meetings of the Audit Committee,
which advises on the effectiveness of WFP’s internal control systems, including risk
management and internal governance practices.
Significant risk and internal control matters
Issues arising in 2017
15. Two significant risk and internal control issues arose during 2017:
a) Beneficiary management. Notwithstanding improvements to the management of
beneficiary data in the SCOPE beneficiary information management system during
2017, it became evident following the November 2017 internal audits of beneficiary
management and SCOPE general and application controls that major improvements
are required in beneficiary management controls, while minor improvements are
required in SCOPE controls. This priority oversight area is now receiving Executive
Management Group attention. The Office of Inspector General’s beneficiary
management and SCOPE audits highlighted a disconnect between corporate
commitment and resourcing for SCOPE scale-up. This disconnect represents a risk
to WFP’s credibility and reputation if not resolved, since WFP relies on SCOPE to
achieve its beneficiary management objectives.

WFP/EB.A/2018/6-A/1 18
b) IT governance, controls and cybersecurity. Another issue that received Executive
Management Group’s attention in 2017 is that of IT governance, controls and
cybersecurity. During their information technology related assurance work, the
Office of the Inspector General identified several improvement areas, including user
and role management, segregation of duties and governance frameworks. WFP has
recently approved and made significant investments in strengthening cybersecurity,
recognizing that strong internal controls and technical solutions are essential to
prevent and detect unauthorized access, and to safeguard the confidentiality,
integrity and availability of data and programmes.
Issues reported in the 2016 Statement on Internal Control
16. The 2016 Statement on Internal Control drew attention to four improvement areas. Progress
has been made in a number of areas; however, further work is needed.
a) The impact of a high number of complex Level 3 and Level 2 emergencies, in
conjunction with the transition to the IRM. During 2017, WFP continued to
respond to multiple, prolonged and simultaneous Level 3 or Level 2 emergencies.
2017 saw the activation and/or extension of Level 3 or Level 2 emergency responses
in the Central African Republic, the Democratic Republic of the Congo, the Horn of
Africa, Iraq, Libya, Mali, Myanmar/Bangladesh, Nigeria, South Sudan, the Syrian Arab
Republic and Syrian refugees, and Yemen. The emergency workload has remained
at exceptionally high levels. Some senior managers have drawn attention to the risk
of a reduction in the level of internal controls caused in part by the limited availability
of properly trained and experienced personnel.
The risk of the inability of WFP to meet its humanitarian commitments, due to a
proliferation of crises in recent years, continues to feature on the Corporate Risk
Register.
Similarly, the Office of the Inspector General also reported in their 2017 Assurance
Opinion on the impact on internal controls of stretched resources in field offices due
to the unprecedented and sustained number of Level 3 emergencies, in conjunction
with managing initiatives such as the IRM. The Office of the Inspector General has
highlighted this as its main concern as the capacity of the organization to meet its
other ambitious objectives, absorb additional funding, manage the activities of
implementing partners, and address identified initiatives remains a challenge.
During 2018, WFP will continue to monitor the impact of the unprecedented high
level of prolonged emergency activities across WFP on the effectiveness of internal
control and take necessary remedial actions to ensure that appropriate levels of
internal control are maintained.
WFP has also developed a comprehensive plan to address staffing requirements in
emergencies and build a surge team capacity.
In 2018, to ensure adequate management oversight and support to country offices
across regions, WFP will conduct a comprehensive regional bureaux scoping review
to review gaps and determine critical activities, which will determine what activities
are necessary to strengthen risk management and internal controls in regional
bureaux.
b) Enterprise risk management and management oversight. WFP’s internal
management systems and oversight mechanisms are in place to uphold high
standards of integrity, operational efficiency and effectiveness. It became evident
during 2016 that considering the tightening risk environment in which WFP
operates, it was necessary to strengthen enterprise risk management and oversight.

WFP/EB.A/2018/6-A/1 19
The Office of the Inspector General highlighted the need to develop key risk
indicators to analyse and monitor WFP’s exposure to risks in key areas.
In March 2017, a global management meeting took place, the focus of which was on
strengthening enterprise risk management and WFP’s internal control culture. 2017
also saw the establishment of a new Enterprise Risk Management Division. The new
division will coordinate a number of activities under the umbrella of strengthening
enterprise risk management and internal control, funded as critical corporate
initiatives. The division has recently developed a standard risk taxonomy reflecting
key risk areas across WFP’s global portfolio of operations, enabling WFP to
systematically identify and monitor trends in key risk areas, strengthen
decision-making and support sharing of risk information with stakeholders
and partners.
c) Improving operational monitoring and review systems. The 2016 statement
reported on progress of the global rollout of the corporate country office tool for
managing effectively (COMET). During 2017, WFP modified COMET in line with the
approved IRM processes. The new Corporate Results Framework, which is being
rolled out as part of the IRM, guides the planning, implementation and monitoring
of WFP’s programmes. COMET assists programme management in country offices
by supporting the process of the design of CSPs and applying the Corporate Results
Framework in support of WFP’s IRM. WFP also developed third party monitoring
guidance, already available in English and being translated in other United Nations
languages, and WFP’s Corporate Monitoring Strategy (2018–2021), which is pending
final release. Most of the components of the monitoring tool kit were aligned with
IRM. The Indicator Compendium was updated twice in 2017, to complete or refine
the indicator methodologies.
WFP will continue to prioritize this area during 2018. To address identified process
control weaknesses in the management of beneficiary lists, WFP will review and
strengthen guidance and systems for verification of distribution activities,
distribution reports and supporting evidence; this process will continue to build
upon and enhance the rollout of existing programme management tools such as
COMET.
An internal audit of monitoring, including a review of COMET, is planned for 2018.
d) Talent management and workforce planning. Another issue that arose in 2016,
reflecting the persisting level of Level 3 and Level 2 emergencies, was the need to
improve talent management and workforce planning. WFP’s 2014 People Strategy,
which is a blueprint for how WFP intended to reinforce, build, retain, and recruit its
workforce, has not fully addressed the staffing needs throughout the organization.
Some country offices classified as hardship duty stations continue to experience
challenges in attracting and retaining qualified staff, particularly in conflict areas. In
other cases, inadequate staff skills were attributed to lack of training due to
insufficient funds. Reliance on short-term staff resulted in high turnover and gaps in
knowledge retention.
The Office of the Inspector General has highlighted that the need for workforce
planning, alignment of workforce structures to strategies, assessing and sourcing
the right skills remains, especially as countries are rolling out the IRM.
WFP is piloting a workforce planning approach in one headquarters division and will
use feedback collected to refine the model before piloting it in a country office.
Workforce planning concepts are part of the IRM organizational readiness Human
Resources toolkit for country offices, and serve to address organizational, skill and

WFP/EB.A/2018/6-A/1 20
talent gaps as they arise. As part of the IRM implementation, WFP is systematically
assessing workforce composition at the country level.
17. Apart from the issues noted above, the assurance statements received from WFP directors
and the managerial oversight process provided assurance on the effectiveness and strength
of WFP’s internal controls during 2017. During 2018, WFP management will emphasize
oversight for these internal control issues, as well as other issues identified by the Office of
the Inspector General in their 2017 Assurance Opinion: a) IRM implementation related
issues; b) controls in the CBTs area; and c) issues related to vendors and NGO partners.
Statement
18. All internal controls have inherent limitations – including the possibility of
circumvention - and therefore can provide only reasonable assurance regarding the
achievement of objectives relating to operations, reporting and compliance. Further,
because of changing conditions, the effectiveness of internal controls may vary over time.
19. Based on the above, I consider, to the best of my knowledge and information, that WFP
operated satisfactory systems of internal control for the year ended 31 December 2017 in
line with COSO’s Internal Control – Integrated Framework (2013).
20. WFP is committed to addressing the internal control and risk management issues identified
above as part of the continuous improvement of its internal controls.
David M. Beasley
Executive Director Rome, 22 March 2018

WFP/EB.A/2018/6-A/1 21
WORLD FOOD PROGRAMME
STATEMENT I
STATEMENT OF FINANCIAL POSITION
AT 31 DECEMBER 2017
(USD million)
Note 2017 2016 (restated)
Assets
Current assets
Cash and cash equivalents 2.1 1 268.9 777.5
Short-term investments 2.2 1 206.3 1 176.6
Contributions receivable 2.3 3 523.8 2 756.9
Inventories 2.4 704.8 643.2
Other receivables 2.5 136.6 127.1
6 840.4 5 481.3
Non-current assets
Contributions receivable 2.3 378.2 488.4
Long-term investments 2.6 626.9 506.3
Property, plant and equipment 2.7 128.4 140.3
Intangible assets 2.8 5.6 5.7
1 139.1 1 140.7
Total assets 7 979.5 6 622.0
Liabilities
Current liabilities
Payables and accruals 2.9 654.9 557.8
Deferred revenue 2.10 1 550.0 486.9
Provisions 2.11 6.3 7.0
Employee benefits 2.12 36.9 7.8
Loan 2.13 5.7 5.7
2 253.8 1 065.2
Non-current liabilities
Deferred revenue 2.10 378.2 499.3
Employee benefits 2.12 841.2 694.8
Loan 2.13 72.4 78.1
1 291.8 1 272.2
Total liabilities 3 545.6 2 337.4
Net assets 4 433.9 4 284.6
Fund balances and reserves
Fund balances 2.15 4 053.5 3 954.9
Reserves 2.15 380.4 329.7
Total fund balances and reserves 4 433.9 4 284.6
The accompanying notes form an integral part of these financial statements.

WFP/EB.A/2018/6-A/1 22
WORLD FOOD PROGRAMME
STATEMENT II
STATEMENT OF FINANCIAL PERFORMANCE
FOR THE YEAR ENDED 31 DECEMBER 2017
(USD million)
Note 2017 2016 (restated)
Revenue
Monetary contributions 3.1 5 614.8 5 300.4
In-kind contributions 3.2 385.1 470.7
Currency exchange differences 3.3 231.0 (31.3)
Return on investments 3.4 51.0 20.3
Other revenue 3.5 149.0 148.8
Total revenue 6 430.9 5 908.9
Expenses
Cash-based transfers distributed 4.1 1 446.1 882.3
Food commodities distributed 4.2 2 197.5 2 051.1
Distribution and related services 4.3 664.4 641.4
Wages, salaries, employee benefits and other staff
costs 4.4 884.0 826.7
Supplies, consumables and other running costs 4.5 174.4 170.8
Contracted and other services 4.6 759.5 689.5
Finance costs 4.7 1.9 2.1
Depreciation and amortization 4.8 47.7 48.3
Other expenses 4.9 43.7 55.3
Total expenses 6 219.2 5 367.5
Surplus for the year 211.7 541.4
The accompanying notes form an integral part of these financial statements.

WFP/EB.A/2018/6-A/1 23
WORLD FOOD PROGRAMME
STATEMENT III
STATEMENT OF CHANGES IN NET ASSETS
FOR THE YEAR ENDED 31 DECEMBER 2017
(USD million)
Note Accumulated
surplus/fund
balances
Surplus
(deficit)
Reserves Total net assets
Total net assets at 31 December 2016 (restated) 3 413.5 541.4 329.7 4 284.6
Allocation of the surplus for 2016 541.4 (541.4) - -
Movements in fund balances and reserves in 2017
Transfer from/to reserves 2.15 (50.7) - 50.7 -
Net unrealized gains on long-term investments 2.6/2.15 58.0 - - 58.0
Actuarial gains (losses) on employee benefit liabilities 2.12 (120.4) - - (120.4)
Surplus for the year - 211.7 - 211.7
Total movements during the year (113.1) 211.7 50.7 149.3
Total net assets at 31 December 2017 3 841.8 211.7 380.4 4 433.9
Note Accumulated
surplus/fund balances
Surplus
(deficit)
Reserves Total net assets
Total net assets at 31 December 2015 3 543.3 (50.9) 278.2 3 770.6
Change in Accounting Policy 1 23.5 - - 23.5
Total net assets at 31 December 2015 (restated) 3 566.8 (50.9) 278.2 3 794.1
Allocation of the deficit for 2015 (50.9) 50.9 - -
Movements in fund balances and reserves in 2016 (restated)
Transfer from/to reserves 2.15 (51.5) - 51.5 -
Net unrealized gains on long-term investments 14.8 - - 14.8
Actuarial gains (losses) on employee benefit liabilities (65.7) - - (65.7)
Surplus for the year - 541.4 - 541.4
Total movements during the year (102.4) 541.4 51.5 490.5
Total net assets at 31 December 2016 (restated) 3 413.5 541.4 329.7 4 284.6
The accompanying notes form an integral part of these financial statements.

WFP/EB.A/2018/6-A/1 24
WORLD FOOD PROGRAMME STATEMENT IV
STATEMENT OF CASH FLOW
FOR THE YEAR ENDED 31 DECEMBER 2017
(USD million)
Note 2017 2016 (restated)
Cash flows from operating activities:
Surplus for the year 211.7 541.4
Adjustments to reconcile surplus to net cash flows
from operating activities
Depreciation and amortization 2.7/2.8 47.7 48.3
Unrealized (gain) loss on short-term investments 2.2 0.5 (0.8)
Unrealized (gain) on long-term investments 2.6 (8.8) (0.3)
(Increase) in amortized value of long-term investments 2.2/2.6 (3.7) (3.9)
(Decrease) in amortized value of long-term loan 2.13 (0.4) (0.5)
Interest expense on long-term loan 2.13 2.3 2.6
(Increase) decrease in inventories 2.4 (61.6) 6.9
(Increase) in contributions receivable 2.3 (656.7) (975.4)
(Increase) in other receivables 2.5 (8.7) (16.4)
(Increase) in property, plant and equipment (donated in
kind) 2.7 (1.5) (8.2)
Increase in payables and accruals 2.9 97.1 44.0
Increase in deferred revenue 2.10 942.0 747.6
(Decrease) increase in provisions 2.11 (0.7) 1.3
Increase in employee benefits net of actuarial gain/loss on
post-employment benefits 2.12 55.1 47.9
Net cash flows from operating activities 614.3 434.5
Cash flows from investing activities:
(Increase) in short-term investments 2.2 (22.7) (350.9)
(Increase) in accrued interest receivable 2.5 (0.8) (1.3)
(Increase) in long-term investments 2.6 (57.5) (32.7)
(Increase) in property, plant and equipment 2.7 (33.0) (34.6)
(Increase) in intangible assets 2.8 (1.2) (1.8)
Net cash flows from investing activities (115.2) (421.3)
Cash flows from financing activities:
Interest paid on loan 2.13 (2.4) (2.6)
Repayment of annual principal on loan 2.13 (5.3) (5.3)
Net cash flows from financing activities (7.7) (7.9)
Net increase in cash and cash equivalents 491.4 5.3
Cash and cash equivalents at beginning of the year 2.1 777.5 772.2
Cash and cash equivalents at end of the year 2.1 1 268.9 777.5
The accompanying notes form an integral part of these financial statements.

WFP/EB.A/2018/6-A/1 25
1 Prepared on a commitment basis. 2 At the time of 2017–2019 Management Plan approval, Original Budget and Implementation Plan amounts covered all countries, including those that moved to the CSPs in 2017. The CSP framework
and list of CSP pilots are presented in the IRM section (paragraphs 5–10) of the Executive Director’s Statement.
WORLD FOOD PROGRAMME STATEMENT V
STATEMENT OF COMPARISON OF BUDGET AND ACTUAL AMOUNTS1
FOR THE YEAR ENDED 31 DECEMBER 2017
(USD million)
Project costs
Note
6
Budget amount
Original budget Final budget Actual on
comparable basis
Difference: final
budget and actual
Prioritized
plan
Food and related DOC 4 665.3 5 279.8 2 880.1 2 399.7 2 806.0
Cash-based transfers and related DOC 2 243.9 2 304.8 1 473.8 831.0 1 269.0
Capacity augmentation 479.1 485.7 310.8 174.9 339.0
Direct support costs 1 029.6 916.3 601.3 315.0 619.0
Subtotal direct project costs 8 417.9 8 986.6 5 266.0 3 720.6 5 033.0
CSP pilots’ costs2
SR.1 Everyone has access to food - 278.2 87.3 190.9 -
SR.2 No one suffers from malnutrition - 60.6 17.7 42.9 -
SR.3 Smallholders have improved food security and
nutrition - 7.5 1.7 5.8 -
SR.4 Food systems are sustainable - 40.4 15.7 24.7 -
SR.5 Countries have strengthened capacities to implement the
SDGs - 14.3 3.4 10.9 -
SR.7 Developing countries access a range of financial resources for
development investment - 0.2 0.3 (0.1) -
SR.8 Sharing of knowledge, expertise and technology, strengthen
global partnership support to country efforts to achieve the SDGs - 22.6 14.7 7.9 -
Adjusted direct support costs - 30.0 13.3 16.7 -
Subtotal CSP pilots - 453.8 154.1 299.7 -
Regular programme support and administrative costs 335.4 335.4 334.1 1.3 335.4
Critical corporate initiatives 13.5 23.4 15.7 7.7 13.5
Subtotal indirect costs 348.9 358.8 349.8 9.0 348.9
Total 8 766.8 9 799.2 5 769.9 4 029.3 5 381.9
The accompanying notes form an integral part of these financial statements

WFP/EB.A/2018/6-A/1 26
Notes to the Financial Statements
at 31 December 2017
Note 1: Accounting policies
Basis of preparation
1. The financial statements of WFP have been prepared on the accrual basis of accounting in
accordance with IPSAS using the historic cost convention, modified by the inclusion of
investments at fair value. Where an IPSAS does not address a particular issue, the
appropriate International Financial Reporting Standard (IFRS) has been applied.
2. The Cash Flow Statement (Statement IV) is prepared using the indirect method.
3. The functional and reporting currency of WFP is the United States dollar. Transactions in
currencies other than the US dollars are translated into US dollars at the prevailing
United Nations Operational Rates of Exchange (UNORE) at the time of transaction. Assets
and liabilities in currencies other than US dollars are translated into US dollars at the
prevailing UNORE year-end closing rate. Resulting gains or losses are accounted for in the
Statement of Financial Performance.
Cash and cash equivalents
4. Cash and cash equivalents comprise cash on hand, cash at banks, money market and
short-term deposits, including those managed by investment managers.
5. Investment revenue is recognized as it accrues, taking into account the effective yield.
Financial instruments
6. Financial instruments are recognized when WFP becomes a party to the contractual
provisions of the instrument until such time as when the rights to receive cash flows from
those assets have expired or have been transferred and WFP has transferred substantially
all the risks and rewards of ownership.
7. Financial assets that are held for trading are measured at fair value and any gains or losses
arising from changes in the fair value are accounted for through surplus or deficit and
included within the Statement of Financial Performance in the period in which they arise.
The short-term investments are classified within this category since they are held to support
WFP operations and therefore may be divested of in the short term which may generate
trading gains or losses. Derivatives are also classified as held for trading.
8. Loans and receivables are non-derivative financial assets with fixed or determinable
payments that are not quoted in active markets. Loans and receivables comprise
contributions receivable in cash, other receivables and cash and cash equivalents. Loans and
receivables are stated at amortized cost.
9. Held-to-maturity investments are non-derivative financial assets with fixed or determinable
payments and fixed maturity that WFP has the intention and ability to hold to maturity.
Held-to-maturity investments comprise the United States Treasury Separate Trading of
Registered Interest and Principal of Securities (STRIPS) held within the long-term investment
portfolio and are stated at amortized cost.

WFP/EB.A/2018/6-A/1 27
10. Available-for-sale financial assets are non-derivative financial assets that are not designated
within any other category. Available-for-sale assets comprise the long-term investments
other than the United States Treasury STRIPS. They are carried at fair value, with value
changes recognized in the Statement of Changes in Net Assets. Gains and losses are
reclassified from net assets to surplus or deficit when the assets are derecognized.
11. All non-derivative financial liabilities are recognized initially at fair value, and subsequently
measured at amortized cost using the effective interest method.
Inventories
12. Food commodities and non-food items on hand at the end of the financial period are
recorded as inventories and are valued at cost or current replacement cost, whichever is
lower. Under the legal framework in which WFP operates, legal title of food commodities
normally passes to the recipient country government at their point of first entry into a
recipient country where they become distributable. Although legal title may have passed for
those food commodities held in WFP warehouses in recipient countries, WFP records these
commodities as inventories because WFP retains physical custody and control.
13. The cost of food commodities includes purchase cost or fair value1 if donated in-kind and all
other costs incurred in bringing the food commodities into WFP’s custody at their point of
first entry into a recipient country where they become distributable. In addition, any
significant costs of conversion such as milling or bagging are included. Cost is determined
on the weighted average basis.
Contributions receivable
14. Contributions receivable are recognized when confirmed in writing by donors.
15. Contributions receivable are presented net of allowance for impairment and allowance for
estimated reduction in contribution revenue.
16. In-kind contributions of services that directly support approved operations and activities,
which have budgetary impact, and can be reliably measured, are recognized and valued at
fair value. These contributions include use of premises, utilities, transport and personnel.
17. Donated property, plant and equipment and intangible assets are valued at fair market value
and recognized as property, plant, and equipment or intangible asset and contributions
revenue.
Property, plant and equipment
18. Property, plant, and equipment (PP&E) are measured initially at cost. Subsequently, PP&E
are carried at cost less accumulated amortization and any impairment losses. Borrowing
costs, if any, are not capitalized. Donated PP&E are valued at fair market value and
recognized as PP&E and contribution revenue. Depreciation is provided for PP&E over their
estimated useful life using the straight-line method, except for land which is not subject to
depreciation. The estimated useful life for PP&E classes are as follows:
1 Indicators of the fair value for food commodities donated in-kind include world market prices, the Food Aid Convention
price and the donor’s invoice price.

WFP/EB.A/2018/6-A/1 28
Class Estimated useful life (years)
Buildings
Permanent 40
Temporary 5
Computer equipment 3
Office equipment 3
Office fixtures and fittings 5
Security and safety equipment 3
Telecommunication equipment 3
Motor vehicles 5
Workshop equipment 3
19. Leasehold improvements are recognized as assets and valued at cost, and depreciated over
the lesser of remaining useful life of the improvements or the lease term.
20. Impairment reviews are undertaken for all assets at least annually.
Intangible assets
21. Intangible assets are measured initially at cost. Subsequently, intangible assets are carried
at historical cost less accumulated amortization and any impairment losses. Donated
intangible assets are valued at fair market value and recognized as intangible asset and
contribution revenue.
22. Amortization is provided over the estimated useful life using the straight-line method.
The estimated useful life for intangible asset classes are as follows:
Class Estimated useful life (years)
Internally generated software 6
Externally acquired software 3
Licenses and rights, copyrights and other intangible assets 3
Employee benefits
23. WFP recognizes the following categories of employee benefits:
➢ short-term employee benefits due to be settled within 12 months after the end of the
accounting period in which employees render the related service;
➢ post-employment benefits; and
➢ other long-term employee benefits.
Change in accounting policy
24. In July 2016, the new standard IPSAS 39, Employee Benefits was issued, replacing IPSAS 25,
with an effective application date for annual financial statements covering periods beginning
on or after 1 January 2018. WFP adopted IPSAS 39 in its 2017 annual financial statements.
25. The main differences between IPSAS 39 and previous IPSAS 25 are in the recognition and
presentation of actuarial gains and losses arising from the defined benefit plans. IPSAS 39
requires disclosure for defined benefit plans according to the characteristics and risks
associated with them.

WFP/EB.A/2018/6-A/1 29
26. Under IPSAS 25, the corridor approach, used by WFP, allowed actuarial gains and losses for
post-employment benefits which are up to 10 percent of the defined benefit obligation not
to be recognized, and gains and losses over 10 percent of the defined benefit obligation to
be amortized over the average remaining service of active staff. Under IPSAS 39 the corridor
approach is not permitted, and actuarial gains and losses on post-employment benefits are
recognized in full in the Statement of Changes in Net Assets.
27. In accordance with the IPSAS 39 transitional provisions, the new standard has been applied
retrospectively, resulting in the restatement of the comparative financial statements for
2016 (opening balances as at 1 January 2016). The impact of the change in accounting policy
is an increase in opening balance of net assets as at 1 January 2016 of USD 23.5 million, the
decrease of closing balance of net assets as at 31 December 2016 by USD 42.5 million and
an increase of employee benefit liabilities for the same amount. Statements I, II, III and IV
were restated, Note 2.12 discloses opening and closing balances for employee benefits
liabilities, Statement III and Note 2.15 disclose the impact on fund balances.
United Nations Joint Staff Pension Fund
28. WFP is a member organization participating in the United Nations Joint Staff Pension Fund
(UNJSPF or the Fund), which was established by the United Nations General Assembly to
provide retirement, death, disability and related benefits to employees. The Fund is a funded,
multi-employer defined benefit plan. As specified by Article 3 (b) of the Regulations of the
Fund, membership in the Fund shall be open to the specialized agencies and to any other
international, intergovernmental organization which participates in the common system of
salaries, allowances and other conditions of service of the United Nations and the specialized
agencies.
29. The Fund exposes participating organizations to actuarial risks associated with the current
and former employees of other organizations participating in the Fund, with the result that
there is no consistent and reliable basis for allocating the obligation, plan assets, and costs
to individual organizations participating in the plan. WFP and the UNJSPF, in line with the
other participating organizations in the Fund, are not in a position to identify WFP’s
respective proportionate share of the defined benefit obligation, the plan assets and the
costs associated with the plan with sufficient reliability for accounting purposes. Hence WFP
has treated this plan as if it were a defined contribution plan in line with the requirements
of IPSAS 39, Employee Benefits. WFP’s contributions to the Fund during the financial period
are recognized as expenses in the Statement of Financial Performance.
Provisions and contingent liabilities
30. Provisions are made for future liabilities and charges where WFP has a present legal or
constructive obligation as a result of past events and it is probable that WFP will be required
to settle the obligation.
31. Other material commitments, which do not meet the recognition criteria for liabilities, are
disclosed in the notes to the financial statements as contingent liabilities when their
existence will be confirmed only by the occurrence or non-occurrence of one or more
uncertain future events which are not wholly within the control of WFP.

WFP/EB.A/2018/6-A/1 30
Contributions revenue
32. WFP recognizes contributions revenue when confirmed in writing and where the
contribution has been stipulated for the current financial reporting year. For contributions
stipulated for future years, WFP recognizes an asset (cash or receivable) and a liability
(deferred revenue) when the agreement is confirmed in writing. Deferred revenue is reduced
and revenue is recognized only when the contribution year, as stipulated by the donor,
starts.
Food commodities and cash-based transfers distributed
33. Food commodities are expensed when distributed directly by WFP or once they are handed
over to Cooperating Partners or Service Providers for distribution.
34. Cash-based transfers are expensed when distributed directly by WFP or once they are
distributed by the Cooperating Partners or Service Providers.
Fund accounting and segment reporting
35. A fund is a self-balancing accounting entity established to account for the transactions of a
specified purpose or objective. Funds are segregated for the purpose of conducting specific
activities or attaining certain objectives in accordance with special regulations, restrictions
or limitations. The financial statements are prepared on a fund accounting basis, showing at
the end of the period the consolidated position of all WFP funds. Fund balances represent
the accumulated residual of revenue and expenses.
36. A segment is a distinguishable activity or group of activities for which financial information
is reported separately in order to evaluate an entity’s past performance in achieving its
objectives and for making decisions about the future allocation of resources. WFP classifies
all projects, operations and fund activities into three segments: i) Programme Category
Funds; ii) General Fund and Special Accounts; and iii) Bilateral Operations and Trust Funds.
WFP reports on the transactions of each segment during the financial period, and the
balances held at the end of the period.
37. Following the approval of the Strategic Plan (2017–2021), the first CSPs under the country
portfolio budgets were approved by the Board and piloted by WFP in 2017. These CSPs with
the country portfolio budgets applied new programmatic and financial framework, which
necessitates amendments to the WFP General Rules and Financial Regulations. Pending
normative amendments, the Board authorized the temporary application to the pilot
country portfolio budgets of provisions of the WFP General Rules and Financial Regulations
referring to existing programme categories as if they referred to CSPs.2
38. The Programme Category Funds is an accounting entity established by the Board for the
purposes of accounting for contribution revenue and expenses for all programme
categories. Programme categories include development, emergency relief, protracted relief
and special operations.
39. The General Fund is the accounting entity established for recording, under separate
accounts, indirect support cost (ISC) recoveries, miscellaneous income, operational reserve
and contributions received that are not designated to a specific programme category, project
or a bilateral project. Special Accounts are established by the Executive Director under
Financial Regulation 5.1 for special contributions or monies earmarked for specific activities,
the balances of which may be brought forward to the succeeding financial period.
2 WFP/EB.2/2016/15.

WFP/EB.A/2018/6-A/1 31
40. Bilateral Operations and Trust Funds are also identifiable subdivisions of the WFP Fund.
These are established by the Executive Director under Financial Regulation 5.1 in order to
account for contributions, the purpose, scope and reporting procedures of which have been
agreed upon with the donor under specific trust fund agreements.
41. Reserves are maintained within the General Fund for the purpose of operational support.
An operational reserve is maintained within the General Fund as required under
Financial Regulation 10.5 to ensure continuity of operations in the event of temporary
shortfalls of resources. In addition to the Operational Reserve, other reserves have been
established by the Board.
42. WFP may enter into third-party agreements (TPAs) to undertake activities which, while
consistent with the objectives of WFP, are outside WFP’s normal activities. TPAs are not
reported as WFP revenue and expenses. At the year end, the net balance owing to or from
third parties is reported as a payable or receivable in the Statement of Financial Position
under the General Fund. Service fees charged on TPAs are included within other revenue.
Budget comparison
43. WFP’s budget is prepared on a commitment basis and the financial statements on an accrual
basis. In the Statement of Financial Performance, expenses are classified on the basis of the
nature of expenses, whereas in the Statement of Comparison of Budget and Actual Amounts,
expenditures are classified by functional classifications or strategic result into WFP cost
categories.
44. The Board approves budgets for the direct costs of operations either directly or through its
delegated authority. It also approves the annual Management Plan, including the
appropriations for programme support and administrative costs, and critical corporate
initiatives. Budgets may be subsequently amended by the Board or through the exercise of
delegated authority.
45. Statement V: Comparison of Budget and Actual Amounts compares the final budget to actual
amounts calculated on the same basis as the corresponding budgetary amounts. As the
bases used to prepare the budget and financial statements differ, Note 6 provides
reconciliation between the actual amounts presented in Statement V to the actual amounts
presented in Statement IV: Cash Flow.
46. The budget in Statement V represents WFP’s operational requirements, which includes the
Prioritized Plan. This Prioritized Plan represents a prioritized plan of work based on
estimated forecast contributions taking into account the fact that WFP is a voluntarily funded
organization and its operations and financial management therefore depend on the level of
funding actually received. The Prioritized Plan is detailed in the Management Plan and
includes the Prioritized Programme of Work for the direct cost portion and the budgeted
regular programme support and administrative costs and critical corporate initiatives for the
indirect cost portion.
Interest in other entities
47. In 2017, WFP applied new standards that became effective on 1 January 2017: IPSAS 34
Separate Financial Statements, IPSAS 35 Consolidated Financial Statements, IPSAS 36
Investments in Associates and Joint Ventures, IPSAS 37 Joint Arrangements and IPSAS 38
Disclosure of Interests in Other Entities. These five IPSASs establish requirements for how
an entity should account for its interests in other entities. The application of new standards
did not result in changes to measurement, valuation or presentation of amounts in the
financial statements but has resulted in additional disclosures of joint arrangements
provided in Note 12.

WFP/EB.A/2018/6-A/1 32
Note 2.1: Cash and cash equivalents
2017 2016
USD million
Cash and cash equivalents
Bank and cash at headquarters 110.4 178.3
Bank and cash at regional bureaux and country offices 62.7 53.4
218.6
Money market and deposit accounts at headquarters 398.0 218.6
Cash and cash equivalents held by investment
managers
697.8 327.2
Total cash and cash equivalents 1 268.9 777.5
48. Cash required for immediate disbursement is maintained in cash and bank accounts.
Balances in the money market and deposit accounts are available at short notice.
Note 2.2: Short-term investments
2017 2016
USD million
Short-term investments
Short-term investments 1 198.9 1 169.1
Current portion of long-term investments (Note 2.6) 7.4 7.5
Total short-term investments 1 206.3 1 176.6
49. Short-term investments are divided into two portfolio tranches with distinct investment
horizons and specific investment guidelines and restrictions. The risk profile of short-term
investments did not materially change in 2017 and remained at very low levels in the context
of a market environment of low absolute yields.
50. Short-term investments were valued at USD 1 198.9 million at 31 December 2017
(USD 1 169.1 million at 31 December 2016). Of this amount, USD 647.4 million pertains to
bonds issued or guaranteed by governments or government agencies (USD 565.2 million at
31 December 2016); USD 315.4 million pertains to corporate bonds (USD 373.3 million at
31 December 2016) and USD 236.1 million pertains to asset-backed securities
(USD 230.6 million at 31 December 2016). These investments are stated at fair value based
on valuation provided by the independent custodian bank responsible for the administration
and safekeeping of the securities.
51. At 31 December 2017, derivatives usage in short-term investments was limited to bond
futures and derivatives exposure was considered not to be material. The notional amount
of the derivatives financial instruments held in the investment portfolio is USD 1.3 million
(USD 6.6 million at 31 December 2016).

WFP/EB.A/2018/6-A/1 33
2016 Net
additions/
(deductions)
Interest
received/
amortized
Net realized
gains/
(losses)
Net
unrealized
gains/(losses)
2017
USD million
Short-term
investments
1 169.1 16.7 16.7 (3.1) (0.5) 1 198.9
Current portion
of long-term
investments
7.5 (0.5) 0.4 - - 7.4
Total
short-term
investments
1 176.6 16.2 17.1 (3.1) (0.5) 1 206.3
52. During 2017, short-term investments increased by USD 29.8 million. This increase includes
net unrealized loss of USD 0.5 million presented in the reconciliation of surplus to operating
cash flows in the Statement of Cash Flow and amortized interest on the current portion of
the long-term investment of USD 0.4 million, also presented in the reconciliation as part of
the increase in amortized value of the long-term investment of USD 3.7 million. The
remaining balance, net of reclassification from long-term to short-term of USD 7.1 million,
amounting to USD 22.7 million is presented in the Statement of Cash Flow under investing
activities.
Note 2.3: Contributions receivable
2017 2016
USD million
Composition:
Current 3 523.8 2 756.9
Non-current 378.2 488.4
Total net contributions receivable 3 902.0 3 245.3
Monetary contributions receivable 3 825.2 3 165.5
In-kind contributions receivable 208.4 206.9
Total contributions receivable before allowance 4 033.6 3 372.4
Allowance for reduction in contribution revenue (124.2) (111.6)
Allowance for impairment (7.4) (15.5)
Total net contributions receivable 3 902.0 3 245.3
53. Current contributions receivable are for confirmed contributions that are due within
12 months while non-current contributions receivable are those that are due after
12 months from 31 December 2017.
54. Contributions receivable relate to donor contributions for programme categories, bilateral
operations, trust funds or to the General Fund and Special Accounts. Donor contributions
may include restrictions that require WFP to use the contribution for a specific project,
activity or country within a specified timeframe.

WFP/EB.A/2018/6-A/1 34
55. The following table illustrates the composition of contributions receivable by aging:
2017 2016
USD million % USD million %
Aging
2017 3 286.1 83
2016 555.6 14 2 760.3 80
2015 80.1 2 522.5 15
2014 and earlier 56.1 1 180.9 5
Subtotal 3 977.9 100 3 463.6 100
Revaluation adjustments
(non-USD contributions receivable)
55.7 - (91.2) -
Total contributions receivable
before allowance
4 033.6 100 3 372.4 100
56. Contributions receivable are presented net of allowance for impairment and allowance for
estimated reductions in contribution revenue.
57. Allowance for reductions in contribution revenue is an amount estimated for any reductions
of contributions receivable and corresponding revenue when the funding is no longer
needed by the project to which the contributions were related. The allowance is based on
historical experience.
58. The change in the allowance for reductions in contribution revenue during 2017 is as follows:
2016 Utilization Increase/
(decrease)
2017
USD million
Total allowance for reduction in
contribution revenue
111.6 (128.9) 141.5 124.2
59. During 2017, the reductions in contributions receivable amounted to USD 128.9 million.
These reductions are recorded as a utilization of the allowance for reductions in contribution
revenue and reported in the Statement of Financial Position. At 31 December 2017, the
estimated final allowance required is USD 124.2 million. Accordingly, an increase of
USD 141.5 million was recorded as an adjustment to monetary contribution revenue for the
period and is reported in the Statement of Financial Performance.
60. The allowance for impairment is recorded based on a review of open contributions
receivable to determine any line items that may not be collectible based on objective
evidence of impairment as a result of one or more events that occurred after initial
recognition of the receivable (“loss event”) and that loss event(s) has an impact on the
estimated future cash flows of the contributions receivable or group of receivables. Note
that this is for contributions receivable where expenses have already been incurred but
donors are not expected to provide funding. Actual write-offs require a transfer from the
General Fund and approval by the Executive Director for amounts in excess of USD 10,000.

WFP/EB.A/2018/6-A/1 35
61. The change in the allowance for impairment during 2017 is as follows:
2016 Utilization Increase/
(decrease)
2017
USD million
Total allowance for impairment 15.5 (1.4) (6.7) 7.4
62. During 2017, write-offs of USD 1.4 million are recorded as a utilization of the allowance for
impairment and reported in the Statement of Financial Position. At 31 December 2017, the
estimated final allowance for impairment required is USD 7.4 million. Accordingly, a decrease
of USD 6.7 million was recorded as an adjustment for the period and is reported in the
Statement of Financial Performance.
Note 2.4: Inventories
63. The following tables show the movements of food and non-food items during the year. The
first table shows the total value of inventories – food and non-food – as presented in the
Statement of Financial Position. The second table shows a reconciliation of food inventories,
which reflects the opening balance and the additions during the year reduced by the value
of food distributed and impairment allowance made during the year.
2017 2016
USD million
Food on hand 503.1 490.0
Food in transit 190.3 140.2
Subtotal food 693.4 630.2
Less: allowance for impairment – food (3.8) (3.4)
Total food 689.6 626.8
Non-food items 15.8 16.6
Less: allowance for impairment – non-food (0.6) (0.2)
Total non-food items 15.2 16.4
Total inventories 704.8 643.2

WFP/EB.A/2018/6-A/1 36
Food reconciliation 2017 2016
USD million
Opening inventory 626.8 631.5
Add back: impairment allowance 3.4 3.2
Food purchased 1 443.2 1 304.2
In-kind commodities received 400.0 419.8
Transport and related costs 411.0 315.2
Total inventory available for distribution 2 884.4 2 673.9
Less: Food distributed (2 191.0) (2 043.7)
Less: Allowance for impairment (3.8) (3.4)
Total food 689.6 626.8
64. For 2017, food and non-food items distributed totalled USD 2 197.5 million
(USD 2 051.1 million in 2016), as reported in the Statement of Financial Performance. Of this
amount, USD 2 191.0 million relates to food commodities and USD 6.5 million relates to
non-food items (USD 2 043.7 million and USD 7.4 million, respectively, in 2016).
65. For food, costs incurred up to the first point of entry in the recipient country are included in
inventories. These costs include costs of procurement, ocean transport, port costs and, for
food destined for landlocked countries, the overland transport cost across transit countries.
66. Food quantities, derived from WFP’s food tracking systems, are validated by physical stock
counts and valued on a weighted average basis.
67. Inventories include non-food items held at WFP warehouses in Dubai and at various strategic
storage depots managed by the United Nations Humanitarian Response Depot network.
68. Non-food items include: prefabricated buildings/warehouses, storage tents, water treatment
units, solar power packs, satellite phones, ballistic blankets, tyres, motor vehicles and spare
parts.
69. Food commodity stocks at 31 December 2017 were 1.1 million mt, valued at
USD 693.4 million. At 31 December 2016, stocks were 1.0 million mt valued at
USD 630.2 million.
70. An allowance for impairment has been made for possible loss or damage to inventories
under WFP’s custody. The allowance is based on past experience and has been set at
0.55 percent of total food and 3.65 percent for non-food items (in 2016, the allowance for
food was 0.54 percent and the allowance for non-food items was 1.23 percent). Inventories
are valued net of any impairments or obsolescence. During 2017, USD 1.3 million
representing the total value of non-food items impaired are recorded as a utilization of the
allowance for impairment in the Statement of Financial Position. As at 31 December 2017,
the estimated final allowance for impairment required is USD 4.4 million. Accordingly, an
increase in the allowance for impairment of USD 2.1 million is reported in the Statement of
Financial Performance.

WFP/EB.A/2018/6-A/1 37
71. The change in the allowances for impairment during 2017 is as follows:
2016 Utilization Increase/
(decrease) 2017
USD million
Allowance for impairment – food 3.4 - 0.4 3.8
Allowance for impairment –
non-food 0.2 1.3 1.7 0.6
Total allowance 3.6 1.3 2.1 4.4
Note 2.5: Other receivables
72. Advances to vendors are for payments in advance of goods and service delivery.
73. Advances to staff are cash advances for education grants, rental subsidies, travel and other
staff entitlements. These advances are non-interest bearing in accordance with staff rules
and regulations.
74. A TPA is a legally binding contract between WFP and another party in which WFP acts as an
agent to provide goods or services at an agreed price. Transactions relating to TPA are
treated as receivables and payables in the Statement of Financial Position. TPA receivables
and payables are offset against each other in order to reflect the net position with the third
parties.
75. Miscellaneous receivables include amounts due from clients for services provided, accrued
interest receivable and value-added tax receivables where outright tax exemptions have not
been obtained from governments.
76. Other receivables are reviewed to determine whether any allowance for doubtful accounts
is required. As at 31 December 2017, the estimated allowance required is USD 31.5 million,
of which USD 29.7 million is for value-added tax receivable and USD 1.8 million is for other
receivables (USD 36.0 million for value-added tax receivable and USD 1.1 million for other
receivables in 2016).
77. The change in the allowance for impairment during 2017 is as follows:
2017 2016
USD million
Advances to vendors 38.8 38.0
Advances to staff 27.1 26.5
TPA receivables 6.2 3.4
Miscellaneous receivables 96.0 96.3
Total other receivables before allowance 168.1 164.2
Allowance for impairment (31.5) (37.1)
Total net other receivables 136.6 127.1
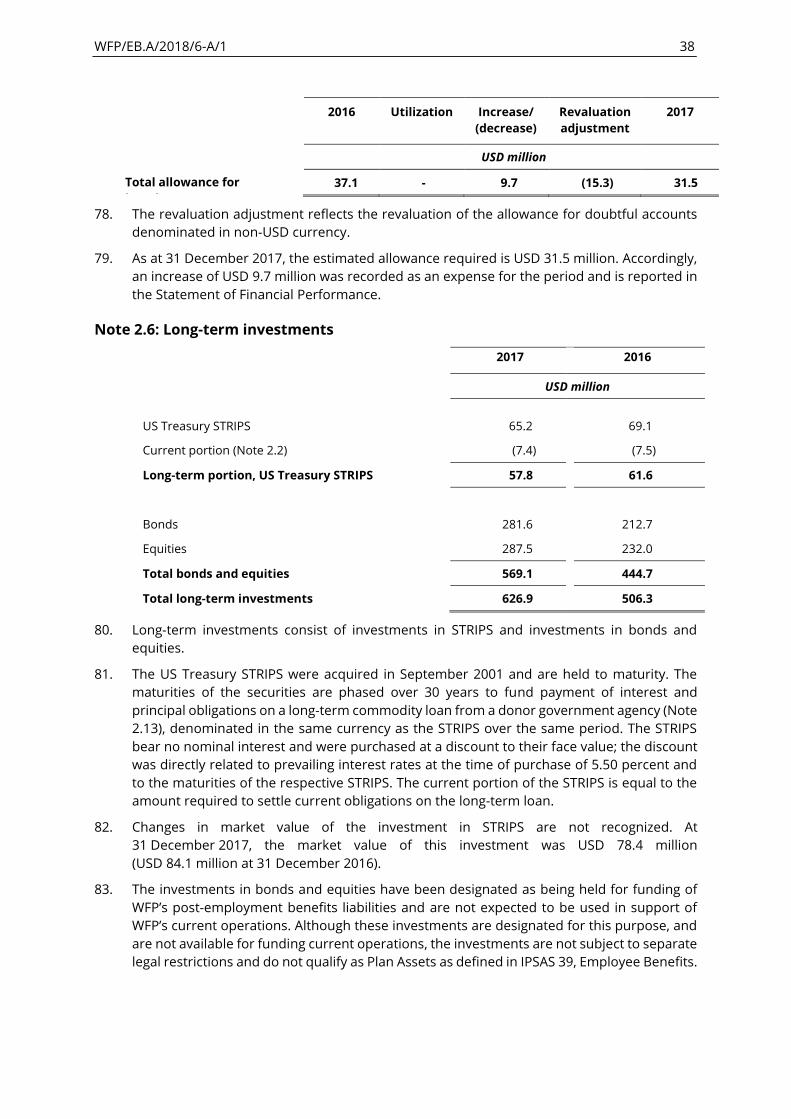
WFP/EB.A/2018/6-A/1 38
2016 Utilization Increase/
(decrease)
Revaluation
adjustment
2017
USD million
Total allowance for
impairment
37.1 - 9.7 (15.3) 31.5
78. The revaluation adjustment reflects the revaluation of the allowance for doubtful accounts
denominated in non-USD currency.
79. As at 31 December 2017, the estimated allowance required is USD 31.5 million. Accordingly,
an increase of USD 9.7 million was recorded as an expense for the period and is reported in
the Statement of Financial Performance.
Note 2.6: Long-term investments
2017 2016
USD million
US Treasury STRIPS 65.2 69.1
Current portion (Note 2.2) (7.4) (7.5)
Long-term portion, US Treasury STRIPS 57.8 61.6
Bonds 281.6 212.7
Equities 287.5 232.0
Total bonds and equities 569.1 444.7
Total long-term investments 626.9 506.3
80. Long-term investments consist of investments in STRIPS and investments in bonds and
equities.
81. The US Treasury STRIPS were acquired in September 2001 and are held to maturity. The
maturities of the securities are phased over 30 years to fund payment of interest and
principal obligations on a long-term commodity loan from a donor government agency (Note
2.13), denominated in the same currency as the STRIPS over the same period. The STRIPS
bear no nominal interest and were purchased at a discount to their face value; the discount
was directly related to prevailing interest rates at the time of purchase of 5.50 percent and
to the maturities of the respective STRIPS. The current portion of the STRIPS is equal to the
amount required to settle current obligations on the long-term loan.
82. Changes in market value of the investment in STRIPS are not recognized. At
31 December 2017, the market value of this investment was USD 78.4 million
(USD 84.1 million at 31 December 2016).
83. The investments in bonds and equities have been designated as being held for funding of
WFP’s post-employment benefits liabilities and are not expected to be used in support of
WFP’s current operations. Although these investments are designated for this purpose, and
are not available for funding current operations, the investments are not subject to separate
legal restrictions and do not qualify as Plan Assets as defined in IPSAS 39, Employee Benefits.

WFP/EB.A/2018/6-A/1 39
84. Investments in equities are made through six regional funds which track the composition
and performance of the Morgan Stanley Capital International (MSCI) All Country World Index,
a recognized index of stocks to all world markets. This investment structure provides
exposure to global equities markets on a passive basis with risks and returns that mirror the
MSCI All Country World Index.
85. The increase in the value of the long-term bond and equity investments of USD 124.4 million
resulted from the increased value of invested assets and from the investment of cash into
bonds and equities of amounts charged to funds and projects in relation to the employee
benefit liabilities. The cash transfer of USD 40.0 million is invested in line with the WFP asset
allocation policy of investing 50 percent in global bonds and 50 percent in global equities of
funds set aside to meet employee benefit liabilities. These investments are stated at fair
value based on valuation provided by the independent custodian bank responsible for the
administration and safekeeping of the securities.
86. The movement of long-term investments accounts during 2017 is as follows:
2016 Additions/
(deductions)
Interest
received/
amortized
Net
realized
gains/
(losses)
Net
unrealized
gains/
(losses)
2017
USD million
Bonds and equities 444.7 40.0 5.4 12.1 66.9 569.1
Investment in
STRIPS
61.6 (7.1) 3.3 - - 57.8
Total long-term
investment
506.3 32.9 8.7 12.1 66.9 626.9
87. During 2017, long-term investments increased by USD 120.6 million. Long-term bonds and
equities are treated as available-for-sale financial assets except the investment in derivative
financial instruments (USD 49.9 million) which are treated as held for trading financial assets.
Accordingly, under IPSAS, the net unrealized gains of USD 58.0 million related to those
financial assets treated as available-for-sale are transferred to net assets and presented in
the Statement of Changes in Net Assets. The net unrealized losses of USD 0.9 million related
to derivative financial instruments and the net unrealized gains of USD 9.7 million related to
foreign exchange differences on monetary items are presented in the Statement of Financial
Performance. The amortized interest on the investment in STRIPS of USD 3.3 million is
presented in the reconciliation of surplus to operating cash flows in the Statement of Cash
Flow as part of the increase in amortized value of the long-term investment of
USD 3.7 million. The remaining balance, net of a reclassification from long-term to
short-term of USD 7.1 million, amounting to USD 57.5 million is presented in the Statement
of Cash Flow under investing activities.
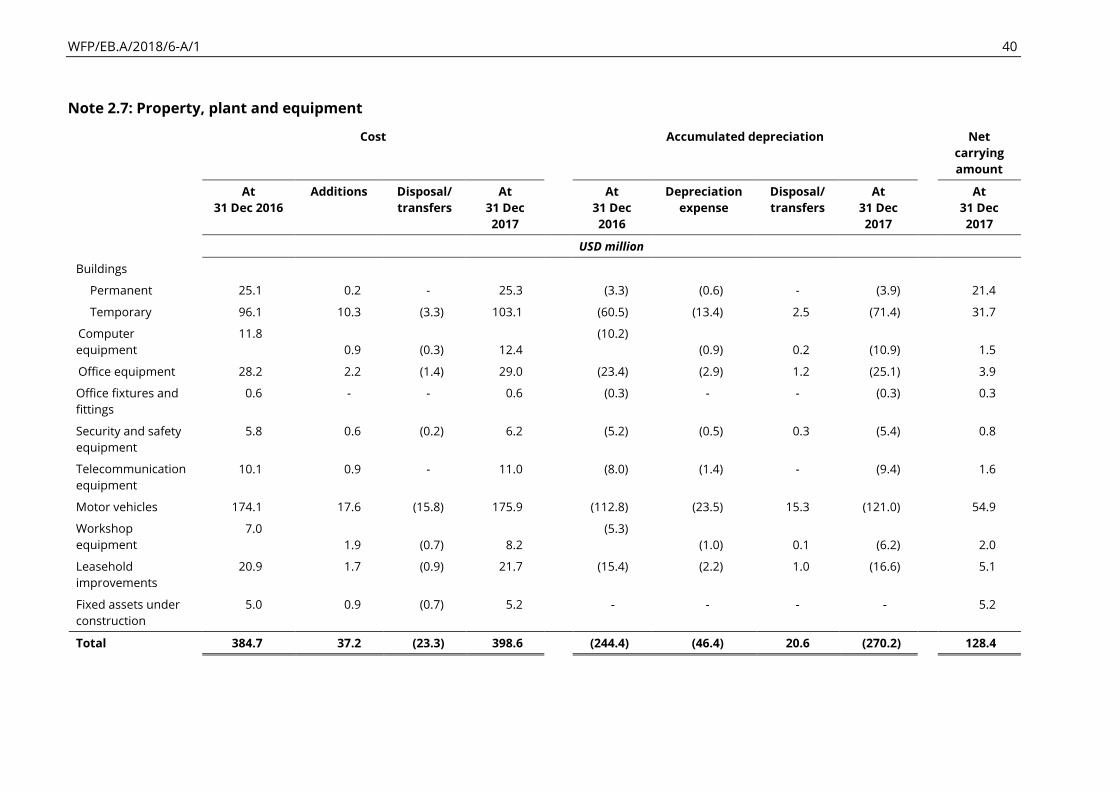
WFP/EB.A/2018/6-A/1 40
Note 2.7: Property, plant and equipment
Cost
Accumulated depreciation
Net
carrying
amount
At
31 Dec 2016
Additions Disposal/
transfers
At
31 Dec
2017
At
31 Dec
2016
Depreciation
expense
Disposal/
transfers
At
31 Dec
2017
At
31 Dec
2017
USD million
Buildings
Permanent 25.1 0.2 - 25.3 (3.3) (0.6) - (3.9) 21.4
Temporary 96.1 10.3 (3.3) 103.1 (60.5) (13.4) 2.5 (71.4) 31.7
Computer
equipment
11.8
0.9 (0.3) 12.4
(10.2)
(0.9) 0.2 (10.9)
1.5
Office equipment 28.2 2.2 (1.4) 29.0 (23.4) (2.9) 1.2 (25.1) 3.9
Office fixtures and
fittings
0.6 - - 0.6 (0.3) - - (0.3) 0.3
Security and safety
equipment
5.8 0.6 (0.2) 6.2 (5.2) (0.5) 0.3 (5.4) 0.8
Telecommunication
equipment
10.1 0.9 - 11.0 (8.0) (1.4) - (9.4) 1.6
Motor vehicles 174.1 17.6 (15.8) 175.9 (112.8) (23.5) 15.3 (121.0) 54.9
Workshop
equipment
7.0
1.9 (0.7) 8.2
(5.3)
(1.0) 0.1 (6.2)
2.0
Leasehold
improvements
20.9 1.7 (0.9) 21.7 (15.4) (2.2) 1.0 (16.6) 5.1
Fixed assets under
construction
5.0 0.9 (0.7) 5.2 - - - - 5.2
Total 384.7 37.2 (23.3) 398.6 (244.4) (46.4) 20.6 (270.2) 128.4

WFP/EB.A/2018/6-A/1 41
Cost
Accumulated depreciation
Net
carrying
amount
At
31 Dec 2015
Additions Disposal/
transfers
At
31 Dec
2016
At
31 Dec
2015
Depreciation
expense
Disposal/
transfers
At
31 Dec
2016
At
31 Dec 2016
USD million
Buildings
Permanent 23.0 2.2 (0.1) 25.1 (2.7) (0.6) - (3.3) 21.8
Temporary 85.3 12.6 (1.8) 96.1 (49.1) (12.8) 1.4 (60.5) 35.6
Computer
equipment
10.9 1.1 (0.2) 11.8 (9.3) (1.1) 0.2 (10.2) 1.6
Office equipment 25.9 3.0 (0.7) 28.2 (20.5) (3.5) 0.6 (23.4) 4.8
Office fixtures and
fittings
0.4 0.2 - 0.6 (0.2) (0.1) - (0.3) 0.3
Security and safety
equipment
5.5 0.3 - 5.8 (4.5) (0.7) - (5.2) 0.6
Telecommunication
equipment
9.2 1.1 (0.2) 10.1 (6.7) (1.4) 0.1 (8.0) 2.1
Motor vehicles 161.0 18.4 (5.3) 174.1 (94.0) (23.5) 4.7 (112.8) 61.3
Workshop
equipment
6.8 0.3 (0.1) 7.0 (4.3) (1.0) - (5.3) 1.7
Leasehold
improvements
19.7 3.0 (1.8) 20.9 (14.8) (2.3) 1.7 (15.4) 5.5
Fixed assets under
construction
2.9 4.2 (2.1) 5.0 - - - - 5.0
Total 350.6 46.4 (12.3) 384.7 (206.1) (47.0) 8.7 (244.4) 140.3

WFP/EB.A/2018/6-A/1 42
88. In 2017 and 2016, major additions to PP&E were for temporary buildings and motor vehicles.
Net acquisitions (after disposals) for the period ended 31 December 2017 totalled
USD 13.9 million (USD 34.1 million at 31 December 2016) of which USD 1.5 million relate to
donated in-kind property, plant and equipment (USD 8.2 million at 31 December 2016). Net
carrying amount of PP&E is reported in the Statement of Financial Position and the
depreciation expense for the year of USD 46.4 million is reported in the Statement of
Financial Performance (USD 47.0 million in 2016).
89. Property, plant and equipment are capitalized if their cost is greater or equal to the
threshold limit set at USD 5,000. They are depreciated over the asset’s estimated useful life
using the straight line method. The threshold level is reviewed periodically.
90. Assets are reviewed annually to determine if there is any impairment in their value. The
review that was undertaken in 2017 did not result in any of the PP&E being impaired in
value.
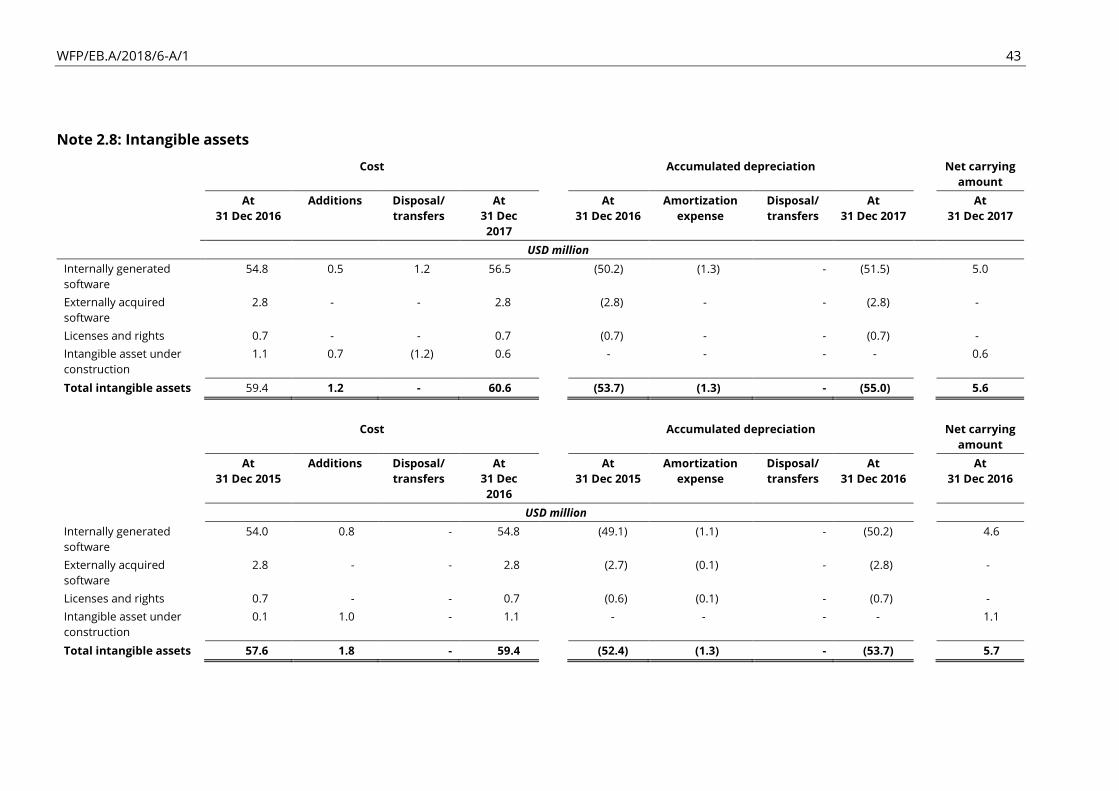
WFP/EB.A/2018/6-A/1 43
Note 2.8: Intangible assets
Cost
Accumulated depreciation
Net carrying
amount At
31 Dec 2016
Additions Disposal/
transfers
At
31 Dec
2017
At
31 Dec 2016
Amortization
expense
Disposal/
transfers
At
31 Dec 2017
At
31 Dec 2017
USD million
Internally generated
software
54.8 0.5 1.2 56.5 (50.2) (1.3) - (51.5) 5.0
Externally acquired
software
2.8 - - 2.8 (2.8) - - (2.8) -
Licenses and rights 0.7 - - 0.7 (0.7) - - (0.7) -
Intangible asset under
construction
1.1 0.7 (1.2) 0.6 - - - - 0.6
Total intangible assets 59.4 1.2 - 60.6 (53.7) (1.3) - (55.0) 5.6
Cost
Accumulated depreciation
Net carrying
amount At
31 Dec 2015
Additions Disposal/
transfers
At
31 Dec
2016
At
31 Dec 2015
Amortization
expense
Disposal/
transfers
At
31 Dec 2016
At
31 Dec 2016
USD million
Internally generated
software
54.0 0.8 - 54.8 (49.1) (1.1) - (50.2) 4.6
Externally acquired
software
2.8 - - 2.8 (2.7) (0.1) - (2.8) -
Licenses and rights 0.7 - - 0.7 (0.6) (0.1) - (0.7) -
Intangible asset under
construction
0.1 1.0 - 1.1 - - - - 1.1
Total intangible assets 57.6 1.8 - 59.4 (52.4) (1.3) - (53.7) 5.7

WFP/EB.A/2018/6-A/1 44
91. Intangible assets are capitalized if their cost exceeds the threshold of USD 5,000 except for
internally generated software, where the threshold is USD 100,000. The capitalized value of
internally generated software excludes those costs related to research and maintenance
costs.
92. Net carrying amount of intangible assets is reported in the Statement of Financial Position
while the amortization expense for the year of USD 1.3 million is reported in the Statement
of Financial Performance.
Note 2.9: Payables and accruals
2017 2016
USD million
Vendor payables 157.5 101.0
Donor payables 27.2 25.9
Miscellaneous 67.7 65.6
Subtotal payables 252.4 192.5
Accruals 402.5 365.3
Total payables and accruals 654.9 557.8
93. Payables to vendors relate to amounts due for goods and services for which invoices have
been received.
94. Payables to donors represent balance of unspent contributions for closed projects pending
refund or reprogramming.
95. Accruals are liabilities for goods and services that have been received or provided to WFP
during the year and which have not been invoiced by suppliers.
96. Miscellaneous payables include amounts due to staff and other United Nations agencies for
services received and the fair value of foreign exchange forward contracts.
Note 2.10: Deferred revenue
2017 2016
USD million
Composition:
Current 1 550.0 486.9
Non-current 378.2 499.3
Total deferred revenue 1 928.2 986.2
97. Deferred revenue represents contributions where revenue recognition has been deferred
to future financial periods since the year stipulated by the donor starts after the current
financial period.
98. The current portion denotes revenue deferred for contributions related to the next
12 months. The non-current portion denotes revenue deferred for contributions related to
the period beyond 12 months after the financial year-end.

WFP/EB.A/2018/6-A/1 45
99. In line with the accounting policy for contribution revenue as described in Note 1, deferred
revenue is reduced and contribution revenue is recognized in the Statement of
Financial Performance when the contribution year, as stipulated by the donor, starts.
100. The following table illustrates the composition of deferred revenue by contribution year, as
stipulated by the donor:
2017 2016
USD million
Contribution year
2021 17.2 10.3
2020 111.4 55.7
2019 249.6 139.0
2018 1 550.0 294.3
2017 - 486.9
Total deferred revenue 1 928.2 986.2
Note 2.11: Provisions
2017 2016
USD million
Provision for refunds to donors 6.3 7.0
101. The provision for refunds to donors estimates the level of refunds that are expected to be
given back to donors for unspent cash contributions to the project. The provision is based
on historical experience.
102. The change in the provision for refunds to donors during 2017 is as follows:
2016 Utilization Increase/
(decrease)
2017
USD million
Provision for refunds to donors 7.0 (17.4) 16.7 6.3
103. During 2017, refunds made to donors totalled USD 17.4 million. These refunds are recorded
as a utilization of the provision for refunds to donors and reported in the Statement of
Financial Position. At 31 December 2017, the estimated final provision required is
USD 6.3 million. Accordingly, an increase of USD 16.7 million was recorded as an adjustment
to monetary contribution revenue for the period and is reported in the Statement of
Financial Performance.

WFP/EB.A/2018/6-A/1 46
Note 2.12: Employee benefits
2017 2016 restated
USD million
Composition:
Current 36.9 7.8
Non-current 841.2 694.8
Total employee benefits liabilities 878.1 702.6
104. The adoption of IPSAS 39 as described in Note 1 has resulted in the removal of the corridor
approach, permitted under IPSAS 25 for post-employment benefits, and the full recognition
of the actuarial gains and losses arising from the defined benefit plans. In line with IPSAS 39
requirements, WFP restated 2016 opening and closing post-employment benefits amounts
to increase the employee benefit liabilities under these plans in the Statement of Financial
Position, and to recognize actuarial gains and losses arising from the post-employment
benefit plans in the Statement of Changes in Net Assets.
2017 2016 restated
Actuarial
valuation
WFP
valuation
Total
USD million
Short-term employee benefits 3.0 33.9 36.9 7.8
Post-employment benefits 766.0 1.5 767.5 595.1
Other long-term employee
benefits 68.6 5.1 73.7 99.7
Total employee benefits
liabilities 837.6 40.5 878.1 702.6
2.12.1 Short-term employee benefits
105. Short-term employee benefits consist of annual leave, education grants and incurred but
not paid amounts relating to all benefit plans. The benefits amounts incurred but not paid
were estimated by professional actuaries and accrued as short-term employee benefit
liabilities.
2.12.2 Post-employment benefits
106. Post-employment benefits are defined benefit plans consisting of After-Service Medical
Plans, Separation Payments Scheme and Compensation Plan Reserve Fund.
107. The After-Service Medical Plan (ASMP) allows eligible retirees and their eligible family
members to participate in the Basic Medical Insurance Plan (BMIP) or the Medical Insurance
Coverage Scheme (MICS) depending on which staff group they belong to. BMIP is provided
to staff members in professional category and general service category in headquarters.
MICS is provided to locally recruited staff members in country offices and regional bureaux.
The ASMP defined benefit obligation represents the present value of the share of the
organization’s medical insurance costs for retirees and active staff post-employment
benefits accrued to-date.
WFP/EB.A/2018/6-A/1 47
108. The Separation Payments Scheme is a plan to fund severance pay for WFP general service
staff at the duty stations in Italy.
109. The Compensation Plan Reserve Fund is a plan that provides compensation to all staff
members, employees and dependents in case of death, injury or illness attributable to the
performance of official duties and, in certain circumstances, to supplement the disability
and survivors’ pensions paid by the UNJSPF.
2.12.3 Other long-term employee benefits
110. Other long-term employee benefits consist of home leave travel and other
separation-related benefits. The other separation-related benefits comprise accrued leave,
death grants, repatriation grants and repatriation travel and removal expenses and are
payable when staff are no longer in service.
111. Post-employment benefits are established for two groups of staff: a) staff members who are
in the professional category and general service in headquarters; and b) WFP’s national
professional officers and general service staff members in the country offices and regional
bureaux (collectively, locally recruited staff members). Both groups of staff are covered by
the FAO Staff Rules and the United Nations Staff Rules.
2.12.4 Valuation of employee benefit liabilities
112. Employee benefit liabilities are measured by professional actuaries or calculated by WFP. At
31 December 2017, total employee benefit liabilities amounted to USD 878.1 million, of
which USD 837.6 million were calculated by the actuaries and USD 40.5 million were
calculated by WFP (USD 690.6 million and USD 12.0 million, respectively, at
31 December 2016 restated).
113. Of the total employee benefit liabilities of USD 878.1 million, the amount of
USD 516.9 million has been charged against relevant funds and projects (USD 455.2 million
at 31 December 2016 restated). The balance of liabilities in the amount of USD 361.2 million
has been allocated against the General Fund (USD 247.5 million at
31 December 2016 restated).
114. During the 2010 Annual Session, the Board approved a funding plan to provide for the
unfunded employee benefit liabilities currently allocated to the General Fund. The funding
plan includes an incremental annual funding of USD 7.5 million in the standard staff cost
over a 15-year period starting in 2011 with a view to achieving fully funded status at the end
of the 15-year period if all assumptions are realized.
2.12.5 Actuarial valuations of post-employment and other separation-related benefits
115. Liabilities arising from post-employment benefits (After-Service Medical Plans, Separation
Payments Scheme and Compensation Plan Reserve Fund) and Other separation-related
benefits are determined by professional actuaries on the basis of actuarial assumptions and
methods, reflecting the plan rules and benefit payments.
116. Post-employment benefits and other separation-related benefits liabilities which are
calculated by actuaries totalled USD 834.6 million at 31 December 2017 (USD 687.8 million
in 2016 restated), of which USD 580.1 million pertains to staff members who are in the
professional category and general service in headquarters (USD 508.4 million in 2016
restated) and USD 254.5 million pertains to the benefits for locally recruited staff members
(USD 179.4 million in 2016 restated).

WFP/EB.A/2018/6-A/1 48
117. Under IPSAS 39, the annual expense for post-employment benefits liabilities as determined
by the actuaries does not include amortization of actuarial gains/(losses) applied in previous
valuations under the corridor approach permitted under IPSAS 25. The full amount of
actuarial gains/(losses) for post-employment benefits is recognized instead in the Statement
of Changes in Net Assets. The actuarial gains/(losses) for other separation-related benefits
continue to be recognized as an expense in the Statement of Financial Performance for the
year in which they arise.
2.12.5.1 Actuarial assumptions and methods
118. Each year, WFP reviews and selects assumptions and methods that will be used by the
actuaries in the year-end valuation to determine the expense and contribution
requirements for WFP’s after-service benefit plans (post-employment benefits and other
separation-related benefits). For the 2017 valuation, the assumptions and methods used are
described in the following table which also indicates the assumptions and methods used for
the 2016 valuation.
119. The assumptions and methods adopted for the 2017 actuarial valuation, together with plan
experience since the prior valuation date, resulted in an increase in the post-employment
and other separation-related benefits net liabilities in the total amount of USD 146.8 million
(USD 116.9 million in 2016 restated).
120. The principal actuarial assumptions are required to be disclosed in the financial statements
in accordance with IPSAS 39. In addition, each actuarial assumption is required to be
disclosed in absolute terms.
121. The following assumptions and methods have been used to determine the value of
post-employment and other separation-related employee benefits liabilities for WFP at
31 December 2017.

WFP/EB.A/2018/6-A/1 49
Discount rate 2.7 percent for accounting and funding based on yield curve approach for plans
provided to staff members in professional category and general service category in
headquarters (3.0 percent in 2016 valuation)
4.0 percent based on yield curve approach for plans provided to locally recruited staff
members (4.7 percent in 2016 valuation)
Medical cost increases
(ASMP only)
BMIP – 4.6 percent per year during 2018, decreasing 0.1 percent every two years to
4.0 percent in 2030, and then decreasing 0.1 percent each year to 3.7 percent for 2033
and every year thereafter (5.0 percent per year during 2017, decreasing 0.1 every two
years to 4.4 percent in 2029, and then decreasing 0.1 percent every three years to 4.0 in
2041 and beyond)
MICS – 9.2 percent from 2018, decreasing by 0.3 percent each year to 7.1 percent in
2025, then decreasing by 0.2 percent each year to 5.1 percent in 2035, and then
decreasing by 0.1 percent each year until it reaches 4.0 percent in 2046 and beyond
(same as in 2016 valuation)
Annual salary scale 3.5 percent plus merit component
Annual cost of living
increases
1.9 percent for the International Staff and 2.2 percent for the National Staff (2.5 percent
for the 31 December 2016 valuation)
Future exchange rates United Nations rates at 31 December 2017
Mortality rates Mortality rates match the 31 December 2017 valuation of the UNJSPF
Disability rates Disability rates match the 31 December 2017 valuation of the UNJSPF
Withdrawal rates Based on a study of WFP’s withdrawal rates from 2009 to 2013
Retirement rates Based on a study of WFP’s withdrawal rates from 2009 to 2013
Actuarial method After-Service Medical Plans, Separation Payments Scheme, and Staff Compensation
Plan: Projected unit credit with an attribution period from the entry on duty date to the
date of full eligibility for benefits.
Other Separation-Related Payments Schemes: For accrued leave, projected unit credit
with an attribution period from the entry on duty date to separation. In 2016 valuation,
Accrued leave used projected unit credit with all liability attributed to past service.
For repatriation travel and removal, projected unit credit with an attribution period
from the entry on duty date to separation. For repatriation grant and death grant,
projected unit credit with an attribution based on the actual benefit formula
122. The following tables provide additional information and analysis in relation to employee
benefits liabilities, as calculated by the actuaries.

WFP/EB.A/2018/6-A/1 50
2.12.5.2 Reconciliation of defined benefit obligation
After-Service
Medical Plans
Other
separation-
related
benefits
Separation
Payments
Scheme
Compensation
Plan
Reserve Fund
Total
USD million
Defined benefit obligation
at 31 December 2016
(restated)
561.3 94.3 20.1 12.1 687.8
Service cost for 2017 36.1 3.8 1.6 0.5 42.0
Interest cost for 2017 19.6 2.9 0.6 0.4 23.5
Actual gross benefit
payments for 2017
(5.1) (7.4) (2.8) (0.5) (15.8)
Participant contributions 1.7 - - - 1.7
Change in accrued leave
attribution
- (21.6) - - (21.6)
Exchange rate movements 36.0 0.3 2.8 - 39.1
Other actuarial (gains) losses 80.0 (3.7) 0.6 1.0 77.9
Defined benefit obligation
at 31 December 2017
729.6 68.6 22.9 13.5 834.6
2.12.5.3 Annual expense for calendar year 2017
After-service
medical plans
Other
separation-
related
benefits
Separation
payments
scheme
Compensation
plan
reserve fund
Total
USD million
Service cost 36.1 3.8 1.6 0.5 42.0
Interest cost 19.6 2.9 0.6 0.4 23.5
Actuarial (gains) losses - (3.4) - - (3.4)
Total expense 55.7 3.3 2.2 0.9 62.1

WFP/EB.A/2018/6-A/1 51
2.12.5.4 Reconciliation of present value of defined benefit obligation
After-service
medical plans
Other
separation-
related
benefits
Separation
payments
scheme
Compensation
plan
reserve fund
Total
USD million
Defined benefit obligation
Inactive 203.9 - - 10.5 214.5
Active 525.7 68.6 22.9 3.0 620.1
Total 729.6 68.6 22.9 13.5 834.6
(Gain) loss on defined
benefit obligation
116.0 (3.4) 3.4 1.0 117.0
2.12.6 Employee benefits liability – sensitivity analysis
123. The principle assumption in the valuation of all employee benefit plans is the discount rate.
Sensitivity analysis for the discount rate for the employee benefits liabilities is presented in
the following table.
After-
Service
Medical
Plans
Other
separation-
related
benefits
Separation
payments
scheme
Staff
Compensation
Plan
Total
Defined benefit obligation USD million
Current discount rate assumption
minus 1%
951.3 74.8 25.0 16.4 1 067.5
Current discount rate assumption 729.6 68.6 22.9 13.5 834.6
Current discount rate assumption
plus 1%
570.3 63.1 21.0 11.4 665.8
2.12.6.1 After-Service Medical Plans – sensitivity analysis
124. Three principal assumptions in the valuation of the After-Service Medical Plans are: i) the
rate at which medical costs are expected to increase in the future; ii) the exchange rate
between the U.S. dollar and the euro; and iii) the discount rate used to determine the
present value of benefits that will be paid from the plan in the future.

WFP/EB.A/2018/6-A/1 52
125. Sensitivity analysis for each of these significant assumptions for BMIP is presented in the
following table.
Long-term medical inflation per year
Exchange rate Discount rate 2.7% 3.7% 4.7%
USD million
1.095 USD per EUR 3.7%
289.7 359.8 453.2
1.195 USD per EUR 3.7%
307.2 381.6 480.6
1.295 USD per EUR 3.7%
324.7 403.4 508
1.095 USD per EUR 2.7%
361.8 456.7 584.8
1.195 USD per EUR 2.7%
383.7 484.3 620.1
1.295 USD per EUR 2.7%
405.6 512.0 655.6
1.095 USD per EUR 1.7%
460.4 591.0 769.8
1.195 USD per EUR 1.7%
488.2 626.8 816.4
1.295 USD per EUR 1.7%
516.1 662.6 863.00
126. The results assume that claims costs and premium rates would increase by the same
percentage as the medical inflation, but that all other assumptions would be unaffected.
127. Sensitivity analysis for the actuarial estimates for MICS is presented in the following table.
Long-term medical inflation per year
Discount rate 3.0% 4.0% 5.0%
USD million
5.0% 148.0 188.7 243.5
4.0% 190.0 245.3 321.3
3.0% 247.0 324.6 431.7
2.12.7 Expected costs during 2018
128. The expected contribution of WFP in 2018 to the defined benefits plans is USD 14.1 million
which is determined based on expected benefit payments for that year.
After-
Service
Medical
Plans
Other
separation-
related
benefits
Separation
payments
scheme
Staff
Compensation
Plan
Total
USD million
Expected organization
contributions during 2018
5.4 6.6 1.7 0.4 14.1

WFP/EB.A/2018/6-A/1 53
2.12.8 United Nations Joint Staff Pension Fund
129. The Fund’s Regulations state that the Pension Board shall have an actuarial valuation made
of the Fund at least once every three years by the Consulting Actuary. The practice of the
Pension Board has been to carry out an actuarial valuation every two years using the Open
Group Aggregate Method. The primary purpose of the actuarial valuation is to determine
whether the current and estimated future assets of the Pension Fund will be sufficient to
meet its liabilities.
130. WFP’s financial obligation to the UNJSPF consists of its mandated contribution, at the rate
established by the United Nations General Assembly (currently at 7.9 percent for
participants and 15.8 percent for member organizations) together with any share of any
actuarial deficiency payments under Article 26 of the Regulations of the Fund. Such
deficiency payments are only payable if and when the United Nations General Assembly has
invoked the provision of Article 26, following determination that there is a requirement for
deficiency payments based on an assessment of the actuarial sufficiency of the Fund as of
the valuation date. Each member organization shall contribute to this deficiency an amount
proportionate to the total contributions which each paid during the three years preceding
the valuation date.
131. During 2017, the Fund identified that there were anomalies in the census data utilized in the
actuarial valuation performed as of 31 December 2015. As such, as an exception to the
normal biannual cycle, a roll forward of the participation data as of 31 December 2013 to
31 December 2016 was used by the Fund for their 2016 financial statements. An actuarial
valuation as of 31 December 2017 is currently being performed.
132. The roll forward of the participation data as of 31 December 2013 to 31 December 2016
resulted in a funded ratio of actuarial assets to actuarial liabilities, assuming no future
pension adjustments, of 150.1 percent (127.5 in the 2013 valuation). The funded ratio was
101.4 percent (91.2 percent in the 2013 valuation) when the current system of pension
adjustments was taken into account.
133. After assessing the actuarial sufficiency of the Fund, the Consulting Actuary concluded that
there was no requirement, as of 31 December 2016, for deficiency payments under
Article 26 of the Regulations of the Fund as the actuarial value of assets exceeded the
actuarial value of all accrued liabilities under the Fund. In addition, the market value of
assets also exceeded the actuarial value of all accrued liabilities as of the valuation date. At
the time of this report, the General Assembly has not invoked the provision of Article 26.
134. Should Article 26 be invoked due to an actuarial deficiency, either during the ongoing
operation or due to the termination of the UNJSPF pension plan, deficiency payments
required from each member organization would be based upon the proportion of that
member organization’s contributions to the total contributions paid to the UNJSPF during
the preceding three years (2014, 2015 and 2016) amounted to USD 6,751.0 million, of which
4 percent was contributed by WFP.
135. During 2017, WFP’s contributions paid to the UNJSPF amounted to USD 97.5 million.
Expected contributions due in 2018 are USD 100.7 million.
136. Membership of the Fund may be terminated by decision of the United Nations
General Assembly, upon the affirmative recommendation of the Pension Board. A
proportionate share of the total assets of the Fund at the date of termination shall be paid
to the former member organization for the exclusive benefit of its staff who were
participants in the Fund at that date, pursuant to an arrangement mutually agreed between
the organization and the Fund. The amount is determined by the UNJSPF Board based on

WFP/EB.A/2018/6-A/1 54
an actuarial valuation of the assets and liabilities of the Fund on the date of termination; no
part of the assets which are in excess of the liabilities are included in the amount.
137. The United Nations Board of Auditors carries out an annual audit of the UNJSPF and reports
to the UNJSPF Board on the audit every year. The UNJSPF publishes quarterly reports on its
investments and these can be viewed by visiting the UNJSPF at www.unjspf.org.
2.12.9 Social security arrangements for employees under service contracts
138. WFP employees under service contracts are entitled to social security based on local
conditions and norms. WFP, however, has not undertaken any global arrangement for social
security under service contracts. Social security arrangements can either be obtained from
the national security system, private local schemes or as cash compensation for own
scheme. The provision of proper social security in line with local labour legislation and
practice is a key requirement of the service contract. Service contract holders are not WFP
staff members and are not covered by the FAO and United Nations Staff Rules and
Regulations.
Note 2.13: Loan
2017 2016
USD million
Current portion of loan 5.7 5.7
Non-current portion of loan 72.4 78.1
Total loan 78.1 83.8
139. In December 2000, an agreement was reached between a major donor and WFP regarding
a scheme to facilitate the provision of food assistance to two country projects. Under the
scheme, the donor gave a contribution in cash of USD 164.1 million, of which
USD 106.0 million was used to purchase food commodities against a long-term loan
contract with a government agency of the donor country.
140. The loan is payable over 30 years and interest on the loan is at the rate of 2 percent per year
for the first ten years and 3 percent per year on the declining balance each year thereafter.
Current portion of long-term loan includes an annual principal amount of USD 5.3 million
and an amortization cost of USD 0.4 million using the effective interest method. Investments
in US Treasury STRIPS (Note 2.6) acquired in 2001 are held to maturity up to 2031 for the
payment of interest and principal of the commodity loan of USD 106.0 million.
141. The loan is reflected at amortized cost using the effective interest rate of 2.44 percent. At
31 December 2017, total amortized cost was USD 78.1 million (USD 83.8 million at
31 December 2016) with an amount due within one year of USD 5.7 million and a long-term
portion of USD 72.3 million (USD 5.7 million and USD 78.1 million, respectively in 2016).
142. Interest expense during 2017 totalled USD 1.9 million (USD 2.1 million at 31 December 2016)
as reflected in the Statement of Financial Performance, of which USD 2.3 million represents
the annual interest paid in May 2017 and USD (0.4) million represents the amortized cost
resulting from the recognition of the long-term loan to its net present value.
143. In the Statement of Cash Flow, interest paid during the year in the amount of USD 2.4 million
is presented under financing activities, while amortized interest of USD (0.4) million is
presented under reconciliation to net cash flows from operating activities.

WFP/EB.A/2018/6-A/1 55
Note 2.14: Financial instruments
2.14.1 Nature of financial instruments
144. Details of the significant accounting policies and methods adopted, including the criteria for
recognition and de-recognition, the basis of measurement and the basis on which gains and
losses are recognized in respect of each class of financial asset and financial liability are set
out in Note 1.
145. The financial assets of WFP are categorized as follows:
2017 2016
USD million
Financial assets at fair value through surplus or
deficit
1 199.3 1 170.4
Held-to-maturity investments 65.2 69.1
Loans and receivables 5 103.3 3 950.5
Available-for-sale financial assets 568.7 443.4
Subtotal 6 936.5 5 633.4
Non-financial assets 1 043.0 988.6
Total 7 979.5 6 622.0
146. Financial assets at fair value through surplus or deficit are categorized as held-for-trading.
147. All material financial liabilities are stated at amortized cost.
148. The following table presents the WFP assets that are measured at fair value at 31 December
2017 and 2016, respectively.
2017
2016
Level 1 Level 2 Level 3 Total Level 1 Level 2 Level 3 Total
USD million
USD million
Financial assets
at fair value
through surplus
or deficit
- 1 199.3 - 1 199.3 - 1 169.4 1.0 1 170.4
Available-for-sale
financial assets 263.4 304.2 1.1 568.7 224.3 217.2 1.9 443.4
Total 263.4 1 503.5 1.1 1 768.0 224.3 1 386.6 2.9 1 613.8
149. The different levels of fair value have been defined as follows: Quoted prices (unadjusted)
in active markets for identical assets (Level 1). Inputs other than quoted prices included
within Level 1 that are observable for the asset, either directly (that is, as prices) or indirectly
(that is, derived from prices) (Level 2). Inputs for the asset that are not based on observable
market data (that is, unobservable inputs) (Level 3).
150. WFP investment guidelines are conservative in nature with the primary objective being
capital preservation and liquidity. Both the held-for-trading and the available-for-sale

WFP/EB.A/2018/6-A/1 56
financial assets are rated high quality as per international credit ratings (Note 2.14.2 –
Credit risk). Investment managers are bound by WFP investment guidelines that require
them to select highly liquid securities for the investment portfolios. Fair value levels largely
depend on whether an active market exists for a security. Active markets provide direct data
inputs and may, on average, provide better liquidity, lowering trading costs via tighter bid
and ask prices. A different fair value level does not necessarily imply a different or higher
level of risk for a security, all things being equal. The fair value hierarchy reflects the nature
of the inputs used in determining fair values, but not the level of risk inherent in a security
as the probability of a partial or full default on cash flows from issuers or counterparts is
independent from the fair value level category.
151. The following table presents the changes in Level 3 financial instruments for the years ended
31 December 2017 and 2016, respectively.
2017
2016
Financial
assets at fair
value through
surplus or
deficit
Available-
for-sale
financial
assets
Total
Financial
assets at fair
value through
surplus or
deficit
Available-
for-sale
financial
assets
Total
USD million
USD million
Opening balance 1.0 1.9 2.9
9.4 - 9.4
Gains (losses) recognized
in Statement of Net
Assets - 0.2 0.2
- (0.1) (0.1)
Purchases - 1.1 1.1
1.0 3.0 4.0
Sales - (1.0) (1.0)
- (1.0) (1.0)
Capital change - - -
(9.4) - (9.4)
Transfer (1.0) (1.1) (2.1)
- - -
Closing balance - 1.1 1.1
1.0 1.9 2.9
152. During 2017, USD 2.1 million transferred from Level 3 to Level 2 due to an increase in the
availability of market data in relation to two corporate bonds.
2.14.2 Credit risk
153. WFP’s credit risk associated with investments is spread widely and WFP’s risk management
policies limit the amount of credit exposure to any one counterparty and include minimum
credit quality guidelines. The short-term investments have credit quality at year end of AA
and the long-term investments have credit quality at year end of A+.
154. Credit risk and liquidity risk associated with cash and cash equivalents is minimized
substantially by ensuring that these financial assets are placed in highly liquid and
diversified money market funds with AAA credit ratings and/or with major financial
institutions that have been accorded strong investment grade ratings by a primary rating
agency and/or with other creditworthy counterparties.
155. Contributions receivable comprise primarily amounts due from sovereign nations. Details
of contributions receivable, including allowances for reductions in contribution revenue and
doubtful accounts are provided in Note 2.3.

WFP/EB.A/2018/6-A/1 57
2.14.3 Interest rate risk
156. WFP is exposed to interest rate risk through short-term investments and long-term bonds.
At 31 December 2017, the effective interest rates of these two investment portfolios were
1.80 percent and 1.97 percent, respectively (1.20 percent and 1.78 percent, respectively, in
2016). A measurement of interest rate sensitivity indicates that the effective duration is
0.71 years for the short-term investments and 6.48 years for the long-term bonds
(0.62 years and 6.09 years, respectively, in December 2016). Fixed income derivatives are
used by external investment managers to manage interest rate risk under strict investment
guidelines.
2.14.4 Foreign currency risk
157. At 31 December 2017, 92 percent of cash, cash equivalent and investments are
denominated in the US dollar base currency and 8 percent are denominated in Euros and
other currencies (90 percent in the US dollar base currency and 9 percent in Euros and
remaining 1 percent in other currencies at 31 December 2016). Non-US dollar holdings have
the primary objective of supporting operating activities. In addition, 59 percent of
contributions receivable is denominated in the US dollar base currency, 23 percent is
denominated in Euros, 5 percent in Canadian dollars and 13 percent is denominated in other
currencies (66 percent in the US dollar base currency, 18 percent in Euros, 8 percent in
Canadian dollars and 8 percent in other currencies at 31 December 2016).
158. Foreign exchange forward contracts are used to hedge the Euro versus US dollar exchange
exposure on programme support and administrative staff costs incurred at headquarters in
line with the hedging policy approved by the Board at its Annual Session in 2008. During the
year ended 31 December 2017, 12 contracts were settled at a realized gain of USD 0.3 million
(12 contracts were settled during the year ended 31 December 2016 at a realized gain of
USD 0.1 million). In addition, a new hedging strategy was implemented for 2018, in which
WFP entered into 12 foreign exchange forward contracts to purchase a total of
Euro 51.2 million over 12 months at a fixed exchange rate. At 31 December 2017, the
12 contracts have a notional amount of USD 59.2 million and an unrealized gain of
USD 3.1 million using the forward rate at 31 December 2017. Both the realized loss and
unrealized loss are included in currency exchange differences presented in the Statement
of Financial Performance.
2.14.5 Market risk
159. WFP is subject to market risk in both the short-term and long-term investments. The value
of its fixed income, equity, financial derivatives and foreign exchange forwards may change
on a daily basis. All of the sensitivity analyses provided below have been prepared on the
basis that all variables are held constant, other than that specifically mentioned.
160. Interest rate sensitivity – For short-term investments, if interest rates were to rise (fall) by
1 percent, the impact to the Statement of Financial Performance is a USD 13.5 million
unrealized loss (gain). For long-term bond portfolio, if interest rates were to rise (fall) by
1 percent, the impact to the Statement of Changes in Net Assets is a USD 18.4 million
unrealized loss (gain).

WFP/EB.A/2018/6-A/1 58
161. Futures price sensitivity – For short-term investments, if futures prices were to rise (fall) by
1 percent, the impact to the Statement of Financial Performance is a USD 0.01 million
unrealized loss (gain). For long-term bond portfolio, if futures prices were to rise (fall) by
1 percent, the impact to the Statement of Changes in Net Assets is a USD 0.2 million
unrealized gain (loss).
162. Equity price sensitivity – The equity investments track the MSCI All Country World Index, a
recognized index of stocks of all world markets. If equity prices were to rise (fall) by 1 percent
proportionally across the six regional equity funds, the impact to the Statement of Changes
in Net Assets is a USD 2.9 million unrealized gain (loss).
163. Foreign Exchange forwards sensitivity - For the remaining 12 PSA hedge forward contracts,
if USD/EUR rate were to rise (fall) by 1 percent, the impact to the Statement of
Financial Performance is a USD 0.6 million unrealized gain (loss), with all other variables held
constant. For long-term investments, if foreign currency prices were to appreciate
(depreciate) versus the USD by 1 percent across the forward currency positions currently
held, the impact to the Statement of Financial Performance is a USD 0.5 million unrealized
loss (gain).
Note 2.15: Fund balances and reserves
164. Fund balances represent the unexpended portion of contributions that are intended to be
utilized in future operational requirements of the Programme. These are WFP’s residual
interest in WFP’s assets after deducting all its liabilities. The following table presents WFP’s
fund balances.
2017 Programme
category
funds
Bilateral
operations
and trust
funds
General Fund and
Special Accounts
Total
(fund
balance)
(fund
balance)
(fund
balance)
Reserves
Opening balance at 1 January 2017
(restated)
3 761.0 225.4 (31.5) 329.7 4 284.6
Surplus (deficit) for the year (333.0) (66.7) 611.4 - 211.7
Movements in fund balances and reserves
in 2017
Advances to projects 154.2 - - (154.2) -
Repayments by projects (114.5) - - 114.5 -
Other transfer from/to reserves - - (90.4) 90.4 -
Transfer between funds 225.1 25.7 (250.8) - -
Actuarial gains (losses) on employee benefit
liabilities
- - (120.4) - (120.4)
Net unrealized gains (losses) on long-term
investments
- - 58.0 - 58.0
Total movements during the year 264.8 25.7 (403.6) 50.7 (62.4)
Closing balance at 31 December 2017 3 692.8 184.4 176.3 380.4 4 433.9
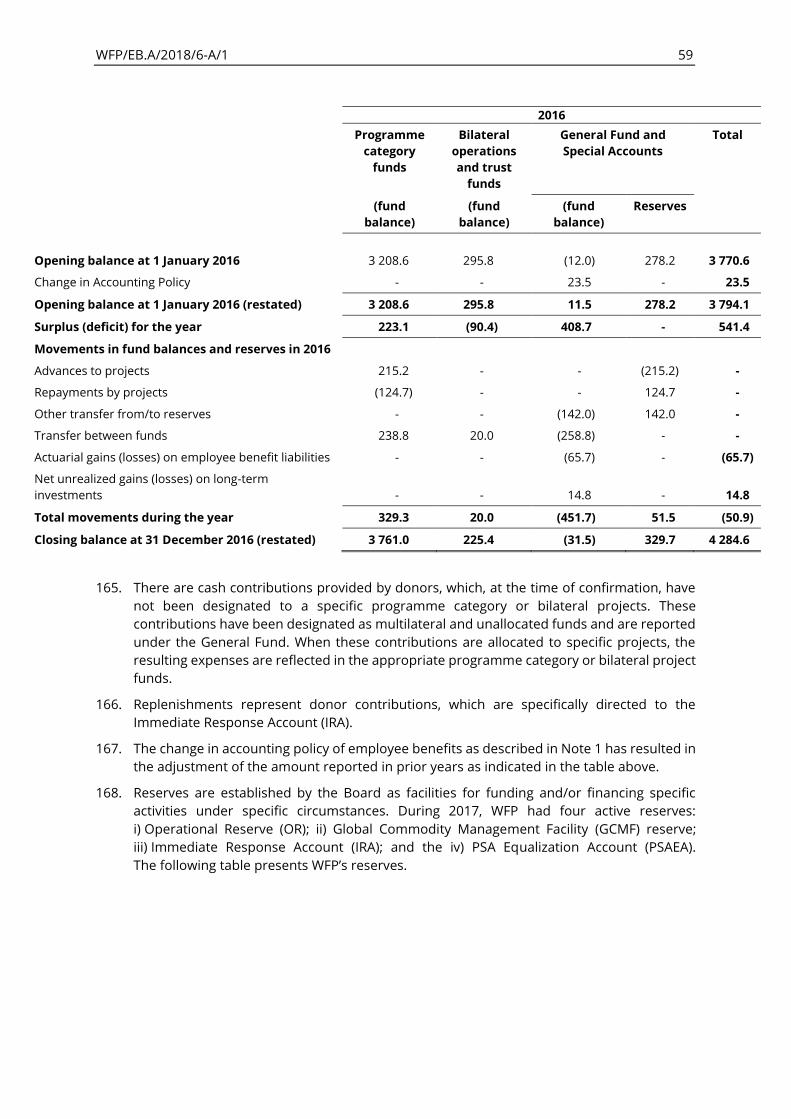
WFP/EB.A/2018/6-A/1 59
2016
Programme
category
funds
Bilateral
operations
and trust
funds
General Fund and
Special Accounts
Total
(fund
balance)
(fund
balance)
(fund
balance)
Reserves
Opening balance at 1 January 2016 3 208.6 295.8 (12.0) 278.2 3 770.6
Change in Accounting Policy - - 23.5 - 23.5
Opening balance at 1 January 2016 (restated) 3 208.6 295.8 11.5 278.2 3 794.1
Surplus (deficit) for the year 223.1 (90.4) 408.7 - 541.4
Movements in fund balances and reserves in 2016
Advances to projects 215.2 - - (215.2) -
Repayments by projects (124.7) - - 124.7 -
Other transfer from/to reserves - - (142.0) 142.0 -
Transfer between funds 238.8 20.0 (258.8) - -
Actuarial gains (losses) on employee benefit liabilities - - (65.7) - (65.7)
Net unrealized gains (losses) on long-term
investments - - 14.8 - 14.8
Total movements during the year 329.3 20.0 (451.7) 51.5 (50.9)
Closing balance at 31 December 2016 (restated) 3 761.0 225.4 (31.5) 329.7 4 284.6
165. There are cash contributions provided by donors, which, at the time of confirmation, have
not been designated to a specific programme category or bilateral projects. These
contributions have been designated as multilateral and unallocated funds and are reported
under the General Fund. When these contributions are allocated to specific projects, the
resulting expenses are reflected in the appropriate programme category or bilateral project
funds.
166. Replenishments represent donor contributions, which are specifically directed to the
Immediate Response Account (IRA).
167. The change in accounting policy of employee benefits as described in Note 1 has resulted in
the adjustment of the amount reported in prior years as indicated in the table above.
168. Reserves are established by the Board as facilities for funding and/or financing specific
activities under specific circumstances. During 2017, WFP had four active reserves:
i) Operational Reserve (OR); ii) Global Commodity Management Facility (GCMF) reserve;
iii) Immediate Response Account (IRA); and the iv) PSA Equalization Account (PSAEA).
The following table presents WFP’s reserves.

WFP/EB.A/2018/6-A/1 60
2017
OR GCMF IRA PSAEA Total
Note 2.15.1 2.15.2 2.15.3 2.15.4
Opening balance at 1 January 2017 95.2 6.0 16.1 212.4 329.7
Advances to projects - - (154.2) - (154.2)
Repayments by projects - - 114.5 - 114.5
Approved Board allocations - - - (13.5) (13.5)
Repayment of unspent Board
allocations
- - - 0.4 0.4
Write-off of loan (2.2) - - - (2.2)
Replenishments - - 33.2 - 33.2
Transfer from PSAEA to IRA - - 15.0 (15.0) -
Surplus of ISC revenue from PSA
expense
- - - 72.5 72.5
Total movements during the year (2.2) - 8.5 44.4 50.7
Closing balance at
31 December 2017
93.0 6.0 24.6 256.8 380.4
169. Movements in the reserves are charged directly against the reserve accounts.
2.15.1 Operational Reserve
170. Financial Regulation 10.5 calls for the maintenance of an Operational Reserve to ensure the
continuity of operations in the event of a temporary shortfall of resources. In addition, the
Operational Reserve is used to manage the risk associated with the Internal Project Lending
Facility (previously referred to as the Working Capital Financing Facility).
171. In 2017, the Executive Director approved a write-off on non-recoverable loan from the
Internal Project Lending Facility against the Operational Reserve.
172. The balance of the Operational Reserve at 31 December 2017 is USD 93.0 million, and below
its approved level of USD 95.2 million.
2.15.2 Global Commodity Management Facility reserve
173. The Global Commodity Management Facility reserve account was established in 2014 as a
result of a comprehensive review of the Working Capital Financing Facility to back internal
lending under the Global Commodity Management Facility (Decision 2014/EB.A/8).
174. The balance of the Global Commodity Management Facility Reserve at 31 December 2017 is
USD 6.0 million.
2.15.3 Immediate Response Account
175. The IRA was established as a flexible resource facility to enable WFP to respond quickly to
emergency needs for food and for non-food-related purchase and delivery costs.
176. In 2017, the IRA received USD 33.2 million in replenishments. In addition, the
USD 15.0 million transfer from the PSA Equalization Account to the Immediate Response
Account was based on the WFP Management Plan (2017–2019) (Decision 2016/EB.2/6 iv).
177. Advances made to projects totalled USD 154.2 million and repayments by projects
amounted to USD 114.5 million.

WFP/EB.A/2018/6-A/1 61
178. The IRA balance at 31 December 2017 is USD 24.6 million, which is below the target level of
USD 200.0 million as established by the Executive Board Decision 2014/EB.2/4.
179. Outstanding advances to projects made by the IRA at 31 December 2017 totalled
USD 89.5 million (USD 148.9 million in 2016).
2.15.4 Programme Support and Administrative Budget Equalization Account
180. The PSAEA is a reserve set up to record the difference between indirect support costs
revenue and PSA expenses for the financial period.
181. Unspent balances totalling USD 0.4 million pertaining to allocations approved by the Board
from PSAEA in previous periods were returned back to the PSAEA in 2017 pursuant to
Financial Regulation 9.9.
182. The excess of ISC revenue over PSA expenses totalling USD 72.5 million was transferred to
the PSAEA in 2017 (USD 108.8 million surplus in 2016).
183. The PSAEA balance at 31 December 2017 is USD 256.8 million.

WFP/EB.A/2018/6-A/1 62
Note 3: Revenue
2017 2016
USD million
3.1 Monetary contributions
Contributions for direct costs 5 407.3 5 021.1
ISC contributions 401.2 382.4
Subtotal 5 808.5 5 403.5
Less:
Refunds, reprogrammes and reductions in contribution
revenue
(193.7) (103.1)
Total monetary contributions 5 614.8 5 300.4
3.2 In-kind contributions
Commodities in-kind contributions 352.5 442.0
Services and non-food items in-kind contributions 31.6 32.0
Subtotal 384.1 474.0
Add (deduct):
Increase (decrease) in contribution revenue 1.0 (3.3)
Total in-kind contributions 385.1 470.7
3.3 Currency exchange differences 231.0 (31.3)
3.4 Return on investments
Net realized gains (losses) on investments 9.5 (7.8)
Net unrealized gains on investments 8.5 1.7
Interest earned 33.0 26.4
Total return on investments 51.0 20.3
3.5 Other revenue
Revenue generated from provision of goods and services 128.4 119.4
Miscellaneous revenue 20.6 29.4
Total other revenue 149.0 148.8
Total revenue 6 430.9 5 908.9
184. Contribution revenue is adjusted by changes in the levels of the allowance for reduction in
contribution revenue (Note 2.3) and in the level of the provision for refunds to donors
(Note 2.11). Actual refunds and reduction in contribution revenue are made against specific
contributions.
185. In-kind contributions represent confirmed contributions of food commodities, services or
non-food items during the year.

WFP/EB.A/2018/6-A/1 63
186. During 2017, other revenue amounted to USD 149.0 million of which USD 128.4 million was
generated from the provision of goods and services (USD 119.4 million at
31 December 2016) and USD 20.6 million from miscellaneous revenue (USD 29.4 million at
31 December 2016). Revenue generated from the provision of goods and services included
mainly air operations, provisions of goods and services by the United Nations Humanitarian
Response Depot and the Logistics Services Special Account. Miscellaneous revenue included
proceeds from sale of damaged commodities and other unserviceable properties.

WFP/EB.A/2018/6-A/1 64
Note 4: Expenses
2017 2016 (restated)
USD million
4.1 Cash-based transfers distributed
Cash and voucher transfers 1 368.7 856.2
Commodity voucher transfers 77.4 26.1
Cash-based transfers distributed 1 446.1 882.3
4.2 Food commodities distributed 2 197.5 2 051.1
4.3 Distribution and related services 664.4 641.4
4.4 Wages, salaries, employee benefits and other staff costs
International and national staff 644.3 608.6
Consultants 123.0 108.2
United Nations volunteers 2.5 3.5
Temporary staff 89.9 84.3
Other personnel costs 24.3 22.1
Total wages, salaries, employee benefits and other staff
costs
884.0 826.7
4.5 Supplies, consumables and other running costs
Telecommunications and Information Technology 13.9 11.1
Equipment 106.5 99.4
Office supplies and consumables 19.5 24.4
Utilities 7.4 7.2
Vehicle maintenance and running costs 27.1 28.7
Total supplies, consumables and other running costs 174.4 170.8
4.6 Contracted and other services
Air operations 336.8 315.5
Other contracted services 335.8 282.3
Telecommunications/IT related services 30.2 31.5
Security and other services 22.1 24.0
Leases 34.6 36.2
Total contracted and other services 759.5 689.5
4.7 Finance costs 1.9 2.1
4.8 Depreciation and amortization 47.7 48.3
4.9 Other expenses
Maintenance services 5.3 6.6
Insurance 15.4 7.8
Bank charges/investment manager and custodian fees 4.2 3.5
Impairment and write-offs (0.1) 15.4
Other 18.9 22.0
Total other expenses 43.7 55.3
Total expenses 6 219.2 5 367.5

WFP/EB.A/2018/6-A/1 65
187. Food commodities distributed include cost of commodities as well as transport and related
costs between the country in which WFP takes possession and the recipient country.
Included in the cost of commodities distributed are post-delivery losses of USD 14.2 million
(USD 21.1 million in December 2016) (Note 9).
188. Given WFP’s accounting policy to expense when food is handed over to the cooperating
partners, at 31 December 2017, USD 87 million (121,914 mt) of food held by cooperating
partners was yet to be distributed to beneficiaries (USD 67.9 million (93,543 mt) at
31 December 2016).
189. Distribution and related services represent cost of moving commodities in-country up to
and including final distribution.
190. Wages, salaries, employee benefits and other staff costs are for WFP staff, consultants and
service contract holders and include employee and consultant travel, training and staff
workshops, and incentives.
191. Supplies, consumables and other running costs used are cost of goods and services used
for both direct project implementation and administration and support.
Note 5: Statement of cash flow
192. Cash flows from operating activities are not adjusted for donations of commodities-in-kind
or services-in-kind as these donations have no impact on cash movements. Cash flows from
investing activities are shown net of items where the turnover is rapid, the amounts are
large and the maturities are short.
Note 6: Statement of comparison of budget and actual amounts
193. WFP’s budget and financial statements are prepared using different bases. The Statement
of Financial Position, Statement of Financial Performance, Statement of Changes in Net
Assets and Statement of Cash Flow are prepared on a full accrual basis using a classification
based on the nature of expenses in the Statement of Financial Performance, whereas the
Statement of Comparison of Budget and Actual Amounts is prepared on a commitment
accounting basis.
194. As required under IPSAS 24, Presentation of Budget Information in Financial Statements, the
actual amounts presented on a comparable basis to the budget shall, where the financial
statements and the budget are not prepared on a comparable basis, be reconciled to the
actual amounts presented in the financial statements, identifying separately any basis,
timing and entity differences. There may also be differences in formats and classification
schemes adopted for presentation of financial statements and the budget.
195. Budget amounts have been presented on a functional classification basis in accordance with
the Management Plan (2017–2019), which presents a breakdown of the budget by year.
196. Statement V includes a column – Prioritized Plan – which represents a prioritized plan of
work based on estimated forecast contributions taking into account the fact that WFP is a
voluntarily funded organization and its operations and financial management therefore
depend on the level of funding actually received. The prioritized plan of work includes direct
project and CSP costs, the regular programme support and administrative costs and critical
corporate initiatives approved by the Executive Board in November 2016
(WFP/EB.2/2016/5-A/1/Rev.2).
197. Explanations of material differences between the original budget and final budget, final
budget and the actual amounts and Prioritized Plan and the actual amounts are presented
under the Financial and Budget Analysis section of the Executive Director’s Statement.
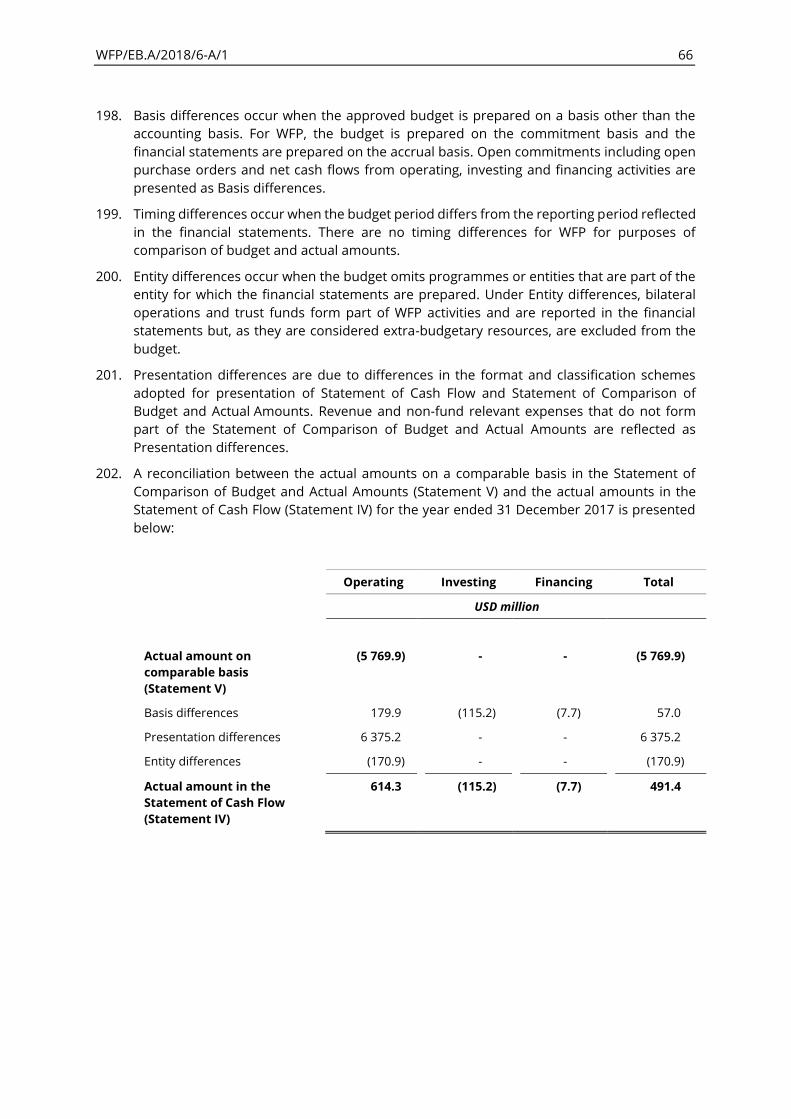
WFP/EB.A/2018/6-A/1 66
198. Basis differences occur when the approved budget is prepared on a basis other than the
accounting basis. For WFP, the budget is prepared on the commitment basis and the
financial statements are prepared on the accrual basis. Open commitments including open
purchase orders and net cash flows from operating, investing and financing activities are
presented as Basis differences.
199. Timing differences occur when the budget period differs from the reporting period reflected
in the financial statements. There are no timing differences for WFP for purposes of
comparison of budget and actual amounts.
200. Entity differences occur when the budget omits programmes or entities that are part of the
entity for which the financial statements are prepared. Under Entity differences, bilateral
operations and trust funds form part of WFP activities and are reported in the financial
statements but, as they are considered extra-budgetary resources, are excluded from the
budget.
201. Presentation differences are due to differences in the format and classification schemes
adopted for presentation of Statement of Cash Flow and Statement of Comparison of
Budget and Actual Amounts. Revenue and non-fund relevant expenses that do not form
part of the Statement of Comparison of Budget and Actual Amounts are reflected as
Presentation differences.
202. A reconciliation between the actual amounts on a comparable basis in the Statement of
Comparison of Budget and Actual Amounts (Statement V) and the actual amounts in the
Statement of Cash Flow (Statement IV) for the year ended 31 December 2017 is presented
below:
Operating Investing Financing Total
USD million
Actual amount on
comparable basis
(Statement V)
(5 769.9) - - (5 769.9)
Basis differences 179.9 (115.2) (7.7) 57.0
Presentation differences 6 375.2 - - 6 375.2
Entity differences (170.9) - - (170.9)
Actual amount in the
Statement of Cash Flow
(Statement IV)
614.3 (115.2) (7.7) 491.4
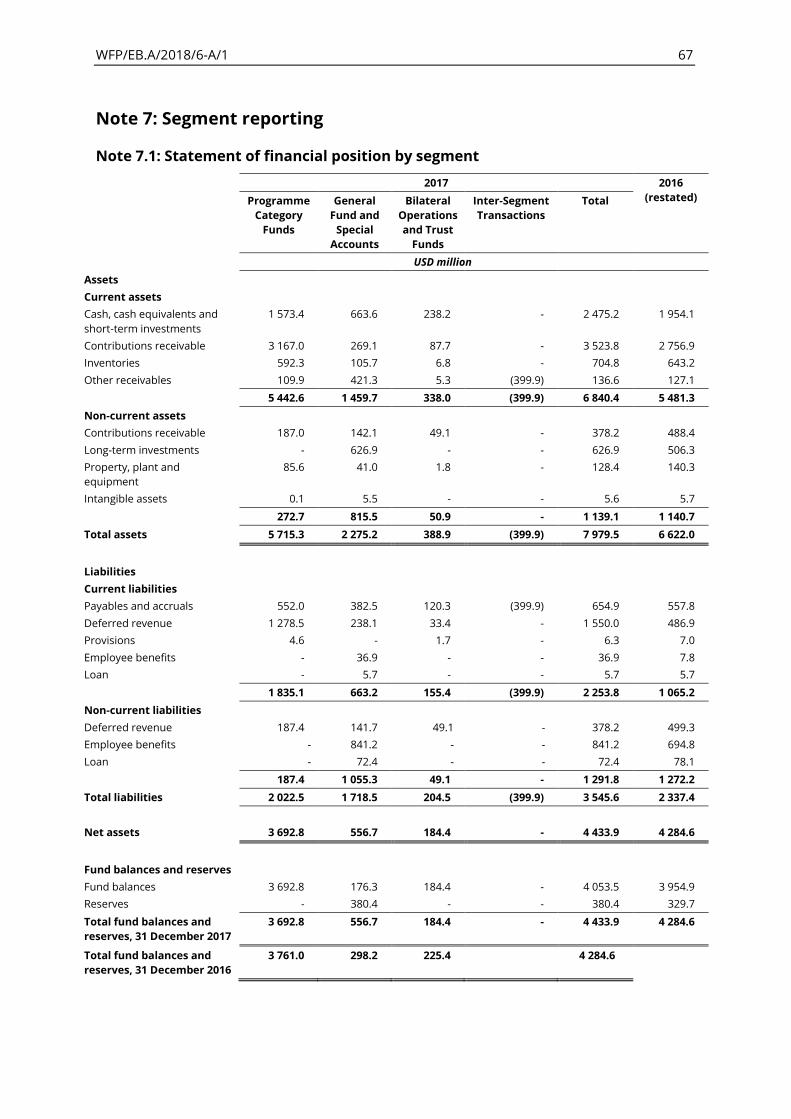
WFP/EB.A/2018/6-A/1 67
Note 7: Segment reporting
Note 7.1: Statement of financial position by segment
2017 2016
(restated) Programme
Category
Funds
General
Fund and
Special
Accounts
Bilateral
Operations
and Trust
Funds
Inter-Segment
Transactions
Total
USD million
Assets
Current assets
Cash, cash equivalents and
short-term investments
1 573.4 663.6 238.2 - 2 475.2 1 954.1
Contributions receivable 3 167.0 269.1 87.7 - 3 523.8 2 756.9
Inventories 592.3 105.7 6.8 - 704.8 643.2
Other receivables 109.9 421.3 5.3 (399.9) 136.6 127.1
5 442.6 1 459.7 338.0 (399.9) 6 840.4 5 481.3
Non-current assets
Contributions receivable 187.0 142.1 49.1 - 378.2 488.4
Long-term investments - 626.9 - - 626.9 506.3
Property, plant and
equipment
85.6 41.0 1.8 - 128.4 140.3
Intangible assets 0.1 5.5 - - 5.6 5.7
272.7 815.5 50.9 - 1 139.1 1 140.7
Total assets 5 715.3 2 275.2 388.9 (399.9) 7 979.5 6 622.0
Liabilities
Current liabilities
Payables and accruals 552.0 382.5 120.3 (399.9) 654.9 557.8
Deferred revenue 1 278.5 238.1 33.4 - 1 550.0 486.9
Provisions 4.6 - 1.7 - 6.3 7.0
Employee benefits - 36.9 - - 36.9 7.8
Loan - 5.7 - - 5.7 5.7
1 835.1 663.2 155.4 (399.9) 2 253.8 1 065.2
Non-current liabilities
Deferred revenue 187.4 141.7 49.1 - 378.2 499.3
Employee benefits - 841.2 - - 841.2 694.8
Loan - 72.4 - - 72.4 78.1
187.4 1 055.3 49.1 - 1 291.8 1 272.2
Total liabilities 2 022.5 1 718.5 204.5 (399.9) 3 545.6 2 337.4
Net assets 3 692.8 556.7 184.4 - 4 433.9 4 284.6
Fund balances and reserves
Fund balances 3 692.8 176.3 184.4 - 4 053.5 3 954.9
Reserves - 380.4 - - 380.4 329.7
Total fund balances and
reserves, 31 December 2017
3 692.8 556.7 184.4 - 4 433.9 4 284.6
Total fund balances and
reserves, 31 December 2016
3 761.0 298.2 225.4 4 284.6

WFP/EB.A/2018/6-A/1 68
Note 7.2: Statement of financial performance by segment
2017 2016
(restated) Programme
Category
Funds
General
Fund and
Special
Accounts
Bilateral
Operations
and Trust
Funds
Inter-
Segment
Transactions
Total
USD million
Revenue
Monetary contributions 4 777.1 735.8 101.9 - 5 614.8 5 300.4
In-kind contributions 365.6 16.5 3.0 - 385.1 470.7
Currency exchange
differences
13.6 218.2 (0.8) - 231.0 (31.3)
Return on investments 0.1 50.7 0.2 - 51.0 20.3
Other revenue 138.8 1 045.4 - (1 035.2) 149.0 148.8
Total revenue 5 295.2 2 066.6 104.3 (1 035.2) 6 430.9 5 908.9
Expenses
Cash-based transfers
distributed
1 438.1 - 8.0 - 1 446.1 882.3
Food commodities
distributed
2 181.7 852.0 3.2 (839.4) 2 197.5 2 051.1
Distribution and
related services
651.2 16.3 28.8 (31.9) 664.4 641.4
Wages, salaries,
employee benefits and
other staff costs
510.7 313.9 72.7 (13.3) 884.0 826.7
Supplies, consumables
and other running
costs
128.6 45.9 13.2 (13.3) 174.4 170.8
Contracted and
other services
641.6 190.7 40.3 (113.1) 759.5 689.5
Finance costs - 1.9 - - 1.9 2.1
Depreciation and
amortization
29.4 16.9 1.4 - 47.7 48.3
Other expenses 46.9 17.6 3.4 (24.2) 43.7 55.3
Total expenses 5 628.2 1 455.2 171.0 (1 035.2) 6 219.2 5 367.5
Surplus (deficit) for
the year, 2017
(333.0) 611.4 (66.7) - 211.7 541.4
Surplus (deficit) for
the year, 2016
223.1 408.7 (90.4) - 541.4
203. Cash and cash equivalents and short-term investments are presented as separate line items
on the face of the Statement of Financial Position and presented together under segment
reporting. The below table reconciles the amounts reported in the Statement of Financial
Position and segment reporting.

WFP/EB.A/2018/6-A/1 69
2017 2016
USD million
Cash and cash equivalents 1 268.9 777.5
Short-term investments 1 206.3 1 176.6
Total cash and cash equivalents and short-term
investments 2 475.2 1 954.1
204. Some internal activities lead to accounting transactions that created inter-segment revenue
and expense balances in the financial statements. Inter-segment transactions are reflected
in the above tables to accurately present these financial statements.
205. Fund balances under Programme Category Funds and Bilateral Operations and Trust Funds
represent the unexpended portion of contributions that are intended to be utilized for
future operational requirements of the Programme.
Note 8: Commitments and contingencies
Note 8.1: Commitments
8.1.1 Property leases
2017 2016
USD million
Obligations for property leases:
Within 1 year 41.3 39.5
Later than 1 year and not later than 5 years 58.6 26.8
Beyond 5 years 5.0 1.0
Total property leases obligations 104.9 67.3
206. At 31 December 2017, property lease obligations for the WFP headquarters building in Rome
represent 17 percent of the total obligations under the within 1-year category and
51 percent under the later than 1 year and not later than 5 years category (18 percent and
4 percent, respectively, at 31 December 2016). The lease can be renewed at WFP’s option.
Costs incurred in leasing the headquarters building are reimbursed by the host government.
8.1.2 Other commitments
207. At 31 December 2017, WFP had commitments for the acquisition of food commodities,
transportation, services, non-food items, and capital commitments contracted but not
delivered as follows:
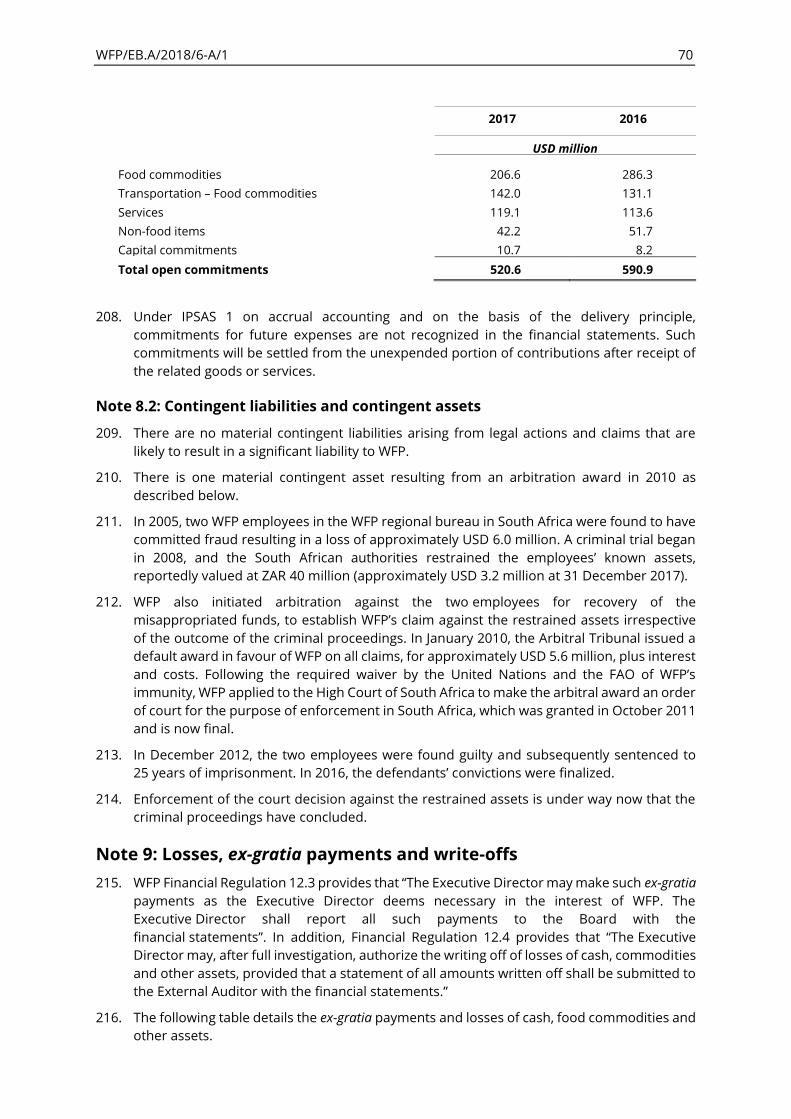
WFP/EB.A/2018/6-A/1 70
2017 2016
USD million
Food commodities 206.6 286.3
Transportation – Food commodities 142.0 131.1
Services 119.1 113.6
Non-food items 42.2 51.7
Capital commitments 10.7 8.2
Total open commitments 520.6 590.9
208. Under IPSAS 1 on accrual accounting and on the basis of the delivery principle,
commitments for future expenses are not recognized in the financial statements. Such
commitments will be settled from the unexpended portion of contributions after receipt of
the related goods or services.
Note 8.2: Contingent liabilities and contingent assets
209. There are no material contingent liabilities arising from legal actions and claims that are
likely to result in a significant liability to WFP.
210. There is one material contingent asset resulting from an arbitration award in 2010 as
described below.
211. In 2005, two WFP employees in the WFP regional bureau in South Africa were found to have
committed fraud resulting in a loss of approximately USD 6.0 million. A criminal trial began
in 2008, and the South African authorities restrained the employees’ known assets,
reportedly valued at ZAR 40 million (approximately USD 3.2 million at 31 December 2017).
212. WFP also initiated arbitration against the two employees for recovery of the
misappropriated funds, to establish WFP’s claim against the restrained assets irrespective
of the outcome of the criminal proceedings. In January 2010, the Arbitral Tribunal issued a
default award in favour of WFP on all claims, for approximately USD 5.6 million, plus interest
and costs. Following the required waiver by the United Nations and the FAO of WFP’s
immunity, WFP applied to the High Court of South Africa to make the arbitral award an order
of court for the purpose of enforcement in South Africa, which was granted in October 2011
and is now final.
213. In December 2012, the two employees were found guilty and subsequently sentenced to
25 years of imprisonment. In 2016, the defendants’ convictions were finalized.
214. Enforcement of the court decision against the restrained assets is under way now that the
criminal proceedings have concluded.
Note 9: Losses, ex-gratia payments and write-offs
215. WFP Financial Regulation 12.3 provides that “The Executive Director may make such ex-gratia
payments as the Executive Director deems necessary in the interest of WFP. The
Executive Director shall report all such payments to the Board with the
financial statements”. In addition, Financial Regulation 12.4 provides that “The Executive
Director may, after full investigation, authorize the writing off of losses of cash, commodities
and other assets, provided that a statement of all amounts written off shall be submitted to
the External Auditor with the financial statements.”
216. The following table details the ex-gratia payments and losses of cash, food commodities and
other assets.

WFP/EB.A/2018/6-A/1 71
2017 2016
USD million
Ex-gratia payments 0.3 0.4
Contributions receivable 2.8 4.4
Food commodity losses 14.2 21.1
Write-off of commodity 5.6 -
Non-food item losses 1.3 0.1
Other assets and cash losses 0.9 1.4
In mt
Commodity losses (quantity) 16 961 23 786
217. The ex-gratia payments mainly pertain to field emergency claims. Contributions receivable
relates to the write-off of receivables from donors. The food commodity losses occurred
after the related food arrived at the recipient country. The write-off of the commodity loss
relates to the final resolution of a claim for a donor government with regards to a 2012
school feeding programme. The non-food item losses related mainly to warehouse losses.
The other assets and cash losses related mainly to write-offs of other receivables from
customers and service providers.
218. Fraud reported in 2017 comprised entitlement, vendor and partner fraud involving WFP staff
and third parties valued at USD 141,198 (in 2016 USD 314,964 of which USD 23,100
was recovered).
Note 10: Related party and other senior management disclosure
Note 10.1: Key management personnel
Number of
individuals
Number
of
positions
Compensation
and post
adjustment
Entitlements
and benefits
Pension
and health
plans
Total
remuneration
Outstanding
advances
against
entitlements
USD million
Key
management
personnel,
2017
8 6 1.1 0.8 0.3 2.2 0.1
Key
management
personnel,
2016
6 6 1.2 0.4 0.3 1.9 0.1

WFP/EB.A/2018/6-A/1 72
219. Key management personnel are the Executive Director, Deputy Executive Director,
Assistant Executive Directors and Chief of Staff as they have the authority and responsibility
for planning, directing and controlling the activities of WFP.
Note 10.2: Other senior management
Number of
individuals
Number
of
positions
Compensation
and post
adjustment
Entitlements
and benefits
Pension
and health
plans
Total
remuneration
Outstanding
advances
against
entitlements
USD million
Other senior
management,
2017
36 28 4.3 2.2 1.2 7.7 1.2
Other senior
management,
2016
37 28 4.5 2.2 1.1 7.8 1.2
220. In addition to key management personnel whose remuneration, advances and loans are
required to be disclosed under IPSAS 20 Related Party Disclosures, similar disclosure is also
made for other senior management of WFP for the sake of completeness and transparency.
Other senior management include regional directors and headquarters divisional directors.
221. The tables above detail the number of positions and the number of staffs who held these
positions over the course of the year. The Executive Board consists of 36 Member States
without personal appointment.
222. The aggregate remuneration paid to key management personnel and other senior
management includes: net salaries; post adjustment; entitlements such as representation
allowance and other allowances, assignment and other grants, rental subsidy, personal
effect shipment costs; post-employment benefits; other long-term employee benefits and
employer pension and current health insurance contributions.
223. Key management personnel and other senior management qualify for post-employment
benefits and other long-term employee benefits at the same level as other employees. The
actuarial assumptions applied to measure such employee benefits are disclosed in
Note 2.12. Key management personnel and other senior management are ordinary
members of the UNJSPF.
224. During 2017, compensation provided to close members of the family of other senior
management amounted to USD 0.2 million (USD 0.4 million in 2016). There was no
compensation provided to close members of the family of the key management personnel
in 2017 and 2016.
225. Advances are those made against entitlements in accordance with staff rules and
regulations and are widely available to all WFP staff.
Note 11: Events after reporting date
226. WFP’s reporting date is 31 December 2017. On the date of signing of these accounts by the
External Auditor, there have been no material events, favourable or unfavourable, incurred
between the balance sheet date and the date when the financial statements have been
authorized for issue that would have impacted these statements.

WFP/EB.A/2018/6-A/1 73
Note 12: Interest in other entities
International Computing Centre
227. The International Computing Centre (ICC) was established in January 1971 pursuant to
Resolution 2741 (XXV) of the United Nations General Assembly. ICC provides Information
Technology and Communications services to Partners and Users in the United Nations
system. As a Partner bound by the Mandate of the ICC, WFP would be proportionately
responsible for any third-party claim or liability arising from or related to service activities
of the ICC as specified in the ICC Mandate. At 31 December 2017, there are no known claims
that impact WFP. Ownership of assets is with ICC until dissolution. Upon dissolution, the
division of all assets and liabilities amongst Partner Organizations shall be agreed by the
Management Committee by a formula defined at that time.
African Risk Capacity Agency
228. WFP and the African Risk Capacity (ARC) Agency signed an administrative service agreement
in June 2015 expiring on 31 August 2019. ARC is a Specialized Agency of the African Union
which shares the goal of promoting food security with WFP.
229. While ARC is a separate legal entity, its financial and operating policies with reference to this
agreement are subject to WFP rules. Funds received under this agreement are held under
an ARC Trust Fund by WFP. WFP provides technical, administrative, personnel, and project
management services to ARC. The Director-General of the ARC is employed by WFP and is
accountable to both the WFP Executive Director and ARC. The agreement is considered joint
operation where, based on the terms of the agreement, the financial transactions of ARC
are consolidated within WFP financial statements. As at 31 December 2017, the accumulated
surplus held under an ARC trust fund totalled USD 17.3 million.

WFP/EB.A/2018/6-A/1 74
Section II

WFP/EB.A/2018/6-A/1 75
The First President Paris, 22 MARS 2018
To the Executive Board
AUDIT OPINION
Opinion
We have audited the Financial Statements of the World Food Programme (WFP), for the 12 month
period ended 31 December 2017. These Financial Statements include a Statement of Financial Position
as at 31 December 2017, a Statement of Financial Performance, a Statement of Changes in Net Assets,
a Statement of Cash Flow, a Statement of Comparison of Budget and Actual Amounts and Notes,
including a summary of the accounting policies and other information.
In our opinion, the Financial Statements present fairly the financial position of the World Food
Programme as at 31 December 2017 and the results of the operations for the period, in conformity with
the International Public Sector Accounting Standards (IPSAS). The Financial Statements were prepared
in accordance with the stated accounting policies and the accounting policies were applied on a basis
consistent with that of the preceding financial period. All transactions that we became aware of or that
we tested during our audit have been carried out in compliance with the Financial Regulations and with
the authorizations granted by legislative authority.
Basis for Opinion
We have conducted our audit in accordance with the International Standards on Auditing (ISA) and in
accordance with Article XIV of the Financial Regulations of the World Food Programme and its annex
relating to external audit. These Standards require us to comply with the ethical rules and to plan and
perform our audit in order to obtain a reasonable assurance that the Financial Statements are free from
material misstatements. As required by the Charter of ethics of the Cour des comptes, we guarantee the
independence, the fairness, the neutrality, the integrity and the professional discretion of the auditors.
Furthermore, we also fulfilled our other ethical obligations in compliance with the Code of Ethics of
the International Organisation of Supreme Audit Institutions (INTOSAI). The responsibilities of the
External Auditor are more extensively described in the section “Auditor’s Responsibilities for the Audit
of the Financial Statements”.
We believe that the audit evidence collected is sufficient and appropriate to constitute a reasonable
basis for our opinion.

WFP/EB.A/2018/6-A/1 76
Management’s Responsibilities for the Financial Statements
Within the framework of Article XlV.6 (b) of the General Regulations and by virtue of the Articles 13.1
and 13.3 of the Financial Regulations, the Executive Director of the World Food Programme is
responsible for presenting the Financial Statements. These Statements are in conformity with the
International Public Sector Accounting Standards. This responsibility includes the design,
implementation and monitoring of internal control procedures to ensure the preparation and the fair
presentation of Financial Statements, free of significant misstatements, resulting either from frauds or
errors. This responsibility also includes the determination of fair accounting estimates adapted to the
circumstances.
Auditor’s Responsibilities for the Audit of the Financial Statements
The goal of the audit is to obtain reasonable assurance about whether the Financial Statements as a
whole are free from material misstatement, whether due to fraud or error. Reasonable assurance is a
high level of assurance, but is not a guarantee that an audit conducted in accordance with ISAS will
always detect a material misstatement when it exists. Misstatements can arise from fraud or error and
are considered material if, individually or in the aggregate, they could reasonably be expected to
influence the economic decisions of users taken on the basis of these financial statements.
An audit therefore consists in implementing audit procedures in order to collect audit evidence
regarding the amounts and the information presented in the Financial Statements. The External Auditor
takes into account the internal control in effect in the entity, relative to the establishment and
preparation of financial statements, so as to define appropriate audit procedures in the circumstances,
and not with the aim of expressing an opinion on the effectiveness of this control. The choice of the
audit procedures is based on the External Auditor’s professional judgment, as is the case for the risk
evaluation of the Financial Statements, for the assessment of the appropriateness of the accounting
policies and of the accounting estimates, and for the overall presentation of the Financial Statements.
13, rue Cambon 75100 PARIS CEDEX 01 T +33 1 42 98 95 00 • www.ccomptes.fr

EXTERNAL AUDIT OF THE
WORLD FOOD PROGRAMME
AUDIT REPORT
FINANCIAL STATEMENTS
OF THE WORLD FOOD PROGRAMME
FOR THE YEAR ENDED
31 DECEMBER 2017
REFERENCE COUR DES COMPTES : WFP-2018-1

WFP/EB.A/2018/6-A/1 78
TABLE OF CONTENTS
I. Objectives and scope of the audit ........................................................................... 79
II. List of recommendations ......................................................................................... 80
III. Observations and recommendations ...................................................................... 82
1. Follow-up on the previous recommendations ..................................................... 82
2. Overview of WFP’s financial position at 31 December 2017 .............................. 85
2.1. Presentation of the simplified Statement of Financial Position ................... 85 2.2. Presentation of WFP’s simplified Statement of Financial Performance ..... 86
3. Main points on the Financial Statements ........................................................... 88
3.1. Adoption of IPSAS 39 ............................................................................... 88 3.2. Adoption of IPSAS 34, 35, 36, 37 and 38 .................................................. 88
4. Main internal control points ................................................................................ 89
4.1. Observations from audits conducted in country offices .............................. 89 4.2. Contributions receivable and recognition of revenue ................................. 89 4.3. COMET programme online reporting system ............................................ 91
5. WFP communication concerning fraud, amounts written off and ex gratia payments ........................................................................................................... 93
5.1. Prevention of fraud risk ............................................................................. 93 5.2. Write-offs and ex gratia payments ............................................................. 93
IV. Acknowledgements .................................................................................................. 94
Appendix: Audit adjustments and requested modifications to the financial statements ............................................................................................... 95

WFP/EB.A/2018/6-A/1 79
I. Objectives and scope of the audit
1. In accordance with our notification letter of 1 December 2017, a team of six external auditors (including a data analyst) conducted the audit of the financial statements of the World Food Programme (WFP) for the year ended 31 December 2017. The objective of this audit was to issue an audit opinion on WFP’s financial statements for the year ended 31 December 2017. The audit work was carried out mainly at WFP’s headquarters in Rome during two phases:
• an interim mission from 16 to 27 October 2017;
• a final mission from 19 February to 9 March 2018.
2. Pursuant to an Executive Board decision of 10 November 2015, WFP External Audit was entrusted to the First President of the Cour des Comptes of France for the period 1 July 2016 to 30 June 2022, in accordance with Article 14.1 of the WFP Financial Regulations.
3. The External Auditor’s mandate is contained in Article XIV of the WFP Financial Regulations and its Appendix, and in the call for applications for the appointment of the External Auditor. Its terms of reference comprise the call for applications, together with the offer of services of the Cour des Comptes – particularly the detailed technical offer, which was approved by the Board.
4. The responsibilities of the External Auditor consist of auditing the accounts of WFP (Article 14.1 of the Financial Regulations) and making observations, if he sees fit, regarding the efficiency of the financial procedures, the accounting system, internal financial controls and, in general, the administration and management of WFP (Article 14.4 of the Financial Regulations).
5. Pursuant to Article XIV.6 (b) of the WFP General Regulations and by virtue of Articles 13.1 and 13.3 of its Financial Regulations, the Executive Director submits the annual Financial Statements to the Board for its approval, after having submitted them to the External Auditor for examination and opinion. These Financial Statements are prepared in accordance with International Public Sector Accounting Standards (IPSAS). It is the responsibility of the management to design, implement and maintain internal control relevant to the preparation and fair presentation of Financial Statements that are exempt from material misstatements, whether due to fraud or error. This responsibility also includes making accounting estimates that are reasonable in the circumstances. In conformity with Article 3.1 of the Financial Regulations, the Executive Director is also responsible for the financial management of the activities of WFP, for which he is accountable to the Board.
6. A letter of engagement was drawn up with the Executive Director in order to ensure that, in accordance with the international audit standards, the respective obligations of the management and of the External Auditor are clearly understood. In addition, before each audit, the External Auditor communicates to the Secretariat the scope of the verifications which he undertakes.
WFP/EB.A/2018/6-A/1 80
7. This report comes under the annual work plan of the External Auditor submitted to the Executive Board of WFP during its Second Regular Session of November 2017, which details the verifications to be carried out between July 2017 and June 2018. Pursuant to the terms of reference, the External Auditor must produce each year an audit report on the Financial Statements of WFP (subject to the approval of the Board) accompanied by an opinion on the accounts, two reports on the performance and the regularity of the management of WFP, also known as "performance audit reports" (submitted to the Board for consideration) and ten management letters prepared at the end of visits to the external offices (including regional bureaux and country offices). The External Auditor also validates the draft annual report on the implementation status of its previous recommendations, submitted by the Secretariat to the Board for consideration.
8. The audit of the Financial Statements was carried out in accordance with the International Standards on Auditing (ISA) and with the International Standards of Supreme Audit Institutes (ISSAI) on financial auditing.
9. The field visits,1 in particular, to country offices and regional bureaux, related mainly to the regularity of the management of the offices, but the verifications carried out also contributed to the preparation of this report.
10. The aim of the audit was to determine with reasonable assurance:
- whether the Financial Statements fairly reflect, in all material respects, WFP’s financial position at 31 December 2017 and results of operations recognized during the period, in accordance with IPSAS;
- whether the Financial Statements were prepared in accordance with the Financial Regulations and the stated accounting policies;
- whether the accounting policies applied correspond to those used in the previous year;
- whether the transactions were carried out in compliance with the Financial Regulations and legislative authority.
11. Each observation and each recommendation were discussed with the relevant staff. The audit closure meeting was held with senior management of WFP’s Finance and Treasury Division (RMF) on 8 March 2018. The management received the External Auditor’s draft report and provided feedback; this report fully takes into account its comments and answers.
12. The External Auditor expressed an unqualified opinion on the Financial Statements.
II. List of recommendations
13. Recommendations are ranked according to their priority level:
1 Regional bureaux in Cairo and Johannesburg and country offices in Kenya, Lebanon, Malawi, Nepal, State of Palestine,
Turkey, Ukraine and Zimbabwe.
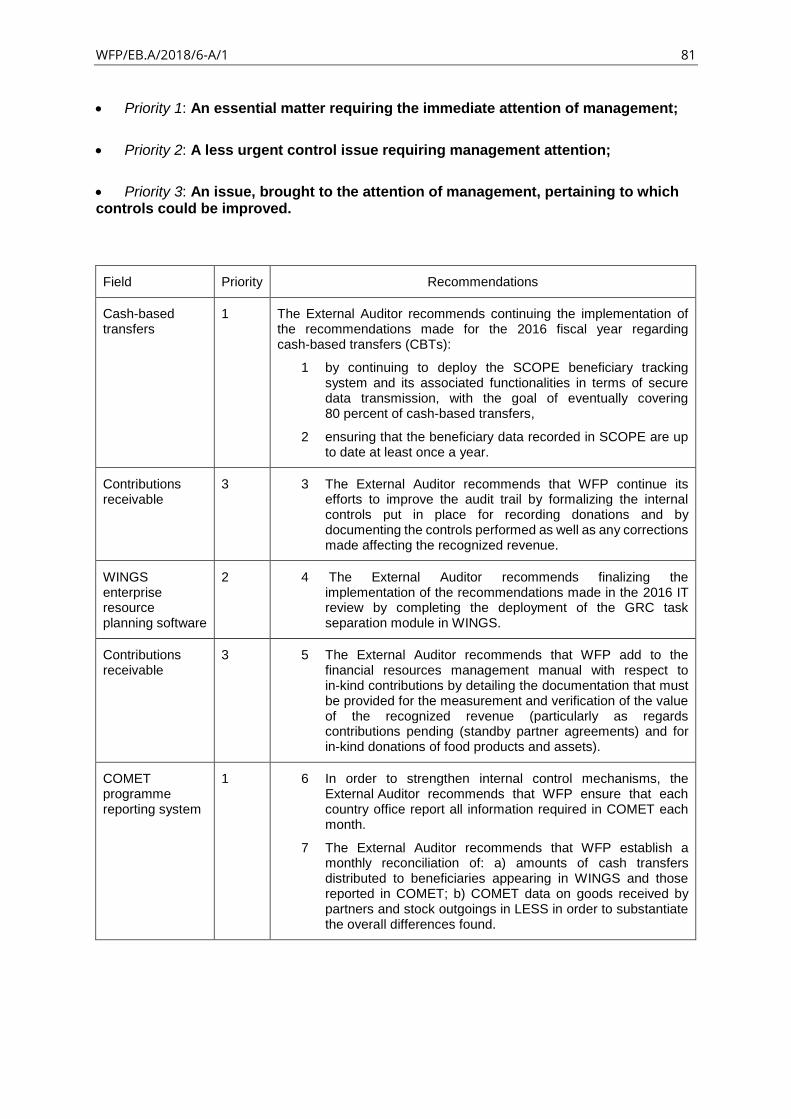
WFP/EB.A/2018/6-A/1 81
• Priority 1: An essential matter requiring the immediate attention of management;
• Priority 2: A less urgent control issue requiring management attention;
• Priority 3: An issue, brought to the attention of management, pertaining to which controls could be improved.
Field Priority Recommendations
Cash-based transfers
1 The External Auditor recommends continuing the implementation of the recommendations made for the 2016 fiscal year regarding cash-based transfers (CBTs):
1 by continuing to deploy the SCOPE beneficiary tracking system and its associated functionalities in terms of secure data transmission, with the goal of eventually covering 80 percent of cash-based transfers,
2 ensuring that the beneficiary data recorded in SCOPE are up to date at least once a year.
Contributions receivable
3 3 The External Auditor recommends that WFP continue its efforts to improve the audit trail by formalizing the internal controls put in place for recording donations and by documenting the controls performed as well as any corrections made affecting the recognized revenue.
WINGS enterprise resource planning software
2 4 The External Auditor recommends finalizing the implementation of the recommendations made in the 2016 IT review by completing the deployment of the GRC task separation module in WINGS.
Contributions receivable
3 5 The External Auditor recommends that WFP add to the financial resources management manual with respect to in-kind contributions by detailing the documentation that must be provided for the measurement and verification of the value of the recognized revenue (particularly as regards contributions pending (standby partner agreements) and for in-kind donations of food products and assets).
COMET programme reporting system
1 6 In order to strengthen internal control mechanisms, the External Auditor recommends that WFP ensure that each country office report all information required in COMET each month.
7 The External Auditor recommends that WFP establish a monthly reconciliation of: a) amounts of cash transfers distributed to beneficiaries appearing in WINGS and those reported in COMET; b) COMET data on goods received by partners and stock outgoings in LESS in order to substantiate the overall differences found.

WFP/EB.A/2018/6-A/1 82
III. OBSERVATIONS AND RECOMMENDATIONS
1. Follow-up on the previous recommendations
14. We reviewed the status of implementation of the nine recommendations issued during the external audit of WFP’s Financial Statements for the year ended 31 December 2016. Our assessment of the level of implementation is summarized in the table below.
Tableau 1 : Implementation status of the External Auditor’s recommendations relating to the audit of WFP’s Financial Statements for the year ended 31 December 2016
Subject Implemented Being implemented
Not implemented
Total Reference paragraphs in the 2016
report
Cash-based transfers 1 Increase the deployment
rate of SCOPE
2 Update beneficiary information
3 Establish a secure data transmission system
4 Extend analysis of data
4 X
X
X
X
4 Par. 33–36
Contributions revenue and receivables
5 Analyse conditions associated with contributions
6 Make an inventory of organizations for which WFP ensures a management service
7 Examine the accounting treatment of in-kind donations
8 Improve the audit trail
3
X
X
X
1
X
4 Par. 37–44
IT review 9 Address the weaknesses in
IT general and application controls
1 X
1 Par. 45–48
Total 4 5 0 9
15. WFP is in the process of implementing two recommendations relating to cash-based transfers (CBTs)2 by continuing the deployment of the SCOPE (system for cash operations) beneficiary tracking system: according to data provided by WFP, SCOPE covered 40.62 percent of the amounts distributed in 2017 (compared with 30 percent in 2016) and allows its associated secure data transfer functionality to be used.
2 Recommendations 1 and 3 in the preceding table.
WFP/EB.A/2018/6-A/1 83
16. WFP also set up a working group to develop a procedure guide for entering cash-based transfer beneficiary data into SCOPE in order to implement recommendation 2. In order to ensure that electronic cards are issued to legitimate beneficiaries, the External Auditor considers it necessary that this working group include in the procedure guide being prepared the deactivation3 of each issued card at least once a year, as was done in the past as part of the proactive integrity reviews in Lebanon and Jordan, to enable WFP to update the beneficiary data and authenticate the cardholders.
17. Implementation of the recommendation to “extend, under the close supervision of headquarters, analysis of data on sales carried out by retailers and direct it to usage that enables detection of potential errors or frauds and to ensure the traceability of work carried out in this area” has begun. During its audit of the Lebanon office in January 2018, the External Auditor was able to assess the efforts made by this office in the analysis of retailer sales data. However, only around 45 percent of the sales data obtained by WFP’s office in Lebanon could be directly analysed because of problems of incompatibility between the retailers’ information systems from which the data were extracted and WFP’s information system intended to analyse them. In order to prevent this problem from reoccurring when WFP implements the recommendation to extend analyses of data to other countries, a standardized computerized sales tracking system accessible to retailers participating in the CBT programme should be implemented. The External Auditor will consider this recommendation fully implemented when WFP is able to indicate the number of data analyses, the countries concerned, and the results obtained in a given year.
Recommendation 1. The External Auditor recommends that WFP continue the implementation of the recommendations made for the 2016 fiscal year for cash-based transfers (CBTs) by continuing to deploy the SCOPE beneficiary tracking system and its associated functionalities in terms of secure data transmission, with the goal of eventually covering 80 percent of WFP’s CBT activity.
Recommendation 2. The External Auditor recommends that WFP continue the implementation of the recommendations made for the 2016 fiscal year for cash-based transfers (CBTs) ensuring that the beneficiary data recorded in SCOPE are up to date at least once a year.
18. WFP implemented three recommendations related to revenue and receivables by conducting further analyses to ensure that the various types of contributions were properly recognized in accordance with IPSAS. This work did not reveal any anomalies and improved the information provided by the notes to the financial statements, including Note 12 on WFP’s interests in other entities.
3 The deactivation is accompanied by a notification to the beneficiaries so that they show up to verify their information
before their cards are reactivated.

WFP/EB.A/2018/6-A/1 84
19. However, although improvements were noted in the audit trail, there are still areas for improvement, as illustrated by the case described below. After donations are recorded in the grants management (GM) module, the WINGS enterprise resource planning software automatically records the corresponding revenue in the finance (FI) module. The External Auditor’s substantive work revealed that the audit trail between GM and FI remains very difficult to follow, especially for transactions resulting in year-end corrections or recognition of deferred revenue. For example, a 2016 donation resulted in correction entries at the beginning of 2017 for 10 million United States dollars (USD) due to an incorrect initial entry in 2016. The External Auditor did not receive WFP’s year-end analysis report on transfers between GM and FI, which lists corrections made for the closure of the accounts, or other details on the internal controls put in place within the Partnerships and Governance Department (PG) to ensure accurate and comprehensive recording of donations in GM. However, the reliability of the data in GM is essential to ensure that receivables are tracked properly, since WFP expects donors to pay according to the amounts and schedules recorded in GM.
Recommendation 3. The External Auditor recommends that WFP continue its efforts to improve the audit trail by formalizing the internal controls put in place for recording donations and by documenting the controls performed as well as any corrections made affecting the recognized revenue.
20. WFP’s Information Technology Division (ICT) indicated that it had resolved the areas for improvement identified during the IT audit by the External Auditor in December 2016 on IT general controls (ITGC) by implementing fire fighters4 access instead of SAP All access and deleting profiles of users who left WFP in 2016. With regard to application controls, WFP undertook the deployment of the GRC task separation module in WINGS and the creation of a mandatory coding system to ensure the traceability of the reasons for removing an invoice from the invoice tracking system. These actions should be completed in 2018.
Recommendation 4. The External Auditor recommends finalizing the implementation of the recommendations made in the 2016 IT review by completing the deployment of the GRC task separation module in WINGS.
4 The fire fighter functionality provides extended rights for a limited time to staff to handle a system crash in order to
prevent data loss and to put the system back in operation.
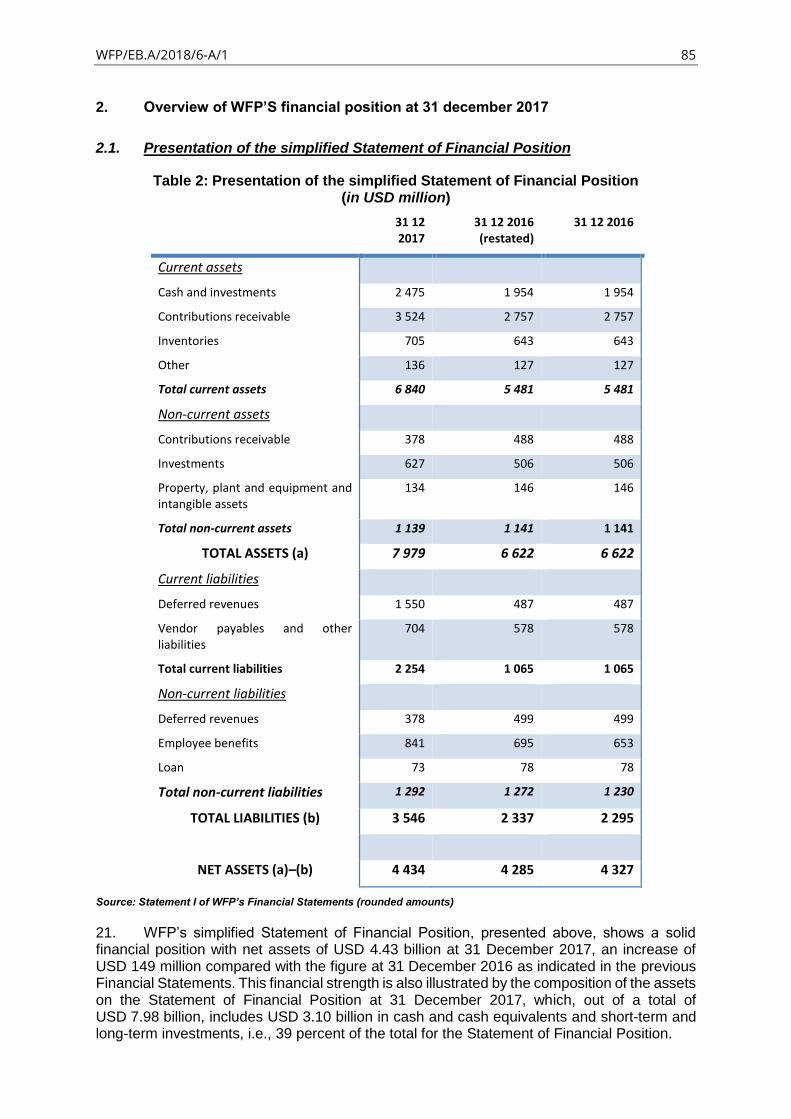
WFP/EB.A/2018/6-A/1 85
2. Overview of WFP’S financial position at 31 december 2017
2.1. Presentation of the simplified Statement of Financial Position
Table 2: Presentation of the simplified Statement of Financial Position (in USD million)
31 12 2017
31 12 2016 (restated)
31 12 2016
Current assets
Cash and investments 2 475 1 954 1 954
Contributions receivable 3 524 2 757 2 757
Inventories 705 643 643
Other 136 127 127
Total current assets 6 840 5 481 5 481
Non-current assets
Contributions receivable 378 488 488
Investments 627 506 506
Property, plant and equipment and intangible assets
134 146 146
Total non-current assets 1 139 1 141 1 141
TOTAL ASSETS (a) 7 979 6 622 6 622
Current liabilities
Deferred revenues 1 550 487 487
Vendor payables and other liabilities
704 578 578
Total current liabilities 2 254 1 065 1 065
Non-current liabilities
Deferred revenues 378 499 499
Employee benefits 841 695 653
Loan 73 78 78
Total non-current liabilities 1 292 1 272 1 230
TOTAL LIABILITIES (b) 3 546 2 337 2 295
NET ASSETS (a)–(b) 4 434 4 285 4 327
Source: Statement I of WFP’s Financial Statements (rounded amounts)
21. WFP’s simplified Statement of Financial Position, presented above, shows a solid financial position with net assets of USD 4.43 billion at 31 December 2017, an increase of USD 149 million compared with the figure at 31 December 2016 as indicated in the previous Financial Statements. This financial strength is also illustrated by the composition of the assets on the Statement of Financial Position at 31 December 2017, which, out of a total of USD 7.98 billion, includes USD 3.10 billion in cash and cash equivalents and short-term and long-term investments, i.e., 39 percent of the total for the Statement of Financial Position.

WFP/EB.A/2018/6-A/1 86
22. The simplified Statement of Financial Position includes a “31 12 2016 restated” column corresponding to the adoption of the new standard IPSAS 39 on employee benefits, which WFP decided to implement early in 2017. This new accounting standard no longer permits the impact of actuarial changes to be smoothed by applying the corridor approach, which means that they are now fully recognized in the year in which they are detected. Its implementation must be carried out retrospectively, i.e., by restating the Statement of Financial Position for the previous year. In the column “31 12 2016 restated”, this change results in an increase in liabilities for employee benefits payable of USD 42 million and a decrease of the same amount in net assets.
23. WFP’s non-current liabilities include employee benefits liabilities (the largest portion of which concerns the after-service medical plan), which totalled USD 841 million at the end of 2017. WFP has set up a long-term investment in order to fund these liabilities, pursuant to the Executive Board’s decision in December 2010. The balance of this investment stood at USD 573 million at 31 December 2017, and the signs indicate that the current funding mechanism will allow the obligations to be covered by 2027 at the latest, consistent with the 2010 decision.
2.2 Presentation of WFP’s simplified Statement of Financial Performance
Table 3: WFP simplified Statement of Financial Performance (in USD million)
2017 2016 (restated) 2016
Revenue
Contributions 6 000 5 771 5 771
Other revenue 431 138 138
Total revenue 6 431 5 909 5 909
Expenses
Food commodities distributed 2 198 2 051 2 051
Cash-based transfers distributed 1 446 882 882
Distribution and related services 664 641 641
Employee costs 884 826 826
Other expenses 1 027 967 967
Total expenses 6 219 5 367 5 367
SURPLUS/(DEFICIT) FOR THE YEAR
212 542 542
Source: Statement II of WFP’s Financial Statements
24. The simplified Statement of Financial Performance includes a “2016 restated” column due to the retrospective adoption of the new accounting standard IPSAS 39 on employee benefits. However, the implementation of this new standard has only a minor impact (USD 0.3 million in employee costs) on the 2016 Statement of Financial Performance, as the bulk of the change in the balance of employee benefits on the liabilities side of the Statement of Financial Position is offset in net assets and not in the Statement of Financial Performance.
25. 2017 was characterized by a very high level of contributions, totalling USD 6 billion, i.e., USD 229 million more than the 2016 figure, which itself was up by USD 1.1 billion compared with the 2015 figure.

WFP/EB.A/2018/6-A/1 87
26. The difference between revenue and expenses resulted in a surplus of USD 212 million, which is still less than the surplus in 2016. This situation is not due to WFP’s inability to employ the contributions received for its operations, but to a seasonal effect: the level of contributions recorded in the final quarter of 2017 was high but came too late to enable commitment of the funds before the end of the year.
27. The presentation of the expenses does not make it possible to determine precisely the portion of expenses directly attributable to beneficiaries of food assistance provided by WFP. It is possible to distinguish expenses related to food distributions and CBTs, but the Statement of Financial Performance does not enable the portion of employee costs and logistics costs directly related to distributions to be separated out from overheads, in other words costs that do not change according to production. Food distributions and CBTs to beneficiaries totalled USD 3.64 billion, i.e., USD 711 million more than in 2016 and 58 percent of total expenses (an increase compared with the 55 percent observed in 2016).
28. As regards CBTs, out of a total of USD 1.45 billion, USD 769 million (53 percent of the total) was committed to the Syrian crisis, as this means was deemed particularly appropriate to needs related to this crisis. The very sharp increase in expenses related to this innovative activity (USD 564 million between 2016 and 2017) is explained by the USD 435 million increase in cash-based transfers in the “Syria+5” operation and Somalia. Nevertheless, WFP’s main focus remains food distributions, which represented USD 2.2 billion in 2017, an increase of USD 147 million from 2016.
29. Employee costs increased between 2016 and 2017, mainly due to the increase in WFP staffing: 16,218 employees at end-2017, i.e., 593 people more than at end-2016. This figure includes 3,442 employees recruited internationally (148 more than end-2016) and 12,776 employees recruited locally (445 more than end-2016).

WFP/EB.A/2018/6-A/1 88
3. Main points on the financial statements
3.1 Adoption of IPSAS 39
30. WFP decided to apply the new standard IPSAS 39 on employee benefits early and analysed the implications for the Financial Statements together with its actuary, AON Hewitt. The main change is the end of the corridor approach, which allowed the impact of actuarial differences to be deferred. All net actuarial differences are now recognized in the year when they are detected, which led to the restatement of the Statement of Financial Position as at 31 December 2016, increasing the liability arising from employee benefits payable by USD 42 million. Another important change is that net defined benefit liabilities are recognized with an offset to net assets and no longer to the Statement of Financial Performance.
31. The change in accounting method related to the adoption of IPSAS 39 is properly described in Note 1 to the financial statements (paragraphs 24 to 27). The External Auditor agrees with the manner in which IPSAS 39 was implemented.
3.2 Adoption of IPSAS 34, 35, 36, 37 and 38
32. The application of the new standards IPSAS 34, 35, 36, 37 and 38 on separate financial statements, investments in associates and joint ventures, joint arrangements, consolidation and disclosures to be produced in the notes is mandatory for 2017. In order to comply with this obligation, WFP analysed the impact of these new standards on its financial statements. The impact is limited to additional information in the notes: in Note 12 on the treatment of WFP’s interests in the International Computing Centre and in the African Risk Capacity agency in accordance with IPSAS 38 on Disclosure of Interests in Other Entities. Standard IPSAS 34 on Separate Financial Statements, IPSAS 36 on Investments in Associates and Joint Ventures, and IPSAS 37 on Joint Arrangements have no impact for WFP, given that no items falling within the scope of these standards were identified. IPSAS 35 on Consolidated Financial Statements also has no impact, given that the entities falling within this scope, such as the African Risk Capacity agency, were already consolidated in WFP’s financial statements. The External Auditor agrees with the manner in which the new standards IPSAS 34, 35, 36, 37 and 38 were implemented.

WFP/EB.A/2018/6-A/1 89
4. Main internal control points
4.1 Observations from audits conducted in country offices
33. Each year, the External Auditor conducts 10 compliance audits in WFP’s country offices and regional bureaux, providing an opportunity to review certain aspects of internal control useful for financial auditing. The points mentioned below have no significant impact and do not constitute serious internal control deficiencies. However, they illustrate the difficulty of maintaining a high level of financial internal control in a highly decentralized organization such as WFP operating in high-risk environments.
34. During these compliance audits, it appeared that the internal control of capital assets could be improved by performing physical inventories more frequently. When such physical inventories are conducted, they reveal discrepancies with the accounting records that should be analysed (such as the physical inventory conducted by the Johannesburg regional bureau on 25 October 2017 and the physical inventory by the Cairo regional bureau on 29 October 2017, which identified lost or damaged assets). When they are not conducted, or have not been conducted recently, and the External Auditor looks for certain assets appearing in the accounting records, it is difficult to find them, and discrepancies appear (in the case of the Kenya office). In some cases, the risk of damage to assets may come from the very poor conditions of the premises (case of the Nepalgunj sub-office in Nepal).
35. From time to time, the basic controls may be ineffective, due to the lack of sufficient training of the staff in place. The audit of the Cairo regional bureau revealed that it had no daily petty cash count as well as disbursements above the authorized maximum. The audit of the Nepal bureau also showed that a cash fund was maintained by a person who had not been formally designated in this role.
36. The increasingly frequent use of external service providers for warehouse management should be accompanied by sufficient means of control by WFP, in particular to ensure that storage conditions are not likely to lead to the deterioration of certain food products. The risk may be due to an unsuitable temperature (no thermometer in the Harare warehouse in Zimbabwe) or collocation with a non-food stock that may pose a risk of contamination (storage of Chromite in the Durban warehouse in South Africa, although in this case the laboratory test concluded that there was no contamination).
4.2 Contributions receivable and recognition of revenue
4.2.1. Tracking contributions receivable
37. The External Auditor’s work, which includes a procedure for direct confirmation of WFP’s contributions receivable from certain donors, found that the donor response rate was satisfactory (14 responses received out of 21 direct confirmations sent for the audit of the 2017 financial statements) and enabled WFP to carry out useful verifications.
38. WFP tracks receivables over the life cycle of contributions, particularly in order to follow up with donors in arrears. However, the External Auditor received proof of the existence of follow-up on only 32 out of the 91 contributions corresponding to an overdue receivable in 2017.
WFP/EB.A/2018/6-A/1 90
39. With the growth in WFP’s activity (USD 3.9 billion in contributions receivable at end-2017, compared with USD 3.3 billion at end-2016), the procedure of direct confirmation of receivables, as implemented in the context of the External Auditor’s work, is important because it allows WFP to identify any discrepancies between recognized receivables and amounts recognized by donors, which, if they are not analysed in time, may lead to payment delays that would be detrimental to cash flow or even write-offs.5
40. The External Auditor suggests that WFP establish a biannual procedure for direct confirmation of its receivables with its 20 largest donors for earlier detection and investigation of any discrepancies between the recognized receivables and the amounts recognized by donors. WFP does not intend to implement this procedure as it considers that the costs entailed would exceed the expected benefits. Consequently, the External Auditor has not formulated a recommendation on this point.
4.2.2. Quality of financial information
41. Note 2.3 to the Financial Statements includes a table detailing the contributions receivable by accounting year of recognition. It shows USD 3,286.1 million in receivables for 2017 in the 2017 financial statements compared with USD 2,760.3 million for 2016 in the 2016 financial statements, a 19 percent increase between 2016 and 2017. The 2017 line of this table presents the receivables recognized in revenue in 2017 but also the receivables recognized in deferred revenue. This information given to readers about the credit risk assumed by WFP is therefore insufficient, as it does not present receivables by year of expected payment and does not allow late payments to be identified. In order to improve the financial information on this point, the External Auditor proposed detailing the receivables by year of expected payment in Note 2.3 to show the receivables not yet due that will not be payable until future years. This proposal was not followed by the Finance and Treasury Division in order to avoid making the already dense financial information given in the financial statements more cumbersome.
42. Contribution revenues recognized in 2017 totalled USD 6,192.8 million,6 up 5.44 percent from 2016 when it totalled USD 5,873.5 million. Of these revenues, although they do not have a formal condition as defined by IPSAS 23, there was still USD 36 million in pending allocation grants as of 31 December 2017 due to the lack of a decision by the donor on how the contribution should be used or for other administrative reasons. However, information on the pending allocation grants is not provided in the notes, although it would remind donors of the amount of revenues still frozen due to the lack of decision on their part or for other reasons. In order to improve the financial information on this point, the External Auditor proposed indicating in Note 3 the amount of revenues recognized in 2017 but still pending allocation due to lack of instructions from the donor as to how the contribution must be used or for other administrative reasons. This proposal was not followed by the Finance and Treasury Division in order to avoid making the already dense financial information given in the financial statements more cumbersome.
5 Early identification of a late payment may, in some cases, allow detection of a donor’s reluctance to pay and help resolve
disagreements by inducing WFP to provide additional supporting documents 6 Before reduction and refund provisions.

WFP/EB.A/2018/6-A/1 91
4.2.3. Recognition of in-kind contribution revenue
43. Contributions in kind accounted for USD 384.1 million in 2017, down 19 percent from 2016. Further information should be added to section 12.5.13 on in-kind contributions of the Financial Resource Management Manual. The manner of measuring and recognizing in-kind contributions (donations of food products and assets or provision of staff and equipment under standby partner agreements) is not specific enough. The recognition of in-kind contributions obtained through partnership agreements should be based on a detailed assessment of their amounts. With regard to donations of food products and assets, they must be recorded at their fair value.7 The value of the in-kind contribution should be verified, which is not done by WFP, and this verification should be documented when the corresponding revenue is recognized. The External Auditor feels that these key control points should be included in the Financial Resources Management Manual when information is added to its section devoted to in-kind contributions.
Recommendation 5. The External Auditor recommends that WFP add to the Financial Resources Management Manual with respect to in-kind contributions by detailing the documentation that must be provided for the measurement and verification of the value of the recognized revenue (particularly as regards contributions under standby partner agreements for in-kind donations of food products and assets).
4.3 COMET programme online reporting system
44. WFP directive RM2016/004 of 12 April 2016 aims to make the implementation of a monthly online programme reporting system mandatory for all WFP country offices: the COMET tool. Its purpose is to enable managers in the field and at Headquarters to have up-to-date information on the performance of a programme in real time.
45. The goal is to provide quality evidence on the execution of programmes and to facilitate decision-making in a standardized format.
4.3.1. Frequency of tool input
46. Despite the high stakes and the mandatory nature of this directive, some country offices, such as those in Lebanon and Turkey, do not enter data into COMET each month and do so only at the end of the year.
47. Given that COMET is not always updated each month, the External Auditor found that Lebanon had significant unexamined upwards and downwards variations in the amounts distributed between January and March 2018. This situation undermines the expected transparency goals.
Recommendation 6. In order to strengthen the internal control system, the External Auditor recommends that WFP ensure that each country office enters all required information in the COMET system each month.
7 Standard IPSAS 23

WFP/EB.A/2018/6-A/1 92
4.3.2 Reconciliation between data in COMET and data in WINGS and LESS
48. Paragraph 19 of Directive RM2016/004 specifies that data on beneficiaries’ needs must be entered into COMET at the same time as the terms of partnerships are recorded in WINGS. The goal is to enable periodic analysis and reconciliations between the financial, logistical and operational information provided by the two systems.
49. The reconciliation of financial, logistical and operational information is one of the key controls of the internal control system. It allows regular consistency checks to be performed on the basis of reliable indicators and any anomalies to be detected in advance.
50. The reconciliation between data from three difference sources – the accounting records with WINGS, the COMET online reporting system, and the statements provided by partner financial institutions – must serve as a strong internal control. In order to permit this reconciliation, the External Auditor believes that the amounts reported in the COMET system must include only the amounts withdrawn each month by the beneficiaries, whereas the WINGS accounting tool indicates the amount loaded on the e-cards. The difference between these two amounts must theoretically match the unused balances remaining on the beneficiaries’ cards. The implementation of this monthly reconciliation would permit the identification of potentially unused cards and the analysis of the source of this situation.
51. The data entered into COMET for the food stock made available to cooperating partners must theoretically match the corresponding stock outflows in the LESS stock tracking system. COMET currently offers two reports allowing data from LESS to be reconciled with the data entered into COMET. This reconciliation must be carried out in each country office for the validation of the monthly distribution reports produced by the cooperating partners, as indicated in the COMET user manual. However, the implementation of this reconciliation at headquarters, on a monthly basis and for all countries, would help ensure that there are no unjustified discrepancies. The External Auditor considers that it comprises a strong internal control enabled by COMET and that henceforth the role of supervision by headquarters cannot be limited to ensuring technical support to the country offices and regional bureaux and a quarterly review, based on statements by the network.
Recommendation 7. The External Auditor recommends implementing a monthly reconciliation: a) between the cash-based transfer amounts distributed to beneficiaries indicated in WINGS and the amounts reported in COMET; b) between the COMET data on goods received by partners and the logistics data in LESS and then justifying all discrepancies found.
WFP/EB.A/2018/6-A/1 93
5. WFP communication concerning fraud, amounts written off and ex gratia payments
5.1 Prevention of fraud risk
52. As highlighted in the External Auditor’s recent report on losses associated with food supplies, WFP is exposed to an inherent risk of fraud due to its activity, the regions in which it operates, the nature of its assets, the very decentralized nature of its organization and the large number of partners with which it interacts. Frauds are regularly detected as shown by the annual reports of the Inspector General. In 2017, the Inspector General reported to the External Auditor that he was aware of nine frauds or presumptive frauds for a total of USD 0.538 million. These were only the cases of fraud that WFP’s current resources were able to detect and for which the investigations had made sufficient progress as of the closing date of the accounts to reach a conclusion on a financial impact on the 2017 fiscal year. Cases of fraud that by nature do not cause financial loss to WFP are not indicated. In addition, during the audit of the Kenya office, the External Auditor witnessed the diversion of several bags of food by a truck belonging to a company contracted by WFP since May 2017 in Mombasa. As a result of this incident, WFP pursued remedies against this provider, which took disciplinary measures against the driver in question and implemented escort measures to limit the risk of recurrence.
53. The role of the External Auditor is not to investigate frauds or to provide any assurance on the matter whatsoever. Nevertheless, the External Auditor relies on his appreciation of the risk of fraud to define his audit strategy and his work in application of ISA 240. In view of what was set out in the previous paragraph, the External Auditor considered that inherent fraud risk was high at WFP. As such, he adapted his procedures accordingly, in particular to take into account the unpredictability of a portion of the accounting entries tested and by conducting data analyses on cash disbursements in 2017 with the help of Benford’s law on abnormal number distributions. This work did not result in the detection of new potential cases of fraud.
54. The External Auditor observes that WFP is equipped with significant resources to detect and punish fraud, with, in particular, a zero-tolerance policy, investigations conducted by the Inspector General and proactive integrity reviews.
55. Nevertheless, it is necessary to reinforce the elements of internal control that could help prevent and detect potential fraud. Implementation of the recommendations formulated in Part III.1 of this report is likely to assist in reducing the risk of fraud, particularly the recommendation to continue deployment of the SCOPE system to secure the data of beneficiaries of WFP’s distributions, the recommendations on taking advantage of the data reconciliations made possible by deploying the COMET online reporting system, and the recommendation on completing the implementation of the GRC task separation module in WINGS.
5.2 Write-offs and ex gratia payments
56. On 22 March 2018 WFP formally submitted a note to the External Auditor signed by the Executive Director listing all the ex gratia payments and amounts written off of losses of cash, stocks of food commodities, other items and other assets as per Article 12.4 of the Financial Regulations.
57. The amount of commodities written off totalled USD 14.2 million in 2017 versus USD 21.1 million in 2016, with the main losses in 2017 occurring in Yemen and the Syrian Arab Republic.

WFP/EB.A/2018/6-A/1 94
58. In the note dated 22 March 2018, these write-offs were formally authorized in advance by the Executive Director prior to the closing of the accounts, in accordance with the provisions of article 12.4 of the Financial Regulations. This constitutes an improvement on the situation in the preceding report, referring to the 2016 financial year. By contrast, as of the cut-off date, the write-offs of food commodities had not undergone a systematic detailed analysis, and there was no plan of action to limit the future risk even though article 12.4 provides that “the Executive Director may authorize the write-off of funds, revenues and other assets after thorough investigation.” It should be noted that the report on post-delivery losses for 2016, including this analysis, was not released until 25 May 2017, more than a month and a half after the cut-off date of the accounts having taken these write-offs into account. As the External Auditor already indicated in the 2016 financial statement audit report, the write-offs should only be recognized after formal authorization from the Executive Director, on the basis of the annual report on post-delivery food losses, after full investigation, in accordance with the provisions of article 12.4 of the Financial Regulations.
59. Apart from write-offs of food stocks, all ex gratia payments and write-offs in 2017 represented a total of USD 10.9 million, up significantly from USD 6.3 million in 2016. The main amounts written off relate to the settlement of a dispute with a State for USD 5.6 million, receivables disputed by a donor for USD 2.8 million and capital assets destroyed during riots in South Sudan for a net value of USD 846,000.
IV. Acknowledgements
60. The audit team would like to express its sincere gratitude to the Finance and Treasury Division (RMF) for its support during this audit, and in particular to the Chief, General Accounts Branch, who was the primary focal point for this audit. It would also like to thank the other WFP divisions for their contribution to the audit of the Financial Statements.
End of audit observations.

WFP/EB.A/2018/6-A/1 95
Appendix: Audit adjustments and requested modifications to the Financial Statements
61. The work carried out by the External Auditor did not reveal any audit adjustments, whether due to error or difference in judgement.
62. The proposed additions to Note 2.3 to the Financial Statements, to indicate receivables not due until future years, as well as Note 3, to indicate pending allocation grants, were not accepted by WFP’s Finance and Treasury Division, in order to avoid making the already dense financial information given in the financial statements more cumbersome.

WFP/EB.A/2018/6-A/1 96
ANNEX I
Name Address
WFP World Food Programme
Via Cesare Giulio Viola 68/70
Parco de’ Medici
00148 Rome, Italy
General Counsel and
Director, Legal Office
Bartolomeo Migone Via Cesare Giulio Viola 68/70
Parco de’ Medici
00148 Rome, Italy
Actuaries AON Consulting, Inc. 200 East Randolph
Chicago,
IL 60601
United States of America
Principal Bankers Citibank N.A. Via Mercanti, 12
20121 Milan, Italy
Standard Chartered Plc 1 Basinghall Avenue
London, EC2V 5DD, U.K.
External Auditor First President of the
Cour des Comptes (France)
13 rue Cambon
75001 Paris, France

WFP/EB.A/2018/6-A/1 97
Acronyms used in the document
ARC African Risk Capacity
ASHI After Service Health Insurance
ASMP After-Service Medical Plan
BMIP Basic Medical Insurance Plan
CBT cash-based transfer
COMET country office tool for managing effectively
COSO Committee of Sponsoring Organizations of the Treadway Commission
CSP country strategic plan
DOC direct operational costs
DRC Democratic Republic of the Congo
DSC direct support costs
EMG Executive Management Group
ERM enterprise risk management
FAO Food and Agriculture Organization of the United Nations
FI finance module
GA General Assembly
GCMF Global Commodity Management Facility
GM grants management module
HLCM High-Level Committee on Management
ICC International Computing Centre
ICSP interim country strategic plan
IPSAS International Public Sector Accounting Standard
IRA Immediate Response Account
IRM Integrated Road Map
ISC indirect support costs
MICS Medical Insurance Coverage Scheme
MSCI Morgan Stanley Capital International
NGO non-governmental organization
OR Operational Reserve
PIR proactive integrity review
PP&E property, plant and equipment
PSA Programme Support and Administrative (budget)
PSAEA PSA Equalization Account
SDG Sustainable Development Goal
SG Secretary-General

WFP/EB.A/2018/6-A/1 98
SR Strategic Result
STRIPS United States Treasury Separate Trading of Registered Interest and
Principal of Securities
TPA third-party agreement
UNJSPF United Nations Joint Staff Pension Fund
UNORE United Nations Operational Rates of Exchange
USD United States dollar
WINGS WFP Information Network and Global System
ZAR South African Rand
F-EBA2018-16306E