auctions for charity: the curse of the familiar
TRANSCRIPT

Auctions for Charity: The Curse of the Familiar∗
Jeffrey Carpenter† Damian S. Damianov‡ Peter Hans Matthews§
September 2018
Abstract
Recently there has been considerable interest in the use of raffles and auctions to fund
public goods. Economists have developed theories that predict which of the standard
mechanisms should do well and they have run a variety of experiments to test the per-
formance of these mechanisms. One aspect that has been largely overlooked, however,
is whether new mechanisms can yield even more of the public good. We run fundrais-
ing events in the field at the meetings of a well-known service organization across the
United States to examine the properties of five mechanisms: one that is common in the
literature (first-price all-pay auction), two that are familiar to practitioners in the field
(the English/live auction and the raffle), and two that are new (the “bucket” auction
and a lottery-auction hybrid). Consistent with theory, we find large differences in per-
formance between the two most familiar formats but these disparities are dwarfed by
the differentials achieved using the new and less common formats. Our results demon-
strate the continued potential of mechanism design to inform the provision of public
goods and fundraising.
Keywords: Public Good, Raffle, Lottery, Auction, Fundraising, Mechanism Design,
Field Experiment.
JEL Codes: C93, D44, D64, H41
∗We thank Catherine Collins, Brent Davis, Ryan Freling, Joshua Foster, Ellen Green, Daniel Jones,Malcolm Kass, James Kelly, Andrew Kloosterman, Peter Kriss, Nick Lovejoy, Jens Schubert and AnandShukla for research assistance. We also acknowledge the financial support of Middlebury College and theNational Science Foundation (SES 0617778).
†Corresponding author, Department of Economics, Middlebury College and IZA; [email protected].‡Department of Economics and Finance, Durham University; [email protected].§Department of Economics, Middlebury College; [email protected].
1

1 Introduction
“[T]he onus is on philanthropists, nonprofit leaders and social entrepreneurs to innovate. But
philanthropic innovation is not just about creating something new. It also means applying new
thinking to old problems, processes and systems.”
Laura Arrillaga-Andreessen, philanthropist
The conversion of donated goods and services into more liquid assets to fund public goods is
a familiar exercise to most charities and non-profits. According to the Internal Revenue Ser-
vice, for the reporting year 2012, almost 50 percent of the nearly 46 million households that
itemize deductions claimed non-cash charitable contributions. The estimated fair market
value of these contributions was almost 47 million dollars. Indeed, for some organizations,
this “transformation problem” is a formidable logistical challenge. Raffles and auctions are
common solutions to this problem and, over the last decade or two, a vibrant literature on
mechanism choice for non-profits has emerged. Along with the analysis of standard formats,
a nascent literature has arisen that has offered new ones, which, in theory, should do better.
For both analytical and empirical reasons, however, an ordering of mechanism performance
based on expected revenue, not to mention participation and bids, is complicated.
As a theoretical matter, revenue equivalence does not hold, even in the simplest strategic
environments wherein non-profits use the revenues to provide a public good. For example,
the sealed-bid analysis of Goeree et al. (2005), working within the structure developed in
Morgan (2000), was perhaps the first to show that in a world of altruistic, risk neutral
bidders with independent private valuations each of whom (also) receives a benefit that is
proportional to the total amount raised “all-pay mechanisms,” including raffles, should do
better.1 The intuition is straightforward: in “winner-pay mechanisms,” a class that includes
most, but not all, familiar auction formats, a bidder who “tops” her rivals foregoes the
externalities associated with their bids. What remains unclear, however, is the robustness of
this result to the addition of new, perhaps dynamic, formats and endogenous participation
choices.
It is also hard to assess the relative performance of auction and raffle mechanisms with
revenue proportional benefits because the few experiments that have been conducted tend
to be modest as a consequence of each auction yielding just one revenue observation. In
addition, experiments often compare just a few existing formats and new ones have yet
to be tested or compared to the formats that are typically chosen by charities and other
1Engers and McManus (2007) confirm many of these predictions while extending the literature by analyz-ing strategic choices of the auctioneer to set reserve prices or dissolve the auction. Carpenter et al. (2010a)compare the same sealed bid mechanisms but allow participation to be endogenous.
2

organizations investing in the public good. On top of all this, aside from a few important
stylized facts, the experimental results have been inconclusive.2
The theory and experiment described in this paper were designed to extend the developing
literature on charitable mechanism design in a number of important dimensions. Our first
contribution is analytical. In contrast to the benchmark in this literature, Goeree et al.
(2005), we compare an expanded set of mechanisms and allow for endogenous participation,
all in an independent private values setting. To test our predictions, we report the results of
a field experiment conducted on behalf of a national service organization at almost a hundred
events across eleven US states. Our purpose is to provide a robust evaluation of five auction
mechanisms in a natural setting.
The choice of which mechanisms to include was driven by three considerations. First,
to make our results useful to practitioners, we included the two mechanisms used most
frequently by charities in the field - the English or “live” auction and the raffle. Not only
does including these two formats allow us to test how familiar formats compare to new and
less familiar ones, a field comparison of just these two mechanisms is novel and should be of
general interest for those organizations that might be reluctant to try something new.
Second, and with a nod to recent theoretical developments, we included two formats
that ought to do better than those commonly used in the field. Goeree et al. (2005)
show that the all-pay auction, in which the highest bid wins but all bids are forfeited,
should yield more revenue than any winner-pay format like the second-price auction or, by
extension, its strategic equivalent, the live auction. Further, Orzen (2008) finds that the
all-pay also does better than the raffle in a common value environment because the raffle
provides weaker incentives to compete due to the randomness of its allocation rule. More
recently, Carpenter et al. (2014) show that a “bucket auction” in which bidders take turns
making monetary contributions to a “bucket” and the winner is the person who makes the
last contribution should do even better than the standard all-pay because it too is all-pay
but has the incentives of a war of attrition. Following the related literature, we model the
bucket auction as a second-price all-pay auction. While we find, in accordance with previous
analyses, that bidders in the bucket bid more aggressively than in the all-pay, we also find,
somewhat surprisingly, that both mechanisms generate the same level of participation. As a
result, the bucket auction is predicted to perform best in terms of revenue, largely because
of the competitive environment it instills.
Third, to examine the field validity of erstwhile empirical results, we were also careful to
2To see this, compare the results of Morgan and Sefton (2000), Dale (2004) and Carpenter and Matthews(2015) concerning raffles, Davis et al. (2006), Carpenter et al. (2008), Schram and Onderstal (2009),Corazzini et al. (2010), Onderstal et al. (2013) concerning standard auction formats and Goerg et al.(2015), Orzen (2008), Carpenter et al. (2014) and Damianov and Peeters (2018) on new mechanisms.
3

consider mechanisms that have previously done well in the lab. Though already included,
both the all-pay and bucket auctions have done well in the lab environment (Orzen, 2008;
Schram and Onderstal, 2009; Corazzini et al., 2010; Carpenter et al., 2014) but this per-
formance is judged solely on the revenue properties of the mechanisms. Because we are
interested in participation and bidding too, we included winner pay formats which, in the-
ory, should attract more bidders. In addition to the live auction, we consider a “hybrid” that
combines a lottery for participants financed by entry fees with a live auction for those who
choose to enter. Our model predicts that, although this hybrid format should not do partic-
ularly well in participation due to the participation fee, it should outperform the commonly
used formats (i.e., the live and the raffle) because it collects revenue from two sources.3
According to our analysis, the bucket auction is predicted to raise more money than
any other mechanism considered, despite it not yielding the highest participation while the
raffle is predicted to generate the largest number of participants because it incentivizes less
competitive bidding and even the lowest-valued participant has a chance to win. In terms of
mechanism design, we also show that the hybrid could be optimized by correctly choosing the
entry fee, in which case is should always raise more money than the live auction. Considering
our experiment, our title is intended to underscore both our central result and one of the
most important lessons of our work: whatever the revenue differential between the two most
familiar auctions, both perform much less well than the new mechanisms, a pattern that
suggests that behavioral mechanism design has much to contribute.
2 Study Design
When considering where to run our experiment, we sought regional variation to broaden
the representativeness of our results but we also required a host that, to a great extent,
could provide a controlled environment, one with a common setting and philanthropically
minded participants. After a successful local pilot, we decided to conduct our auctions at
meetings of various local Rotary International clubs across the United States. Rotary is
a service organization with 34,000 chapters and 1.2 million members worldwide. Members
believe in the “commitment to service above self” and when they are not volunteering in
their communities, members help raise money to support education and job training, provide
access to clean water, combat hunger, improve health and sanitation, and eradicate polio.4
Local Rotary clubs meet weekly over a meal (usually breakfast or lunch) and are accustomed
3Ironically, despite the entry fee, the hybrid attracted the highest number of bidders in lab experimentalcomparison (Carpenter et al. 2010b).
4https://www.rotary.org/en/about-rotary.
4

to hosting speakers and events in addition to the weekly business conducted at the meetings.
We “piggybacked” on this structure, which allowed us to control for the meeting environment
across different locations, to conduct charity auctions with randomly assigned formats at
various chapters across the country.
We chose a prize for each event that would be site-independent and context-free. We
decided that the prize should also be familiar, something that would be natural at a fund-
raiser and that it should be acquired easily at our different field locations. Our lot consisted
of two bottles of relatively high quality wine (both received Wine Spectator scores of 90 out
of 100). We included one bottle of non-vintage prosecco (that showed a “good blend of baked
apple, sour lemon and grapefruit”) and one bottle of South American cabernet sauvignon
(with “crushed plum, fig and black currant fruit woven with Mauro tobacco and bittersweet
cocoa”). The combined retail value of the wine was $35. At each event, we provided the
prize and all proceeds from the auction went directly to supplement the fund-raising efforts
of the local Rotary chapter that hosted the event.
To conduct the events, we recruited eleven auctioneers from various graduate programs
in economics in addition to our two local research assistants. Each auctioneer attended a
training session at which we explained the background and goals of the research project,
worked through the details of the protocol, and met with the president of the local Rotary
chapter to strategize about the best way to gain access to clubs. Shortly after arriving home,
each auctioneer received a standard provision of supplies that allowed him or her to conduct
events. The auctioneers worked first to get on the meeting schedule for clubs in their local
area and were able to use our local president as a reference. Once the schedule was set, we
randomly assigned mechanisms to clubs, stratifying on location with the purpose of making
sure that each of our auctioneers would run multiple different mechanisms.
Prior to every event, the Rotary chapter contacts let the members know that our research
assistant was going to visit to conduct a fundraiser for Rotary and then talk about raising
money for charity, more broadly. However, neither the leaders nor the members knew the
details of the event in advance. Most importantly, they did not know which mechanism
would be used. Once an event started, the auctioneer followed a highly scripted protocol.
Club members were given a large manila envelope and told to take out a survey to complete
while they ate. Once the surveys (and meals) had been completed, the auctioneer introduced
her- or himself and said that (s)he was there to talk about ways of turning donations in-kind
into cash but that they would start with an example – our wine auction. The auctioneer
then displayed and described the two bottles of wine (but did not reveal the retail price)
and stressed that we had donated the wine but all the revenue from the auction would go
directly to Rotary. Participants took out printed instructions from the envelope and read
5

along as the auctioneer explained the rules, all of which, including any mechanism-specific
language, are provided in the appendix.
Once any questions were clarified (by returning to the appropriate section of the instruc-
tions), the auction began. Club members were instructed to first pull out a “registration”
card on which they indicated whether or not they would participate. For the sealed bid
mechanisms (all-pay, raffle) this card also recorded their bids.
The bidding in each mechanism proceeded as follows. For the live auction, and the live
component of the hybrid auction, the auctioneer was told to always start by asking for an
opening bid of $25 and to reduce the opening bid by $5 decrements until someone entered.
Once the bidding began, the auctioneer was instructed to increase the price by $5 incre-
ments until (s)he could no longer and then drop to $1 increments until the final price was
determined. In the all-pay, participants wrote their bids on the registration cards and in-
cluded them with payment in a sealed envelope.5 In the raffle, participants indicated on the
registration card the number of $5 tickets they would like to purchase and the auctioneer
collected payments before randomly selecting the winning ticket. In the bucket, each partic-
ipant was given a common endowment: a clear bag that contained 30 red poker chips, each
worth $5. Participants were told that they would only have to pay for the chips that they
used and that more chips were available, if needed. They were then sorted by their randomly
assigned participant numbers and organized into a circle. The auctioneer presented a small
galvanized bucket to the person with the lowest participant number who started the auction.
This person could either place a $5 chip into the bucket or withdraw from the auction. The
auctioneer then cycled with the bucket around the circle (in order of increasing participant
numbers) asking each person to add a chip to the bucket or withdraw. Eventually all but
one bidder dropped out and the last remaining bidder was declared the auction winner. In
the hybrid, before getting to the live auction, members who wanted to participate had to pay
a $5 entry fee for which they received one lottery ticket. After the live auction had finished,
the auctioneer drew one of the tickets at random and the ticketholder won half of the entry
fees. The remaining half was added to the auction revenue and donated to Rotary (this is
known as a 50-50 lottery).
Once winners were determined and payments reconciled, the auctioneer awarded the
wine, announced how much money had been raised and publicly gave the chapter president
the auction proceeds. After this, there was typically enough time for the auctioneer to
do a quick debriefing. Members were given a two-page summary of the project with some
previous lab results and the auctioneer answered questions and discussed the problem of
5It was common knowledge that payments could be made via credit card, check (made out directly toRotary) or cash (and that the auctioneer could make change, if needed).
6
in-kind donations and the virtues of the different charity auction mechanisms.
3 Participation, Bid and Revenue Predictions
To get a sense of the expected fundraising capabilities of the five mechanisms implemented
in the field, we study their equilibria and compare their relative performance on both the
extensive (participation) and intensive (expected bid) margins as a means to decompose
any expected revenue differences. Our model combines two features that have recently
been studied in separate strands of the auction theory litrature: bidding in the presence of
externalities generated via charitable giving (see e.g. Engelbrecht-Wiggans 1994, Goeree et
al. 2005 and Engers and McManus, 2007) and endogenous participation related to entry
costs (see, e.g. Samuelson, 1985 and Menezes and Monteiro, 2000). As in most of this work,
we consider a model in which n ≥ 2 potential risk neutral bidders have valuations which
are independent draws from a continuously differentiable probability distribution F with
support [v, v] and density f that is positive in the interior of the support. The valuation of
bidder i = 1, 2, . . . , n, denoted by vi, is private information, while the cumulative distribution
function F is common knowledge.
As in Goeree et al. (2005), all bidders receive a benefit equal to a proportion, α < 1/n, of
auction revenues. Further, as in Menezes and Monteiro (2000), bidders incur a participation
cost, c > 0, which is associated with the time and effort expended to prepare and submit
a (sealed) bid or to formulate and execute a bidding strategy. The seller utilizes one the
following five mechanisms: all-pay auction (a), bucket auction (b), hybrid auction (h), live
auction (l), or raffle (r). In this setting, the live auction is isomorphic to a second-price
winner-pay action (see Engers and McManus, 2007, Proposition 1) while the hybrid auction
is isomorphic with a second-price winner-pay auction with a participation fee. Further,
for the purpose of our equilibrium analysis, we approximate the bucket auction with the
second-price all-pay auction. An equilibrium analysis with endogenous participation of the
second-price winner-pay (or live) auction and the all-pay auction is developed in Carpenter
et al. (2010a). We extend this analysis and discuss the symmetric Bayes-Nash equilibrium
behavior for all five formats.
For expositional clarity, and to facilitate the comparison across mechanisms, we analyze
separately the all-pay auctions, the winner-pay auctions, and the raffle, which is an all-pay
format based on a non-perfectly discriminating contest. The equilibria of all mechanisms are
given in cutoff strategies such that bidders participate only if their valuations are equal to
or exceed a certain threshold and, conditional on participation, submit a bids which depend
on their private values. The following proposition describes bidding in the all-pay formats.
7

Proposition 1 (All-pay auctions). The threshold participation values for both auctions
are equal, va = vb = vaband are given by the equation
F (vab)n−1vab = c
The symmetric Bayes-Nash equilibrium bid functions σj(v) for j = a, b and v ≥ vab are
σa(v) = (n− 1)
∫ v
vab
xf(x)F (x)n−2
1− αdx
σb(v) = (n− 1)
∫ v
vab
xf(x)F (x)n−2
(1− α)− (1− αn)F (x)n−1 − α(n− 1)F (x)n−2dx
The corresponding expected revenues are
Ra = n(n− 1)
∫ v
vab
x
1− α[F (x)n−2(1− F (x))f(x)]dx
Rb = n(n−1)
∫ v
vab
x(1− F (x)n−1)
(1− α)− (1− αn)F (x)n−1 − α(n− 1)F (x)n−2[F (x)n−2(1−F (x))f(x)]dx
and the bucket auction revenue dominates the all-pay auction (i.e., Rb > Ra). See the
appendix for a proof of this proposition.
We next present an analysis of the winner pay formats: the live and the hybrid auctions.
Recall that the difference between these two formats is that in the hybrid auction bidders
are charged an entry fee, half of the entry fees collected are awarded as a prize in the lottery
part of the auction and the other half are added to the auction revenue. We denote the
effective participation fee, i.e., half of the entry fee charged, as e. Predictions in the live and
the hybrid auctions are given as follows.
Proposition 2 (Winner-pay auctions). Participation in the live auction is greater than
or equal to participation in the hybrid but the live yields less revenue than an optimally
designed hybrid auction, conditional on the optimal hybrid having a positive entry fee. The
participation threshold values for the live auction vl and the hybrid auction vh are given by
the equations
F (vl)n−1vl + α(n− 1)F (vl)n−2(1− F (vl))σls(vl) = c
8
F (vh)n−1vh + α(n− 1)F (vh)n−2(1− F (vh))σls(vh) = c+ (1− α)e
if these equations have a solution in the interval (v, v). Otherwise, either all bidders partici-
pate or none do in the respective mechanism.
The symmetric Bayes-Nash equilibrium bid functions are the same σl(v) = σh(v) = σlh(v)
and are given by
σlh(v) = v +
∫ v
v
(1− F (x)
1− F (v))
1αdx
and the expected revenues are
Rl = n(n− 1)
∫ v
vlF (x)n−2(1− F (x))f(x)σlh(x)dx
Rh = n(n− 1)
∫ v
vhF (x)n−2(1− F (x))f(x)σlh(x)dx+ n(1− F (vh))e
A noteworthy aspect of these results is that for n = 2 and vl = v the left hand-side of the
first equation equals ασlh(vl) and is positive. This suggests that when c is smaller than the
left hand-side of the same equation evaluated at v, the seller can charge an entry fee equal
to the difference c−F (v)n−1v+α(n− 1)F (v)n−2(1−F (v))σls(v) without causing bidders to
exit. Thus, the revenue in the hybrid auction, for an appropriately chosen entry fee, exceeds
the revenue in the live auction. This is only a feature of the two bidder case, however, as the
participation of one bidder prevents her rival from obtaining the prize without contributing
anything. Note that in the case of three or more bidders this effect does not exist and the
incentives to enter are weaker. That is, in the case of three or more bidders, in equilibrium
bidders will enter with a probability of less than one as long as c > 0. In addition, from
the equation defining the participation rate in the hybrid auction we observe that charging
an entry fee might potentially raise revenue but at the cost of participation. To establish a
condition for the revenue-maximizing entry in the hybrid auction, it is convenient to write
the entry fee as a function of the threshold value using the equation for the entry in the
hybrid auction:
e(vh, c) =1
1− α[F (vh)n−1vh + α(n− 1)F (vh)n−2(1− F (vh))σls(vh)− c]
With this formulation, the problem of the auctioneer can be stated as one of choosing the
optimal vh.
9

A derivation of the symmetric Bayes-Nash equilibrium of the live auction is presented in
Carpenter et al. (2010a). As the hybrid auction can be viewed as a live auction augmented
with an entry fee, it is straightforward that bidders will follow the same type-dependent
strategy in equilibrium, yet, due to the entry fee, the participation threshold value in the
hybrid auction will be greater. Bidders with valuations below the threshold, vh, given by the
first equation in Proposition 2 receive a negative payoff and prefer not to participate while
bidders with values equal to or above vh find it worthwhile to make a bid.
Considering biding in the raffle,
Proposition 3 (Raffle). The raffle has a unique Bayes-Nash equilibrium. The participation
threshold value for the raffle vr is determined by the equation
vr ×∫ v
v
· · ·∫ v
v
σi(vr)∑
j 6=i σj(vj) + σi(vr)dF−i(v−i) = c
if this equation has a solution in the interval (v, v). Otherwise ether all players participate
or all players do not participate in the mechanism. For v ≥ vrthe (symmetric) Bayes-Nash
equilibrium function σr(v) satisfies the conditions
v ×∫ v
v
· · ·∫ v
v
∑j 6=i σj(vj)
[∑
j 6=i σj(vj) + σi(v)]2dF−i(v−i)
= 1 if σi(v) > 0
≤ 0 if σi(v) = 0
where σi(v) = σj(v) = σr(v) for i = 1, 2, . . . , n. Bidders with values v < vr do not participate,
i.e. for these values σr(v) = 0.
A proof of the existence and uniqueness of equilibrium in this setting is provided by
Ewerhart (2014). The first condition in Proposition 3 requires that the threshold bidder has
an expected payoff equal to the entry cost. The second condition is a first order condition
that requires that each bidder type submits a bid which maximizes its expected payoff given
the equilibrium strategy employed by the other bidders. A similar approach is used by Fey
(2008), Ryvkin (2010) and Wasser (2013). As pointed out in these studies, the equilibrium
strategy in the raffle cannot be expressed in closed form, yet further progress can be made
using numerical methods.
To get a sense of the relative performance of the five mechanisms, we adapted the nu-
merical routines developed in Wasser (2013) to account for endogenous entry choices and
report the participation, bids and revenues generated by each of the five mechanisms using
parameter values based on our experiment. As part of our post-experiment questionnaire,
we asked participants for their private valuations of the lot of wine we used as the auction
prize. It turns out that 90% of these values are between $10 and $60. We, therefore, assume
10

that values in our simulations are uniformly distributed over the interval [10, 60], with an
expectation of $35, the actual monetary value of the prize. We assume that the cost of
participation is low, c = $1 and to examine how the results change as the number of bidders
increases, we present calculations for as few as 2 potential bidders and as many as 20. Lastly,
the benefit from the public good is set at α = 0.25 and the entry fee for the hybrid is $2.5,
half the fee charged in the field (see the appendix for additional details of our numerical
methods). The major results are presented in Figure 1 below.
Figure 1: Charity Auction Theoretical Predictions (Note: numerical simulations generate
predictions on expected rates of participation (left), mean bids, including zeros for non-
participants (middle) and expected revenues conditional on endogenous participation (right)).
The numerical simulations help highlight several aspects of the expected performance of
the mechanisms. Starting with the extensive margin, we see that the raffle does particularly
well, with expected participation rates often well over 50%. In fact, with thick enough
auctions (i.e., n > 4) the raffle is predicted to perform best on participation and the gap
between it and the live auction only grows with the size of the event. The driving force
behind this result is that even the lowest-value participant has a positive chance of winning
the prize and the mechanism elicits lower levels of competition due to the non-perfectly
discriminating nature of the lottery contest. Placing second in the participation race is the
live auction, which is no surprise given bidders have nothing (beyond the same participation
cost faced by the others) to lose. In third (and fourth) place in terms of participation, are
the all-pay formats, which do just a bit better than the hybrid. Hence, the balance of our
11
numerical simulations suggest that in circumstances like ours in which the number of active
bidders is always greater than four, in terms of participation, we should expect: Raffle >
Live > All-pay = Bucket > Hybrid.
Considering predictions on the intensive margin, at the center of Figure 1, we see that
the bucket is predicted to garner the highest average bid, regardless of the size of the event.
In addition, the predicted difference between it and the second highest performer, the live
auction, is large. The predicted average bids in the other four mechanisms are clustered
in two groups. Along with the live in the better performing cluster, is the hybrid in third
place. The anticipated difference between the live and hybrid auctions is not large, however.
As expected, the remaining two all-pay mechanisms perform worst in terms of predicted
bids, with the all-pay doing a bit better than the raffle. Putting this all together, our model
predicts the following ordering of mean bids: Bucket > Live > Hybrid > All-pay > Raffle.
On the right of Figure 1, we find that the bucket, which is predicted to incentivize compet-
itive bidding, is expected to yield the most revenue under all conditions and the differential is
always sizable. Because, like the bucket, the all-pay collects bids from everyone and doesn’t
scare away too many bidders, it comes in second place in the revenue race after more than
four bidders join. The fact that the hybrid gathers revenue from two sources helps it do bet-
ter than the live auction. Finally, the predicted inefficiency and reduced competitiveness of
the raffle causes it to come in last place in the theoretical revenue competition. Summarizing
our revenue predictions, we expect: Bucket > All-pay > Hybrid > Live > Raffle.6
Also of note, though mostly for future work, is that our numerical simulations also
demonstrate that the opportunity cost of not designing the hybrid auction optimally is
small. Using the results of Proposition 2 to calculate the optimal entry fee for each set of
parameter values, we see that, if designed properly, the hybrid would remain in last place in
the participation competition because the optimal fee is always larger that the one charged
in the field, and despite the larger fee, because it is collected from even fewer participants in
many cases, the hybrid never quite “pips” the all-pay for second place in terms of revenue.
4 Results Overview
In total, our research auctioneers conducted 96 events in 11 states with 1706 Rotary club
members. The geographic distribution of our auctions is depicted in Figure 2. Starting in
the Northeast, 4 sessions were conducted in rural Maine (52 participants), 8 sessions were
6One last thing to notice about Figure 1 is that in some cases (mostly when n is low) the mean predictedbid in the bucket is larger than the revenue to be collected. To reconcile these results, recall that the bucketis isomorphic with a second-price all-pay auction in which the highest bid is never collected.
12
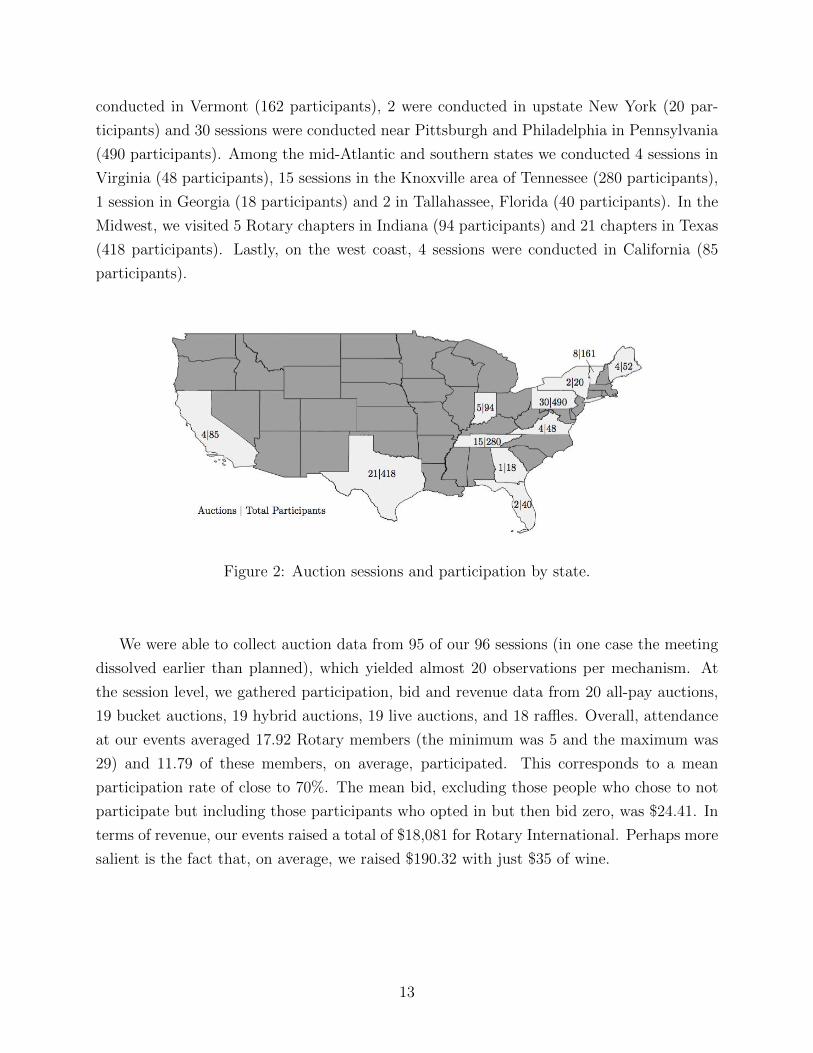
conducted in Vermont (162 participants), 2 were conducted in upstate New York (20 par-
ticipants) and 30 sessions were conducted near Pittsburgh and Philadelphia in Pennsylvania
(490 participants). Among the mid-Atlantic and southern states we conducted 4 sessions in
Virginia (48 participants), 15 sessions in the Knoxville area of Tennessee (280 participants),
1 session in Georgia (18 participants) and 2 in Tallahassee, Florida (40 participants). In the
Midwest, we visited 5 Rotary chapters in Indiana (94 participants) and 21 chapters in Texas
(418 participants). Lastly, on the west coast, 4 sessions were conducted in California (85
participants).
Figure 2: Auction sessions and participation by state.
We were able to collect auction data from 95 of our 96 sessions (in one case the meeting
dissolved earlier than planned), which yielded almost 20 observations per mechanism. At
the session level, we gathered participation, bid and revenue data from 20 all-pay auctions,
19 bucket auctions, 19 hybrid auctions, 19 live auctions, and 18 raffles. Overall, attendance
at our events averaged 17.92 Rotary members (the minimum was 5 and the maximum was
29) and 11.79 of these members, on average, participated. This corresponds to a mean
participation rate of close to 70%. The mean bid, excluding those people who chose to not
participate but including those participants who opted in but then bid zero, was $24.41. In
terms of revenue, our events raised a total of $18,081 for Rotary International. Perhaps more
salient is the fact that, on average, we raised $190.32 with just $35 of wine.
13

Table 1: Treatment Balance
All-pay Bucket Hybrid Live Raffle
Age 57.93 58.12 56.80 56.00 56.79
Female 0.26 0.22 0.23 0.25 0.23
White 0.82 0.84 0.87 0.90 0.89
College or More 0.70 0.68 0.69 0.76 0.76
High Income 0.54 0.56 0.50 0.51 0.53
Notes: Participant characteristic means by treatment.
Given the membership of Rotary, our participants were representative. The average age
of session attendees was 57.11, 24% were female, and 86% had at least a college education.
The median income of the group (measured in intervals) was $100k-$124k. For the purposes
of our analysis we create an indicator (“High Income”) for at least this level of earnings.7
Considering randomization to auction format based on observables, Table 1 indicates balance
was achieved, for the most part.8
5 Mechanism Differences
In many cases charities that conduct fundraisers such as ours are as interested in participation
as they are in revenue. An event that draws in potential donors because it is interesting, fun
or stimulating may raise as much or more money in the long run through the development
of a “warm list” (Landry et al. 2010) as one that initially generates a lot of revenue but
leaves donors feeling “tapped out”. In addition, final auction revenue is determined both by
bidding behavior and participation. With this in mind, we analyze our auction data in three
steps. We start by testing for differences in participation rates across the five mechanisms,
we then repeat the tests to explore any differences in bidding behavior and we conclude the
analysis by comparing the revenues generated by each mechanism.
7Specifically, there were ten household income brackets participants could choose from (starting with “lessthan $25k” and ending with “more than $225k”) and High Income is coded as 1 when a participant choseone of the top five choices (and is coded as 0 otherwise).
8Using t-tests, in only 8 of the 50 possible comparisons between mechanisms do we find demographicdifferences that rise to the 5% level of significance.
14
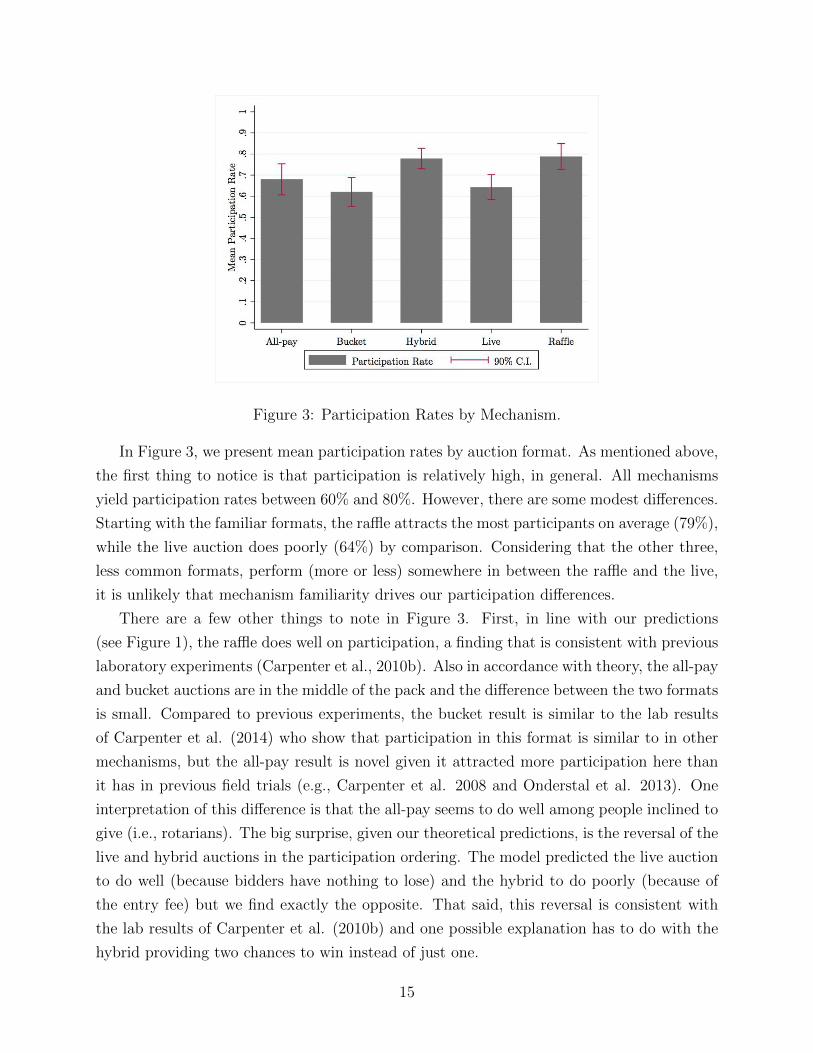
Figure 3: Participation Rates by Mechanism.
In Figure 3, we present mean participation rates by auction format. As mentioned above,
the first thing to notice is that participation is relatively high, in general. All mechanisms
yield participation rates between 60% and 80%. However, there are some modest differences.
Starting with the familiar formats, the raffle attracts the most participants on average (79%),
while the live auction does poorly (64%) by comparison. Considering that the other three,
less common formats, perform (more or less) somewhere in between the raffle and the live,
it is unlikely that mechanism familiarity drives our participation differences.
There are a few other things to note in Figure 3. First, in line with our predictions
(see Figure 1), the raffle does well on participation, a finding that is consistent with previous
laboratory experiments (Carpenter et al., 2010b). Also in accordance with theory, the all-pay
and bucket auctions are in the middle of the pack and the difference between the two formats
is small. Compared to previous experiments, the bucket result is similar to the lab results
of Carpenter et al. (2014) who show that participation in this format is similar to in other
mechanisms, but the all-pay result is novel given it attracted more participation here than
it has in previous field trials (e.g., Carpenter et al. 2008 and Onderstal et al. 2013). One
interpretation of this difference is that the all-pay seems to do well among people inclined to
give (i.e., rotarians). The big surprise, given our theoretical predictions, is the reversal of the
live and hybrid auctions in the participation ordering. The model predicted the live auction
to do well (because bidders have nothing to lose) and the hybrid to do poorly (because of
the entry fee) but we find exactly the opposite. That said, this reversal is consistent with
the lab results of Carpenter et al. (2010b) and one possible explanation has to do with the
hybrid providing two chances to win instead of just one.
15

Table 2: Participation Differences
(1) (2) (3) (4)
All-pay (I) 0.037 0.036 0.024 0.031
(0.055) (0.057) (0.044) (0.046)
Bucket (I) -0.022 -0.007 -0.031 -0.013
(0.053) (0.059) (0.044) (0.053)
Hybrid (I) 0.136*** 0.128** 0.139*** 0.132***
(0.044) (0.054) (0.035) (0.045)
Raffle (I) 0.146*** 0.156*** 0.148*** 0.152***
(0.049) (0.054) (0.045) (0.043)
Intercept 0.643*** 0.766*** 0.616*** 0.566***
(0.034) (0.244) (0.028) (0.072)
Level of Analysis Ses. Ses. Ind. Ind.
Experimenter Fixed Effects No Yes No Yes
Participant Demographics Included No Yes No Yes
Zip Code Level Controls Included No Yes No No
Observations 95 95 1690 1583
Adjusted R2 0.13 0.40 0.02 0.03
Notes: Dependent variable is event participation rate for session-level analysis and a participation indicator
for individual analysis; omitted mechanism is the Live auction; OLS; (robust standard errors); * p<0.10,
** p<0.05, *** p<0.01; demographics include mean age, number of female attendees, number of
attendees with high income, number of attendees with a college degree or more education; other zip code
level controls include averages of adjusted gross income, unemployment insurance, charitable contributions,
homeownership rates and travel times to work.
To generate conservative estimates of the participation differences, in Table 2 we regress
event-level participation rates on format indicators in the first two columns. The first column
replicates the findings presented in Figure 3 – there are two groups of mechanisms separated
by a participation differential of slightly more than 10%. In one group, the raffle and the
hybrid attract almost 80% of bidders and in the other group the all-pay, the bucket and
the live attract closer to 65%. Comparing all combinations of the point estimates, confirms
this grouping. In the second column we add experimenter (i.e., auctioneer) fixed effects to
make sure that we aren’t attributing differences to the mechanisms when they are actually
driven by the differential “charm” of our auctioneers. We also add characteristics of the
attendees: their average age, the number who are female, the number who earned a college
degree or more and the number who have incomes larger than the median of our entire
sample. Using IRS and Census data from 2010 we also created controls at the zip code level
16

for household-level averages of adjusted gross income, reported unemployment insurance
received, charitable contributions, homeownership, and travel times to work.
Although some of the auctioneers were more charming than others (see the increased
adjusted R2 in column 2), the differences are orthogonal to our mechanism treatments (as
stratification ensured). The addition of the other variables (to control for willingness to pay,
philanthropic environment, population density, and, perhaps sprawl/stress) contributes little
to the explanatory power of the model and has no effect on our participation estimates. In
columns (3) and (4) of Table 2 we redo the analysis using the individual-level participation
data. Here the point estimates are nearly identical but measured more precisely because of
the increased number of observations. In the end, we conclude that the familiar raffle and
the not so familiar hybrid attract more bidders than the other three mechanisms, however,
while significant, the participation differences are modest.
Figure 4: Bids by Mechanism (participants only).
Average bids, including those from people who participated but bid zero (18% of the
sample), are summarized by format in Figure 4. Notice first that the mean bids in the
live auction and the hybrid are only slightly lower than the retail value of the wine. On
average, participants bid $28.22 in the live and $28.42 in the hybrid (excluding the $5
participation fee) which, as predicted in Proposition 2, are statistically indistinguishable in
the individual-level data (t = 0.07, p = 0.95). Also notice that participants in the all-pay
and the raffle react as expected to the fact that their bids are always forfeited - they bid
less than participants in the winner-pay formats. Again using the individual-level data, the
all-pay mean bid is significantly lower than all formats except the raffle (p < 0.01 for all
17

comparisons). Bidders in the bucket, do not reduce their bids, however. The mean bid in
the bucket is $35.58, an amount significantly greater than all the other formats (p ≤ 0.05
or lower) and indistinguishable from the retail values of the prize (t = 0.20, p = 0.84).
Considering our theoretical predictions by returning to Figure 1, we see that mean bids are
ordered, more or less, exactly as predicted.
Table 3: Bid Differences
(1) (2) (3) (4)
All-pay (I) -9.315*** -8.607** -8.835*** -9.155***
(3.066) (3.848) (1.975) (2.283)
Bucket (I) 7.145 6.690 8.103** 6.198*
(4.710) (5.360) (3.540) (3.674)
Hybrid (I) 1.021 1.723 1.225 -0.665
(4.936) (5.126) (3.107) (2.884)
Raffle (I) -13.828*** -13.780*** -14.276*** -14.990***
(3.182) (4.593) (1.810) (12.541)
Intercept 27.862*** 10.165 18.729* 20.421*
(2.461) (26.971) (9.969) (10.687)
Lambda 18.004 8.517
(18.697) (20.090)
Level of Analysis Ses. Ses. Ind. Ind.
Experimenter Fixed Effects No Yes No Yes
Participant Demographics Included No Yes No Yes
Zip Code Level Controls Included No Yes No No
Observations 95 95 1554 1535
Adjusted R2 or Rho 0.21 0.27 0.56 0.29
Notes: Dependent variable is mean bid for session-level and bid for individual-level analyses; the omitted
mechanism is the Live auction; OLS or Heckman with instruments of having cash on hand and a willingness
to participate in a follow-up survey; (robust or bootstrap standard errors); * p<0.10, ** p<0.05, *** p<0.01;
demographics include mean age, number of female bidders, bidders with high income and bidders with a
college degree or more education; zip code level controls include averages of adjusted gross income,
unemployment insurance, charitable contributions, homeownership rates and work travel times.
Table 3 offers guarded bid estimates by first collapsing the data to session averages
in columns (1) and (2). Compared to the live, participants in the all-pay and raffle bid
considerably less. Conditional on participating, all-pay donors bid approximately $9 less
18

than live bidders and raffle donors give even less, almost $14. Both of these differences are
highly significant and do not depend on whether demographic or experimenter controls are
included. In addition, the hybrid point estimate is never significantly different from zero
suggesting there are no synergies between the lottery and auction in this mechanism. Again,
auctioneer fixed effects and participant demographics have little effect on these estimates.
Lastly, the point estimate on the bucket differential hovers around $6 which is a significant
sum, but there is not enough power in the auction-level data to identify it precisely.
In the second two columns of Table 3, we re-examine bids by taking advantage of the
individual level data. Doing so increases the power of the analysis considerably and has
the additional benefit of allowing us to instrument for selection. We utilize a standard two-
stage Heckman selection model in which the first stage instrument comes from our survey.
Although all methods of payment were possible on the day of an event, we expected people
to be more likely to participate if they had cash on hand (and that this would be equally
true for all the mechanisms). Indeed, having access to cash at the time of the event is a
strong predictor in the first-stage regressions: it increases the probability of participating by
8.5 percentage points (and has no significant effect on bids conditional on participation). In
addition, the estimated effect of selection (Lambda × the average mills value) is economically
significant: those who choose to participate submit bids that are between $4.41 and $9.24
higher. But, despite all this, a Hausman test indicates that the estimated selection effect
does not bias the collection of mechanism coefficients significantly. Most importantly, the
only noticeable change we see from using the individual-level data is that our estimate of
the bucket differential increases and is now significant. While all-pay bidders in the sealed
bid auction and raffle reduce bids as expected compared to the live and hybrid auctions, we
find that bucket auction bidders donate more than all others.
At this point the careful reader should have a good sense of what the revenue comparisons
will look like. Given participation is roughly similar across mechanisms but participants tend
to reduce their bids in only two of the three all-pay mechanisms, the one in which they do not
reduce their bids must do well. Indeed, in Figure 5 we report average revenues by mechanism
and find that the most familiar auction mechanism (the live) tends to double the retail value
of our prize while the least familiar (the bucket) increases it by more than an order of
magnitude. Compared to the other formats, the live auction appears to underperform, but
it actually did rather well for Rotary. On average, the live auction garnered $63, which
is close to double the wine’s retail value. The hybrid, with its two components, did a bit
better, $103, on average.9 And, consistent with theory, the all-pay ($211 on average) did
9However, if we just consider the live auction proceeds (i.e., in the absence of the lottery revenue), thehybrid generates an average of $71 which is indistinguishable from the live (p=0.50).
19

slightly better than the raffle ($179) but both do considerably better than either the hybrid
or live auctions. All the revenue differences are dwarfed, however, when we consider the
bucket, which raised an average of $393. Not only does the bucket come close to doubling
the revenues generated in either the all-pay or the raffle, it yields more than six times the
revenue raised in the live auction. Considering theory, the observed revenue ordering is as
predicted with one exception: while the raffle was predicted to collect the least amount of
revenue, in the field it outperformed both the hybrid and live auctions.
Figure 5: Revenue Raised by Mechanism.
In Table 4 we examine the revenue differences more closely. Again, the live auction is used
as the baseline mechanism. Column (1) suggests that all the mechanisms yield significantly
more revenue than the live auction. Comparing the point estimates we also confirm that
the hybrid raises significantly less money than any mechanism except for the live auction,
the all-pay and the raffle raise equal amounts of revenue, and the bucket earns significantly
more revenue than any other mechanism. In column (2) we add experimenter fixed effects,
bidder characteristics and the zip code level controls to little effect.10 In column (3) we
include the number of active bidders (instrumented using the start time of the event - more
active bidders turn out at breakfast meetings) to make sure that the revenue differences are
not being driven by differences in participation. Although it is the case that, on average,
another bidder increases revenue by slightly less than $12 across mechanisms, controlling
for this affects our estimates of mechanism performance only slightly. Like the rest of the
10Judging by the small bump in adjusted R2 between the first two columns of Table 2, the differencesamong our auctioneers effect participation primarily and not revenue.
20

analysis, our revenue results are very robust: the hybrid and live auctions perform relatively
poorly, the all-pay auction and raffle do relatively well, but the bucket auction raises the
most revenue for charity in this field setting.
Table 4: Revenue Differences
(1) (2) (3)
All-pay (I) 147.965*** 164.519*** 168.854***
(25.497) (32.027) (33.594)
Bucket (I) 329.474*** 333.863*** 345.748***
(59.345) (76.732) (82.726)
Hybrid (I) 39.895*** 57.518** 55.608*
(11.622) (26.787) (30.928)
Raffle (I) 115.468*** 130.436*** 104.415***
(19.757) (34.481) (38.610)
Active Bidders (#)α 11.943
(14.385)
Intercept 63.421*** 4.902 -90.018
(5.676) (329.920) (382.508)
Experimenter Fixed Effects No Yes Yes
Participant Demographics Included No Yes Yes
Zip Code Level Controls Included No Yes Yes
Observations 95 95 95
Adjusted R2 0.41 0.45 0.48
Notes: Dependent variable is auction revenue; the omitted mechanism is the Live auction; OLS;
(robust standard errors); αevent start time is used as an instrument for the number of active
bidders; * p<0.10, ** p<0.05, *** p<0.01; demographics include mean age, number of female
bidders, number of bidders with high income, number of bidders with a college degree or more
education; other zip code level controls include averages of adjusted gross income, unemployment
insurance, charitable contributions, homeownership rates and travel times to work.
6 Discussion
Casual observation suggests that the set of mechanisms that charities use to raise money
from contributed goods and services is small. When an auction is chosen, it is typically a
“live” (aka English) auction and when an auction is not used, the alternative is almost always
a raffle. It is hard to tell exactly how beneficial these choices are for charities because other
mechanisms (e.g., the all-pay auction) are considered so rarely, there are selection issues (live
21

auctions tend to be used when an event is possible and raffles are used when one is not) and
there is very little field data on which to base an assessment. In other words, it is hard to
know whether charities choose prudently or fall victim to the “curse of the familiar”.
We conducted an experiment with Rotary clubs to examine the relative performance of
the small set of common formats and to test whether charities might do better by considering
new, more novel, formats. Our results are unique because we are able to organize a large
number of identical events, the events took place across the United States and, crucially, we
were able to randomly assign auction formats to fundraisers.
To summarize our findings, we circle back to Section 3 and ask how well our results “jibe”
with theory. Considering participation, Figure 1 predicted that the raffle and live formats
would do better than the bucket and all-pay, which should be indistinguishable, and that
the hybrid would do worst. We find this mostly though there is one significant exception.
Our data suggests that the hybrid does much better than expected. Considering our bidding
hypotheses (also based on Figure 1), we find that theory does a particularly good job of
anticipating our field results. As predicted, the bucket does best followed by the two winner-
pay formats and then the raffle. Likewise, theory predicts almost all of our revenue results.
In this case, the one paradoxical result we find is that, instead of the winner pay formats
(the hybrid and the live) doing better than the raffle, we find the opposite: the raffle does
better than expected and the winner pay formats do worse.
Turning to the pragmatic lessons from our study, our data suggest that charities fair well
when considering the broader “transformation problem.” Our field auctioneers, were able to
raise an average of $190 using donated wine with a retail value of $35. Considering the choice
of a mechanism, three practical lessons arise from our experiment for charities. First, if we
limit attention to the two mechanisms that are used with any regularity, we find that the
raffle does much better than the live auction. Not only does the raffle generate almost three
times as much revenue as the live auction, one can also expect more donors to participate in
the raffle than in the live auction, a result that might be important for the development of
a donor “warm list”. Second, in reference to the theory of charity auctions, we confirm that
choosing from the broad category of all-pay mechanisms, including the first-price auction,
the bucket auction and the raffle, does improve revenue (three-fold, on average) compared
to the two winner-pay mechanisms we considered - the live and hybrid auctions. Further,
considering only the all-pay mechanisms, the efficient first-price all-pay does raise slightly
more money than the raffle, though the differential is small and not always significant. Third,
and most important, our results suggest that charities are probably sacrificing a considerable
amount of money by not considering other formats. Not only is perhaps the most common
option, the live auction, an inferior choice, both in terms of revenue and participation, in
22

this case the curse of the familiar is at its strongest - the most common format did not just
perform poorly, it performed worse than every other mechanism tested.
7 References
Carpenter, Jeffrey; Jessica Holmes and Peter Matthews. 2008. “Charity Auctions: A
Field Experiment.” The Economic Journal, 118(1), 92-113.
. 2010a. “Endogenous Participation in Charity Auctions.” Journal of Public Eco-
nomics, 94(11-12), 921-35.
. 2010b. “Charity Auctions in the Experimental Lab,” D. Norton and R. M. Isaac,
Research in Experimental Economics. Bingley: Emerald Group Publishing Limited, 201-49.
. 2014. “Bucket Auctions for Charity.” Games and Economic Behavior, 88(Novem-
ber), 260-76.
Carpenter, Jeffrey and Peter Hans Matthews. 2015. “Using Raffles to Fund Public
Goods: Lessons from a Field Experiment,” IZA Discussion Paper No. 8952.
Corazzini, Luca; Marco Faravelli and Luca Stanca. 2010. “A Prize to Give For: An
Experiment on Public Good Funding Mechanisms.” The Economic Journal, 120(547), 944-
67.
Dale, Donald. 2004. “Charitable Lottery Structure and Fund Raising: Theory and
Evidence.” Experimental Economics, 7(3), 217-34.
Damianov, Damian, and Ronald Peeters. 2018. “Prize-Based Mechanisms for Fund-
Raising: Theory and Experiments.” Economic Inquiry 56 (3): 1562–84.
Davis, Douglas; Laura Razzolini; Robert Reilly and Bart Wilson. 2006. “Raising Rev-
enues for Charity: Auctions Versus Lotteries,” D. Davis and R. M. Isaac, Research in Ex-
perimental Economics. New York: JAI Press, 49-95.
Engers, Maxim and Brian McManus. 2007. “Charity Auctions.” International Economic
Review, 48(3), 953-94.
Engelbrecht-Wiggans, Richard. 1994. “Auctions with price-proportional benefits to bid-
ders.” Games and Economic Behavior, 6, 339-346.
Ewerhart, Christian. 2014. “Unique Equilibrium in Rent-Seeking Contests With a Con-
tinuum of Types.” Economics Letters, 125(1), 115-118.
Fey, Mark. 2008. “Rent-Seeking Contests With Incomplete Information.” Public Choice.
135(3), 225-236.
Goeree, Jacob K.; E. Maasland; S. Onderstal and J. Turner. 2005. “How (Not) to Raise
Money.” Journal of Political Economy, 113(4), 897-918.
23
Goerg, Sebastian; John Lightle and Dmitry Ryvkin. 2015. “Priming the Charitable
Pump: An Experimental Investigation of Two-Stage Raffles.” Economic Inquiry, 54(1),
508-19.
Landry, Craig; Andreas Lange; John List; Michael Price and Nicholas Rupp. 2010. “Is a
Donor in Hand Better That Two in the Bush? Evidence from a Natural Field Experiment.”
American Economic Review, 100(3), 958-83.
Menezes, Flavio and Paulo Monteiro. 2000. “Auctions with endogenous participation.”
Review of Economic Design, 5, 71-89.
Morgan, John. 2000. “Financing Public Goods by Means of Lotteries.” Review of
Economic Studies, 67(4), 761-84.
Morgan, John and Martin Sefton. 2000. “Funding Public Goods with Lotteries: Exper-
imental Evidence.” Review of Economic Studies, 67(4), 785-810.
Onderstal, Sander; Arthur Schram and Adriaan Soetevent. 2013. “Bidding to Give in
the Field.” Journal of Public Economics, 105(1), 72-85.
Orzen, Henrik. 2008. “Fundraising through Competition: Evidence from the Lab,”
CeDEx Discussion Paper No. 2008-11.
Ryvkin, Dmitry. 2010. “Contests with Private Costs: Beyond Two Players.” European
Journal of Political Economy 26, 558–567.
Samuelson, William. 1985. “Competitive Bidding with Entry Costs.” Economics Letters,
17, 53-57.
Schram, Arthur and Sander Onderstal. 2009. “Bidding to Give: An Experimental Com-
parison of Auctions for Charity.” International Economic Review, 50(2), 431-57.
Wasser, Cedric. 2013. “Incomplete Information in Rent-Seeking Contests.” Economic
Theory 53, 239–268.
24
8 Appendix 1 - proof of proposition 1 (all-pay auc-
tions)
Following Goeree et al. (2005) and Carpenter et al. (2010a) we derive Bayes-Nash equilibria
with “cutoff” participation strategies. To begin, we require that σj(v) are such that a player
with valuation v has no incentive to mimic the strategy of a player with a different valuation
v. That is, the equilibrium strategy satisfies the first order condition
∂EU j(v, v)
∂v= 0
for v = v. As demonstrated in the aforementioned papers, the solutions to these equations
are given by
σj(v, v) + kj
where
σa(v, v) = (n− 1)
∫ v
v
xf(x)F (x)n−2
1− αdx
σb(v, v) = (n− 1)
∫ v
v
xf(x)F (x)n−2
(1− α)− (1− αn)F (x)n−1 − α(n− 1)F (x)n−2dx
and kj are the constants of integration for j = a, b.
As both mechanisms (a) and (b) are auctions, in equilibrium a bidder with a valuation
of vi wins with a probability of F (vi)n−1. Assuming that bidders with valuations below vi do
not participate, the payoff of bidder i who bids bi in the all-pay auction is
EUa(vi, bi) = F (vi)n−1vi − (1− α)bi + αRa
−i(σa−i(v−i))− c
whereRa−i(σ
a−i(v−i), bi) is the total expected contribution of the other bidders. AsRa
−i(σa−i(v−i))
does not depend on bi, it follows that ∂EUa(vi,bi)∂bi
= −(1− α) < 0 and it is therefore optimal
for bidder i to bid bi = 0.
Following this strategy, a bidder with a valuation of vi = vab has an expected payoff
of zero. Bidders with lower valuations would have a negative expected payoff and thus
prefer not to participate. The equilibrium constant of integration is thus ka = −σa(vab, v).
Similarly, in the bucket auction if bidders with valuations below vi do not participate, and
bidder i bids bi, his expected payoff is given by
25
EU b(vi, bi) = F (vi)n−1vi − (1− α)bi(1− F (vi)
n−1) + αRb−i(σ
b−i(v−i), bi)− c
where Rb−i(σ
b−i(v−i), bi) is the total expected contribution of the other bidders.
Note that the bid of bidder i has an impact on the total contributions of the other bidders
only when there is exactly one rival with a valuation greater than vi, the probability of which
is (n − 1)F (vi)n−2(1 − F (vi)). Hence,
∂Rb−i(σb−i(v−i),bi)
∂bi= (n − 1)F (vi)
n−2(1 − F (vi)) < 1. It
follows that ∂EUa(vi,bi)∂bi
< −(1 − 2α) < 0 and therefore bidding bi = 0 is optimal for the
threshold bidder. Hence vab is the participation threshold and the constant of integration is
kb = −σb(vab, v).
The expected revenue of the kth price all-pay auction is derived in Goeree et al. (2005).
Using their results for the revenues of the first price and second price all-pay auction, and after
rearranging terms, we obtain the expressions reported in the proposition. To demonstrate
the ranking Rb > Ra, we show that that the integrand of the bucket auction, Ib, is greater
than the integrand of the all-pay auction, Ia. This difference equals
Ib−Ia =
[x(1− F (x)n−1)
(1− α)− (1− αn)F (x)n−1 − α(n− 1)F (x)n−2− x
1− α
][F (x)n−2(1−F (x))f(x)]dx
or
[x(1− F (x)n−1)(1− α)− x[(1− α)− (1− αn)F (x)n−1 − α(n− 1)F (x)n−2]
[(1− α)− (1− αn)F (x)n−1 − α(n− 1)F (x)n−2](1− α)
][F (x)n−2(1−F (x))f(x)]dx
and, therefore the difference can be written as
[−x(F (x)n−1)(1− α) + (1− αn)xF (x)n−1 + α(n− 1)xF (x)n−2]
[(1− α)− (1− αn)F (x)n−1 − α(n− 1)F (x)n−2](1− α)
][F (x)n−2(1−F (x))f(x)]dx
The numerator of the expression in the first squared brackets reduces to
−α(n− 1)xF (x)n−1 + α(n− 1)xF (x)n−2 = α(n− 1)xF (x)n−2(1− F (x)) > 0
and we can see that the denominator in the same expression is also positive because,
[(1− α)− (1− αn)− α(n− 1)](1− α) > 0
26

As a result, the difference is positive and the revenue claim follows.
9 Appendix 2 - numerical methods
As noted, the equilibrium in the raffle cannot be derived in closed form, and in this appendix
we describe the procedure used for approximating the equilibrium strategies numerically.
This procedure is used to derive the results presented in Table 1. Our approach is partially
based on the routines developed by Wasser (2013) for the numerical approximation of equi-
librium strategies of a Tullock contest with private cost information.11 In particular, we
adapt the routines therein to take into account that bidders compete in a raffle, have private
information about valuations, and can choose whether to participate or not.
We begin by discretizing the valuation space [v, v] using a grid size ∆ = v−v100
, which creates
a discrete version of the raffle with valuation points {v1, v2, . . . , v101} where vk = v+(k−1)∆
for k = 1, 2, . . . ,101. We note that a Bayes-Nash equilibrium has to fulfill the conditions
presented in Proposition 3. The expression on the left hand-side of the second expression is
an (n−1) dimensional integral, which we approximate it using quasi-Monte Carlo integration.
A candidate for an equilibrium is derived numerically as a solution to condition this second
condition for all discrete valuation points. As it is not clear whether in equilibrium all player
types participate, we consider first the game with the full support [v, v]. After deriving
the candidate equilibrium strategy, we calculate the expected surplus of the bidder with
the lowest valuation v1 = v. This is given by the left hand-side of the first condition
in Proposition 3 when the expression is evaluated for vr = v1. If the expected surplus of
this bidder is equal to or exceeds c, we conclude that all player types participate (i.e. the
probability of participation is 1) and the derived candidate equilibrium strategy is actually
the equilibrium strategy under endogenous participation. Otherwise, we assign to the player
type v1 = v a bid of zero (i.e. this player type does not participate) and consider the reduced
strategy set [v2, v]. Using the above method, we solve again for a candidate equilibrium.
We use this procedure iteratively: in case the expected payoff of bidder type vk is still
below c, we assign this bidder type a bid of zero and further consider the game with support
[vk+1, v] for k = 2, 3 . . . , 101. This iterative process continues until we reach k for which the
expected payoff of player type vk equals or exceeds c, and this valuation is taken as an ap-
proximation of the threshold value vrspecified by condition the first condition in Proposition
3.
11We would like to thank Cedric Wasser for generously sharing his Matlab routines.
27

10 Appendix 3 - instructions from the field experiment
You are about to participate in a charity fundraiser. The bottles of wine have been provided
by a research grant from the National Science Foundation. All the proceeds from this event
will be donated directly to this local Rotary chapter.
[All-pay] Here are the rules:
• Bidders make one bid in a sealed envelope.
• The auction is “all-pay” – regardless of winning or losing, all bidders will be asked to
pay the amount of their bids. Please enclose payment with your bid.
• All the bid envelopes will be collected and the highest bid will be identified (ties will
be broken randomly).
• The highest bidder wins the two bottles of wine.
[Bucket] Here are the rules:
• To start, all bidders will be given 30 chips worth $5 each (more chips are available if
necessary).
• Bidders will form a circle and a bucket will be passed from bidder to bidder.
• To stay in the auction, each bidder must place one chip in the bucket each time it
comes to him or her. Bidders who decide to pass the bucket without adding a chip drop out
of the auction.
• You must pay $5 for each chip that you add to the bucket, regardless of whether you
win or lose.
• The auction winner is the person who puts the last chip in the bucket. This will be the
only person who has added a chip every time the bucket has come around.
[Hybrid] Here are the rules:
• All participants interested in placing a bid on the two bottles of wine must first pay a
$5 entry fee, which also buys you a 50-50 lottery ticket.
1. 50-50 Lottery:
• Participants pay $5 to bid in the auction and are given one lottery ticket.
• At the end of the auction, one lottery winner will be selected at random.
• The lottery winner’s cash prize is 50% of the lottery proceeds (and the rest goes to this
Rotary chapter).
2. Wine Auction:
• All bidders will be given bidder numbers.
• The auctioneer will start the auction by announcing an opening bid; he will then ask
for bids to increase.
28

• Raise your bidder number to indicate your willingness to bid on the two bottles of wine
prize at the price called by the auctioneer.
• The highest bidder wins the two bottles of wine and pays his or her bid. Following the
auction, the lottery cash prize and the wine will be awarded separately.
[Live] Here are the rules:
• All bidders will be given bidder numbers.
• The auctioneer will start the auction by announcing an opening bid; he will then ask
for bids to increase.
• Raise your bidder number to indicate your willingness to bid on the two bottles of wine
at the price called by the auctioneer.
• The highest bidder wins the two bottles of wine and pays his or her bid.
[Raffle] Here are the rules:
• Each participant will be allowed to privately purchase as many raffle tickets as he or
she wants.
• Each raffle ticket costs $5.
• After each participant has had a chance to buy as many tickets as he or she wants, the
winning ticket for the two bottles of wine will be selected randomly.
We accept cash, check or credit card. Thank you for supporting this chapter of Rotary!
29