atwo-dimensional dopplerechocardiographic of...
TRANSCRIPT

LABORATORY INVESTIGATIONCONGENITAL HEART DISEASE
A two-dimensional Doppler echocardiographicmethod for calculation of pulmonary and systemicblood flow in a canine model with a variable-sizedleft-to-right extracardiac shuntERIK J. MELJBOOM, M.D., LILLIAM M. VALDES-CRUZ, M.D., SUZANA HOROWITZ, B.S.,DAVID J. SAHN, M.D., DOUGLAS F. LARSON, M.S., KENT A. YOUNG,CARLOS OLIvEIRA LIMA, M.D., STANLEY J. GOLDBERG, M.D.,AND HUGH D. ALLEN, M.D.
ABSTRACT The purpose of this study was to validate a two-dimensional range-gated Dopplerechocardiographic method for measurement of pulmonary and systemic blood flow in a canine modelwith a surgically created extracardiac systemic-to-pulmonary shunt, the size of which could be varied.In five anesthetized open-chest dogs, a previously calibrated electromagnetic (EM) flowmeter wasplaced around the ascending aorta, and the femoral artery was dissected, cannulated, and connected to apreviously calibrated roller pump. The return tubing from the roller pump was inserted into the mainpulmonary artery to create a variable-sized systemic-to-pulmonary artery shunt. In this preparationwith intact ventricular and atrial septa, pulmonary blood flow volume was measured as flow from theascending aorta with the EM flowmeter probe; left-to-right shunt volume was measured from thecalibrated roller pump flow, and systemic flow was measured by subtraction of roller pump flow fromthe EM flowmeter reading of the ascending aorta. In two additional dogs, a 16 mm diameter, 12 cmlong Teflon graft was placed between the descending aorta and the main pulmonary artery to mimicmore closely a patent ductus arteriosus. Flow through the shunt was measured with an EM flowmeterprobe placed around the graft. Systemic and pulmonary flows were then calculated by a Dopplerechocardiographic method from RR interval-matched beats and compared with simultaneously record-ed EM flowmeter measurements from the ascending aorta, and left-to-right shunt flows to permitcomparison of pulmonary and systemic flows and their ratios (QP:QS) by both methods. Dopplersystemic flow was measured as systemic venous return at the right ventricular outflow tract. The size ofthe outflow tract and mean flow as a function of time were obtained by echocardiographic imaging andinterrogation of the outflow tract from a short-axis view. Pulmonary blood flow could not be measuredat the pulmonary artery because of high multidirectional velocities and spectral broadening of the flowcurves similar to those obtained in children with patent ductus arteriosus. Therefore, pulmonary bloodflow was measured as pulmonary venous return through the mitral valve. The mitral orifice wasmeasured from a short-axis view, and Doppler flow curves were recorded from the apical four-chamberview. For 26 left-to-right shunts, excellent correlations were obtained between Doppler echocardio-graphic andEM flowmeter measurements of pulmonary flows (range 1.2 to 7.7 1/min; r = .99, SEE =+ 0.16 1/min), systemic flows (range 0.6 to 5.7 1/min; r = .99, SEE = ± 0.13), and QP:QS ratios(range 0.9:1 to 4.2:1; r = .96, SEE = ± 0.21:1). Our study validates the accuracy of this Dopplerechocardiographic method to measure pulmonary and systemic flows and their ratios in the presence ofextracardiac aortic-to-pulmonary artery shunts.Circulation 68, No. 2, 437-445, 1983.
From the Department of Pediatrics, University of Arizona, Health OUR PREVIOUS STUDIES and those of other in-Sciences Center, Tucson, and the Department of Pediatrics, University vestigators have demonstrated that two-dimensionalof Groningen, Groningen, The Netherlands.
Supported in part by a grant from the Jan Kornelis de Cock Founda- Doppler echocardiographic methods are accurate fortion, The Netherlands.
Address for correspondence: Lilliam Valdes-Cruz, M.D., Depart- noninvasive calculation of cardiac flows in the intactment of Pediatrics (Pediatric Cardiology), University of California San circulation in man. 1-10 Our own work has also shownDiego University Hospital, CTF B102, 225 West Dickinson St., San that Doppler echocardiography accurately measuresDiego, CA 92103.
Received Feb. 4, 1983; revision accepted April 25, 1983. pulmonary and systemic flows and their ratios, even in
Vol. 68, No. 2, August 1983 437
by guest on April 21, 2018
http://circ.ahajournals.org/D
ownloaded from

MEIJBOOM et al.
the presence of large intracardiac shunts in animalmodels.'" Our purpose was to assess the accuracyof systemic and pulmonary flows measured with aquantitative two-dimensional range-gated Dopplerflowmeter in an open-chest canine model with a vari-able-sized, surgically created, extracardiac aortic-to-pulmonary shunt.
MethodsSurgical technique and animal model. Seven mongrel
dogs weighing 20 to 30 kg were anesthetized with pentobarbitalsodium (30 mg/kg), intubated, and ventilated with a standardvolume pump. A median stemotomy was performed and thepericardium was opened. The ascending aorta and the mainpulmonary artery were dissected, cleaned of fat and adventitia,and a previously calibrated electromagnetic (EM) flowmeterprobe of appropriate size (Gould-Statham SP2204) was placedaround the ascending aorta 2 cm above the aortic valve. Ade-quate contact of the flowmeter cuff was verified by recordingphasic aortic flow tracings.
In five dogs, the right femoral artery was dissected, cannulat-ed, and connected to a roller pump by 3/8 inch tubing. The returnend of the roller pump tubing was attached to a cannula insertedand fixed into the main pulmonary artery through a purse-stringsuture (figure 1). The roller pump had been previously calibrat-ed by measurement offlow rates with a stopwatch and a graduat-ed cylinder. In this model with intact atrial and ventricularsepta, pulmonary blood flow was measured as the flow from theascending aorta by the EM flowmeter reading; left-to-rightshunt volume was the measured flow through the roller pump,and systemic blood flow was equal to the flow from the ascend-ing aorta as determined by the EM flowmeter minus the rollerpump volume.
In an additional two dogs, a 16 mm diameter, 12 cm longGortex shunt was sewn between the descending aorta and themain pulmonary artery within the thorax to simulate more close-ly a ductus arteriosus or the surgically created, palliative, sys-temic-to-pulmonary artery shunts used clinically. An EM flow-meter probe was placed around the ascending aorta as describedabove, and another one was placed snugly around the Gortextubing close to the pulmonary-arterial end. Selective constric-tion of the tubing at the aortic end allowed variations of shuntsize. As before, pulmonary blood flow equaled flow from theascending aorta as determined by EM flowmeter values; left-to-right shunt volume was measured by the flowmeter probe at theGortex shunt, and systemic flow was determined by pulmonaryblood flow minus left-to-right shunt flow.
Continuous EM flowmeter recordings were obtainedthroughout the study for comparison with Doppler-determinedflows. After each step-by-step change in shunt size, achieved byan alteration of pump setting or by degree of Gortex-shuntconstriction, a stabilization period of 2 min was allowed andconstancy of EM flowmeter readings was observed before anyDoppler echocardiographic recordings were made. Dopplermeasurements of pulmonary and systemic flow were performedas described below for each shunt size, and were matched to,each other, to the simultaneous EM flowmeter measurements,and to the roller pump settings to permit calculation of pulmo-nary/systemic ratios (QP:QS) by both Doppler echocardiog-raphy and EM flowmeter measurements.
Ultrasound and Doppler methods. Ultrasound imaging andDoppler echocardiographic studies were performed with a com-mercially available range-gated pulsed Doppler unit (E for MIHoneywell). The unit contains a 3.5 MHz single-element trans-ducer that mechanically sweeps through a 30 to 75 degree arc to
438
Femoral A.
FIGURE 1. Diagram of the extracorporeal shunt model that demon-strates the interposition of the roller pump between the femoral arteryand the main pulmonary artery. SVC = superior vena cava; IVC =inferior vena cava; RA = right atrium; LA = left atrium; RV = rightventricle; LV = left ventricle; PA = pulmonary artery; Ao = ascend-ing aorta; Femoral A = femoral artery.
achieve real-time two-dimensional echocardiographic imagingat 30 frames/sec. The scanner can be stopped along any linewithin the image and a Doppler sample volume can be posi-tioned at any depth along that line; this permits localization ofthe sample volume and estimation of the angle between thedirection of Doppler sampling and the direction of flow withinthe plane of imaging. The sampling angle relative to the direc-tion of the flow within the elevational or azimuthal plane, thatis, the plane perpendicular to the plane of imaging, could not bedetermined; however, small deviations from sampling exactlyparallel to flow (angles = 0 or 180 degrees) were of no practicalimportance, since the cosine of the sampling angle would stillbe close to unity (see formula 1). Sample-volume length wasvariable between 2 mm and 2 cm and was usually set at 5 mm in
CIRCULATION
I
by guest on April 21, 2018
http://circ.ahajournals.org/D
ownloaded from
LABORATORY INVESTIGATION-CONGENITAL HEART DISEASE
these studies. Sample-volume width in a water tank (that is, thelateral displacement of a transducer required to produce anamplitude fall-off to half-maximum intensity for the returningDoppler signal [6 dB] from a moving string target) was ± 1.8mm between 2 and 4 cm in depth and ± 2 mm at 4 to 8 cm indepth.12 Sample-volume width was not variable. The operation-al mode of the scanner could be switched rapidly from real-timeimaging to spatially oriented Doppler sampling. In Dopplermode, signals were sampled at a pulse repetition frequency of19,500 samples/sec when the signal was obtained from a depthless than 4 cm, which results in a maximal nonambiguouslydetectable velocity of 220 cm/sec. Signals were sampled at afrequency of 9750 samples/sec at a depth of 4 to 8 cm, whichresults in a maximal nonambiguously detectable flow velocityof 110 cm/sec at the 0 degree sampling angle. Two outputs ofthe Doppler frequency shift were available: an audio signal anda quantitative fast Fourier transform spectral analysis of theDoppler frequency shift sampled at 200 times/sec. The Dopplerspectral output was converted automatically by the scanner toflow velocity in centimeters per sec with the formula:
flow velocity = frequency shift x velocity of sound in medium (1)2 x transmitted frequency x cos 0
(where cos 0 = angle between the direction of Doppler sam-pling and the direction of blood flow. Correction for cos 0,however, was not applied automatically by the unit; rather, itwas done manually in formula 2, which calculates volume flowas described below.)Measurements of blood flow volumes. Pulmonary and sys-
temic blood flow volumes were calculated from the two-dimen-sional echocardiographic images and the flow-velocity curveswith the general formula:
Blood flow/min =
mean flow velocity x cross-sectional area x 60 sec/min (2)cos 0
(velocity throughout the cardiac cycle uncorrected for angle is incentimeters per sec and cross-sectional area is in square centi-meters).The sampling angle 0, that is, the angle of incidence between
direction of flow and the Doppler sample volume, was deter-mined manually with a protractor directly from the freeze frameof the two-dimensional echocardiographic image, whichshowed the sample-volume position relative to the imaged car-
diac structures (figure 2). Correction for angle 0 was appliedmanually in formula 2 rather than in formula 1.
Calculation of systemic flow by Doppler echocardiog-raphy. Systemic flow was measured as systemic venous returnat the right ventricular outflow tract. We obtained a two-dimen-sional echocardiographic image of the right ventricular outflowtract by positioning the transducer over the right ventricularbody, aiming superiorly in a short-axis plane (figure 2). TheDoppler sample volume was positioned within the outflow tract,below the pulmonic valve, as parallel as possible to the assumeddirection of flow as determined by visual examination within theplane being imaged. Once the optimal two-dimensional echo-cardiographic image and Doppler flow curves were obtainedand the sample volume was confirmed to be as parallel as
possible to the assumed direction offlow (angle 0 = 0 degrees),a still frame of the two-dimensional echocardiographic imageand the fast Fourier output of the Doppler frequency shift wererecorded on a strip chart at a paper speed of 100 mm/sec and on
video tape (figure 2). We obtained mean Doppler flow velocityover time by digitizing and integrating the area under the Dopp-
Vol. 68, No. 2, August 1983
ler waveform over three complete cardiac cycles with a Numon-ics minicomputer (see below). The cross-sectional area of theright ventricular outflow tract was derived from the maximalsystolic inner diameter of the outflow tract in a direction parallelto the plane of the pulmonic valve and at a point just proximal toit. The measurement was not corrected for variation of rightventricular outflow tract size during the cardiac cycle.
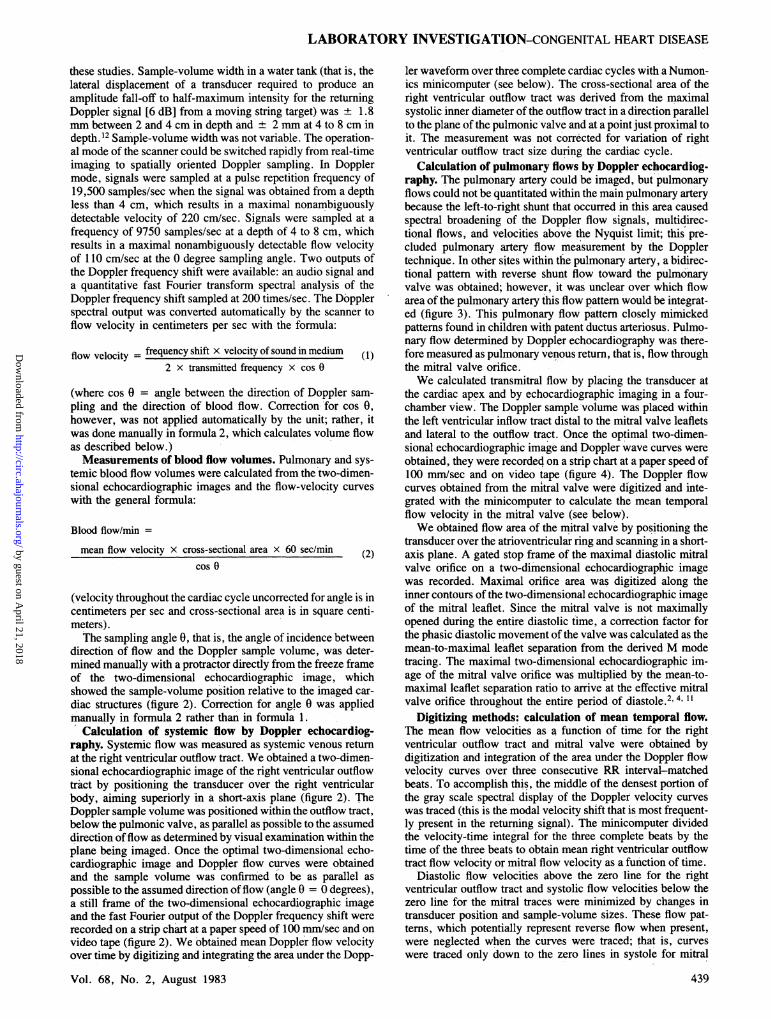
Calculation of pulmonary flows by Doppler echocardiog-raphy. The pulmonary artery could be imaged, but pulmonaryflows could not be quantitated within the main pulmonary arterybecause the left-to-right shunt that occurred in this area causedspectral broadening of the Doppler flow signals, multidirec-tional flows, and velocities above the Nyquist limit; this pre-cluded pulmonary artery flow measurement by the Dopplertechnique. In other sites within the pulmonary artery, a bidirec-tional pattern with reverse shunt flow toward the pulmonaryvalv'e was obtained; however, it was unclear over which flowarea of the pulmonary artery this flow pattern would be integrat-ed (figure 3). This pulmonary flow pattern closely mimickedpatterns found in children with patent ductus arteriosus. Pulmo-nary flow determined by Doppler echocardiography was there-fore measured as pulmonary venous return, that is, flow throughthe mitral valve orifice.We calculated transmitral flow by placing the transducer at
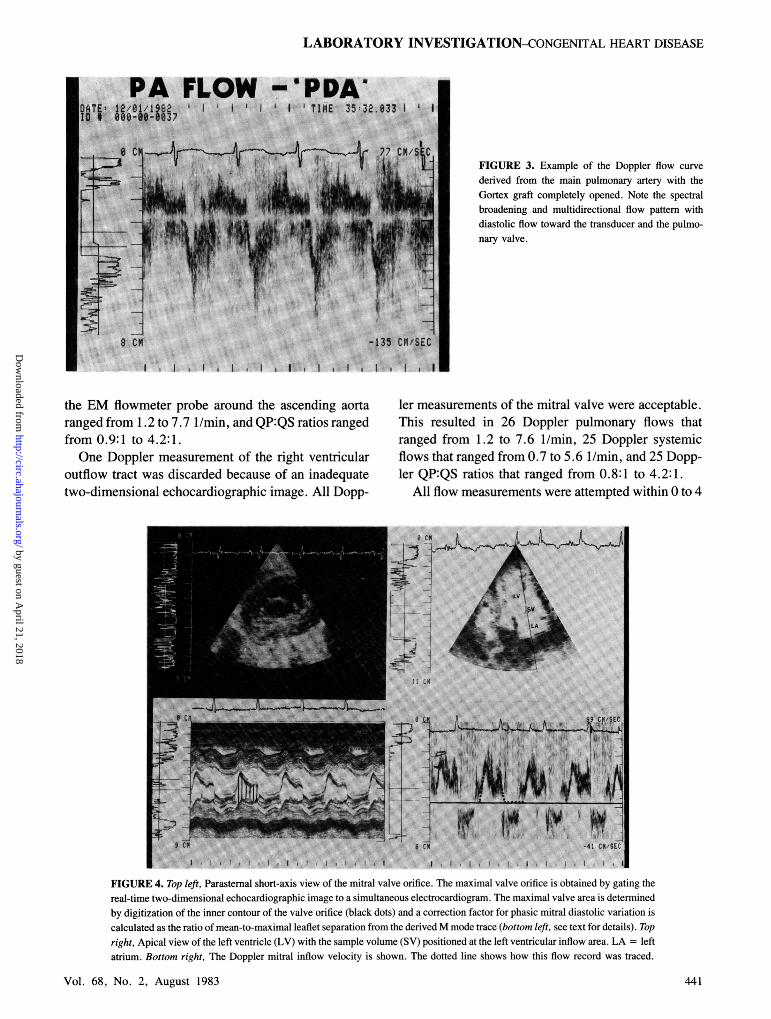
the cardiac apex and by echocardiographic imaging in a four-chamber view. The Doppler sample volume was placed withinthe left ventricular inflow tract distal to the mitral valve leafletsand lateral to the outflow tract. Once the optimal two-dimen-sional echocardiographic image and Doppler wave curves wereobtained, they were recorded on a strip chart at a paper speed of100 mm/sec and on video tape (figure 4). The Doppler flowcurves obtained from the mitral valve were digitized and inte-grated with the minicomputer to calculate the mean temporalflow velocity in the mitral valve (see below).We obtained flow area of the mitral valve by positioning the
transducer over the atrioventricular ring and scanning in a short-axis plane. A gated stop frame of the maximal diastolic mitralvalve orifice on a two-dimensional echocardiographic imagewas recorded. Maximal orifice area was digitized along theinner contours of the two-dimensional echocardiographic imageof the mitral leaflet. Since the mitral valve is not maximallyopened during the entire diastolic time, a correction factor forthe phasic diastolic movement of the valve was calculated as themean-to-maximal leaflet separation from the derived M modetracing. The maximal two-dimensional echocardiographic im-age of the mitral valve orifice was multiplied by the mean-to-maximal leaflet separation ratio to arrive at the effective mitralvalve orifice throughout the entire period of diastole.4, 11
Digitizing methods: calculation of mean temporal flow.The mean flow velocities as a function of time for the rightventricular outflow tract and mitral valve were obtained bydigitization and integration of the area under the Doppler flowvelocity curves over three consecutive RR interval-matchedbeats. To accomplish this, the middle of the densest portion ofthe gray scale spectral display of the Doppler velocity curveswas traced (this is the modal velocity shift that is most frequent-ly present in the returning signal). The minicomputer dividedthe velocity-time integral for the three complete beats by thetime of the three beats to obtain mean right ventricular outflowtract flow velocity or mitral flow velocity as a function of time.
Diastolic flow velocities above the zero line for the rightventricular outflow tract and systolic flow velocities below thezero line for the mitral traces were minimized by changes intransducer position and sample-volume sizes. These flow pat-terns, which potentially represent reverse flow when present,were neglected when the curves were traced; that is, curveswere traced only down to the zero lines in systole for mitral
439
by guest on April 21, 2018
http://circ.ahajournals.org/D
ownloaded from

MEIJBOOM et al.
'a .8 6108 36011 *41 9821i -::? IM . 6;8 t1 .tt;*66 .N(;
4 .we ~.s..re
;i-
i -1
9 cm
JATE. Il'22'1982 E3 TIME:: 69:a 133 tID 880 r36 :_ _0 - n6
FIGURE 2. Top, Parasternal short-axis image of theright ventricular outflow tract with the Doppler sam-ple volume (SV) positioned proximal to the pulmo-nary valve (PV). Ao = aorta. Bottom, Doppler ve-locity curve derived from the outflow tract.
B
9 CM-- -86 CM/SEC
II I I I . t I
valve and in diastole for the outflow tract. All curves used forcomparison of pulmonary blood flow and systemic blood flowwere obtained at equivalent heart rates.As a measure of the presence or absence of turbulence, spec-
tral width of the Doppler curves (cm/sec) were measured withthe minicomputer at the time of peak flow, in systole or diastole.The measurement included the width of the gray scale spectrumat peak flow and was cross-checked against a quantized logspectral display that allocates the darkest gray scale to the entirerange of velocity present within ± 6 dB of the spectral mean
(figure 5).Reproducibility of measurements. To determine reproduc-
ibility, all measurements were made in duplicate on the same
tracing by the same investigator. To test interobserver variabil-ity, all measurements were made independently by investigatorswho were unaware of the simultaneous EM flowmeter readingsor of each other's results.
Statistical analysis. Linear correlation was used to compareDoppler pulmonary and systemic flows and QP:QS ratios with
440
those obtained by the combination of EM flowmeters and rollerpump. A paired t test was used to assess interobserver variabil--ity.and errors in reproducibility.
Results
In the seven experimental animals, 26 differentsized shunts were obtained. Each animal had a mini-mum of two and a maximum of eight different shuntmagnitudes recorded. We derived 22 shunts from thefive dogs with the femoral artery-to-pulmonary arteryshunts and four shunts from the two animals with theGortex shunts.
Systemic blood flows derived from the combinedEM flowmeter-roller pump measurements rangedfrom 0.6 to 5.7 1/min; pulmonary flows determined by
CIRCULATION
lb
by guest on April 21, 2018
http://circ.ahajournals.org/D
ownloaded from
PAk FLOW -g
:TI;0 A 8ex § ltl8|:itS\0
LABORATORY INVESTIGATION-CONGENITAL HEART DISEASE
PDAi TIME 35 32.0331 ' I
7? CMI | FIGURE 3. Example of the Doppler flow curve
derived from the main pulmonary artery with theGortex graft completely opened. Note the spectralbroadening and multidirectional flow pattern withdiastolic flow toward the transducer and the pulmo-nary valve.
ol EI"
8 CM
the EM flowmeter probe around the ascending aortaranged from 1.2 to 7.7 1/min, and QP:QS ratios rangedfrom 0.9:1 to 4.2:1.One Doppler measurement of the right ventricular
outflow tract was discarded because of an inadequatetwo-dimensional echocardiographic image. All Dopp-
ler measurements of the mitral valve were acceptable.This resulted in 26 Doppler pulmonary flows thatranged from 1.2 to 7.6 1/min, 25 Doppler systemicflows that ranged from 0.7 to 5.6 1/min, and 25 Dopp-ler QP:QS ratios that ranged from 0.8:1 to 4.2:1.
All flow measurements were attempted within 0 to 4
.f
X!
,*_
_s L_i
i L.. ..>+11 CM
8 TM -41 CK'5EC
II I
FIGURE 4. Top left, Parasternal short-axis view of the mitral valve orifice. The maximal valve orifice is obtained by gating thereal-time two-dimensional echocardiographic image to a simultaneous electrocardiogram. The maximal valve arca is determinedby digitization of the inner contour of the valve orifice (black dots) and a correction factor for phasic mitral diastolic variation iscalculated as the ratio of mean-to-maximal leaflet separation from the derived M mode trace (bottom left, see text for details). Topright, Apical view of the left ventricle (LV) with the sample volume (SV) positioned at the left ventricular inflow area. LA = leftatrium. Bottom right, The Doppler mitral inflow velocity is shown. The dotted line shows how this flow record was traced.
Vol. 68, No. 2, August 1983
-7 __
l
j
I
I
441
:....
I
by guest on April 21, 2018
http://circ.ahajournals.org/D
ownloaded from

MEIJBOOM et al.
FIGURE 5. Two recordings illustrate the determina-tion of spectral width from a Doppler display. Top,Linear (LIN) allocation of gray scale shows the dark-est area as the modal velocity. Our measurement ofspectral width includes the width of the gray scalespectrum at peak flow. Bottom, Quantized logarith-mic (LOG) display of the Doppler signal allots thedarkest gray scale intensity to all spectral valueswithin ± 6 dB of the spectral mean. Spectral widthat peak flow in the upper trace was 17 cmisec, and inthe lower trace it was 20 cmnlsec, as shown by A.
cm sampling depth; however, occasional adjustmentsof transducer and sample-volume position were neces-
sary to maximize flow curves and to avoid valve andwall motion artifacts. Therefore, at times, recordswere obtained between 4 to 6 cm in depth if the maxi-mal signal was easier to record at that greater depth andthe velocities were still within the Nyquist limits. PeakDoppler flow velocities measured over the mitral valveranged from 31 to 118 cm/sec with a mean spectralwidth at + 6 dB of 9.2 0.5 crn/sec (SE). PeakDoppler flow velocities in the right ventricular outflowtract varied from 24 to 88 cm/sec with mean spectralwidth at + 6 dB of 11.6 ± 0.6 cm/sec. Peak flowvelocities within both areas of investigation remainedwithin the Nyquist limit of the ultrasound system, even
in the presence of large shunts.Correlation of Doppler and EM flowmeter-roller pump
flows. Figure 6 summarizes our results. Doppler pul-monary flows derived at the mitral valve orifice corre-
lated extremely well with those measured in the as-
cending aorta by the EM flowmeter (r = .99, SEE =
+±. 16 1/min). The linear correlation for pulmonaryflow measurement, with the highest point eliminated,yielded a correlation coefficient of .98, SEE =- +
0.16. Doppler systemic blood flows obtained at theright ventricular outflow tract also correlated well withthose measured from the aortic flow minus the rollerpump or the Gortex shunt flow (r = .99, SEE = +
0.13). Eliminating the highest point, we obtained a
correlation coefficient of r = .96, SEE - ± 0.14.Finally, Doppler QP:QS ratios also correlated wellwith the reference standards (r - .96, SEE = 0.21:1).No qualitative or quantitative differences were
found between results obtained with the roller pumpand the smaller number of determinations obtainedfrom the Gortex shunt model.
Interobserver variability and errors of reproducibility.All measurements were highly reproducible. The SEM
CIRCULATION
:
.
442
by guest on April 21, 2018
http://circ.ahajournals.org/D
ownloaded from

LABORATORY INVESTIGATION-CoNGENITAL HEART DISEASE
B 8-
Ei4
T 4-
a 2isr=0.99SEE ± 0.134y = 0.968 x + 0.073
Ax I Ivnii 2 3 4 5 6
EM Flow-Roller Pump=Systemic Flow (L/min)
r=0.99SEE ± 0.164y=0.963x +0.11
2 4 6EM Flow (Umin)
= Pulmonary Blood Flow (Umin)
C 5:1-
4:1-
C,)
aCL 3:1-CL0
12:1-
1:1-r= 0.96SEE ±0.21y=0.913x + 0.147
1:1 2:1 3:1 4:1EM and Roller Pump QP:QS
5:1
FIGURE 6. Regression analyses that correlate Doppler flows to the simultaneous reference flows for systemic (A) and
pulmonary (B) blood flows, and derived QP:QS (C). The 95% confidence limits for the data points are shown by the dotted lines(see text for details).
to test reproducibility was less than 5% when duplicatemeasurements by one observer on a given record were
compared. Further, interobserver variability was alsoless than 5%.
DiscussionPrevious studies'"O have shown that range-gated
two-dimensional Doppler echocardiography with fastFourier transform spectral analysis of the Doppler fre-quency shift is a reliable, noninvasive method for cal-culation of cardiac output and assessment of the mag-
nitude of intracardiac left-to-right shunts. These earlierstudies included validation of these measurements inanimal models with shunts'l 11 and in children withheart disease. 13 14 Our present study further validatestwo-dimensional Doppler echocardiography for calcu-lation of flows in the presence of both small and large
Vol. 68, No. 2, August 1983
systemic arterial-to-pulmonary artery left-to-rightshunts.
In this study, as in shunts through a patent ductusarteriosus encountered in the clinical setting, the shuntstream was directed into the main pulmonary artery,which resulted in increased velocities above the Ny-quist limit and multidirectional nonlaminar flow pat-terns that precluded Doppler pulmonary blood flowmeasurements in the main pulmonary artery. There-fore, we measured pulmonary flow by Doppler echo-cardiography as pulmonary venous return through themitral valve orifice, a technique that had already beenvalidated and proved reliable in our laboratory.2'4"'
In contrast to intracardiac shunts, in the presence ofextracardiac shunts distal to the take-off of the vesselsto the head and upper extremities, systemic blood flowcould not be measured over the ascending aorta by
443
A 6-
c
E
lL
0
0a)QlQa
5-
4-
3-
2-
in
8f) I I I I I
'ff I I I I I
V-T-0v-v-
by guest on April 21, 2018
http://circ.ahajournals.org/D
ownloaded from

MEIJBOOM et al.
either Doppler echocardiography or by the EM flow-meter, since the aorta also carries shunt flow laterdiverted into the pulmonary circulation. Therefore,systemic blood flow in our model was calculated byDoppler echocardiography as systemic venous returnin the right ventricular outflow tract proximal to thepulmonary valve. At this site, peak flow velocitieswere never above the Nyquist limit, and no increase inspectral width was encountered, which indicates nosignificant turbulence. The measurement of the rightventricular outflow tract was obtained on two-dimen-sional echocardiographic images at a level just proxi-mal to the pulmonary valve, because that is the areaabove the crista that has little variation in size through-out the cardiac cycle and is where the walls can beeasily defined.
The mitral valve orifice method that we used in thisstudy has the advantage of providing a two-dimension-al echocardiographic image from which we can mea-sure cross-sectional flow area directly by planimetry,instead of having to calculate it by squaring a diametermeasurement. It has proved to be highly accurate inour previous studies, both in humans and animals whohave intact circulation,4 as well as for an estimation ofpulmonary blood flow in the presence of shunts at theventricular level.'I 13The two models used in our study enabled us to
obtain variable and measurable shunt magnitudes inexperimental animals and closely simulated ascendingaortic and main pulmonary flow patterns of a patentductus or other systemic arterial-to-pulmonary arterialshunts encountered in the clinical setting. Dopplertracings obtained in both models were identical andalso very similar to those obtained in patients withpatent ductus arteriosus.We have recently completed a pilot study to assess
the capability of the Doppler echocardiographic meth-od to measure QP:QS ratios in children with isolatedpatent ductus arteriosus. We studied 11 patients, ages3 to 37 months, with isolated patent ductus arteriosus.QP:QS determinations were performed by indicator-dilution techniques"5 in the cardiac catheterizationlaboratory and the results were compared with simul-taneously obtained Doppler echocardiographic mea-surements. In this small group of patients, an encour-aging result was obtained in that Doppler QP:QSdeterminations correlated well with dye-curve QP:QSmeasurements (r = .89; SEE = 0. 3:1). Neithercardiac motion with reference to the chest wall nordistortion of the ultrasound energy that passed throughthe chest wall prevented us from obtaining good Dopp-ler echocardiographic studies in these young children
444
or clear images of the right ventricular outflow tractand mitral valve flow areas. Nonetheless, in older pa-tients, echocardiographic imaging of the right ventric-ular outflow tract may prove difficult; the techniquemay also prove to have limited applicability in veryyoung infants and premature babies in whom largeductal shunts are often accompanied by left-to-rightshunting at the foramen ovale, which precludes the useof mitral flow as a measure of total pulmonary flow.
In conclusion, our study demonstrates that extracar-diac left-to-right shunts can be quantitated accuratelyby the two-dimensional Doppler echocardiographicmethod described in this open-chest animal model.Our initial pilot studies in young children suggest thatin patients with isolated patent ductus arteriosus and noother intracardiac shunts, the technique may proveclinically useful as a measurement of the overall mag-nitude of the left-to-right shunting.
References1. Fisher DC, Friedman MJ, Sahn DJ, Larson D, Valdes-Cruz LM,
Horowitz S, Goldberg SJ, Allen HD: The effect of variations onpulsed Doppler sampling site on calculation of cardiac output: anexperimental study in open chest dogs. Circulation 67: 370, 1983
2. Fisher DC, Sahn DJ, Larson D, Valdes-Cruz LM, Friedman MJ,Goldberg SJ, Allen HD, Horowitz S: Doppler determination ofcardiac output using aorta, pulmonary artery and mitral valve ori-fice measurement site. Clin Res 30: 7A, 1982 (abst)
3. Friedman MJ, Sahn DJ, Larson D, Flint A: Two-dimensional echo-range gated Doppler measurements of cardiac output and strokevolume in open chest dogs. Circulation 62 (suppl III): 111-101,1980 (abst)
4. Fisher DC, Sahn DJ, Larson D, Valdes-Cruz LM, Friedman MJ,Goldberg SJ, Allen HD, Horowitz S: The mitral valve orificemethod for noninvasive determination of cardiac output by two-dimensional echo/Doppler: validation and initial clinical trials.Circulation 67: 872, 1983
5. Darsee JR, Walter PF, Nutter DO: Transcutaneous Doppler meth-od of measuring cardiac output. 11. Noninvasive measurement bytranscutaneous Doppler aortic blood velocity integration and M-mode echocardiography. Am J Cardiol 46: 613, 1980
6. Colocousis JS, Huntsman LL, Curreri PW: Estimation of strokevolume changes by ultrasonic Doppler. Circulation 56: 914, 1977
7. Darsee JR, Mikolich RJ, Walter PF, Schlant RC: Transcutaneousmethod of measuring Doppler cardiac output. I. Comparison oftranscutaneous and juxta-aortic Doppler velocity signals with cath-eter and cuff electromagnetic flowmeter measurements in closedand open chest dogs. Am J Cardiol 46: 607, 1980
8. Magnin PA, Stewart JA, Myers S, von Ramm 0, Kisslo JA:Combined Doppler and phased-array echocardiographic estimationof cardiac output. Circulation 63: 388, 1981
9. Steingart RM, Meller J. Barovick J, Patterson R, Herman MV,Teichholz L: Pulsed Doppler echocardiography: measurement ofbeat to beat changes in stroke volume in dogs. Circulation 62: 542,1980
10. Angelsen AJ, Brubakk AO: Transcutaneous measurement of bloodvelocity in the human aorta. Cardiovasc Res 10: 368, 1976
11. Valdes-Cruz LM, Mesel E, Horowitz S, Sahn DJ, Fisher DC,Larson D, Goldberg SJ, Allen HD: Validation of two-dimensionalecho Doppler for measuring pulmonary and systemic flows in atrialand ventricular septal defects: a canine study. Circulation 66 (supplII): 11-231, 1982 (abst)
12. Walker AR, Phillips DJ, Powers JE: Evaluating Doppler devicesusing a moving string test target. J Clin Ultrasound 10: 25. 1982
13. Vargas Barron J, Sahn DJ, Valdes-Cruz LM, Oliveira Lima C,Grenadier E, Allen HD. Goldberg SJ: Quantification of the ratio of
CIRCULATION
by guest on April 21, 2018
http://circ.ahajournals.org/D
ownloaded from

LABORATORY INVESTIGATION-CONGENITAL HEART DISEASE
pulmonary:systemic blood flow in patients with ventricular septaldefect by two-dimensional range gated Doppler echocardiography.Circulation 66 (suppl II): 11-318, 1982 (abst)
14. Goldberg SJ, Sahn DJ, Allen HD, Valdes-Cruz LM, Hoenecke H,Carnahan Y: Evaluation of pulmonary and systemic blood flow by
two-dimensional Doppler echocardiography using fast Fouriertransform spectral analysis. Am J Cardiol 50: 1394, 1982
15. Yang SS, Bentivoglio LG, Maranhao V, Goldberg H: From cardiaccatheterization data to hemodynamic parameters, ed 2. Philadel-phia, 1978, F. A. Davis Co., p 219
Vol. 68, No. 2, August 1983 445
by guest on April 21, 2018
http://circ.ahajournals.org/D
ownloaded from

Lima, S J Goldberg and H D AllenE J Meijboom, L M Valdes-Cruz, S Horowitz, D J Sahn, D F Larson, K A Young, C Oliveira
shunt.systemic blood flow in a canine model with a variable-sized left-to-right extracardiac
A two-dimensional Doppler echocardiographic method for calculation of pulmonary and
Print ISSN: 0009-7322. Online ISSN: 1524-4539 Copyright © 1983 American Heart Association, Inc. All rights reserved.
is published by the American Heart Association, 7272 Greenville Avenue, Dallas, TX 75231Circulation doi: 10.1161/01.CIR.68.2.437
1983;68:437-445Circulation.
http://circ.ahajournals.org/content/68/2/437.citationthe World Wide Web at:
The online version of this article, along with updated information and services, is located on
http://circ.ahajournals.org//subscriptions/
is online at: Circulation Information about subscribing to Subscriptions:
http://www.lww.com/reprints Information about reprints can be found online at: Reprints:
document. Permissions and Rights Question and Answer information about this process is available in the
located, click Request Permissions in the middle column of the Web page under Services. FurtherEditorial Office. Once the online version of the published article for which permission is being requested is
can be obtained via RightsLink, a service of the Copyright Clearance Center, not theCirculationpublished in Requests for permissions to reproduce figures, tables, or portions of articles originallyPermissions:
by guest on April 21, 2018
http://circ.ahajournals.org/D
ownloaded from