attmann green architecture - professional a greensource book green architecture isbn...
TRANSCRIPT

ATTMANNA GreenSource BOOK
Green A
rchitectureISBN 978-0-07-162501-2MHID 0-07-162501-1
9 7 8 0 0 7 1 6 2 5 0 1 2
5 9 9 9 9 >
Written by an architect specializing in green materials and methods, this GreenSource
book presents all of the information you need to design efficient, environmentally
friendly, economical, and sustainable buildings.
Green Architecture surveys new developments, innovative techniques, and emerging
technologies that support environmentally responsive architecture. Residential, com-
mercial, and institutional high-performance buildings are discussed. This architectural
resource includes details on green building rating systems, energy generation and reten-
tion, water and waste management, and green building materials. In-depth case studies
highlight advanced green buildings; active and passive solar buildings; self-sufficient,
off-the-grid modular and mobile systems; and solar-decathlon competition projects.
Green Architecture covers:
• Definitions, operationalizations, and history of green architecture
• Green building rating systems, including LEED and BREEAM
• Solar, geothermal, wind, hydro, fuel cell, and other green energy generation technologies
• Green insulation, HVAC, water, and waste management technologies
• Passive solar design methods
• Green materials, including biomaterials, biopolymers, bioplastics, and composites
• Thermo-, light-, and stimulus-responsive smart materials
• Nanomaterials
• More than 100 case studies
The Definitive Guide to Green Architecture
Architecture
Green Architecture Advanced Technologies and Materials
Osman Attmann

1
11 GREEN ARCHITECTURE: OVERVIEW
Introduction: Ecosystems and NaturalEnvironmentsAn ecosystem is defined as a natural unit, consisting of all plants, animals, andmicroorganisms in an area functioning together, along with the nonliving factors of thearea (Christopherson 1997). The term was first coined by A. G. Tansley in 1935 toencompass the interactions between biotic and abiotic components of the environmentat a given site (Tansley 1935; Gorham 2006). The word biotic refers to the living com-ponents of an environment, where the actions of a variety of species affect the lives offellow organisms. Abiotic factors are essentially nonliving components, such as tem-perature, light, moisture, air currents, etc. that equally affect the ecosystem(Lockwood and McKinney 2001; Buchs 2003; Saxena 2003; Gaston and Spicer 2004).
The term ecosystem was later redefined by Eugene Odum as any unit where this inter-action between biotic and abiotic factors in a given area produces a flow of energy leadingto a clearly defined trophic structure, biotic diversity, and material cycles (exchange of mate-rials between living and nonliving parts) within the system (Odum 1971; Gorham 2006).
An ecosystem is not a single unified entity, constant in size. Our entire planet is coveredwith a variety of different, sometimes overlapping, and often interdependent ecosystems. Asingle lake, a neighborhood, or an entire region can be considered an ecosystem, while theterm biome is used to refer to a major global ecosystem (Millennium Ecosystem Assessment2005, Ecosystems and Human Well-being: Current State and Trends). Therefore an ecosys-tem can be as large as the entire globe, or as small as a city or a building (see Fig. 1.1).
While smaller ecosystems are part of the global ecosystem, the flow of energyfor an ecosystem occurs on a more local level. Most ecosystems are autotrophic,which means that they capture sufficient energy to support their own requirements.For example, green plants convert solar energy to glucose, which is used for plantgrowth and other functions. In turn they provide energy to the rest of the livingsystem. However, some ecosystems are heterotrophic, that is, unable to producesufficient energy to meet the system’s needs. The additional energy requirementsmust come from adjacent ecosystems. Thus, they can be regarded as autotrophic
01-Attmann_Ch01_p001-026.qxd 10/22/09 4:40 PM Page 1

2 GREEN ARCHITECTURE: OVERVIEW
on a bioregional level, such as a river and its watershed (Wardle 2002; Newmanand Jennings 2008).
The key to an ecosystem is interconnection and relationship. All the parts of anecosystem are interrelated through a complex set of self-regulating cycles, feedbackloops, and linkages between different parts of the food chain. If one part of anecosystem is removed or disrupted, there are ripple effects throughout the system.The extent of the disturbance varies depending on the nature, scale, and duration ofthe disruption; on the relative significance of the part or parts affected; and on theresilience of the ecosystem (Chapin, Mooney and Chapin 2004; ANRC 2005;Ponting 2007; Krapivin and Varotsos 2008; Ostfeld, Keesing and Eviner 2008).
This complex, unique, and fragile relationship is quite vulnerable. It can be altered, evendamaged, by various factors, whether cyclical, natural, or man-made. Examples of cyclicalfactors are solar flares and radiations (Hoyt and Schatten 1997; Carslaw, Harrison andKirkby 2002; Salby and Callaghan 2004; Benestad 2006), the orbital inclination of the earthwith the astronomical theory of accompanying climate change (Berger 2002; Svensmark2007), and climate variations from geology, geochemistry, and paleontology (Saltzman2001; Lovejoy and Hannah 2005). Natural factors refer to such events as earthquakes, vol-canic activities, floods, and fires (Kondratev and Galindo 1997; Cowie 2007). Most of thesefactors are out of our control and run their natural course, regardless of what we do.
Human Impact on the NaturalEnvironmentMan-made factors are controllable, and our actions have a great impact on the ecosystem.Throughout history, man’s interaction with nature has created disruptive and damagingeffects, whether through the generation of energy, the creation of artificial landscapes, the
Figure 1.1 Ecosystems are a hierar-chy of systems, consisting of subsystemswhich make up parts of supersystems.
GLOBE
REGION
CITY
BUILDING
01-Attmann_Ch01_p001-026.qxd 10/22/09 4:40 PM Page 2

HUMAN IMPACT ON THE NATURAL ENVIRONMENT 3
construction of buildings, excavations, or soil cultivation. Today, our pressure on naturalenvironments and the magnitude of the disruption of ecosystems is greater than ever.According to the 2005 Millennium Ecosystem Assessment (MEA) study, the health of theworld’s ecosystems is in significant decline (Millennium Ecosystem Assessment 2005,Ecosystems and Human Well-being: Synthesis). Whether one considers the supply offresh water and food, or the regulation of climate and air quality, the study found that theglobal ecosystems showed a 62 percent decline over the course of the last four decades(see Fig. 1.2).
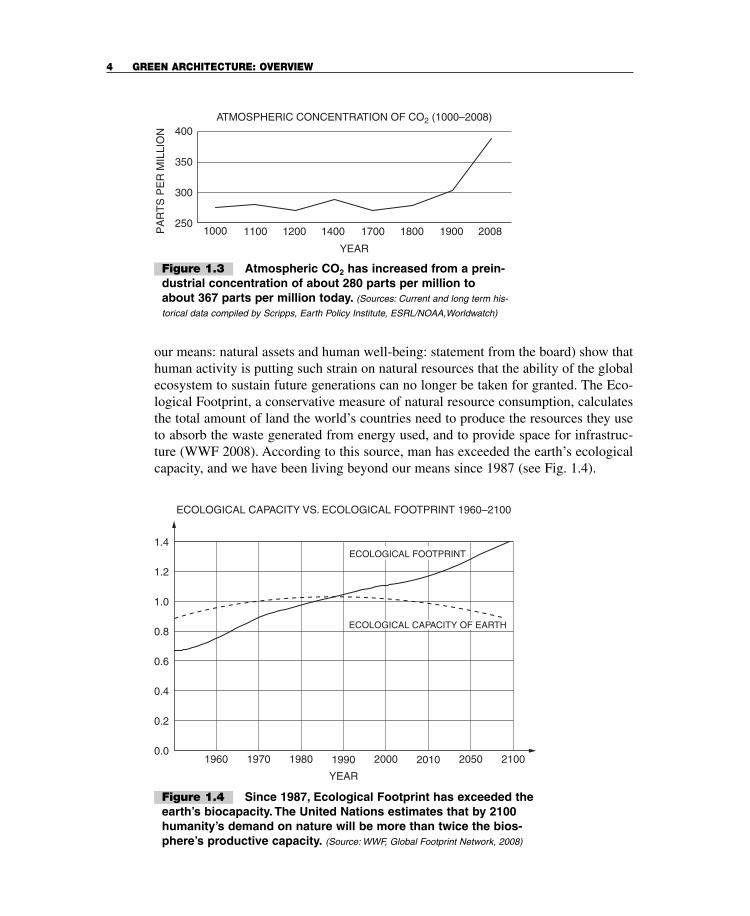
Just a few of the problems resulting from this decline are: 40 percent of the world’scoral reefs have been lost or degraded, water withdrawals from rivers and lakes havedoubled since 1960, the atmospheric concentration of carbon dioxide has jumped19 percent since 1959, and extinction of species has increased as much as 100 timesover the typical rate seen across earth’s history (Millennium Ecosystem Assessment2005, Ecosystems and Human Well-being: Synthesis) (see Fig. 1.3.).
So what does this mean to us? The decline of these systems brings about an increasingrisk of disruptive and potentially irreversible changes, such as regional climate shifts, theemergence of new diseases, and the formation of dead zones in coastal waters(Millennium Ecosystem Assessment 2005). Another unforeseen consequence of thisdecline is the exacerbation of poverty among the two-thirds of the world’s population whodesperately rely on the resources formerly produced by collapsing local ecosystems.
Furthermore, two separate reports, published by MEA 2005 (MillenniumEcosystem Assessment 2005,) and the World Wide Fund for Nature (Living beyond
15 OUT OF 24 SERVICES OF THE
ECO SYSTEMSHAVE BEEN DEGRADED
–62%
Figure 1.2 The 2005 MEA was a comprehensiveanalysis by 1360 scientists of 24 benefits or servicesderived from ecosystems. After four years of consul-tations and research, the results showed a 62 percentdecline in 15 out of 24 services.
01-Attmann_Ch01_p001-026.qxd 10/22/09 4:40 PM Page 3
4 GREEN ARCHITECTURE: OVERVIEW
our means: natural assets and human well-being: statement from the board) show thathuman activity is putting such strain on natural resources that the ability of the globalecosystem to sustain future generations can no longer be taken for granted. The Eco-logical Footprint, a conservative measure of natural resource consumption, calculatesthe total amount of land the world’s countries need to produce the resources they useto absorb the waste generated from energy used, and to provide space for infrastruc-ture (WWF 2008). According to this source, man has exceeded the earth’s ecologicalcapacity, and we have been living beyond our means since 1987 (see Fig. 1.4).
400
350
300
250
PA
RT
S P
ER
MIL
LIO
N
1000 1100 1200 1400 1700 1800 1900 2008
YEAR
ATMOSPHERIC CONCENTRATION OF CO2 (1000–2008)
Figure 1.3 Atmospheric CO2 has increased from a prein-dustrial concentration of about 280 parts per million toabout 367 parts per million today. (Sources: Current and long term his-
torical data compiled by Scripps, Earth Policy Institute, ESRL/NOAA,Worldwatch)
ECOLOGICAL CAPACITY VS. ECOLOGICAL FOOTPRINT 1960–2100
1960 1970 1980 1990
YEAR
2000 2010 2050 2100
1.4
1.2
1.0
0.8
0.6
0.4
0.2
0.0
ECOLOGICAL FOOTPRINT
ECOLOGICAL CAPACITY OF EARTH
Figure 1.4 Since 1987, Ecological Footprint has exceeded theearth’s biocapacity. The United Nations estimates that by 2100humanity’s demand on nature will be more than twice the bios-phere’s productive capacity. (Source: WWF, Global Footprint Network, 2008)
01-Attmann_Ch01_p001-026.qxd 10/22/09 4:40 PM Page 4

HUMAN IMPACT ON THE NATURAL ENVIRONMENT 5
REDUCTION AND FRAGMENTATION OF HABITATS AND LANDSCAPES
The expansion of man-made activities into the natural environment, caused by urban-ization, recreation, industrialization, and agriculture have resulted in increasing reduc-tion, disappearance, fragmentation, or isolation of habitats and landscapes. With theextension of cultivation areas from preagricultural times to 1994, the changes are dra-matic in terms of loss of forest, woodland, and grassland (see Table 1.1).
As a result, landscape uniformity has been altered, geomorphic processes have beenaffected, and the quality and the quantity of some natural waters have been changed.The nature of the entire landscape has been transformed by human-induced vegetationchanges. (Hannah, Lohse, Hutchinson, Carr and Lankerani 1994; Hannah, Carr andLankerani 1995; Goudie 2006). The spread of agriculture has transformed land cover ata global scale. Even in the past decade, the cropland areas have quadrupled.
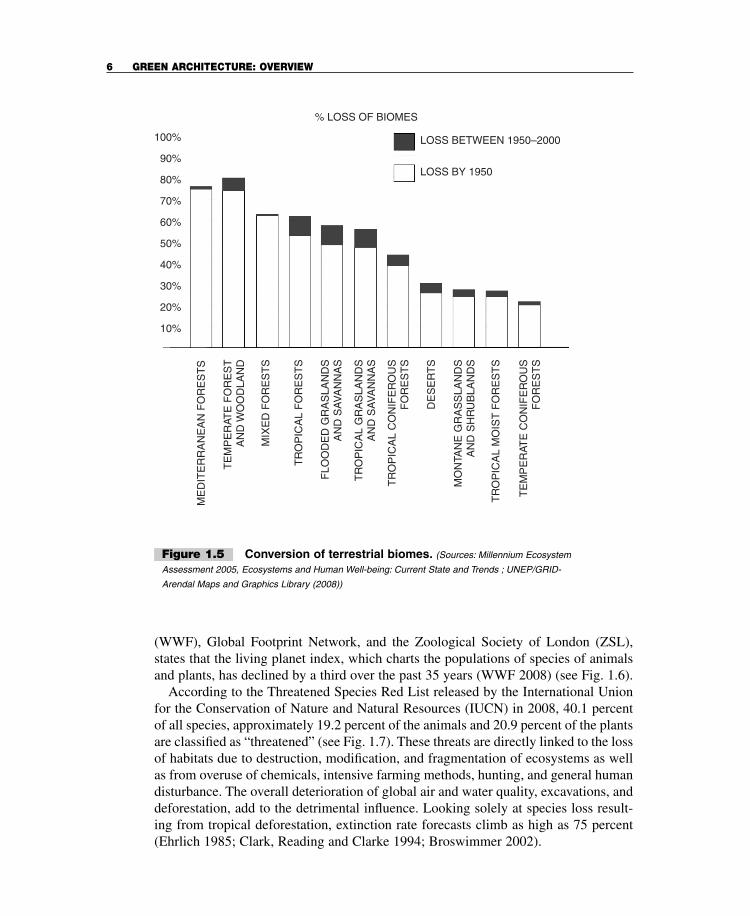
According to the 2005 MEA report, agricultural land has been expanding in about70 percent of the world’s countries, while forest areas are decreasing in two-thirds ofthose same countries. While there is a slight increase in forest area in the past 30 yearsin industrial countries, we see a 10 percent decline in developing countries over thesame time period (Millennium Ecosystem Assessment 2005). Significant deforestationin tropical forests has been documented for 1990 to 2000. The total loss of natural trop-ical forests is estimated for this period at 15.2 million hectares per year (FAO 2001)(see Fig. 1.5.).
MASS EXTINCTION OF SPECIES (PLANTS AND ANIMALS)
Although the extinction of plants and animals is a natural part of evolution, the num-ber of species disappearing per year has increased dramatically since the 1800s anddirectly correlates to population growth and the impact of man-made activities on theenvironment. The 2008 Living Planet Report, co-prepared by the World Wildlife Fund
TABLE 1.1 ESTIMATED CHANGES IN THE AREAS OF THE MAJOR LANDCOVER AREAS BETWEEN PREAGRICULTURAL TIMES TO 1994
LAND COVER PREAGRICULTURE AREA PRESENT AREA PERCENT CHANGE
Total forest 46.8 39.3 –16.0%
Tropical forest 12.8 12.3 –3.9%
Other forest 34 27 –20.6%
Woodland 9.7 7.9 –18.6%
Grassland 34 27.4 –19.4%
Cultivation 1 17.6 1760.0%
Source: Modified from Meyer and Turner, 1994.
01-Attmann_Ch01_p001-026.qxd 10/22/09 4:40 PM Page 5
6 GREEN ARCHITECTURE: OVERVIEW
(WWF), Global Footprint Network, and the Zoological Society of London (ZSL),states that the living planet index, which charts the populations of species of animalsand plants, has declined by a third over the past 35 years (WWF 2008) (see Fig. 1.6).
According to the Threatened Species Red List released by the International Unionfor the Conservation of Nature and Natural Resources (IUCN) in 2008, 40.1 percentof all species, approximately 19.2 percent of the animals and 20.9 percent of the plantsare classified as “threatened” (see Fig. 1.7). These threats are directly linked to the lossof habitats due to destruction, modification, and fragmentation of ecosystems as wellas from overuse of chemicals, intensive farming methods, hunting, and general humandisturbance. The overall deterioration of global air and water quality, excavations, anddeforestation, add to the detrimental influence. Looking solely at species loss result-ing from tropical deforestation, extinction rate forecasts climb as high as 75 percent(Ehrlich 1985; Clark, Reading and Clarke 1994; Broswimmer 2002).
100%
90%
80%
70%
60%
50%
40%
30%
20%
10%
% LOSS OF BIOMES
LOSS BETWEEN 1950–2000
LOSS BY 1950
ME
DIT
ER
RA
NE
AN
FO
RE
ST
S
TE
MP
ER
ATE
FO
RE
ST
AN
D W
OO
DLA
ND
MIX
ED
FO
RE
ST
S
TR
OP
ICA
L F
OR
ES
TS
FLO
OD
ED
GR
AS
LAN
DS
AN
D S
AV
AN
NA
S
TR
OP
ICA
L G
RA
SLA
ND
SA
ND
SA
VA
NN
AS
TR
OP
ICA
L C
ON
IFE
RO
US
FO
RE
ST
S
DE
SE
RT
S
MO
NTA
NE
GR
AS
SLA
ND
SA
ND
SH
RU
BLA
ND
S
TR
OP
ICA
L M
OIS
T F
OR
ES
TS
TE
MP
ER
ATE
CO
NIF
ER
OU
SF
OR
ES
TS
Figure 1.5 Conversion of terrestrial biomes. (Sources: Millennium Ecosystem
Assessment 2005, Ecosystems and Human Well-being: Current State and Trends ; UNEP/GRID-
Arendal Maps and Graphics Library (2008))
01-Attmann_Ch01_p001-026.qxd 10/22/09 4:40 PM Page 6

HUMAN IMPACT ON THE NATURAL ENVIRONMENT 7
POLLUTION AND CLIMATE CHANGE
Since Paleolithic times, humans have had some effect on the environment, and pollution hasalways been a part of human history. As summarized in the Brief History of GreenArchitecture, chapter 3, the rise and fall of all existing civilizations are connected to envi-ronmental pollution and its subsequent consequences. However, any type of pollution,whether of land, water, or air, before the twentieth century was more or less local. But begin-ning in the early 1900s, especially after World War II, globalization, increasing population,and the use of industrial processes created a new paradigm, in which our modern way of lifebegan to have a much greater collective impact on our surroundings than ever before.
Today, harmful emissions into the air and water from urban, industrial, and agriculturalsources affect over a billion people around the world by making resources either unusable
1.0
0.72
0.50
0.001970 1980 1990 2000 2005
YEAR
IND
EX
LIVING PLANET INDEX
Figure 1.6 Global Living Planet index shows 28 percentdecrease in 4642 populations of 1686 species since 1970. (Source:
Millennium Ecosystem Assessment 2005, Ecosystems and Human Well-being: Synthesis)
–35% –30%
–29%
–20%
–12%
–5%
–4%
–25% –20% –15% –10% –5% 0%
FISHES
REPTILES
BIRDS
MAMMALS
AMPHIBIANS
THREATENED SPECIES WITH EXTINCTION
Figure 1.7 The 2008 Red List, prepared by the IUCN WorldConservation Congress shows at least 1141 of the 5487 mammals onearth are known to be threatened with extinction. (Source: IUCN Red List, 2008)
01-Attmann_Ch01_p001-026.qxd 10/22/09 4:40 PM Page 7

8 GREEN ARCHITECTURE: OVERVIEW
or unhealthful. The World Bank estimates that about 20 percent of health concerns in devel-oping countries can be traced to environmental factors (WB 2007). Pimentel et al. studyreports the number could be higher (Pimentel, Tort, D’Anna, Krawic, Berger, Rossman,Mugo, Doon, Shriberg, Howard, Lee and Talbot 1998) with 40 percent of deaths resultingfrom exposure to environmental pollutants and malnutrition (WHO 1992; WHO 1995).
TOP TEN WORST POLLUTION PROBLEMS IN THE WORLD
In a joint report with Green Cross Switzerland in 2008, Blacksmith Institute producedthe first list of the “World’s Worst Pollution Problems: The Top Ten of the ToxicTwenty,” an overview of the range of pollution threats which details the sources andeffects of pollution in the most polluted places around the world (see Table 1.2). The20 major global pollution problems are directly associated with economic and tech-nological factors of the regions. High levels of urbanization, poor or no infrastructure,and lack of formal sector employment, as well as over leveraged governments, pres-ent very dangerous conditions for human health, as people turn to informal and oftentoxic sources of generating income (Blacksmith_Institute 2008).
TABLE 1.2 TOP TEN WORLD’S WORST POLLUTION PROBLEMS
Contaminated Surface Water
Groundwater Contamination
Urban Air Quality
Indoor Air Pollution
Metals Smelting and Processing
Industrial Mining Activities
Radioactive Waste and Uranium Mining
Untreated Sewage
Used Lead Acid Battery Recycling
Artisanal Gold Mining
Sources: Blacksmith_Institute and Green Cross joint report (2008).
Although each one of these issues has a devastating impact on the health of the envi-ronment and its people, contaminated surface water, groundwater contamination,urban air quality, and indoor air pollution are directly and/or indirectly related to archi-tecture, and therefore, need to be addressed.
Contaminated surface water now affects one-third of the world, and almost five mil-lion annual deaths in the developing nations are due to water-related diseases (Prüss-Üstün, Bos, Gore and Bartram 2008).
Groundwater pollution is another major health issue connected to surface water con-tamination. Groundwater makes up 97 percent of the world’s accessible freshwaterreserves and only 0.3 percent of it is useable for drinking (WB 2008). An overwhelming
01-Attmann_Ch01_p001-026.qxd 10/22/09 4:40 PM Page 8

HUMAN IMPACT ON THE NATURAL ENVIRONMENT 9
number of people in developing countries rely heavily on groundwater, mostly from shal-lowly dug wells. These can easily become polluted, primarily through human activities(Blacksmith_Institute 2008).
Air pollution, indoor and outdoor, is another source of health problems. More than halfof the world’s population relies on unprocessed biomass fuel, such as wood, animal andcrop waste, and coal to meet their basic needs. Cooking and heating with such solid fuelswithout exhaust systems leads to indoor air pollution. Every year this is responsible for thedeath of 1.6 million people worldwide (WB 2007). Urban areas have an equally danger-ous exposure to outdoor air pollution, even though national governments and multilateraldevelopment organizations widely recognize the health hazards involved. The WorldHealth Organization estimated in 2007 that 865,000 deaths per year can be directly attrib-uted to outdoor air pollution (WB 2007). As seen in the pollution demographics tables (seeTables 1.3 and 1.4), most studies on the health effects of outdoor air pollution have focusedon urban environments of 100,000 plus persons, where the impact is considered to be mostsevere, since people are routinely exposed to heavy concentrations of airborne pollutants.
However, not only does air pollution harm the environment, it also influences andchanges climate. The report of the Earth System Research Laboratory (ESRL) empha-sizes the direct impact of air pollution on climate, including greenhouse gases such as car-bon dioxide, sulfur, and nitrogen dioxide. Although these gases do not make up a largepercentage of earth’s atmosphere, even in small quantities they have a profound effect onglobal climate. Greenhouse gases are mostly responsible for the increase in global surfaceair temperature of about 0.6°C (1°F) over the past century, and scientists project thatmuch more warming will likely happen during the next century (ESRL 2009).
Guiyang, China 70 424 53TABLE 1.3 AIR POLLUTION RATE IN THE WORLD. MANY OF THE WORLD’SMOST POLLUTED CITIES ARE LOCATED IN CHINA AND INDIA, AND OTHERDEVELOPING INDUSTRIALIZED COUNTRIES
PARTICULATE SULFUR DIOXIDE NITROGEN DIOXIDECITY MATTER (mg/m3 ) (mg/m3) (mg/m3)
Chongqing, China 123 340 70
Tianjin, China 125 82 50
Shenyang, China 101 99 73
Cairo, Egypt 169 69 ..
Kolkata, India 128 49 34
Delhi, India 150 24 41
Lucknow, India 109 26 25
Tehran, Iran 58 209 ..
Taiyuan, China 88 211 55
Guiyang China 70 424 53
(Source: Compiled from World Bank Statistics—World Development Indicators (WB 2007))
01-Attmann_Ch01_p001-026.qxd 10/22/09 4:40 PM Page 9

10 GREEN ARCHITECTURE: OVERVIEW
In 2008, all indicators—atmospheric concentration of CO2, carbon emissions fromburning fossil fuels, and global land-ocean temperature at earth surface—showed steadyincreases (see Figs. 1.8 and 1.9). The average atmospheric carbon dioxide concentrationreached 387 parts per million (ppm), up almost 35 percent since the industrial revolution
TABLE 1.4 AIR POLLUTION BY COUNTRY. URBAN POPULATION WEIGHTEDAVERAGE PM10 CONCENTRATIONS (MICRO GRAMS PER CUBIC METER) INRESIDENTIAL AREAS OF CITIES LARGER THAN 100,000
COUNTRY 2000 URBAN POPULATION 1999 PM10 CONCENTRATION
Sudan 5094060 246
Mali 1215170 194
Pakistan 37274140 180
Iraq 14833284 178
Uruguay 1473550 173
Niger 1150996 164
Chad 1430623 161
Egypt, Arab Rep. 21101690 152
Bangladesh 10585200 147
Kuwait 1638081 134
(Source: Compiled and modified from the World Bank Statistics –World Development Indicators (WB2007), and World Bank Air Pollution in World Cities database (Wheeler, Deichmann et al. 2007))
8
7
6
5
4
3
2
1
0175018001850 1900 1910 1920 1930 1940 1950 1960 1970 1980 1990 2000 2009
BIL
LIO
N T
ON
NS
OF
CO
2
GLOBAL CARBON EMISSIONS FROM CARBON FUEL 1750–2009
Figure 1.8 Global CO2 emissions have risen sharply since the IndustrialRevolution. (Source: ESRL, 2009)
01-Attmann_Ch01_p001-026.qxd 10/22/09 4:40 PM Page 10

ARCHITECTURAL IMPACT ON THE NATURAL ENVIRONMENT 11
and the highest for at least the last 650,000 years (ESRL 2009). These recent figuresclearly indicate that man-made activities have weakened natural “sinks,” such as forests,seas, and soils that absorb carbon.
Architectural Impact on the NaturalEnvironmentArchitecture is a complex discipline that incorporates a variety of fields, includingdesign, planning, building construction, landscaping, engineering, and social sciences.Therefore, it is difficult to sort out particular disciplinary areas or to pinpoint specificissues that have an environmental impact. The environmental factors associated witharchitecture are mostly holistic, far-reaching, and long-lasting, ranging from theresources expended to construct the buildings (technology, materials, energy, water,transportation), the waste produced during construction, the resources used by occu-pants over the lifetime of the building, and finally the resources and waste involved withdemolition and recycling of the structure. Additionally there are the associated prob-lems arising from the wider infrastructural issues including transportation, parking,drainage, and provision of services, all of which make up the urban building scene.
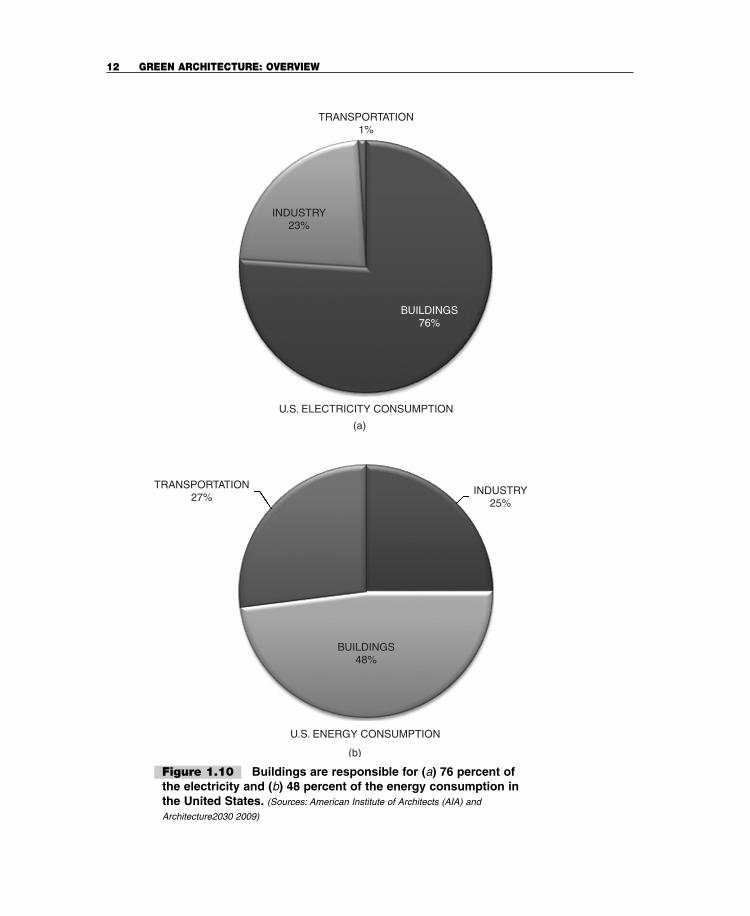
From the environmental viewpoint, buildings account for nearly half of all energyconsumption and raw material use around the globe (Fig. 1.10). According to the 2008
15
14.5
14
13.5
13
12.5
12
°C T
EM
PE
RAT
UR
E
1800
1810
1820
1830
1840
1850
1860
1870
1880
1890
1900
1910
1920
1930
1940
1950
1960
1970
1980
1990
2000
2009
GLOBAL LAND-OCEAN TEMPERATURE 1800–2009
Figure 1.9 Global land-ocean temperatures are in steadyincrease since 1960. In 2009, global temperatures increased morethan 20 years average. (Source: GISS, 2009)
01-Attmann_Ch01_p001-026.qxd 10/22/09 4:40 PM Page 11
12 GREEN ARCHITECTURE: OVERVIEW
INDUSTRY23%
TRANSPORTATION1%
U.S. ELECTRICITY CONSUMPTION
BUILDINGS76%
TRANSPORTATION27%
INDUSTRY25%
U.S. ENERGY CONSUMPTION
BUILDINGS48%
(a)
(b)
Figure 1.10 Buildings are responsible for (a) 76 percent ofthe electricity and (b) 48 percent of the energy consumption inthe United States. (Sources: American Institute of Architects (AIA) and
Architecture2030 2009)
01-Attmann_Ch01_p001-026.qxd 10/22/09 4:40 PM Page 12

ARCHITECTURAL IMPACT ON THE NATURAL ENVIRONMENT 13
Buildings Energy Data book (USDE 2008), commercial and residential buildingsaccount for 39.7 percent of the energy consumed (residential 21.5 percent andcommercial 18.2 percent). They are responsible for 76 percent of the electricity used and15 percent of the total water consumed (Architecture 2030 2009). Similar data wasreported by the International Energy Agency (IEA) in 2005, which estimated that build-ings accounted for approximately 40 percent of worldwide energy use, equivalent to 2500Mtoe (million ton oil equivalent) per year (IEA 2005). Studies carried out by theOrganization for Economic Co-operation and Development (OECD) indicate that energyconsumption by the building sector in OECD countries has continually increased sincethe 1960s (OECD 2003) and will continue to do so in the coming years, mainly due toconstruction booms in Asia, the Middle East, and Latin America (UNEP 2006).
At the same time, the building and construction sector takes the largest share of nat-ural resources, both for land use and for materials extraction. Buildings use 50 percentof the world’s raw materials—many of which are nonrenewable resources—and theyare responsible for 36 percent of all waste generated worldwide (Graham 2002).
Buildings also account for one-third of greenhouse gas emissions (GHG) world-wide, which will increase sharply as construction increases. Estimated at 8.6 billiontons in 2004, building-related GHG emissions could almost double by 2030 to reach15.6 billion tons under high-growth construction, according to the IntergovernmentalPanel on Climate Change (IPCC 2007) (see Fig. 1.11).
800
700
600
500
400
300
200
100
01960 1970 1980
YEAR
1990 2000
MIL
LIO
N M
ET
RIC
TO
NS
OF
CO
2
U.S. CO2 EMISSIONS BY SECTOR
BUILDINGS
TRANSPORTATION
INDUSTRY
Figure 1.11 In comparison to other sectors, buildings arethe largest energy consuming and CO2 emitting sector.(Sources: U.S. Energy Information Administration statistics (USDE 2008),
Architecture2030)
01-Attmann_Ch01_p001-026.qxd 10/22/09 4:40 PM Page 13

14 GREEN ARCHITECTURE: OVERVIEW
Although there are various, some even uncontrollable, reasons contributing to this unset-tling scenario, three major factors seem to play important roles in environmental impact.
■ Overpopulation and resource (un)availability■ Complex construction processes and life span of buildings■ Technologies and materials
OVERPOPULATION AND RESOURCE (UN)AVAILABILITY
A growing population, the emergence of new towns, and the consequent need for hous-ing, infrastructure services, and construction activities mean an increased demand forresources. Over-population especially places competitive stress on basic life-sustainingresources, such as food, shelter, energy, clean water, and clean air (Nielsen 2006). Fromthe beginning of human history to the turn of the nineteenth century, world populationgrew to a total of one billion people. During the 1800s, population rose at increasinglyhigher rates, reaching a total of about 1.7 billion people by 1900. According to the U.S.Census Bureau, the world’s population in 2008 was 6.7 billion—quadrupled since theturn of the twentieth century (U.S. Census Bureau 2008) (see Figs. 1.12 and 1.13). The
10
9
8
7
6
5
4
3
2
1
07000BC
5000BC
2000BC
1 AD 1000AD
1800AD
1900AD
2009AD
2050AD
BIL
LIO
NS
OF
PE
OP
LE
WORLD POPULATION GROWTH 7000 BC–2050 AD
PR
OJE
CT
ED
Figure 1.12 World population increased more than 600 percentbetween 1800 and 2009 and is projected to increase by an additional37 percent to 9.2 billion by 2050. (Sources: UN Population Division, 2006; U.S.
Census Bureau, 2008)
01-Attmann_Ch01_p001-026.qxd 10/22/09 4:40 PM Page 14

ARCHITECTURAL IMPACT ON THE NATURAL ENVIRONMENT 15
United Nations projects that the world population will increase by 2.5 billion over thenext 41 years, from the current 6.7 billion to 9.2 billion by 2050. The projected increasealone is equivalent to the total world population in 1950. Less developed countries, whosepopulation is projected to rise from 5.4 billion in 2007 to 7.9 billion in 2050 will proba-bly see most of the increase (U.N. Population Division 2006).
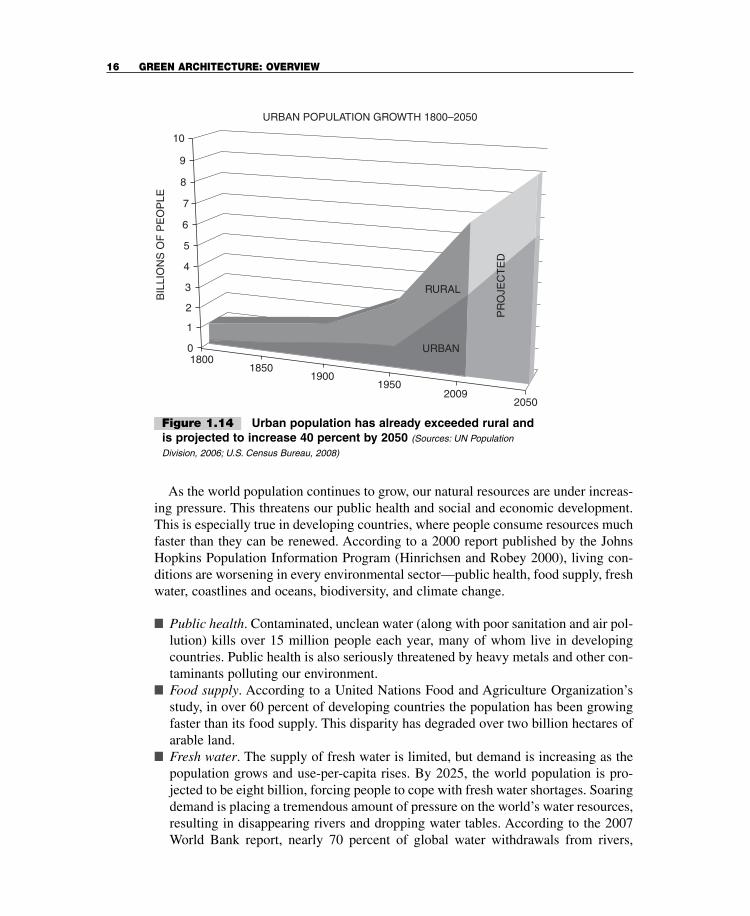
In addition to depletion of natural resources, pollution, poverty, and malnutrition,one of the major problems associated with or exacerbated by overpopulation is thehigh-density urban settlements. The United Nations projects that by 2010, for the firsttime, the urban population of the earth will outnumber the rural. In 1800 only 3 percentof the world’s population lived in cities. In 1950, there were only 86 cities with a pop-ulation of more than one million; today, there are 400, and by 2015, there will be morethan 550 (Davis 2006; U.N. Population Division 2006). This rapid urbanization meansthat over the next 30 years developing countries are predicted to triple their populationsize and account for 80 percent of the world’s urban population (see Fig. 1.14).
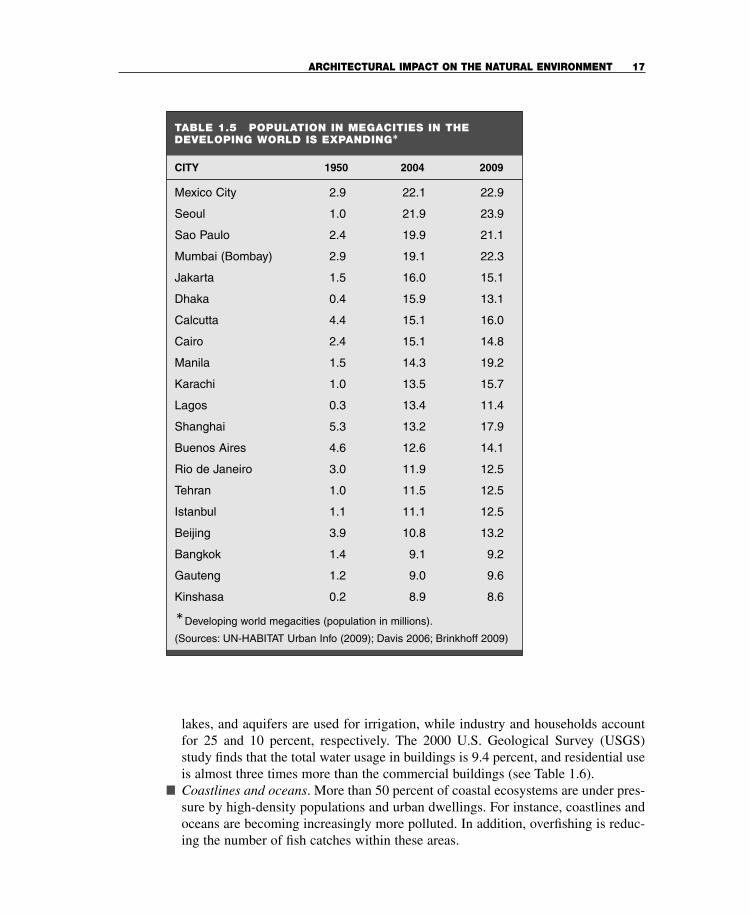
This being the case, the majority of this population, 60 percent, will live inslums. Today over one billion people already live in slums, with this figure risingby 25 millions a year, and only 1 percent of housing and urban aid is given to urbanslums (see Table 1.5). Although Asia presently has over half the world’s slum pop-ulation (581 million), Africa is expected to exceed this percentage by 2020 (Davis2006; U.N. Population Division 2006).
10
9
8
7
6
5
4
3
2
1
0
BIL
LIO
NS
OF
PE
OP
LE
18001850
19001950
20092050
PR
OJE
CT
ED
DEVELOPING REGIONSDEVELOPED REGIONS
REGIONAL POPULATION GROWTH 1800–2050
Figure 1.13 Population ratio between developed and developingregions is projected to reach 1/8 by 2050. (Sources: UN Population Division,
2006; U.S. Census Bureau, 2008)
01-Attmann_Ch01_p001-026.qxd 10/22/09 4:40 PM Page 15
16 GREEN ARCHITECTURE: OVERVIEW
As the world population continues to grow, our natural resources are under increas-ing pressure. This threatens our public health and social and economic development.This is especially true in developing countries, where people consume resources muchfaster than they can be renewed. According to a 2000 report published by the JohnsHopkins Population Information Program (Hinrichsen and Robey 2000), living con-ditions are worsening in every environmental sector—public health, food supply, freshwater, coastlines and oceans, biodiversity, and climate change.
■ Public health. Contaminated, unclean water (along with poor sanitation and air pol-lution) kills over 15 million people each year, many of whom live in developingcountries. Public health is also seriously threatened by heavy metals and other con-taminants polluting our environment.
■ Food supply. According to a United Nations Food and Agriculture Organization’sstudy, in over 60 percent of developing countries the population has been growingfaster than its food supply. This disparity has degraded over two billion hectares ofarable land.
■ Fresh water. The supply of fresh water is limited, but demand is increasing as thepopulation grows and use-per-capita rises. By 2025, the world population is pro-jected to be eight billion, forcing people to cope with fresh water shortages. Soaringdemand is placing a tremendous amount of pressure on the world’s water resources,resulting in disappearing rivers and dropping water tables. According to the 2007World Bank report, nearly 70 percent of global water withdrawals from rivers,
10
9
8
7
6
5
4
3
2
1
01800
18501900
19502009
2050
BIL
LIO
NS
OF
PE
OP
LE
URBAN POPULATION GROWTH 1800–2050
RURAL
URBAN
PR
OJE
CT
ED
Figure 1.14 Urban population has already exceeded rural andis projected to increase 40 percent by 2050 (Sources: UN Population
Division, 2006; U.S. Census Bureau, 2008)
01-Attmann_Ch01_p001-026.qxd 10/22/09 4:40 PM Page 16
ARCHITECTURAL IMPACT ON THE NATURAL ENVIRONMENT 17
lakes, and aquifers are used for irrigation, while industry and households accountfor 25 and 10 percent, respectively. The 2000 U.S. Geological Survey (USGS)study finds that the total water usage in buildings is 9.4 percent, and residential useis almost three times more than the commercial buildings (see Table 1.6).
■ Coastlines and oceans. More than 50 percent of coastal ecosystems are under pres-sure by high-density populations and urban dwellings. For instance, coastlines andoceans are becoming increasingly more polluted. In addition, overfishing is reduc-ing the number of fish catches within these areas.
TABLE 1.5 POPULATION IN MEGACITIES IN THEDEVELOPING WORLD IS EXPANDING*
CITY 1950 2004 2009
Mexico City 2.9 22.1 22.9
Seoul 1.0 21.9 23.9
Sao Paulo 2.4 19.9 21.1
Mumbai (Bombay) 2.9 19.1 22.3
Jakarta 1.5 16.0 15.1
Dhaka 0.4 15.9 13.1
Calcutta 4.4 15.1 16.0
Cairo 2.4 15.1 14.8
Manila 1.5 14.3 19.2
Karachi 1.0 13.5 15.7
Lagos 0.3 13.4 11.4
Shanghai 5.3 13.2 17.9
Buenos Aires 4.6 12.6 14.1
Rio de Janeiro 3.0 11.9 12.5
Tehran 1.0 11.5 12.5
Istanbul 1.1 11.1 12.5
Beijing 3.9 10.8 13.2
Bangkok 1.4 9.1 9.2
Gauteng 1.2 9.0 9.6
Kinshasa 0.2 8.9 8.6
*Developing world megacities (population in millions).
(Sources: UN-HABITAT Urban Info (2009); Davis 2006; Brinkhoff 2009)
01-Attmann_Ch01_p001-026.qxd 10/22/09 4:40 PM Page 17

18 GREEN ARCHITECTURE: OVERVIEW
■ Biodiversity. The earth’s biodiversity is in imminent danger; human activities are forc-ing numerous plants and animals into extinction. In fact, it is estimated that 65 percentof all species are declining in numbers.
■ Global climate change. The planet’s surface is warming at an alarming rate, in largepart because of the building industry’s emission of greenhouse gases. If global tem-peratures continue to increase as projected, sea levels would rise by several feet.The result would be widespread additional climate change, followed by floodingand drought. Agriculture production would be severely disrupted and/or curtailed,placing additional pressure on the world’s food supply.
The depletion of resources is an inevitable result of overpopulation and its subse-quent high-density housing needs. There is an unsustainable demand/resource ratioon the earth’s natural resources, materials, and energy. Each year, three billion tonsof raw materials—about 40 to 50 percent of the total amount consumed by the globaleconomy—are used in the manufacturing of building products and their components(Roodman and Lenssen1995; Anink et al. 1996). Furthermore, the global consump-tion of key raw materials (such as steel, aluminum, plastic, and cement) is rising fast.For example, over a 20-year period ending in 1994, the world consumption of cementincreased by 77 percent and plastic consumption increased by 200 percent, while theworld population increased by 40 percent (University of Minnesota, 1999).
COMPLEX BUILDING CONSTRUCTION PROCESS AND LIFECYCLE OF BUILDINGS
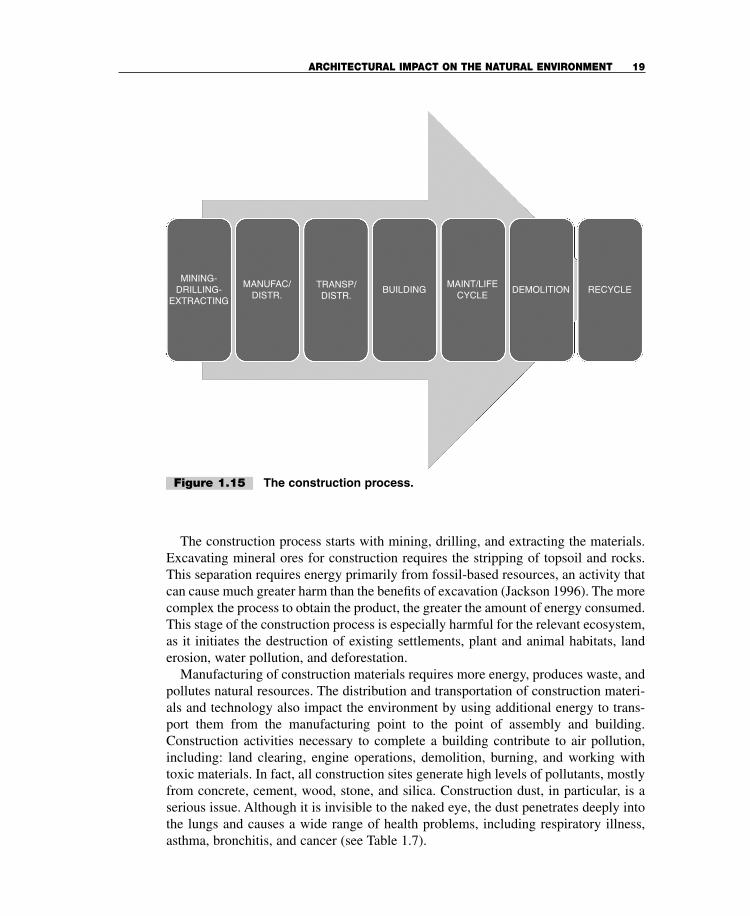
Contrary to common belief, the term architecture does not refer simply to the end product.It involves a long process with various stages, including: mining for resources, manufac-turing, transportation of the materials and technology, building, maintenance, demolition,and recycling (see Fig. 1.15). Every stage has its own activities, some more complex thanothers, with various levels of environmental impacts.
TABLE 1.6 ACCORDING TO THE 2000 USGS SURVEY, BUILDINGS USE 9.4 PERCENTOF THE FRESH WATER*
% OF TOTAL % OF TOTAL % OF TOTAL YEAR ALL BUILDINGS WATER USE RESIDENTIAL WATER USE COMMERCIAL WATER USE
1985 31.26 7.8% 24.32 6.1% 6.94 1.7%
1990 33.58 8.2% 25.29 6.2% 8.29 2.0%
1995 35.67 8.9% 26.09 6.5% 9.58 2.4%
2000 38.34 9.4% 28.03 6.9% 10.31 2.5%
*Total use of water by buildings (billion gallons per day).
(Sources: Hutson, Barber, Kenny, Linsey, Lumia, and Maupin 2004; USDE 2008)
01-Attmann_Ch01_p001-026.qxd 10/22/09 4:40 PM Page 18
ARCHITECTURAL IMPACT ON THE NATURAL ENVIRONMENT 19
The construction process starts with mining, drilling, and extracting the materials.Excavating mineral ores for construction requires the stripping of topsoil and rocks.This separation requires energy primarily from fossil-based resources, an activity thatcan cause much greater harm than the benefits of excavation (Jackson 1996). The morecomplex the process to obtain the product, the greater the amount of energy consumed.This stage of the construction process is especially harmful for the relevant ecosystem,as it initiates the destruction of existing settlements, plant and animal habitats, landerosion, water pollution, and deforestation.
Manufacturing of construction materials requires more energy, produces waste, andpollutes natural resources. The distribution and transportation of construction materi-als and technology also impact the environment by using additional energy to trans-port them from the manufacturing point to the point of assembly and building.Construction activities necessary to complete a building contribute to air pollution,including: land clearing, engine operations, demolition, burning, and working withtoxic materials. In fact, all construction sites generate high levels of pollutants, mostlyfrom concrete, cement, wood, stone, and silica. Construction dust, in particular, is aserious issue. Although it is invisible to the naked eye, the dust penetrates deeply intothe lungs and causes a wide range of health problems, including respiratory illness,asthma, bronchitis, and cancer (see Table 1.7).
MINING-DRILLING-
EXTRACTING
MANUFAC/DISTR.
TRANSP/DISTR.
BUILDINGMAINT/LIFECYCLE
DEMOLITION RECYCLE
Figure 1.15 The construction process.
01-Attmann_Ch01_p001-026.qxd 10/22/09 4:40 PM Page 19
20 GREEN ARCHITECTURE: OVERVIEW
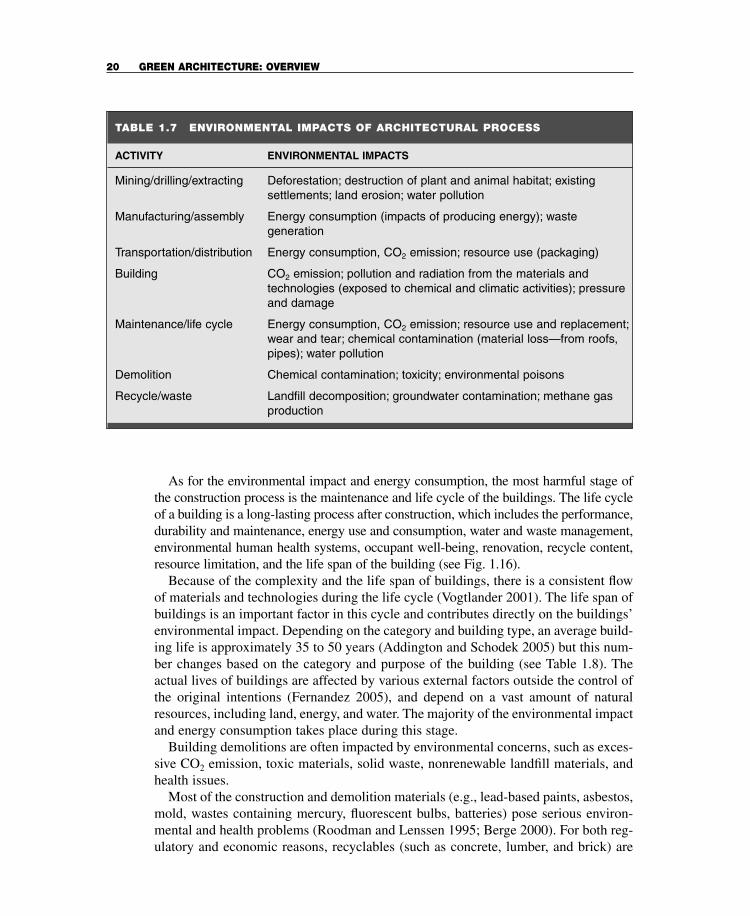
As for the environmental impact and energy consumption, the most harmful stage ofthe construction process is the maintenance and life cycle of the buildings. The life cycleof a building is a long-lasting process after construction, which includes the performance,durability and maintenance, energy use and consumption, water and waste management,environmental human health systems, occupant well-being, renovation, recycle content,resource limitation, and the life span of the building (see Fig. 1.16).
Because of the complexity and the life span of buildings, there is a consistent flowof materials and technologies during the life cycle (Vogtlander 2001). The life span ofbuildings is an important factor in this cycle and contributes directly on the buildings’environmental impact. Depending on the category and building type, an average build-ing life is approximately 35 to 50 years (Addington and Schodek 2005) but this num-ber changes based on the category and purpose of the building (see Table 1.8). Theactual lives of buildings are affected by various external factors outside the control ofthe original intentions (Fernandez 2005), and depend on a vast amount of naturalresources, including land, energy, and water. The majority of the environmental impactand energy consumption takes place during this stage.
Building demolitions are often impacted by environmental concerns, such as exces-sive CO2 emission, toxic materials, solid waste, nonrenewable landfill materials, andhealth issues.
Most of the construction and demolition materials (e.g., lead-based paints, asbestos,mold, wastes containing mercury, fluorescent bulbs, batteries) pose serious environ-mental and health problems (Roodman and Lenssen 1995; Berge 2000). For both reg-ulatory and economic reasons, recyclables (such as concrete, lumber, and brick) are
TABLE 1.7 ENVIRONMENTAL IMPACTS OF ARCHITECTURAL PROCESS
ACTIVITY ENVIRONMENTAL IMPACTS
Mining/drilling/extracting Deforestation; destruction of plant and animal habitat; existingsettlements; land erosion; water pollution
Manufacturing/assembly Energy consumption (impacts of producing energy); wastegeneration
Transportation/distribution Energy consumption, CO2 emission; resource use (packaging)
Building CO2 emission; pollution and radiation from the materials andtechnologies (exposed to chemical and climatic activities); pressureand damage
Maintenance/life cycle Energy consumption, CO2 emission; resource use and replacement;wear and tear; chemical contamination (material loss—from roofs,pipes); water pollution
Demolition Chemical contamination; toxicity; environmental poisons
Recycle/waste Landfill decomposition; groundwater contamination; methane gasproduction
01-Attmann_Ch01_p001-026.qxd 10/22/09 4:40 PM Page 20

ARCHITECTURAL IMPACT ON THE NATURAL ENVIRONMENT 21
ENVIRONMENTAL IMPACT
ENERGY CONSUMPTION
MIN
ING
/DR
ILLI
NG
MA
NU
FAC
TU
RIN
G
TR
AN
SP
OR
TAT
ION
/D
IST
RIB
UT
ION
CO
NS
TR
UC
TIO
N
LIF
E C
YC
LE
DE
MO
LIT
ION
RE
CY
CLE
/WA
ST
E
Figure 1.16 The majority of the environmental impact andenergy consumption takes place during the life cycle stage.
TABLE 1.8 CATEGORY OF DESIGN SERVICE LIFE FOR BUILDINGS
CATEGORY DESIGN SERVICE LIFE EXAMPLES
Temporary Up to 10 years Nonpermanent construction buildings; salesoffices,
bunkhouses temporary exhibition buildings
Medium life 25–49 years Most industrial buildings; most parking structures
Long life 50–99 years Most residential, commercial, and office buildings;health and educational buildings; parking structuresbelow buildings designed for long life category
Permanent Minimum period, 100 years Monumental buildings (e.g., national museums, artgalleries, archives); heritage buildings
Source: CSA (R2001) Guideline on Durability in Buildings
typically separated from other solid waste. As their processing and disposal proce-dures are minimal and inexpensive, most of these materials are salvaged and reused.Other recyclables (such as steel, aluminum, copper, and glass) possess significant eco-nomic value to specialty recycling and salvage facilities. Hazardous waste must be dis-posed of in a separate landfill at a very high cost. This includes materials with highlevels of fossil fuel, chromium, or lead-based contaminants (Gockel 1994).
01-Attmann_Ch01_p001-026.qxd 10/22/09 4:40 PM Page 21
22 GREEN ARCHITECTURE: OVERVIEW
TECHNOLOGIES AND MATERIALS
Materials, technology, and architecture have had a strong relationship from the veryearly beginnings of construction. This relationship is almost inseparable and is one ofsubordination. The material is merely the means of completing a building, and the act ofbuilding requires a technology. The invention and use of these elements changed ourbuilt environment, but we are only now learning that this connection has had ecologicalconsequences.
The technologies and materials for construction and then operation of buildingshave a disproportionate impact on the natural environment when compared to its rolein the economy. Although the construction sector represents only about 8 percent ofgross domestic product (GDP) in the United States, it consumes 40 percent of allextracted materials, produces one-third of the total landfill waste stream, and accountsfor 39 percent of national energy consumption for its operation (Roodman andLenssen 1995). Raw materials for the building sector are extracted, processed, trans-ported, fashioned in the construction phase, demolished, and recycled. As stated ear-lier, all these stages imply a number of environmental impacts. In particular, the build-ing industry is a heavy consumer of materials with high-embodied energy content,such as aluminum, cement, and steel, the production of which usually depends on theuse of fossil fuels, resulting in CO2 emissions (UNEP 2006). Lightweight constructionmaterials, such as timber frames, usually have lower-embodied energy in comparison,but because of massive harvesting of this material, 20 percent of the earth’s forestshave disappeared. Around the world, mining of copper, bauxite, and iron ore resourcesfor building materials continues, pouring large quantities of pollutants into nearby airand water. All these trends are accelerating, and the damage they have done and maydo is often irreversible (Roodman and Lenssen 1995).
Throughout the entire construction process, fossil fuel–based energy consumptionis high. For example, the high temperatures necessary to produce steel, glass, andbrick require great amounts of fossil fuels. Transporting materials to a building siteburns yet more fossil fuels. It is not surprising then, that the amount of carbon diox-ide in our atmosphere has risen approximately 30 percent since 1900, one-quarter ofwhich comes from fossil fuel combustion used to provide energy for buildings(Roodman and Lenssen 1995).
As mentioned earlier, a completed building does not mean less consumption offossil fuel and energy, but rather more. According to the 1992 OECD report,energy use in buildings from 1971 to 1992 was at an average 2 percent annually.In 1992, total energy use in buildings had risen to 34 percent. This included25 percent from fossil fuels, 44 percent from hydropower, and 50 percent fromnuclear power. Adding in the fuels and power used in construction, buildings con-sume at least 40 percent of the world’s energy. They thus account for about a thirdof the emissions of heat-trapping carbon dioxide from fossil fuel burning, andtwo-fifth of acid-rain-causing sulfur dioxide and nitrogen oxides. Buildings alsocontribute to other side effects of energy use—oil spills, nuclear waste generation,river damming, toxic runoff from coal mines, and mercury emissions from coalburning (OECD 1992; Roodman and Lenssen 1995).
01-Attmann_Ch01_p001-026.qxd 10/22/09 4:40 PM Page 22

RESPONSIBILITY OF ARCHITECTURE 23
A survey of water use in buildings tells a similar story. An increase in water use islowering water tables and necessitating large projects that siphon water supply awayfrom agriculture. In addition, electric power plants use water as a coolant, which thendrains into rivers, carrying thermal and chemical pollution. These two uses contributeabout equally to buildings’ one-sixth share of global water withdrawals (Roodmanand Lenssen 1995; Gleick, Cooley, Katz and Lee 2007).
Steel production can be highly polluting; iron mining produces tailings that can leachheavy metals into nearby streams; and open-hearth steel making can emit lead andother poisonous heavy metals. According to 1992 U.K. data, the use of materials suchas steel, copper, aluminum, and concrete makes each square meter of floor space in alarge office building 2 to 4 times as energy intensive—and therefore approximately 2to 4 times as pollution intensive as a house (Roodman and Lenssen 1995). Another con-cern with materials is their potential impact on indoor air quality. Most bonding anddrying agents in carpets, veneers, particle board, plywood, and petroleum-based paintsemit health-threatening volatile organic compounds (Roodman and Lenssen 1995).Finally, many modern buildings also create dangerous indoor environments for theirinhabitants. For example, “sick building syndrome” is reported to occur in 30 percentof new or renovated buildings worldwide (Roodman and Lenssen 1995).
Responsibility of ArchitectureDue to its role, volume, and impact, it is evident that architecture has a direct respon-sibility to the immediate (city) ecosystem. As Graham (Graham 2002) points out,every architectural artifact, regardless of its size—big or small (1) connects to theearth; (2) depends on nature for resources; (3) causes environmental change; and (4)affects both human and nonhuman life. Since part of the problem is architectural, soshould be the solution, such as designing based on sustainable and ecological princi-ples; developing and using advanced green technologies and materials; and promotingand demanding high-performance buildings. Some of these issues, such as ecologicaldesign have been around for decades. Others have been proposed and promoted, butsporadically rather than consistently.
Architecture’s main responsibility is not to pick and choose the “best” solution butto incorporate all options that might generate workable solutions. There is no singleformula of what and how much to use. Clearly, there is an urgent need of a new wayof thinking and designing. In order to fully address its responsibilities, architectureshould abandon old methods, technologies, and materials and push for a new para-digm shift. The design objectives should be based on sustainable, ecological, and per-formance criteria rather than trends and aesthetics; be environmentally consciousrather than market-driven; and be inherently resourceful rather than globally destruc-tive. Briefly described, the responsibility of green architecture includes:
■ Smaller buildings. Unlike Mc-Mansions, smaller buildings are economically feasi-ble, efficient, and require low maintenance. Because of their compact size, smaller
01-Attmann_Ch01_p001-026.qxd 10/22/09 4:40 PM Page 23

24 GREEN ARCHITECTURE: OVERVIEW
buildings use less material, need less energy, and produce less waste. Architectsshould focus on small, yet functional and ecologically sensitive buildings by con-serving space and preserving the environment.
■ Sustainable materials and technologies. Architects should focus on using durable,low-maintenance, recyclable, and economical materials and technologies. Constantbreakdowns, wear-and-tear, and replacement of materials and technologies willmake buildings unsustainable. Using abundant, local elements—if possible—withlittle to no transportation costs is highly preferable. Architects should also considerelements that are easily dismantled and reused or recycled at the end. They can besalvaged, refurbished, or remanufactured, including saving materials and technolo-gies from disposal and renovating, repairing, restoring, or generally improving theappearance, performance, quality, functionality, or value.
■ Ecological materials and technologies. Materials and technologies should consistof low-emission, nonpollutant elements with low manufacturing impacts.Ecological materials should facilitate a reduction in polluting emissions frombuilding maintenance and should not be made from toxic chemicals. Architectsshould focus on clean burning technologies by excluding the components such assubstances that deplete stratospheric ozone and associated with ecological damageand health risks, including mercury and halogenated compounds, and HCFCs(hydrochlorofluorocarbons). Additional ecological technologies such as storm-water and wastewater systems that reduce surface water and groundwater pollutionshould be incorporated.
■ Sustainable resources. Buildings should rely on sustainable resources, such asenergy and water, focusing on supplying their own gray water and power. Suchbuildings may operate entirely off the power grid, or they may be able to feedexcess energy back into the grid. Solar, thermal, and wind—if available—powersare the usual alternatives. Buildings should also consider the proximity to and fromwater resources, supplies, and existing waste management systems. Architectsshould also consider the climatic conditions for their favor and benefit from them,such as sun, wind, and water. Residential and daylight-needing buildings should notbe designed in sun-trapping/blocking areas (i.e., in between buildings, etc.). Thebuildings should be accessible to public transportation (and bicycle paths) to reduceprivate vehicle use, to save energy, and to reduce air pollution.
■ Sustainable environments. One of the main responsibilities of any architect is tocreate sustainable environments that are protective, healthy, habitable, and promotesocial and institutional networks. Buildings should provide protective environmentswhere the occupants feel safe and secure against the various elements such as naturalcauses, built environments, and people. Building should also provide healthy and habi-table environments for people; designed to maximize productivity by minimizingoperator fatigue and discomfort; and should be free from physical and psychologicaleffects of buildings such as sick building syndrome.
■ Resource ecology. By taking ecological issues into account, architects shoulddesign and construct buildings in the right places and in the right way, for thebenefit of both the occupants and the ecological resources. The reduction of the
01-Attmann_Ch01_p001-026.qxd 10/22/09 4:40 PM Page 24
RESPONSIBILITY OF ARCHITECTURE 25
natural resource consumption should be targeted right from the start, at the designstage. The calculation and control activities should focus on the building’s naturalresource use, such as water, energy, landscape, and waste management. Soil typeand groundwater conditions must be taken into consideration before the buildingis designed and constructed. The type and stability of soil should be taken seri-ously, not only because of the building damage but also potential problems to thesoil ecology such as erosion, pollution, sedimentation, and various forms of soildegradation.
■ Environmental ecology. One of the main responsibilities of architects is to respectthe ecology of the environment, and to design the buildings in a way not to pollutethe environment and harm the ecosystem. Faulty and poorly designed and/or installedbuilding infrastructure systems, such as inadequate gray water and sewage pipes,stormwater management, and drainage systems, can contribute to drainage, flood-ing, and soil and groundwater pollution. Architects should make sure to provideproper drainage systems which collect runoff from impervious surfaces (e.g., roofsand roads) to ensure that water is efficiently conveyed to waterways through pipenetworks. Designs should promote minimizing water usage and providing water-efficient landscaping. The materials, technologies, and the type of energy used inthe buildings should be selected from nonpollutant elements, such as alternativeenergy resources and low-VOC building products.
Architects should also implement global stewardship principles by acting locallyand thinking globally. Use local resources as much as possible by reducing theembodied energy of the building products, and by considering global ecologicalconsequences of their actions. Land selection, biodiversification, and building ori-entation should be integrated into the design before the building is constructed.Avoid changing the ecosystems for the sake of building landscape and/or orienta-tion, such as cutting off plants or creating artificial ecosystems, which might con-tribute to erosion and flooding. Instead, buildings should contribute to the environ-ment by absorbing sun rays and stabilizing the soil.
■ High-performance materials and technologies. The materials and technologiesused in buildings should be efficient, effective, and productive. The material effi-ciency can be achieved by using recycled elements with minimal waste or addingengineered components, such as engineered lumber and I-joists. Technological effi-ciency should apply to the entire building cycle, including water and energy effi-ciency. These elements should also be effective by producing desired results andproductive such as changing and storing the energy and water.
■ Resource performance. A building’s resource performance is determined by thecontribution to the resources of the location. Buildings should perform as eco-nomic, ecological, and environmental contributors by various different ways. Thelocation and function of the building should contribute to the economic viability inthe area by creating jobs, enhancing property values, and bringing other businessesinto the area. The material and technological elements of the building should alsobe used in a way to reduce the environmental impact of the building such as absorb-ing sun rays and CO2 emission from the atmosphere.
01-Attmann_Ch01_p001-026.qxd 10/22/09 4:40 PM Page 25

26 GREEN ARCHITECTURE: OVERVIEW
■ Environmental performance. Buildings should be physically, functionally, andsocially adaptable to the environment and perform according to environmentalchanges. Changes in climate, social patterns, or trends should not end the buildinglife cycle but give birth for different uses for the building. The functional and envi-ronmental quality of the building should also be considered as the main designobjective.
01-Attmann_Ch01_p001-026.qxd 10/22/09 4:40 PM Page 26