attenuation of ldha expression in cancer cells leads to redox-dependent alterations in cytoskeletal...
TRANSCRIPT

1
3
4
5
6
7 Q1
8
9
1 1
1213 14 15 16
1718 19 20 21 2223 24
2 5
Q2
4243
44
45
46
47
48
49
50
51
52
53
54
55
56
57
58
59
60
61
62
Cancer Letters xxx (2013) xxx–xxx
CAN 11438 No. of Pages 12, Model 5G
17 April 2013
Contents lists available at SciVerse ScienceDi rect
Cancer Letters
journal homepage: www.elsevier .com/locate /canlet
Attenuation of LDHA expression in cancer cells leads to redox-dependent alterations in cytoskeletal structure and cell migration
0304-3835/$ - see front matter � 2013 Published by Elsevier Ireland Ltd.http://dx.doi.org/10.1016/j.canlet.2013.03.034
⇑ Corresponding author. Address: Department of Biology, Biological & Geological Sciences Building, Western University, London, Ontario, Canada N6A 5B7. Tel.: +1 519 661 2111x81578; fax: +1 519 661 3935.
E-mail address: [email protected] (R.C. Cumming).
Please cite this article in press as: R. Arsene ault et al., Atten uation of LDHA expr ession in can cer cells leads to redox-dep endent alteratio ns in cytosstruct ure and cell migrati on, Can cer Lett. (2013), http ://dx.doi.org/10.1016/ j.canlet .2013.03.03 4
Robert Arseneault , Andrew Chien, Jordan T. Newington, Tim Rappon, Richard Harris, Robert C. Cumming ⇑The Department of Biology, Western University, London, Ontario, Canada N6A 5B7
a r t i c l e i n f o a b s t r a c t
26272829303132333435363738
Article history:Received 16 November 2012 Received in revised form 28 March 2013 Accepted 30 March 2013 Available online xxxx
Keywords:Warburg effect Lactate dehydrogenase ATropomyosin-3 Actin Cell motility Redox regulation
3940
Aerobic glycol ysis, the pref erential use of glycolysis even in the presence of oxygen to meet cellular metabolic demands, is a near universal feature of cancer. This unique type of metabolism is thought to protect cancer cells from damaging reactive oxyg en species (ROS) produced in the mitochon dria. Using the cancer cell line MDA-MB-435 it is shown that shRNA mediated knockdown of lactate dehydrogenase A (LDHA), a key mediator of aerobic glycol ysis, results in elevated mitochondrial ROS production and aconcomitant decrease in cell proliferation and motility. Redox-sensitive proteins affected by oxida tive stress associated with LDHA knockdown were identified by Redox 2D-PAGE and mass spectrometry. In particular, tropomyosin (Tm) isoforms Tm4, Tm5NM1 and Tm5NM5, proteins involved in cell migration and cytoskeletal dynamics, exhibited changes in disulfide bonding and co-localized with peri-nuclear actin aggregates in LDHA knockdown cells. In contrast, treatment with the thiol-base d antiox idant N-acetylcysteine promoted the relocalization of Tms to cortical actin microfilaments and partially rescued the migration defects associated with attenuated LDHA expression. These results suggest that aerobic glycolysis and reduced mitochondrial ROS produc tion create an environment conducive to cytoskeletal remodeling; key events linked to the high cell motility associated with cancer.
� 2013 Published by Elsevier Ireland Ltd.
41
63
64
65
66
67
68
69
70
71
72
73
74
75
76
77
78
79
80
81
82
83
1. Introductio n
During the 1920s Otto Warburg observed that highly prolifera- tive mouse ascites tumor cells relied heavily on glycolysis to produce over 50% of their cellular energy. In contrast, normal cells derive 90% of their energy needs from oxidative phosphorylatio n(OXPHOS) in the mitochondria, and only 10% from glycolysis [1].Moreover, this preference for glycolysis persists even when cancer are cultured in an abundan ce of oxygen [1]. Subsequent research determined that this phenomeno n, known as aerobic glycolysis or the Warburg effect, is found in almost all cancer cell types [2,3]. During aerobic glycolysis , glucose is metaboli zed to pyruvate ,which is then preferentially converted to lactate by lactate dehydrogen ase A (LDHA), rather than enter the tricarboxylic acid (TCA) cycle in the mitochond ria. Aerobic glycolysis is believed to initially arise as a result of a hypoxic tumor microenv ironment [3]. Exposure to hypoxia triggers stabilization and activation of the transcrip tion factor hypoxia-induc ible factor 1-alpha (HIF-1a)which induces expression of genes encoding glucose transporters and glycolyti c enzymes, including LDHA [4]. HIF-1 a also represses mitochondr ial respiration by inducing expression of pyruvate
84
85
86
87
dehydrogen ase kinase 1 (PDK1) which subsequent ly phospho ry- lates and inhibits pyruvate dehydrogenase (PDH), the rate-limiting enzyme that converts pyruvate to acetyl-CoA during the first step of the TCA cycle [5]. As a result, cancer cells convert pyruvate to lactate which is then shunted to the extracellul ar space.
Oddly, following neovasculari zation and re-oxygenat ion of the tumor, aerobic glycolysis persists as the primary form of metaboli sm within cancer cells [6]. These observations have long puzzled cancer biologists because glycolysis is far less efficientthan OXPHOS in producing ATP (2 versus 36 ATP per glucose molecule , respectively ). However, recent studies have shown that aerobic glycolysis confers both a growth and survival advantage to cancer cells. In particular , the high glycolytic rate associate dwith tumor cells provides biosynth etic intermediates, such as ribose-5- phosphate, NAPDH and 3-phosphog lycerate, which con- tribute to the duplication of the cell biomass and genome during each division [7]. In addition, by repressing mitochondrial respira- tion, cancer cells are less likely to produce ROS and are more resis- tant to mitochondr ial depolarizati on; two events tightly linked to induction of apoptosis [8].
ROS generation in mitochondr ia occurs when electrons leak from the electron transport chain and react with molecular oxygen to form the superoxide radical O��2 , which is quickly converted into H2O2 by superoxide dismutases. Low to intermediate levels of ROS have been shown to stimulate proliferation and cell survival,
keletal

88
89
90
91
92
93
94
95
96
97
98
99
100
101
102
103
104
105
106
107
108
109
110
111
112
113
114
115
116
117
118
119
120
121
122
123
124
125
126
127
128
129
130
131
132
133
134
135
136
137
138
139
140
141
142143 144 145 146
147
148149 150 151
152 153 154 155 156 157 158 159 160161 162
163
164165 166 167 168 169 170 171 172 173 174 175 176 177 178 179 180 181
182
183184 185 186 187 188 189 190
191
192193 194 195 196 197 198 199 200 201 202 203 204
205
206207 208 209 210 211 212 213 214 215
216
217218 219 220
2 R. Arseneault et al. / Cancer Letters xxx (2013) xxx–xxx
CAN 11438 No. of Pages 12, Model 5G
17 April 2013
induce expression of stress response genes, and promote angiogen- esis [9]. In contrast, high levels of cellular ROS can damage DNA,promote senescence, or initiate apoptosis. It has been suggested that cancer cells maintain an intermedi ate level of ROS so as to strike a balance between its opposing effects [9,10]. The activity of a number of proteins involved in cancer has been shown to be influenced by cellular ROS levels. For example the pro-apop totic protein cytochrome c has been shown to be activated by ROS in- duced oxidation, but is maintained in a reduced state in cancer cells [11]. Interestingl y, ROS are capable of both stimulating and inhibiting cell migration and invasion, in a concentr ation depen- dent manner [12,13].
The cellular redox status can control protein function by the oxidation of specific cysteine residues to form disulfide bonds [14]. Although disulfide bonding predominantl y occurs in the oxi- dizing environment of the endoplasmic reticulum, a small subset of redox-sensiti ve proteins possess cysteine residues that exist as thiolate anions (Cys-S�) in the cytosol are therefore highly vulner- able to oxidation by cytosolic ROS [15]. It is now widely recognized that reversible disulfide bonding occurs in the cytoplasm and nu- cleus and affects proteins with various functions including molec- ular chaperoning, signal transductio n, glycolysis, transcrip tion and cytoskeletal function [15]. However, the importance of protein disulfide bonding in a cancer context is poorly defined.
Recent studies have shown that attenuation of LDHA activity in cancer cells using either small interfering or short hairpin RNAs (shRNAs) resulted in a shift to oxidative phospho rylation and de- creased prolifera tion and invasion [16–18]. In addition, knockdown of LDHA expression in breast cancer cells induced oxidative stress and apoptosis in vitro and in vivo [18]. Cell death in LDHA knock-down cancer cells was linked to increased oxidative stress, as the thiol based antioxidant N-acetylcys teine (NAC) was able to protect these cells from toxicity associated with decreased LDHA expres-sion [17]. Collectively, these findings suggest that LDHA mediated inhibition of mitochondr ial respiration and enhanced glycolysis in cancer cells results in decreased ROS production and resistance to apoptosis. To date, no study has attempted to examine the effect of elevated LDHA expression and repressed mitochond rial respiration on intracellular redox-se nsitive proteins in cancer cells. Further- more, the precise mechanism by which aerobic glycolysis, and its associated alterations in cellular redox status, leads to enhanced metastatic potential in cancer cells has remained elusive.
Using a melanoma derived cancer cell line (MDA-MB-435) and shRNA technology, it is shown here that attenuated LDHA expres- sion results in decreased cell migration which is associated with increased mitochondrial ROS production, increased oxidation of tropomyosi n isoforms and altered actin dynamics. Moreover, the migration and cytoskeletal defects in LDHA knockdown cells can be partially rescued following treatment with the antioxidant NAC. This study provides a new mechanistic understa nding of po- tential redox effectors associate d with the Warburg effect in cancer cells.
2. Materials and methods
2.1. Cell lines
The MDA-MB-231, MDA-MB-435, MCF7, T47D, HS-578T human cancer cell lines were purchased from the American Type Culture Collection (Manassas, VA)and were cultured in Dulbecco’s Modified Eagles Medium (DMEM) supplemented with 10% fetal bovine serum (FBS) and 1% penicillin/streptomycin and incubated at 37 �C in a humidified CO 2 incubator.
2.2. shRNA silencing of LDHA expression and generation of clonal cell lines
MDA-MB-435 cells were transfected with pRS shRNA expression vectors con- taining HuSH 29-mer cassettes (Origene, Rockville MD) under the control of a U6 promoter. This vector also contains the puromycin-N-acetyl transferase gene under the control of an SV40 early promoter. Two cassettes specifically targeting ldha
Please cite this article in press as: R. Arseneault et al., Atten uation of LDHA expstructure and cell migrati on, Can cer Le tt. (2013), http ://dx.doi.org/10.1016/ j.ca
(69-GTTCACAAGCAGGTGGTT-GAGAGTGCTTA and 71-ATTGGAAGTGGTTG-CAATCT GGATTCAGC) as well as a scrambled negative control (with a cassette that does not target any endogenous mRNA transcripts) were chosen to create clonally de- rived cell lines. Transfection was accomplished by seeding 5 � 105 cells on 60 mmdishes and, after 24 h, the media was aspirated and the cultures were incubated for 5 h in 1 mL OptiMEM (Invitrogen, Eugene OR) with 5 lg plasmid and 5 lL Lipo- fectamine 2000 transfection reagent (Invitrogen). Following selection in puromycin (1 lg/mL), multiple clones were isolated, expanded, and screened for the degree of LDHA silencing. One control cell line (435-SCR-2) and three LDHA knockdown cell lines (LDHA-69-3, LDHA-71-5, and LDHA-71-7) were used for subsequent experiments.
2.3. SDS PAGE and immunoblot analysis
For conventional SDS PAGE, 5 � 105 cells were seeded in 60 mm dishes and after 24 h were rinsed twice with cold phosphate buffered saline (PBS) and har- vested with a sodium-dodecyl sulfate (SDS) extraction buffer [50 mM Tris pH 7.5,2% SDS, 1 mM phenylmethansulfonlyfluoride (PMSF)]. Protein concentrations of the lysates were quantified using the colorimetric DC Protein Assay Kit (BioRad,Hercules CA). Protein extracts (20 lg) were reduced in sample buffer containing 100 mM dithiothreitol (DTT) and 2% beta mercaptoethanol (BME), boiled and resolved by 12% SDS PAGE using the Mini-PROTEAN electrophoresis apparatus (BioRad). Gels were then electroblotted onto polyvinylidene fluoride (PVDF) mem- brane (Millipore, Bedford, MA), and blocked with 3% bovine serum albumin (BSA)and 1% milk in tris-buffered saline with Tween-20 (TBST). Membranes were then probed with the following antibodies: polyclonal rabbit anti-LDHA (Cell Signaling,Danvers MA), anti-GFP (Sigma, St. Louis MO), polyclonal rabbit anti-Tm5 (Cat No.GTX109592, GeneTex, Irvine CA), monoclonal mouse anti-actin (Cell Signaling),and anti-GAPDH (Imgenex, San Diego CA). Following incubation with an appropri- ate HRP-conjugated secondary antibody, blots were developed using Pierce ECL Western blotting reagents (ThermoScientific, Waltham MA), and protein signal was detected using a ChemiDoc digital imaging system (BioRad).
2.4. Cell proliferation assay
Cell proliferation was measured in the LDHA knockdown and control cell lines using a trypan blue dye exclusion test. For each cell line, 1 � 104 cells were seeded per well, in triplicate, in 12 well plates. Cells were incubated under standard culture conditions, and were collected for counting at 24, 72, 120, and 168 h. To detach the cells, 100 lL of TrypLE (Invitrogen) was added to each well, incubated for 5 min at 37 �C, and then mixed and collected with 100 lL of Trypan Blue. A sample from each well was loaded into a haemocytometer, and viable cells were manually counted.
2.5. Transwell migration assay
To measure the degree of cell migration in LDHA knockdown and control cell lines, a transwell migration assay was employed. In serum free DMEM, 5 � 104 cellswere seeded in cell culture inserts with 8 lm membrane pores (Becton Dickinson,Franklin NJ). The inserts were partially immersed in 12 well plates containing 0.5 mL of DMEM + 10% FBS in each well. Cells were allowed to migrate through the membrane for 24 h, after which the media from both the insert and well was aspirated. Cells on the bottom side were then fixed in methanol at room tempera- ture for 30 min, rinsed twice with PBS and stained with 0.5 lg/mL DAPI (Sigma, St.Louis, MO) for 5 min. Membranes were then cut and mounted on glass slides with ProLong Gold antifade reagent (Invitrogen). Images from three random areas were taken from each membrane using a fluorescent microscope (Zeiss AxioObserver,20 � objective) equipped with a Q Imaging camera. Nuclei from each field were used as a measure of total migrated cells.
2.6. Wound healing assay
A second test of cell migration a wound healing assay (otherwise known as ascratch test) was employed. For each of the LDHA knockdown and control cell lines,3 � 105 cells were seeded per well in a six well plate. Cells were allowed to grow until they reach 80% confluency, at which point a micropipette tip was used to gently scratch a line of cells off of the plate. The plate was then incubated in the growth chamber (Live Cells Instrument, Seoul Korea) mounted on the stage of a Lei- ca DMI 6000B microscope (Leica Microsystems, Wetzlar Germany). Cells were incu- bated for 32 h, with images captured from fixed fields of view every 40 min using adigital CCD camera (Hamamatsu, Bridgewater NJ). The degree of migration of cells into the scratch site was measured using Image J software.
2.7. Mitochondrial ROS analysis
To measure the degree of mitochondrial ROS production, LDHA knockdown and control cell lines were seeded in triplicate, at 3.0 � 105 cells/well in six well plates.After 24 h, media was replaced with phenol red free DMEM with 200 nM MitoTrac- ker Red CM-H2XROS (Invitrogen) and 10 lg/mL Hoescht stain and incubated for
ress ion in cancer cells leads to redox-dep endent alteration s in cytoskeletal nlet .2013.03.03 4

221 222223 224 225
226
227228 229 230 231 232 233 234 235 236 237 238 239
240
241242 243 244 245 246 247 248 249 250
251
252253 254 255 256 257 258 259 260 261 262 263 264 265 266 267 268
269
270271 272 273 274 275 276 277 278 279 280 281 282 283 284 285
286
287288 289
290 291 292 293 294 295
Fig. 1. shRNA-mediated attenuation of elevated LDHA expression in metastatic cancer cells. (A) Western blot analysis of lysates from various cancer cell lines revealed that LDHA expression was elevated in the tumorigenic/metastatic cell lines (MDA-MB-231, MDA-MB-435 and HS-578) compared to non-tumorigenic/ non-metastatic (MCF 10a) and tumorigenic/non-metastatic cell lines (MCF-7,T47D). (B) Clonal cell lines derived from MDA-MB-435 cells stably expressing LDHA shRNA 69 or 71 (LDHA-69-3, LDHA-71-5 and LDHA-71-7) revealed diminished LDHA expression compared to the same cell line stably expressing the control non-specific scrambled shRNA (435-SCR-2). Densitometric analysis revealed that LDHA shRNAs significantly decreased LDHA expression by 50% or greater compared to the SCR-2 control (⁄P < 0.05) (C) Extracellular lactate levels were significantly diminished in clonal MDA-MB-435 lines expressing LDHA-shRNA compared to the scrambled control shRNA expressing line (⁄P < 0.05; ⁄⁄P < 0.01). All blots were probed with a polyclonal rabbit anti-LDHA antibody, and either amonoclonal mouse anti-actin or anti-GAPDH antibody as a loading control.
R. Arseneault et al. / Cancer Letters xxx (2013) xxx–xxx 3
CAN 11438 No. of Pages 12, Model 5G
17 April 2013
20 min. After incubation, cells were then washed twice with phenol red free DMEM and visualized in phenol red free media with a fluorescent microscope (Zeiss Axio- Observer, 20 � objective). Two images from randomly selected regions were taken from each well using a Q Imaging camera and Q Capture Pro Software. The fluores-cent intensity of each image was quantified using Image J software.
2.8. Preparation of samples for Redox 2D SDS PAGE and non-reducing 1D SDS PAGE
To obtain protein extracts for analysis by Redox 2D SDS PAGE as well as reduc- ing/non-reducing 1D SDS PAGE, 8 � 105 cells (either SCR-2 or LDHA-71-7 cells)were plated in triplicate on 10 cm dishes in standard culture conditions. Following 48 h, the cells were rinsed once in cold PBS, followed by a wash in PBS containing 40 mM iodoacetamide (IA) for 3 min to prevent post-lysis oxidation of cysteine res- idues. Cells were harvested in Triton X-100 extraction buffer (50 mM Tris pH 7.5,40 mM IA, 1 mM PMSF, 1% Triton X-100), rocked on ice for 10 min, and centrifuged at 15,000 g for 10 min. After centrifugation, the supernatant was transferred to sep- arate tubes and frozen at �20 �C. The pellet, which is enriched for F-actin, was washed 1� in Triton X-100 extraction buffer, centrifuged again at 15,000 g andsolubilized in SDS extraction buffer. Protein concentration of the supernatant both TritonX and SDS protein extracts were quantified using the colorimetric BioRad DC Protein Assay Kit (BioRad).
2.9. Redox 2D SDS PAGE
Protein samples (200 lg of Triton X-100 lysate) were resolved in the firstdimension through a 1.5 mm thick, 12% acrylamide gel for 16 h at constant current.From this first dimension gel, 0.5 cm wide gel strips were cut soaked in SDS sample buffer (0.5 M Tris-HCl, 5% glycerol and 2% SDS) containing 100 mM DTT for 20 min at room temperature. Following a rinse in SDS running buffer, gel strips were soaked in SDS sample buffer containing 40 mM IA for 10 min at room temperature.After in-gel reduction and alkylation, gel strips were laid horizontally onto a second 1.5 mm, 12% acrylamide gel and resolved for 16 h at constant current, after which they were fixed overnight in 50% methanol. Gels were silver stained as described previously [15].
2.10. Identification of redox sensitive proteins
Protein spots were picked with an automated spot picker and in-gel digested using a MassPREP automated digester station (PerkinElmer, Waltham MA). Gel pieces were silver de-stained using a 50 mM sodium thiosulfate and 15 mM potas- sium ferricyanide solution, followed by protein reduction using 10 mM DTT, alkyl- ation using 55 mM IA, and tryptic digestion. Peptide extraction was achieved using a 1% formic acid, 2% acetonitrile solution, after which peptides were lyophilized. Pep- tide samples were re-dissolved in a 10% acetonitrile, 0.1% trifluoroacetic (TFA) acid solution, and then mixed 1:1 (v/v) with MALDI matrix (a-cyano-4-hydroxycinnamicacid (CHCA), prepared as 5 mg/mL in 6 mM ammonium phosphate monobasic, 50%acetonitrile, 0.1% TFA). These protein samples were then identified using a 4700 Pro- teomics Analyzer, MALDI TOF (Applied Biosystems, Foster City, CA) equipped with a355 nm Nd:YAG laser. Data acquisition and processing were accomplished using the 4000 Series Explorer and Data Explorer respectively (both from Applied Biosystems).Reflectron positive (and negative) ion mode was used and the instrument was cali- brated at 50 ppm mass tolerance, with each mass spectrum collected as a sum of 1000 shots. Identities for a number of the isolated disulfide linked proteins were found through both SwissProt and NCBI human protein database searches.
2.11. Immunofluorescent staining
In a 12 well plate, 1 � 105 cells were seeded per well on coverslips pre-treated with 1% gelatin and grown over night in standard culture conditions. Cells were rinsed twice with 37 �C PBS, after which they were fixed in 4% Paraformaldehyde in PBS for 10 min. Cells were washed in cold PBS, permeabilized using PBST (0.1%Triton X-100 in PBS) for 5 min then blocked in 1% BSA in PBS for 30 min. Coverslips were then stained for 20 min with 1 lg/mL Phalloidin–Tetramethylrhodamine Bisothiocyanate (Phalloidin-TMRB; Sigma, St. Louis, MO) in 1% BSA in PBS. Following several washes in PBST, coverslips were then incubated with an anti-Tm5 antibody (GeneTex, Irvine, CA), diluted 1/400 in PBS containing 1% BSA, overnight at 4 �C in ahumidity chamber. Coverslips were then washed twice in PBST and incubated with a goat–anti-rabbit-FITC secondary antibody (Jackson ImmunoResearch, West Grove,PA) for 45 min. Afterward, coverslips were incubated in 1 lg/mL DAPI in PBS for 5 min to counterstain nuclei, rinsed 2� in cold PBS, and mounted on slides using Prolong Gold Antifade mounting media. Immunostained cells were then visualized with a Leica DMI 6000B microscope using a 63 � oil immersion objective lens with aHamamatsu Digital CCD camera (Hamamatsu, Bridgewater, NJ).
2.12. Transfection and expression analysis of YFP-Tm isoforms
The YFP tagged Tm isoforms YFP-Tm4, YFP-Tm5NM1 and YFP-Tm5NM5 were generously provided by Dr. Peter Gunning (University of New South Wales, Sydney,Australia) and have been described elsewhere [19]. Approximately 6 � 105 cells
Please cite this article in press as: R. Arsene ault et al., Atten uation of LDHA expstruct ure and cell migrati on, Can cer Lett. (2013), http ://dx.doi.org/10.1016/ j.ca
were seeded in 60 mm dishes and transfected with 5 lg of YFP-Tm plasmid using Lipofectamine 2000. Transfected cells where harvested 24 h post-transfection and analyzed by either non-reducing or reducing 1D SDS-PAGE and immunoblot analy- sis as described above. In addition, transfected cells were visualized 24 h post- transfection by both fluorescence and integrated Hoffman modulation contrast microscopy using a Leica DMI 6000B microscope.
r ession in can cer cells leads to redox-dep endent alteratio ns in cytoskeletal nlet .2013.03.03 4

296
297
298
299
300
301
302
303
304
305
306
307
308
309
310
311
312
313
314
315
316
317
318
319
320
321
322
323
324
325
326
327
328
329
330
331
332
333
334
335
336
337
338
339
340
341
342
343
344
345
346
347
348
349
350
351
352
353
354
355
356
357
358
359
360
361
362
363
364
365
366
367
368
369
370
371
372
373
374
375
376
377
378
379
380
381
382
383
384
385
386
387
388
Fig. 2. Cell proliferation is slowed in MDA-MB-435 cells following knockdown of LDHA expression. Trypan blue exclusion tests revealed that there was significantlyless proliferation in the three LDHA knockdown cell lines after 7 days in culture compared to the control cell line. (⁄P < 0.01, N = 3, ANOVA, Tukey’s HSD Test,). Data points represent mean number of viable cells ± SD.
4 R. Arseneault et al. / Cancer Letters xxx (2013) xxx–xxx
CAN 11438 No. of Pages 12, Model 5G
17 April 2013
3. Results
3.1. LDHA expression in cancer cell lines
Aerobic glycolysis has strongly been linked to cancer progres- sion. As such, it was of interest to determine if expression of LDHA,a modulator of aerobic glycolysis, was altered in cancer cell lines with various degrees of aggressiven ess (i.e. tumorigenic and meta- static when transplante d into immuno-co mpromised mice). Anumber of cancer cell lines with non-tumor igenic (MCF 10a),tumorigenic /non-metastat ic (MCF 7, T47D), and tumorigenic /met- astatic (Hs-578T, MDA-MB-23 1, MDA-MB -435) phenotypes were screened for LDHA expression by Western blot analysis using an LDHA-speci fic antibody (Fig. 1A). Modest LDHA expression was ob- served in MCF 10a, MCF-7, and T47D cells, intermediate expression was observed in Hs-578T cells, and elevated expression was ob- served in MDA-MB-231 and MDA-MB -435 cells, suggesting that LDHA expression correlates with the metastatic potential of the cell line.
3.2. Generation of LDHA knockdown cell lines
Since LDHA expression roughly correlate d with increased meta- static potential in the screened cell lines, it was important to deter- mine if cancer cell prolifera tion and migration could be altered by silencing LDHA expression. To accomplis h this, short hairpin RNAs (shRNAs) that specifically target LDHA (shRNAs 69 and 71) were stably transfected in MDA-MB-231 and MDA-MB-435 cells and screened for their ability to silence LDHA expression. A number of clonally derived MDA-MB -231 and MDA-MB-43 5 cell lines with attenuated LDHA expression were generated. Although several MDA-MB-23 1 clonal lines were made, the LDHA knock down phe- notype was not stable due to genomic instability inherent to this cell line [20]. However, three MBA-MD -435 LDHA knockdow n lines (LDHA-69-3, LDHA-71 -5, and LDHA-71-7) were generated which exhibited stably decreased LDHA levels in comparis on to a clonal line stably expressing a non-spec ific scrambled shRNA (SCR-2)(Fig. 1B). All three LDHA knockdow n lines exhibited significantlydecreased extracellular lactate levels, a product of LDHA enzymati cactivity, compared to the SCR control line (Fig. 1C).
3.3. Attenuated LDHA expression leads to decreased cell proliferation and migration
Two easily measureable indicators of cancer cell aggressiven ess are cell prolifera tion and cell migration. Trypan blue dye exclusion revealed that the MDA-MB -435 LDHA knockdown lines grew con- siderably slower than the SCR-2 control line (Fig. 2). Similar results were obtained using an MTT assay (data not shown). In addition,clonal MDA-MB -435 cells with knocked down expression of LDHAexhibited dramatically decrease d migration in both transwell migration and wound healing assays (Fig. 3). These findings dem- onstrate that LDHA expression plays an important role in the aggressiven ess of cancer cells.
3.4. LDHA silencing induces higher mitochondri al ROS productio n
Because cells with attenuated LDHA expression would no long- er be able to rely on aerobic glycolysis to exclusively meet their en- ergy needs, it was of interest to determine if these cells had increased mitochondrial activity. A by-product of oxidative phosphoryla tion is mitochondrial ROS production. Live cultures from the control and knockdown cell lines were stained with Mito- Tracker Red CMX-ROS, a dye that is taken up by actively respiring mitochondr ia and fluoresces when oxidized by ROS. Compared to
Please cite this article in press as: R. Arseneault et al., Atten uation of LDHA expstructure and cell migrati on, Can cer Le tt. (2013), http ://dx.doi.org/10.1016/ j.ca
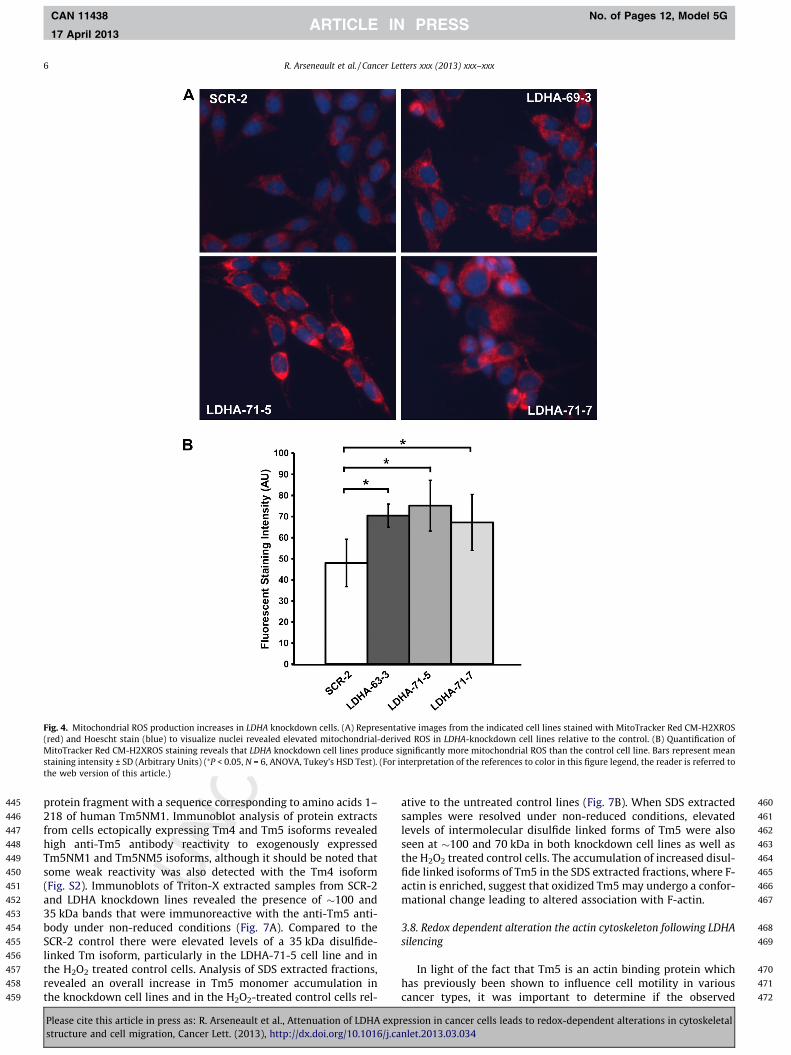
the SCR-2 control line, each of the LDHA knockdown lines had sig- nificantly more intense MitoTracker Red CMX-ROS staining (P < 0.05, Fig. 4). This data suggests that LDHA silencing redirects cellular metabolism and induces higher mitochondrial ROS pro- duction in MDA-MB-43 5 cells.
3.5. LDHA silencing leads to changes in the disulfide proteome of MDA- MB-435 cells
Reversible protein disulfide bond formation has been shown to be involved in regulating various intracellular processes and is strongly influenced by the redox state of the cell [21]. Considering that attenuated LDHA expression stimulated increased mitochon- drial ROS production, it was of interest to determine if protein disulfide bonding was affected in these cells. To separate disulfidebonded proteins (DSBPs), Triton-X extracted protein samples were resolved by Redox 2D SDS-PAG E [15]. The resulting silver stained gels revealed a prominent diagonal line containing proteins that did not undergo disulfide bonding (Fig. 5). However, spots found to the left or right of this line consisted of intramolecu lar and inter- molecula r disulfide bonded proteins respectively. Gels were com- pared to determine if the intensity of any spot was altered in the LDHA-71 -7 knockdown cell line compared to the control SCR-2 cell line. Consistent changes in disulfide bonding were seen in three protein spots. Specifically, spots 1 and 2 were more intense, while spot 3 was less intense in the LHDA knockdown cell line compare dto the control. Protein spots that showed consistent changes in intensity were excised from the 2D Redox gels and identified by matrix-a ssisted laser desorption/ioni zation time-of-flight (MALDI-TOF) mass spectrometry . The identified protein spots revealed that attenuati on of LDHA expression and the concomitant increase in mitochond rial ROS production induced changes in disulfide-linked proteins that are involved in antioxidant defence (Peroxiredoxin 1)and in actin dynamics (Tropomyosins and Moesin) (Table 1).
3.6. Silencing of LDHA leads to increased disulfide bonding of ectopically expressed non-muscle Tropomyo sin isoforms
Interestingl y, spot 2 consisted of a mixture of various Tropomy- osin (Tm) isoforms including Tm4, Tm5NM1 and Tm5NM5.
ress ion in cancer cells leads to redox-dep endent alteration s in cytoskeletal nlet .2013.03.03 4

389
390
391
392
393
394
395
396
397
398
399
400
401
402
403
404
405
406
407
408
409
410
411
412
413
414
415
416
417
418
419
420
421
422
423
424
425
426
427
428
429
430
431
432
433
434
435
436
437
438
439
440
441
442
443
444
Fig. 3. LDHA knockdown decreases cell migration (A) A transwell migration assay revealed that all three LDHA knockdown cell lines displayed significantly reduced migration compared to the control cell line after 24 h (⁄P < 0.01, N = 3, ANOVA, Tukey’s HSD Test,). (B) Representative images of DAPI stained nuclei of migrated cells from both the control cell line and one LDHA knockdown cell line are shown. (C) A wound healing assay revealed that significantly fewer LDHA knockdown cells had migrated into the scratch compared to the control cell line after 48 h, (⁄P < 0.05, N = 3, students t-Test,). Bars represent mean change in scratch width (lm) ± SD after 48 h. (D) Representative images taken at both 0 and 32 h following scratch formation for both the control and LDHA knockdown cell line are shown.
R. Arseneault et al. / Cancer Letters xxx (2013) xxx–xxx 5
CAN 11438 No. of Pages 12, Model 5G
17 April 2013
Non-muscle Tm isoforms bind to and stabilize filamentous actin and have been implicated in cell motility, adhesion and cytokinesis [22]. In mammals , 4 genes encode more than 40 different Tm iso- forms; with the diversity of isoforms arising primarily from alter- native splicing [22]. The tropomyosin-3 gene encodes at least 9Tm isoforms, with Tm5NM1 as the most abundantly expressed iso- form found in most cancer cells and contains 4 cysteine residues per polypept ide chain [23]. To determine the propensi ty of the dif- ferent Tm isoforms identified in the proteomic screen to undergo disulfide bonding, YFP-Tm fusion proteins were transiently ex- pressed in MDA-MB -435 cells followed by immunoblo t analysis of cell extracts using an anti-GFP antibody (which cross-reacts with YFP). Proteins that form intermolecular disulfide bonds exhi- bit slower migration, whereas proteins forming intramolecu lar disulfide bonds exhibit faster migration following separation by nonreducing SDS-PAGE compare d with the same proteins resolved under reducing conditions [15]. As expected, all three YFP-tagged Tm isoforms appeared as a 55 kDa band under reducing conditions (Fig. 6A). However, under non-reducin g conditions, all YFP-tagged Tm isoforms exhibited faster electrophor etic mobility and ap- peared as a 44 kDa band; likely due to the formation of an intramo- lecular disulfide bond. In addition, YFP-Tm5NM1 and YFP- Tm5NM5 isoforms exhibited intermolecular disulfide bonding resulting in the appearance of a �120 kDa band that was not apparent in cell extracts from YFP-Tm4 expressing cells.
Because Tms bind to filamentous actin (F-actin), it was of inter- est to examine the redox state of Tms in cell lysates extracted un- der conditions which enrich for F-Actin. Cells were therefore firsttreated with Triton-X, a non-ionic detergent that primarily extracts
Please cite this article in press as: R. Arsene ault et al., Atten uation of LDHA expstruct ure and cell migrati on, Can cer Lett. (2013), http ://dx.doi.org/10.1016/ j.ca
monomer ic G-actin, followed by centrifugation and subsequent extractio n of pelleted proteins, which include F-actin, using the io- nic detergent SDS. Interestingl y, the expression of YFP-Tm5NM1 and YFP-Tm5N M5 isoforms in LDHA-71-5 knockdow n cells re- sulted in the appearance of a �250 KDa disulfide linked form of these proteins that was not apparent in the SCR-2 control cell line (Fig. 6B). In addition, higher levels of F-actin were extracted in the LDHA-71 -5 knockdown cells, particularly in YFP-Tm5N M1 and YFP-Tm5NM5 expressing cells when compare d to the SCR-2 con- trol cells expressing the same Tm isoforms. Fluorescence micros- copy revealed that all YFP-Tm isoforms exhibited a widespre ad cytoplasm ic distribution when expresse d in the control SCR-2 cell line (Fig. S1 ). In contrast, expression of YFP-Tm5NM1 and YFP- Tm5NM5 in the LDHA-71-5 knockdow n cell resulted in the forma- tion of cytoplasm ic aggregate-li ke structures that were not ob- served in the SCR-2 cell line expressing the same isoforms . These findings suggest that ectopically expresse d Tm5NM1 and Tm5NM5 isoforms undergo increased disulfide bonding and altered intracel- lular distribution in cancer cells with attenuated LDHA expression.
3.7. Altered disulfide bonding of endogenous Tm5 isoforms in MDA- MB-435 cells with attenuated LDHA expression
It was next of interest to determine if endogenous Tm5 isoforms undergo altered disulfide bond formation following LDHAknockdow n. Tm isoforms share a high degree of sequence similar- ity and multiple isoforms can be recognized by the same antibody [23]. We therefore examine d the cross reactivity of a commercially available antibody that was generated against a recombinant
r ession in can cer cells leads to redox-dep endent alteratio ns in cytoskeletal nlet .2013.03.03 4
445
446
447
448
449
450
451
452
453
454
455
456
457
458
459
460
461
462
463
464
465
466
467
468
469
470
471
472
Fig. 4. Mitochondrial ROS production increases in LDHA knockdown cells. (A) Representative images from the indicated cell lines stained with MitoTracker Red CM-H2XROS (red) and Hoescht stain (blue) to visualize nuclei revealed elevated mitochondrial-derived ROS in LDHA-knockdown cell lines relative to the control. (B) Quantification of MitoTracker Red CM-H2XROS staining reveals that LDHA knockdown cell lines produce significantly more mitochondrial ROS than the control cell line. Bars represent mean staining intensity ± SD (Arbitrary Units) (⁄P < 0.05, N = 6, ANOVA, Tukey’s HSD Test). (For interpretation of the references to color in this figure legend, the reader is referred to the web version of this article.)
6 R. Arseneault et al. / Cancer Letters xxx (2013) xxx–xxx
CAN 11438 No. of Pages 12, Model 5G
17 April 2013
protein fragment with a sequence correspondi ng to amino acids 1–218 of human Tm5NM1. Immunoblot analysis of protein extracts from cells ectopical ly expressing Tm4 and Tm5 isoforms revealed high anti-Tm5 antibody reactivity to exogenou sly expressed Tm5NM1 and Tm5NM5 isoforms , although it should be noted that some weak reactivity was also detected with the Tm4 isoform (Fig. S2 ). Immunoblots of Triton-X extracted samples from SCR-2 and LDHA knockdow n lines revealed the presence of �100 and 35 kDa bands that were immunoreactiv e with the anti-Tm5 anti- body under non-redu ced conditions (Fig. 7A). Compared to the SCR-2 control there were elevated levels of a 35 kDa disulfide-linked Tm isoform, particularly in the LDHA-71-5 cell line and in the H2O2 treated control cells. Analysis of SDS extracted fractions,revealed an overall increase in Tm5 monomer accumulation in the knockdown cell lines and in the H2O2-treated control cells rel-
Please cite this article in press as: R. Arseneault et al., Atten uation of LDHA expstructure and cell migrati on, Can cer Le tt. (2013), http ://dx.doi.org/10.1016/ j.ca
ative to the untreated control lines (Fig. 7B). When SDS extracted samples were resolved under non-reduced conditions, elevated levels of intermolecu lar disulfide linked forms of Tm5 were also seen at �100 and 70 kDa in both knockdown cell lines as well as the H2O2 treated control cells. The accumulation of increased disul- fide linked isoforms of Tm5 in the SDS extracted fractions, where F- actin is enriched, suggest that oxidized Tm5 may undergo a confor- mational change leading to altered association with F-actin.
3.8. Redox dependent alteration the actin cytoskeleton following LDHA silencing
In light of the fact that Tm5 is an actin binding protein which has previously been shown to influence cell motility in various cancer types, it was important to determine if the observed
ress ion in cancer cells leads to redox-dep endent alteration s in cytoskeletal nlet .2013.03.03 4

473
474
475
476
477
478
479
480
481
482
483
484
485
486
487
488
489
490
491
492
493
494
495
496
497
498
499
500
501
502
503
504
505
506
507
508
509
510
511
512
513
514
515
516
517
518
519
520
521
522
523
524
525
526
527
528
529
530
531
532
533
534
Fig. 5. Disulfide bonding of intracellular proteins is altered in LDHA knockdown cells. Whole cell lysates resolved by Redox 2D SDS PAGE from both the MDA-MB-435 control cell line (SCR) and one LDHA knockdown cell line (71-7). Samples were resolved under non-reducing and reducing conditions in the first and second dimensions respectively.Silver staining of the resulting gels revealed a strong diagonal band of non-disulfide linked proteins, as well as spots above and below the band containing disulfide linked proteins. Three proteins that displayed reproducible alterations in disulfide bonding following LDHA silencing (Spots 1-3) were extracted from the gel and subsequently identified by MALDI-TOF mass spectrometry, see Table 1 for identities.
R. Arseneault et al. / Cancer Letters xxx (2013) xxx–xxx 7
CAN 11438 No. of Pages 12, Model 5G
17 April 2013
changes in Tm5 disulfide bonding coincided with changes in the actin cytoskeleton [24]. Cells from the control line and all three LDHA knockdown lines were stained using the anti-Tm5 antibody in combination with TRITC conjugated phalloidin, a molecule that binds F-actin. Staining revealed a number of qualitative changes in actin organizati on between the knockdow n and the control lines.The SCR-2 control line exhibited typically bipolar shaped cells con- taining long straight actin filaments which aligned in a parallel manner and partially co-localized with Tm5 (Fig. 8A). In contrast,the LDHA knockdown cells were often more rounded and exhibited an accumulation of perinuclear aggregate structures contacting both F-actin and Tm5 (Fig. 8C). Interestingl y, treatment of the LDHA knockdown line LDHA-71-5 with the antioxidant N-acetyl- cysteine (NAC) promoted a redistribution of Tm5 throughout the cytoplasm and some co-localizat ion with F-actin in cortical fila-ments (Fig. 8D), but had no effect on Tm5 or F-actin localization in the SCR-2 control line (Fig. 8B). Similar results were obtained in the other LDHA knockdown cell lines (data not shown). These findings indicate that treatment of LDHA knockdow n cells with NAC can affect the redox status of the cell and allow the redistribu- tion of Tm5 away from the nucleus where it can associate with cor- tical filaments and stress fibers.
535
536
537
538
539
540
541
542
543
544
545
546
547
548
549
550
551
552
553
554
555
556
3.9. NAC can partially rescue the migration defects in LDHA knockdown cell lines
The observation that NAC can promote the redistribution of ac- tin and Tm5 towards cortical microfilaments in LDHA knockdow ncells suggested that oxidation of Tm5 may interfere with its ability to promote actin remodeli ng, a key process involved in cell migra- tion. It was therefore asked if NAC can also restore the migration defects in LDHA knockdown cells. Using a transwell migration as- say, treatment of the LDHA-71 -5 knockdown line with NAC re- sulted in a concentration dependent increase in migration (Fig. 9A), although the degree of migration did not reach that of the SCR-2 control cell line. In addition, migration of the LDHA- 71-5 knockdown line, as assessed by the wound healing assay, re- vealed that NAC treatment also partially reversed the migration defect associated with attenuated LDHA expression (Fig. 9C and Dand Supplemental Movie 1). Collectiv ely, these findings indicate that silencing of LDHA expression in MDA-MB -435 cells leads to elevated mitochondr ial ROS, oxidation of TPM-3, compromise d ac- tin remodeling and decrease d cell motility.
Please cite this article in press as: R. Arsene ault et al., Atten uation of LDHA expstruct ure and cell migrati on, Can cer Lett. (2013), http ://dx.doi.org/10.1016/ j.ca
4. Discussion
Aerobic glycolysis is a near universal feature of cancer progres- sion. The enzyme LDHA is essential to glycolysis , as it regenerates NAD+ by reducing pyruvate to lactic acid. Elevated glycolysis is also an efficient process for making precursors for both DNA and lipid synthesis ; two features critical for rapid cell growth [25]. In this study it was demonstrated that LDHA knockdow n significantlyslows cell prolifera tion in the melanoma cell line MDA-MB-43 5.Similar results have been found using other cancer cell lines both in vitro and in vivo , underscoring the importance of both LDHA and aerobic glycolysis to cancer cell growth [16,18,26], As cancer cells stringently limit oxidative phosphorylatio n, the reduction of pyruvate to lactic acid by LDHA is necessary for the regeneration of NAD + for use in subsequent rounds of glycolysis , and in turn for ATP production. Cancer cells with attenuated LDHA expression will thus have less energy available for cell growth and division.While several studies have examined the effects of LDHA knock- down on cancer proliferation in the past, the mechanis m by which elevated LDHA expression confers a metastati c advantage to cancer cells is poorly defined.
In this study, LDHA knockdow n in MDA-MB -435 cells led to the reduction of cell migration as measured by transwell migration and wound healing assays. Aerobic glycolysis and subsequent lac- tic acid production can lead to acidification of the tumor and perit- umoral environment, a condition that favors cell invasion [3].While previous studies have found an association between tumor pH and invasion in vivo , the specific contribution of LDHA activity to cell migration is unknown [27]. Our findings of decreased cell migration suggest that aerobic glycolysis may contribute specifi-cally to the mechanisms controlling cell migration, as opposed to invasion which could be attributed to broad pH changes in the tu- mor environm ent.
The observed increase in mitochondrial ROS production as aconseque nce of LDHA silencing suggests that mitochondr ial activ- ity increases in response to decreased glycolysis. While this is not a direct measurement of mitochondr ial activity, attenuated LDHA expression has previously been shown to coincide with in- creased ROS production and oxygen consump tion in human B-lym- phoid cells [17]. As mitochondrial ROS is produced by leakage of electrons from the ETC of actively respiring mitochondr ia, it is highly likely that the observed increases in mitochond rial ROS in the LDHA knockdown lines are related to increased mitochondrial respiration. Increased ROS production can trigger signaling in the
r ession in can cer cells leads to redox-dep endent alteratio ns in cytoskeletal nlet .2013.03.03 4

557
558
559
560
561
562
563
564
565
566
567
568
569
570
571
572
573
574
575
576
577
578
579
580
581
582
583
584
Table 1Identification of DSBPs altered in MBA MB 435 cells with attenua ted LDHA expression by MALDI-TOF Mass Spect rometry. Disulfide linked proteins that were altered in response to LDHA knockdown as determined by Redox 2D SDS PAGE were excised, in-gel digested with trypsin, and identified by MALDI-TOF. MOWSE proba bility score was calculated and expressed as �10 log P (probability). The relative change in disulfide bonding, compared to the SCR control line, is indicated.
Spot No.
Protein Accession No.
Peptides Percent coverage
MOWSE score
Function Relative change
1 Peroxiredoxin 2 32189392 AEDFR 31.1% 59 Antioxidant "KEGGLGPLNIPLLADVTR EGGLGPLNIPLLADVTR RLSEDYGVLK QITVNDLPVGR EYFSKHN
2 Tropomyosin 4 (Tm4) 4507651 KIQALQQQADEAEDR 31% 110 Actin binding/cell motility
"
IQALQQQADEAEDR IQALQQQADEAEDRAQGLQR AQGLQR EKAEGDVAALNR AEGDVAALNR IQLVEEELDR RIQLVEEELDR HIAEEADR YEEVARK KLVILEGELER LVILEGELER AEFAER
2 Tropomyosin 3(Tm5NM1)
24119203 KIQVLQQQADDAEER 31% 78 Actin binding/cell motility
"
IQVLQQQADDAEER EQAEAEVASLNR RIQLVEEELDR IQLVEEELDR HIAEEADR YEEVARK KLVIIEGDLER LVIIEGDLER AEFAER EEHLCTQR
2 Tropomyosin 3(Tm5NM5)
19072649 KIQVLQQQADDAEER 27.1% 83 Actin binding/cell motility
"
IQVLQQQADDAEER RIQLVEEELDR IQLVEEELDR HIAEEADR YEEVARK KLVIIEGDLER LVIIEGDLER AEFAER LEKTIDDLEDELYAQK
3 Moesin 8569616 MPKTISVR 16.3% 44 Actin binding/cell motility
;
FYPEDVSEELIQDITQR DQWEER IQVWHEEHR IGFPWSEIR APDFVFYAPR AQQELEEQTR ALELEQER ALTSELANAR
8 R. Arseneault et al. / Cancer Letters xxx (2013) xxx–xxx
CAN 11438 No. of Pages 12, Model 5G
17 April 2013
cytoplasm by reversible disulfide bonding [15]. Interestingl y, moe- sin and Tms, DSBPs that were altered in LDHA knockdown cells, are known to interact with the actin cytoskeleton and influence cell migration. Given that the LDHA knockdow n cell lines have in- creased mitochondr ial ROS production and decreased migration,it stands to reason that this oxidative stress could contribute to the migration defect. Ezrin, radixin and moesin (collectively known as ERMs) associate with the actin cytoskeleton and plasma mem- brane adhesion complexes and control a variety of cellular pro- cesses including cell morphog enesis, migration, proliferation and survival [28]. Recently , Yang and colleagues found that siRNA silencing of either ezrin, radixin, or moesin could substantially re- duce both cancer cell migration and invasion in vitro [29]. In the LDHA knockdown cell lines generated in this study, moesin was
Please cite this article in press as: R. Arseneault et al., Atten uation of LDHA expstructure and cell migrati on, Can cer Le tt. (2013), http ://dx.doi.org/10.1016/ j.ca
less able to form disulfide bonds, an occurrence that may be attrib- uted to over oxidation by increased mitochondr ial ROS levels. Pro- teins with cysteine residues that are hyperoxi dized to sulfinic or sulfonic acids are incapable of re-forming disulfide bonds [14].We previously identified moesin as a DSBP with a decreased ability to form disulfide bonds in response to H2O2 or diamide-ind uced oxidative stress in immortalize d hippocampal neurons [15]. It is possible then that moesin may be functiona lly regulated by disul- fide bond formation, and that in LDHA knockdown cell lines with increased mitochond rial ROS could oxidize and inactivate moesin,which in turn could contribute to the observed migration defect.
Several Tm isoforms were also found to have altered disulfidebonding in LDHA knockdow n cell lines. Tms are rod-like coiled-coi ldimers that bind along the major groove of F-actin and interact
ress ion in cancer cells leads to redox-dep endent alteration s in cytoskeletal nlet .2013.03.03 4

585
586
587
588
589
590
591
592
593
594
595
596
597
598
599
600
601
602
603
604
605
606
607
608
609
610
611
612
613
614
615
616
617
618
619
620
621
622
623
624
625
626
627
628
629
630
631
632
633
634
635
636
Fig. 6. Ectopically expressed YFP-TmNM1 and YFP-TmNM5 isoforms undergo disulfide bonding in MDA-MB-435 cells. (A) Triton-X extracts of cells transfected with the indicated YFP expression plasmids display a 55 kDa monomeric form of all Tm isoforms (arrow head) under reducing conditions. Under non-reducing conditions (right panel)a 44 kDa intramolecular disulfide linked (asterisk) was observed in all YFP-Tm expressing cells whereas a 120 kDa intermolecular disulfide linked (arrow) was only observed in YFP-TmNM1 and YFP-TmNM5 expressing cells. (B) A 250 kDa intermolecular disulfide linked form of YFP-TmNM1 and YFP-TmNM5 (arrow) was detected in SDS extracts (enriched for F-actin) from YFP-TmNM1 and YFP-TmNM5 expressing cells but not in SCR-2 control cells expressing the same Tm5 isoforms. All blots were probed with apolyclonal anti-GFP antibody which also reacts with YFP. Blots were also probed with a monoclonal mouse anti-actin antibody with recognizes both G- and F-actin.
R. Arseneault et al. / Cancer Letters xxx (2013) xxx–xxx 9
CAN 11438 No. of Pages 12, Model 5G
17 April 2013
with other actin binding proteins such as cofilin, myosin, and Arp 2/3 [22]. There are over forty different Tm isoforms in humans, de- rived from four genes (a, b, c, and d Tm) through alternativ e splic- ing and the use of different promoters [22]. These various isoforms are commonly distingui shed as either high molecular weight (HMW) Tms or low molecular weight (LMW) Tms, with functions ranging from skeletal muscle contraction to cytoskeletal rear- rangement in non-mus cle cells [24]. A number of studies have shown that cellular transformation is accompanied by a reduction in HMW Tm expression [22]. Furthermore, overexpress ion of cer- tain HMW Tms can decrease cell migration and metastasis [24].The three Tms identified in our proteomic screen (Tm4, Tm5Nm1 and Tm5NM5), are all LMW Tms. Elevated Tm4 expression has been detected in breast cancer with lymph node metastas is [30].In addition, elevated expression of Tm5NM1 is associated with the transformation of rat fibroblasts and is required for motility of highly metastatic mouse melanoma cells [31,32]. Therefore,compromise d LMW Tm function is likely to lead to actin destabili- zation and decreased cell motility.
Increased disulfide linked forms of Tm5 were detected in LDHAknockdown and H2O2 treated control cell lines compared to the un- treated control cell line. The fact that the H2O2 treated samples exhibited similar levels of disulfide linked forms of Tm5 provides additional support to the notion that increased levels of mitochon- drial ROS influence Tm5 disulfide bonding in LDHA knockdownlines. Furthermore, the increased levels of Tm5 found in fractions
Please cite this article in press as: R. Arsene ault et al., Atten uation of LDHA expstruct ure and cell migrati on, Can cer Lett. (2013), http ://dx.doi.org/10.1016/ j.ca
enriched for F-actin in the knockdown and H2O2 treated cells sug- gests that increased ROS may alter interactions between Tm5 and F-actin. Staining of Tm5 and F-actin in LDHA knockdown cells re- vealed colocalization of both proteins in perinuclear aggregate like structure s. In contrast, control cells exhibited a more bipolar mor- phology with long parallel actin filaments running through the length of the cell soma that were intermittently co-stained with Tm5. In addition, expression of YFP-Tm5NM1 and YFP-Tm5NM5 isoforms in LDHA knock down cells resulted in the formatio n of aggregat e-like structures that were not apparent in control cells expressing the same isoforms. This findings indicate that increased ROS promote s disulfide bonding of Tm5 isoforms which, in turn,leads to altered folding, protein aggregat ion and possibly altered interactio ns with actin.
Although a number of studies have shown than Tm muscle iso- forms undergo disulfide bonding [33–35] the ability of non-muscle isoforms to form disulfide bonds is less clear. In an early study,analysis of purified chicken embryonic fibroblast (CEF) Tms by Re- dox 2D-PAGE revealed a LMW Tm isoform that underwent inter- molecula r disulfide bonding following exposure to the cysteine oxidizing agent DTNB [36]. Fluorescence microscopy analysis of CEFs, using a LMW Tm immunorea ctive monoclonal antibody (CG1), revealed stress fiber staining only in a subpopulation of cells that had identifiable leading lamella and a retraction tail; features indicative of actively motile cells [37]. Furthermore, DTNB induced oxidation of cysteine residues in purified Tm isolates led to loss of
r ession in can cer cells leads to redox-dep endent alteratio ns in cytoskeletal nlet .2013.03.03 4
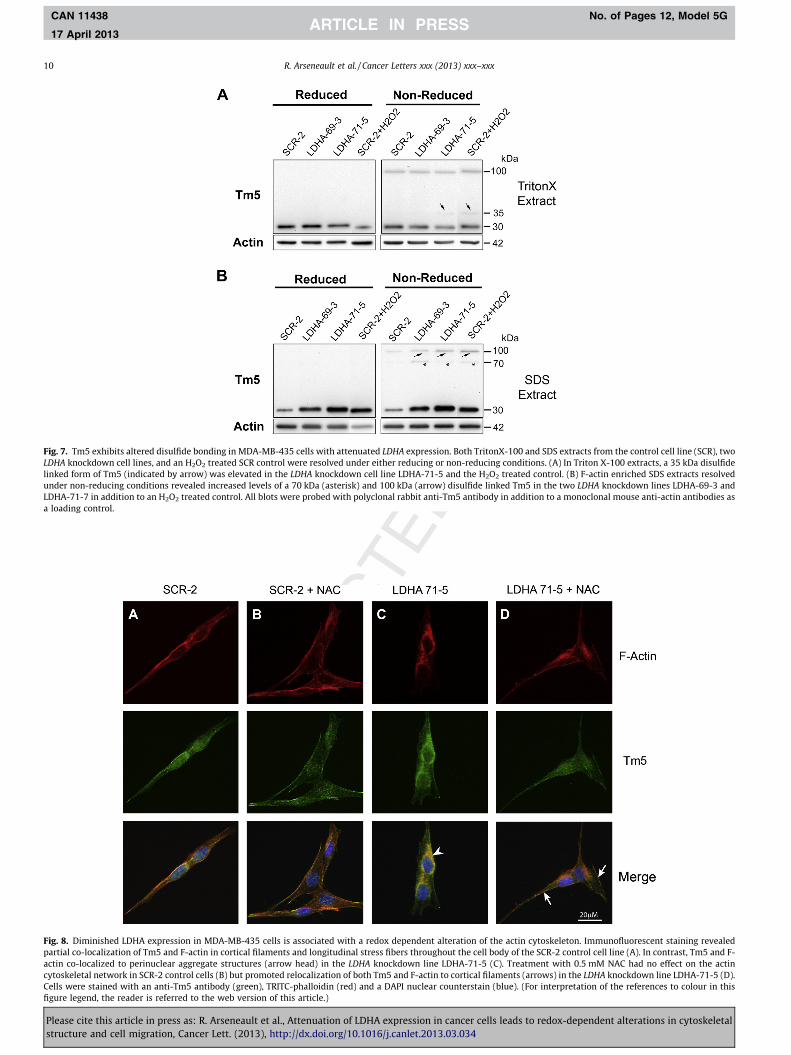
Fig. 7. Tm5 exhibits altered disulfide bonding in MDA-MB-435 cells with attenuated LDHA expression. Both TritonX-100 and SDS extracts from the control cell line (SCR), two LDHA knockdown cell lines, and an H2O2 treated SCR control were resolved under either reducing or non-reducing conditions. (A) In Triton X-100 extracts, a 35 kDa disulfidelinked form of Tm5 (indicated by arrow) was elevated in the LDHA knockdown cell line LDHA-71-5 and the H2O2 treated control. (B) F-actin enriched SDS extracts resolved under non-reducing conditions revealed increased levels of a 70 kDa (asterisk) and 100 kDa (arrow) disulfide linked Tm5 in the two LDHA knockdown lines LDHA-69-3 and LDHA-71-7 in addition to an H2O2 treated control. All blots were probed with polyclonal rabbit anti-Tm5 antibody in addition to a monoclonal mouse anti-actin antibodies as a loading control.
Fig. 8. Diminished LDHA expression in MDA-MB-435 cells is associated with a redox dependent alteration of the actin cytoskeleton. Immunofluorescent staining revealed partial co-localization of Tm5 and F-actin in cortical filaments and longitudinal stress fibers throughout the cell body of the SCR-2 control cell line (A). In contrast, Tm5 and F- actin co-localized to perinuclear aggregate structures (arrow head) in the LDHA knockdown line LDHA-71-5 (C). Treatment with 0.5 mM NAC had no effect on the actin cytoskeletal network in SCR-2 control cells (B) but promoted relocalization of both Tm5 and F-actin to cortical filaments (arrows) in the LDHA knockdown line LDHA-71-5 (D).Cells were stained with an anti-Tm5 antibody (green), TRITC-phalloidin (red) and a DAPI nuclear counterstain (blue). (For interpretation of the references to colour in this figure legend, the reader is referred to the web version of this article.)
10 R. Arseneault et al. / Cancer Letters xxx (2013) xxx–xxx
CAN 11438 No. of Pages 12, Model 5G
17 April 2013
Please cite this article in press as: R. Arseneault et al., Atten uation of LDHA express ion in cancer cells leads to redox-dep endent alteration s in cytoskeletal structure and cell migrati on, Can cer Le tt. (2013), http ://dx.doi.org/10.1016/ j.canlet .2013.03.03 4

637
638
639
640
641
642
643
644
645
646
647
648
649
650
651
652
653
654
655
656
Fig. 9. NAC treatment can partially rescue the migration defect in MDA-MB-435 cells with attenuated LDHA expression. (A) Quantification of migrated cells through a porous membrane (transwell migration assay) revealed that the compromised migration of a LDHA knockdown cell line (LDHA-71-5) can partially be recused by the antioxidant NAC (10 mM) (⁄p < 0.05, n = 3, ANOVA, Tukey’s HSD test). (B) Representative images of DAPI-stained nuclei of migrated cells from control and treatment groups. (C) Quantitative analysis of migrated cells in a wound healing assay revealed that the LDHA-71-5 cell line treated with 0.5 mM NAC showed a partial but significant rescue of the migration defect compared to control conditions (⁄p < 0.05, n = 3, ANOVA, Tukey’s HSD Test). (D) Representative images taken at 0 h (left panel) and 30 h (right panel) for the SCR control and LDHA knockdown cell line in the absence (top panels) or presence (bottom panels) of 0.5 mM NAC.
R. Arseneault et al. / Cancer Letters xxx (2013) xxx–xxx 11
CAN 11438 No. of Pages 12, Model 5G
17 April 2013
the CG1 antibody immunorea ctivity. These findings prompted the authors to speculate that CG1 recognizes a determinate involving acysteine residue that becomes masked following disulfide bond formation, and that the determinate recognized by CG1 may un- dergo a motility-depend ent change within living cells [37]. These previous findings suggest not only an important role for LMW Tms in cell migration, but indicate that the functiona lity of Tms may be affected by the redox status of the cell. As such, it is possi- ble that the increased mitochondr ial ROS produced in LDHA knock-down lines may oxidize and regulate the function of Tm4 and Tm5
Please cite this article in press as: R. Arsene ault et al., Atten uation of LDHA expstruct ure and cell migrati on, Can cer Lett. (2013), http ://dx.doi.org/10.1016/ j.ca
LMW isoforms in such a manner. Specifically, Tm5 oxidation may promote a conformationa l change which interferes with its ability to stabilize actin filaments. It is also possible that disulfide linked Tm5 isoforms may still bind actin but, under oxidizing conditions,are predispos ed to misfold and form aggregates in which actin is incorporate d. Future research will help determine the relevance of oxidized Tms on actin dynamics and cell motility. While a num- ber of recent studies have demonstrated the importance of LDHA for proliferation of a number of cancer types, this is the first such study to link LDHA activity to redox-regul ated processes that
r ession in can cer cells leads to redox-dep endent alteratio ns in cytoskeletal nlet .2013.03.03 4

657
658
659
660
661
662
663
664
665 Q3
666
667
668
669670671672673674675676677678679680681682683684685686687688689690691692693694695696697698699700701702703704705706707708709
710711712713714715716717718719720721722723724725726727728729730731732733734735736737738739740741742743744745746747748749750751752753754755756757758759760761762763764765766767768769770771772773774775776
12 R. Arseneault et al. / Cancer Letters xxx (2013) xxx–xxx
CAN 11438 No. of Pages 12, Model 5G
17 April 2013
control cell migration. As such, our findings provide further sup- port for targeting LDHA as a strategy for treating metastati c cancer.
5. Conflict of Interest Statement
None declare.
Acknowledgeme nt
This work was supported by a Natural Sciences and Engineering Research Council of Canada Grant 355803-20 08.
Appendix A. Supplementa ry material
Supplementary data associated wi th this article can be found, in the online version, at http://dx.doi.o rg/10.1016/j.canl et.2013.03.034.
References
[1] O. Warburg, On respiratory impairment in cancer cells, Science 124 (1956)269–270.
[2] O. Warburg, On the origin of cancer cells, Science 123 (1956) 309–314.[3] R.A. Gatenby, R.J. Gillies, Why do cancers have high aerobic glycolysis?, Nat
Rev. Cancer. 4 (2004) 891–899.[4] I. Papandreou, R.A. Cairns, L. Fontana, A.L. Lim, N.C. Denko, HIF-1 mediates
adaptation to hypoxia by actively downregulating mitochondrial oxygen consumption, Cell. Metab. 3 (2006) 187–197.
[5] J.W. Kim, I. Tchernyshyov, G.L. Semenza, C.V. Dang, HIF-1-mediated expression of pyruvate dehydrogenase kinase: a metabolic switch required for cellular adaptation to hypoxia, Cell. Metab. 3 (2006) 177–185.
[6] R.A. Gatenby, R.J. Gillies, Glycolysis in cancer: a potential target for therapy, Int.J. Biochem. Cell Biol. 39 (2007) 1358–1366.
[7] N. Bellance, G. Benard, F. Furt, H. Begueret, K. Smolkova, E. Passerieux, J.P.Delage, J.M. Baste, P. Moreau, R. Rossignol, Bioenergetics of lung tumors:alteration of mitochondrial biogenesis and respiratory capacity, Int. J. Biochem.Cell Biol. 41 (2009) 2566–2577.
[8] W.H. Koppenol, P.L. Bounds, C.V. Dang, Otto warburg’s contributions to current concepts of cancer metabolism, Nat. Rev. Cancer. 11 (2011) 325–337.
[9] R.A. Cairns, I.S. Harris, T.W. Mak, Regulation of cancer cell metabolism, Nat.Rev. Cancer. 11 (2011) 85–95.
[10] D. Trachootham, J. Alexandre, P. Huang, Targeting cancer cells by ROS- mediated mechanisms: a radical therapeutic approach?, Nat Rev. Drug Discov.8 (2009) 579–591.
[11] A.E. Vaughn, M. Deshmukh, Glucose metabolism inhibits apoptosis in neurons and cancer cells by redox inactivation of cytochrome c, Nat. Cell Biol. 10 (2008)1477–1483.
[12] G. Pani, T. Galeotti, P. Chiarugi, Metastasis: cancer cell’s escape from oxidative stress, Cancer Metastasis Rev. 29 (2010) 351–378.
[13] S. Luanpitpong, S.J. Talbott, Y. Rojanasakul, U. Nimmannit, V. Pongrakhananon,L. Wang, P. Chanvorachote, Regulation of lung cancer cell migration and invasion by reactive oxygen species and caveolin-1, J. Biol. Chem. 285 (2010)38832–38840.
[14] C.E. Paulsen, K.S. Carroll, Orchestrating redox signaling networks through regulatory cysteine switches, ACS Chem. Biol. 5 (2010) 47–62.
[15] R.C. Cumming, N.L. Andon, P.A. Haynes, M. Park, W.H. Fischer, D. Schubert,Protein disulfide bond formation in the cytoplasm during oxidative stress, J.Biol. Chem. 279 (2004) 21749–21758.
[16] V.R. Fantin, J. St-Pierre, P. Leder, Attenuation of LDH-A expression uncovers alink between glycolysis, mitochondrial physiology, and tumor maintenance,Cancer. Cell. 9 (2006) 425–434.
777
Please cite this article in press as: R. Arseneault et al., Atten uation of LDHA expstructure and cell migrati on, Can cer Le tt. (2013), http ://dx.doi.org/10.1016/ j.ca
[17] A. Le, C.R. Cooper, A.M. Gouw, R. Dinavahi, A. Maitra, L.M. Deck, R.E. Royer, D.L.Vander Jagt, G.L. Semenza, C.V. Dang, Inhibition of lactate dehydrogenase Ainduces oxidative stress and inhibits tumor progression, Proc. Natl. Acad. Sci.USA 107 (2010) 2037–2042.
[18] Z.Y. Wang, T.Y. Loo, J.G. Shen, N. Wang, D.M. Wang, D.P. Yang, S.L. Mo, X.Y.Guan, J.P. Chen, LDH-A silencing suppresses breast cancer tumorigenicity through induction of oxidative stress mediated mitochondrial pathway apoptosis, Breast Cancer Res. Treat. 131 (2012) 791–800.
[19] S. Tojkander, G. Gateva, G. Schevzov, P. Hotulainen, P. Naumanen, C. Martin,P.W. Gunning, P. Lappalainen, A molecular pathway for myosin II recruitment to stress fibers, Curr. Biol. 21 (2011) 539–550.
[20] D. Xie, A. Jauch, C.W. Miller, C.R. Bartram, H.P. Koeffler, Discovery of over- expressed genes and genetic alterations in breast cancer cells using acombination of suppression subtractive hybridization, multiplex FISH and comparative genomic hybridization, Int. J. Oncol. 21 (2002) 499–507.
[21] N. Nagahara, Intermolecular disulfide bond to modulate protein function as aredox-sensing switch, Amino Acids 41 (2011) 59–72.
[22] P. Gunning, G. O’Neill, E. Hardeman, Tropomyosin-based regulation of the actin cytoskeleton in time and space, Physiol. Rev. 88 (2008) 1–35.
[23] G. Schevzov, S.P. Whittaker, T. Fath, J.J. Lin, P.W. Gunning, Tropomyosin isoforms and reagents, Bioarchitecture 1 (2011) 135–164.
[24] S.J. Creed, M. Desouza, J.R. Bamburg, P. Gunning, J. Stehn, Tropomyosin isoform 3 promotes the formation of filopodia by regulating the recruitment of actin-binding proteins to actin filaments, Exp. Cell Res. 317 (2011)249–261.
[25] M.G. Vander Heiden, L.C. Cantley, C.B. Thompson, Understanding the Warburg effect: the metabolic requirements of cell proliferation, Science 324 (2009)1029–1033.
[26] M. Zhou, Y. Zhao, Y. Ding, et al., Warburg effect in chemosensitivity: targeting lactate dehydrogenase-A re-sensitizes taxol-resistant cancer cells to taxol,Mol. Cancer. 9 (2010) 33.
[27] S. Harguindey, G. Orive, J. Luis Pedraz, A. Paradiso, S.J. Reshkin, The role of pH dynamics and the Na +/H+ antiporter in the etiopathogenesis and treatment of cancer. two faces of the same coin–one single nature, Biochim. Biophys. Acta 1756 (2005) 1–24.
[28] H. Yu, Y. Zhang, L. Ye, W.G. Jiang, The FERM family proteins in cancer invasion and metastasis, Front. Biosci. 16 (2011) 1536–1550.
[29] M. Ou-Yang, H.R. Liu, Y. Zhang, X. Zhu, Q. Yang, ERM stable knockdown by siRNA reduced in vitro migration and invasion of human SGC-7901 cells,Biochimie 93 (2011) 954–961.
[30] D.Q. Li, L. Wang, F. Fei, et al., Identification of breast cancer metastasis- associated proteins in an isogenic tumor metastasis model using two- dimensional gel electrophoresis and liquid chromatography–ion trap-mass spectrometry, Proteomics 6 (2006) 3352–3368.
[31] K. Miyado, M. Sato, S. Taniguchi, Transformation-related expression of a low- molecular-mass tropomyosin isoform TM5/TM30nm in transformed rat fibroblastic cell lines, J. Cancer Res. Clin. Oncol. 123 (1997) 331–336.
[32] K. Miyado, M. Kimura, S. Taniguchi, Decreased expression of a single tropomyosin isoform, TM5/TM30nm, results in reduction in motility of highly metastatic B16–F10 mouse melanoma cells, Biochem. Biophys. Res.Commun. 225 (1996) 427–435.
[33] B.S. Avner, K.M. Shioura, S.B. Scruggs, M. Grachoff, D.L. Geenen, D.L. Helseth Jr.,M. Farjah, P.H. Goldspink, R.J. Solaro, Myocardial infarction in mice alters sarcomeric function via post-translational protein modification, Mol. Cell.Biochem. 363 (2012) 203–215.
[34] M. Canton, S. Menazza, F.L. Sheeran, P. Polverino de Laureto, F. Di Lisa, S. Pepe,Oxidation of myofibrillar proteins in human heart failure, J. Am. Coll. Cardiol.57 (2011) 300–309.
[35] S.S. Lehrer, D. Joseph, Differences in local conformation around cysteine residues in alpha alpha, alpha beta, and beta beta rabbit skeletal tropomyosin,Arch. Biochem. Biophys. 256 (1987) 1–9.
[36] J.J. Lin, D.M. Helfman, S.H. Hughes, C.S. Chou, Tropomyosin isoforms in chicken embryo fibroblasts: purification, characterization, and changes in rous sarcoma virus-transformed cells, J. Cell Biol. 100 (1985) 692–703.
[37] T.E. Hegmann, J.L. Lin, J.J. Lin, Motility-dependence of the heterogenous staining of culture cells by a monoclonal anti-tropomyosin antibody, J. Cell Biol. 106 (1988) 385–393.
ress ion in cancer cells leads to redox-dep endent alteration s in cytoskeletal nlet .2013.03.03 4