ats company reports: gvk
TRANSCRIPT

Company Details
GVK Power & Infrastructure Ltd. operates as a holding company. The company together with its subsidiaries and associates is
engaged in constructing, operates power plants, highway projects, airports, exploration of oil, natural gas and coal mines. It
operates its business in four segments: Power, Transportation, Airport and Other. The Power segment includes generation,
operation and maintenance services to the power plants. The Transportation segment engages in building, development and
maintenance of roads. The Airport segment engages operation and maintenance of airport. The Other segment operates in SEZ,
manpower, and exploration of oil & gas.
GVK Power & Infrastructure was founded by Gunapati Venkata Krishna Reddy on December 2, 1994 and is headquartered in
Secunderabad, India. Having already invested over Rs. 20,000 crore(USD 4.3 billion) the company has projects worth over
another Rs. 30,000 crore(USD 6.6 billion) in the pipeline, in India. GVK has pioneered various infrastructure projects viz. setting
up India’s first Independent Power Plant (IPP), first six-lane road project and first Brownfield airport under the Public Private
Partnership model.
It has over 900 MW operational power plants and around 5000 MW projects under various stages of construction and
development. GVK has acquired the Australian Coal Mines in Queensland with 8 billion tonne reserves and a capacity of more
than 80 million tonne per annum for USD 1.26 billion. It will also set up a 500 km. rail line and upto 80 mtpa port as part of the
'pit-to-port' logistics solution. The project envisages a total investment of USD 10 billion.
GVK has established itself as a premium hospitality leader in Hyderabad, Chandigarh and Chennai with six TAJGVK properties
and has plans to cater to the growing segments in Mumbai and Bengaluru as well.
GVK Biosciences is Asia’s leading Contract Research Organization (CRO) with over 2000 scientists, support and analytical staff.
It provides a broad spectrum of stand-alone and integrated services, across the R&D value chain to leading international
pharma, agro, biotech and life sciences companies.
The current market capitalization stands at Rs 1,566.58 crore. The company has reported a consolidated sales of Rs 698.76
crore and a Net Loss of Rs -304.07 crore for the quarter ended Sep 2014.
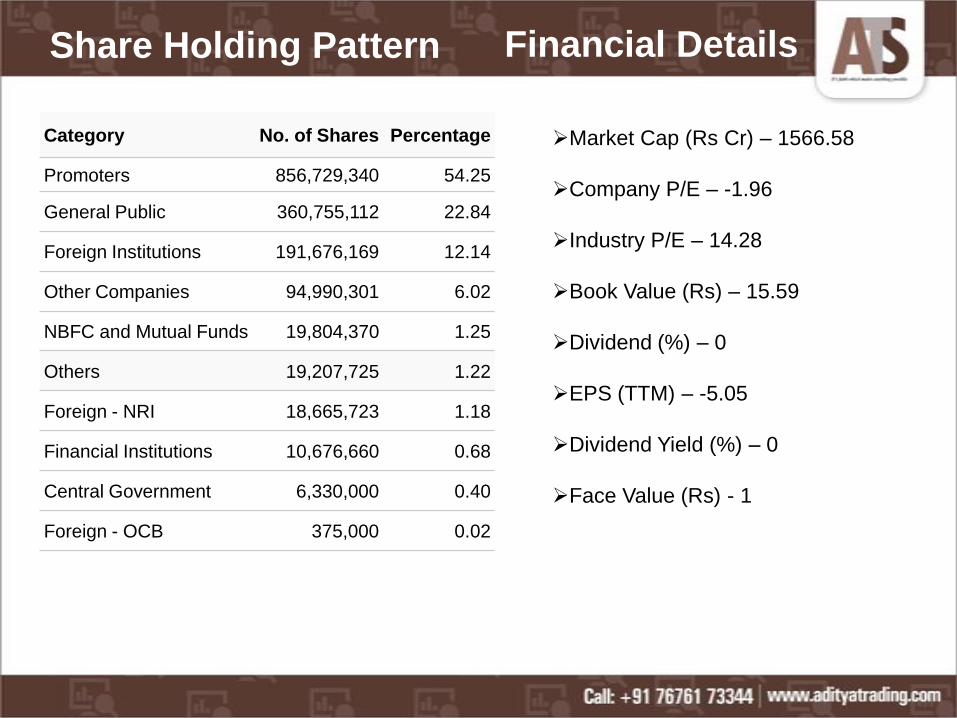
Category No. of Shares Percentage
Promoters 856,729,340 54.25
General Public 360,755,112 22.84
Foreign Institutions 191,676,169 12.14
Other Companies 94,990,301 6.02
NBFC and Mutual Funds 19,804,370 1.25
Others 19,207,725 1.22
Foreign - NRI 18,665,723 1.18
Financial Institutions 10,676,660 0.68
Central Government 6,330,000 0.40
Foreign - OCB 375,000 0.02
Market Cap (Rs Cr) – 1566.58
Company P/E – -1.96
Industry P/E – 14.28
Book Value (Rs) – 15.59
Dividend (%) – 0
EPS (TTM) – -5.05
Dividend Yield (%) – 0
Face Value (Rs) - 1
Share Holding Pattern Financial Details

Industry Details
As per the International Energy Agency (IEA) publication on World Energy Statistics 2013, India ranks 5th in Electricity
production and 110th in the per-capita consumption of electricity. The Minister further stated that energy deficit in India has
reduced from 9.5 per cent in 2010-11 to 4.5 per cent in 2013-14.
The Indian power sector is undergoing a significant change that is redefining the industry outlook. Sustained economic growth
continues to drive power demand in India. The Government of India’s focus to attain ‘Power For All’ has accelerated capacity
addition in the country. At the same time, the competitive intensity is increasing on both market side as well as supply side (fuel,
logistics, finances and manpower).
The investment climate is positive in the power sector. Due to the policy of liberalization, the sector has witnessed higher
investment flows than envisaged. The Ministry of Power has sent its proposal for the addition of 76,000 MW of power capacity in
the 12th Five Year plan (2012-17), to the Planning Commission. The Ministry has set a target of adding 93,000 MW in the 13th
Five Year Plan (2017-2022).
A key driver of the economy, Infrastructure is highly responsible for propelling India’s overall development. The industry enjoys
intense focus from the top officials of the Government for initiating policies that would ensure time-bound creation of world class
infrastructure in the country. This sector includes power, bridges, dams, roads and urban infrastructure development. The Indian
Government is taking every possible initiative to boost the infrastructure sector. Some of the steps taken in the recent past are
being discussed hereafter. Recently, the Government has relaxed rules for FDI in the construction sector by reducing minimum
built-up area as well as capital requirement and liberalized the exit norms. The Cabinet has also approved the proposal to amend
the FDI policy.
India and the US have signed a memorandum of understanding (MoU) in order to establish Infrastructure Collaboration Platform.
Along with that, Indian aviation market is expected to become the third largest across the globe by 2020, according to industry
estimates. The sector is projected to handle 336 million domestic and 85 million international passengers with projected
investment to the tune of US$ 120 billion. Indian Aviation Industry that currently accounts for 1.5 per cent of the gross domestic
product (GDP), has been instrumental in the overall economic development of the country.

Balance Sheet
Mar '14 Mar '13 Mar '12 Mar '11 Mar '10
Sources Of Funds
Total Share Capital 157.92 157.92 157.92 157.92 157.92
Equity Share Capital 157.92 157.92 157.92 157.92 157.92
Reserves 2,320.53 2,343.96 2,368.00 2,376.28 2,307.99
Networth 2,478.45 2,501.88 2,525.92 2,534.20 2,465.91
Secured Loans 463.69 423.50 219.00 100.94 100.34
Unsecured Loans 0.00 0.00 197.25 0.00 0.00
Total Debt 463.69 423.50 416.25 100.94 100.34
Total Liabilities 2,942.14 2,925.38 2,942.17 2,635.14 2,566.25
Application Of Funds
Gross Block 1.82 1.81 1.81 1.78 0.51
Less: Accum. Depreciation 0.73 0.55 0.37 0.19 0.12
Net Block 1.09 1.26 1.44 1.59 0.39
Investments 1,406.20 1,404.91 1,371.06 1,616.21 1,514.63
Sundry Debtors 3.70 2.99 1.17 1.49 3.95
Cash and Bank Balance 16.61 23.39 17.48 3.09 1.17
Total Current Assets 20.31 26.38 18.65 4.58 5.12
Loans and Advances 1,591.51 1,500.97 1,555.67 1,016.89 1,047.42
Fixed Deposits 0.00 0.00 0.00 0.00 2.62
Total CA, Loans & Advances 1,611.82 1,527.35 1,574.32 1,021.47 1,055.16
Current Liabilities 74.86 6.86 2.11 2.77 2.62
Provisions 2.11 1.28 2.54 1.37 1.31
Total CL & Provisions 76.97 8.14 4.65 4.14 3.93
Net Current Assets 1,534.85 1,519.21 1,569.67 1,017.33 1,051.23
Total Assets 2,942.14 2,925.38 2,942.17 2,635.13 2,566.25
Contingent Liabilities 10,628.33 4,393.01 5,785.50 1,263.09 1,633.00
Book Value (Rs) 15.69 15.84 15.99 16.05 15.61
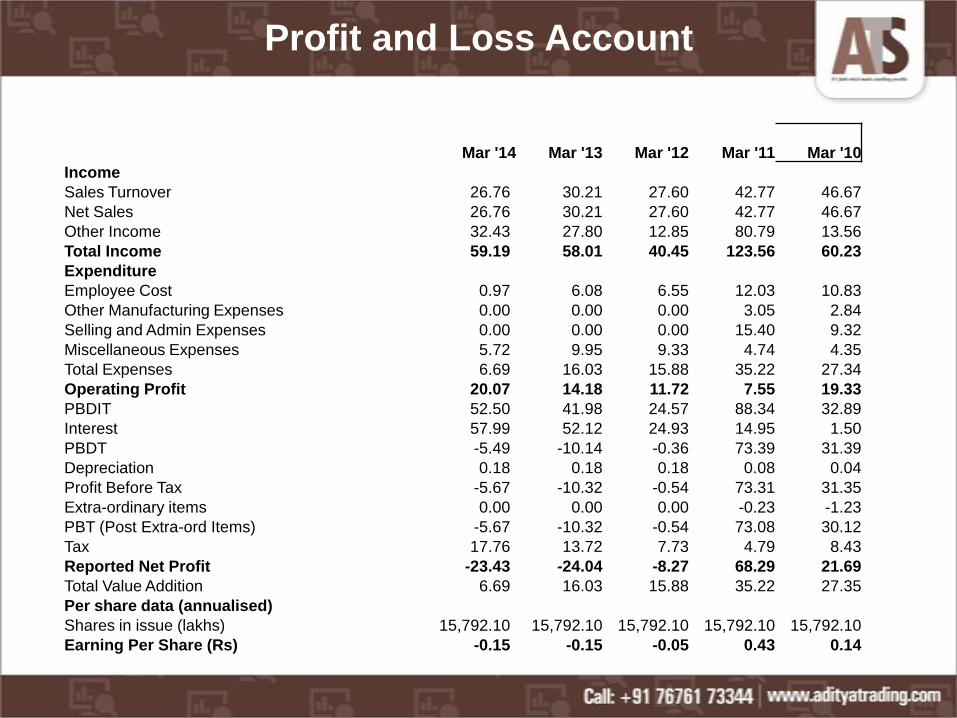
Profit and Loss Account
Mar '14 Mar '13 Mar '12 Mar '11 Mar '10
Income
Sales Turnover 26.76 30.21 27.60 42.77 46.67
Net Sales 26.76 30.21 27.60 42.77 46.67
Other Income 32.43 27.80 12.85 80.79 13.56
Total Income 59.19 58.01 40.45 123.56 60.23
Expenditure
Employee Cost 0.97 6.08 6.55 12.03 10.83
Other Manufacturing Expenses 0.00 0.00 0.00 3.05 2.84
Selling and Admin Expenses 0.00 0.00 0.00 15.40 9.32
Miscellaneous Expenses 5.72 9.95 9.33 4.74 4.35
Total Expenses 6.69 16.03 15.88 35.22 27.34
Operating Profit 20.07 14.18 11.72 7.55 19.33
PBDIT 52.50 41.98 24.57 88.34 32.89
Interest 57.99 52.12 24.93 14.95 1.50
PBDT -5.49 -10.14 -0.36 73.39 31.39
Depreciation 0.18 0.18 0.18 0.08 0.04
Profit Before Tax -5.67 -10.32 -0.54 73.31 31.35
Extra-ordinary items 0.00 0.00 0.00 -0.23 -1.23
PBT (Post Extra-ord Items) -5.67 -10.32 -0.54 73.08 30.12
Tax 17.76 13.72 7.73 4.79 8.43
Reported Net Profit -23.43 -24.04 -8.27 68.29 21.69
Total Value Addition 6.69 16.03 15.88 35.22 27.35
Per share data (annualised)
Shares in issue (lakhs) 15,792.10 15,792.10 15,792.10 15,792.10 15,792.10
Earning Per Share (Rs) -0.15 -0.15 -0.05 0.43 0.14
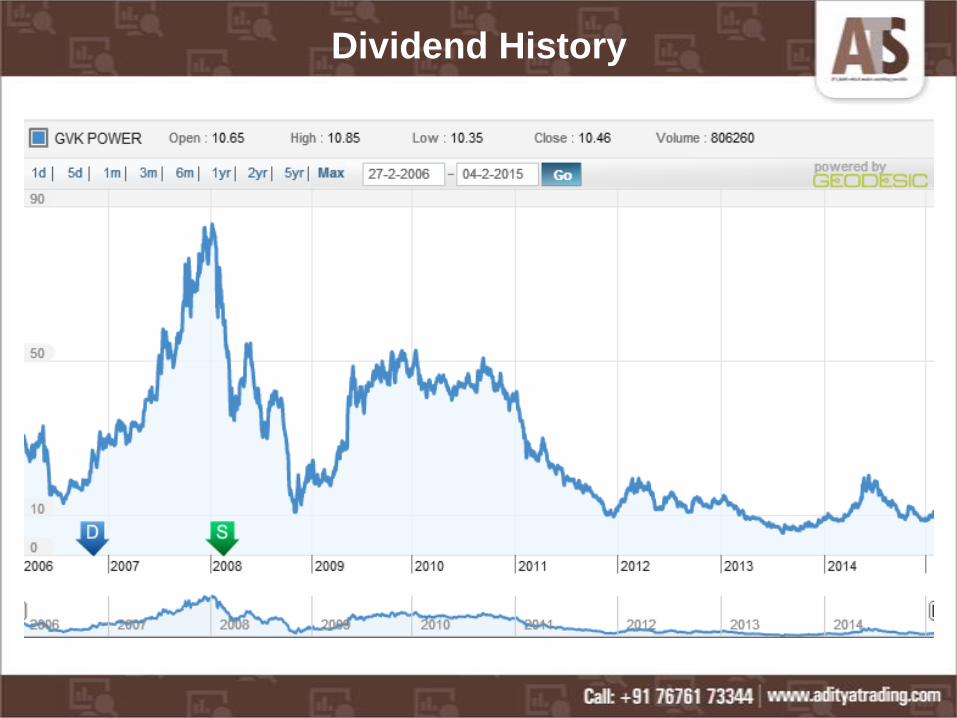
Dividend History

Index and Company Comparison
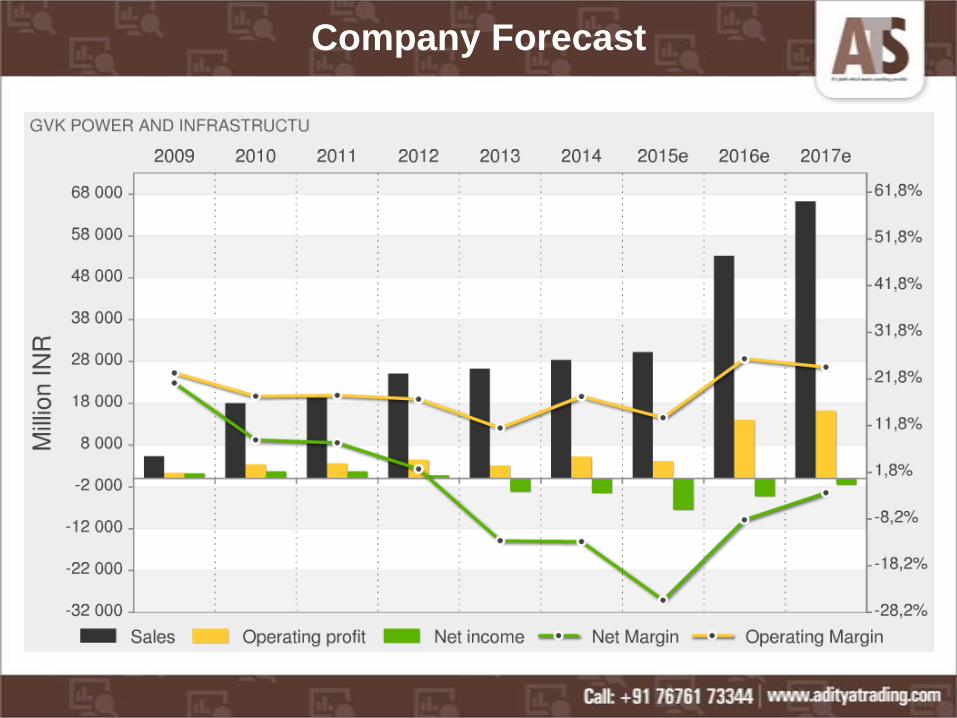
Company Forecast
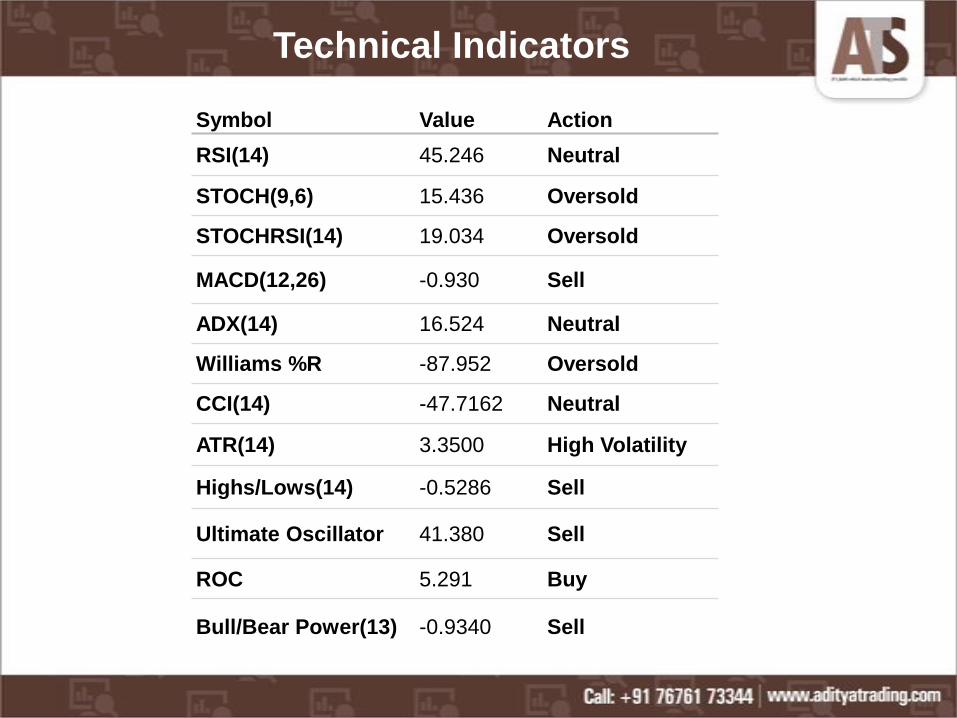
Symbol Value Action
RSI(14) 45.246 Neutral
STOCH(9,6) 15.436 Oversold
STOCHRSI(14) 19.034 Oversold
MACD(12,26) -0.930 Sell
ADX(14) 16.524 Neutral
Williams %R -87.952 Oversold
CCI(14) -47.7162 Neutral
ATR(14) 3.3500 High Volatility
Highs/Lows(14) -0.5286 Sell
Ultimate Oscillator 41.380 Sell
ROC 5.291 Buy
Bull/Bear Power(13) -0.9340 Sell
Technical Indicators
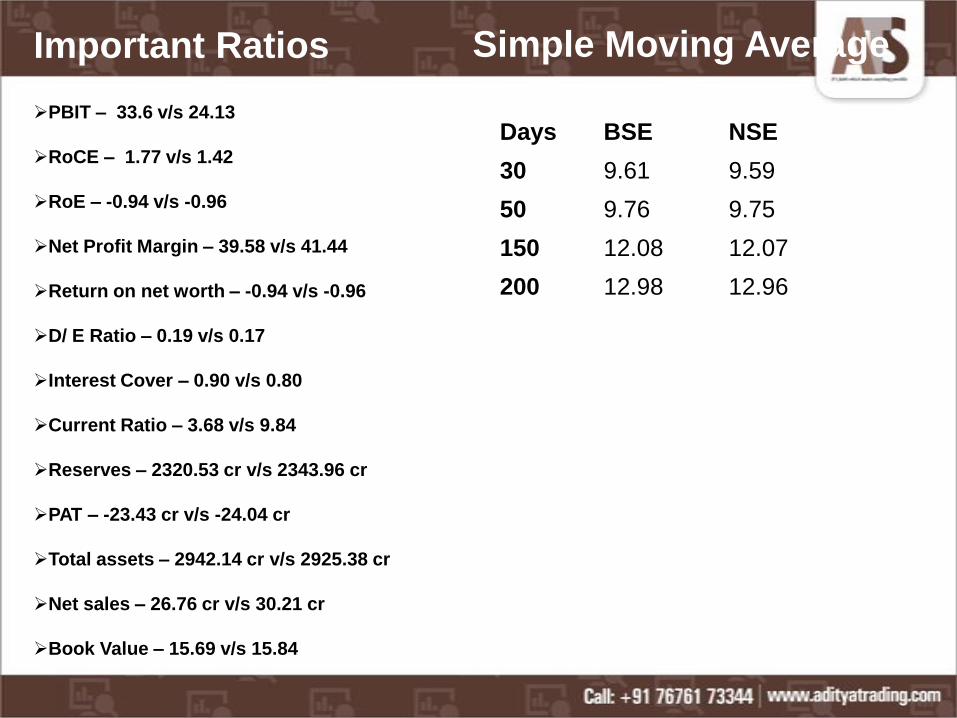
PBIT – 33.6 v/s 24.13
RoCE – 1.77 v/s 1.42
RoE – -0.94 v/s -0.96
Net Profit Margin – 39.58 v/s 41.44
Return on net worth – -0.94 v/s -0.96
D/ E Ratio – 0.19 v/s 0.17
Interest Cover – 0.90 v/s 0.80
Current Ratio – 3.68 v/s 9.84
Reserves – 2320.53 cr v/s 2343.96 cr
PAT – -23.43 cr v/s -24.04 cr
Total assets – 2942.14 cr v/s 2925.38 cr
Net sales – 26.76 cr v/s 30.21 cr
Book Value – 15.69 v/s 15.84
Days BSE NSE
30 9.61 9.59
50 9.76 9.75
150 12.08 12.07
200 12.98 12.96
Important Ratios Simple Moving Average

Recommendations
Buy GVK Power and Infrastructure Ltd. at
current or lower market levels
Reasons for the recommendations are :
Possibility of getting new airport projects.
Reduction in interest rates will increase the profits.
Income from hospitality and pharma business will boost revenue.
Projects in power and infra projects nearing completion.
Governments positive response towards infrastructure and power sector.
Getting coal mine license will help to use its power generation capacity to
maximum.