ats company reports: mayur
TRANSCRIPT
Company Details
Mayur Uniquoters Limited is engaged in the business of manufacturing of coated textile fabric. Coated
Textile Fabric is used in different segments, such as Footwear, Furnishings, Automotive original equipment
manufacturer (OEM), Automotive Replacement Market, and Automotive Exports. The Company is selling its
products directly to OEMs and other manufacturers, wholesalers in India and is also exporting to various
countries, including the United States and the United Kingdom. The Company has its manufacturing units
situated at Village Jaitpura and Dhodsar, Jaipur (India). The Company offers products for various parts of
footwear like shoe uppers, shoe lining and insoles. These products find application in formal shoe and boots,
sports shoes, sandals, slippers, as well as women’s footwear.
Mayur concentrates mainly on 3 segments. Footwear (55%), Auto (25%), Furnishing (10%). Others bring up
the balance 10%.
Mayur supplies synthetic leather to both domestic as well as overseas clients. Synthetic leather is used in
industries such as footwear, automobile seats, furnishings, sports goods, ladies’ bags, and a number of
fashion accessories. Mayur derives more than 50% of its revenue from the organized footwear industry
serving clients such as Bata, Action, Liberty, Relaxo and Paragon. Apart from this, the company also caters
to the auto industry (both domestic and global OEMs as well as the replacement market) through the sale of
synthetic leather for automobile sector. Mayur caters to all large manufacturers in automotives including
Honda, Maruti, M&M, Tata, Eicher Motors and global OEMs, Ford and Chrysler. It also supplies to different
industries for manufacturing of products like garments, furniture, sport goods etc.
The current market capitalization stands at Rs 1,810.17 crore. The company has reported a standalone
sales of Rs 128.22 crore and a Net Profit of Rs 15.64 crore for the quarter ended Sep 2014.
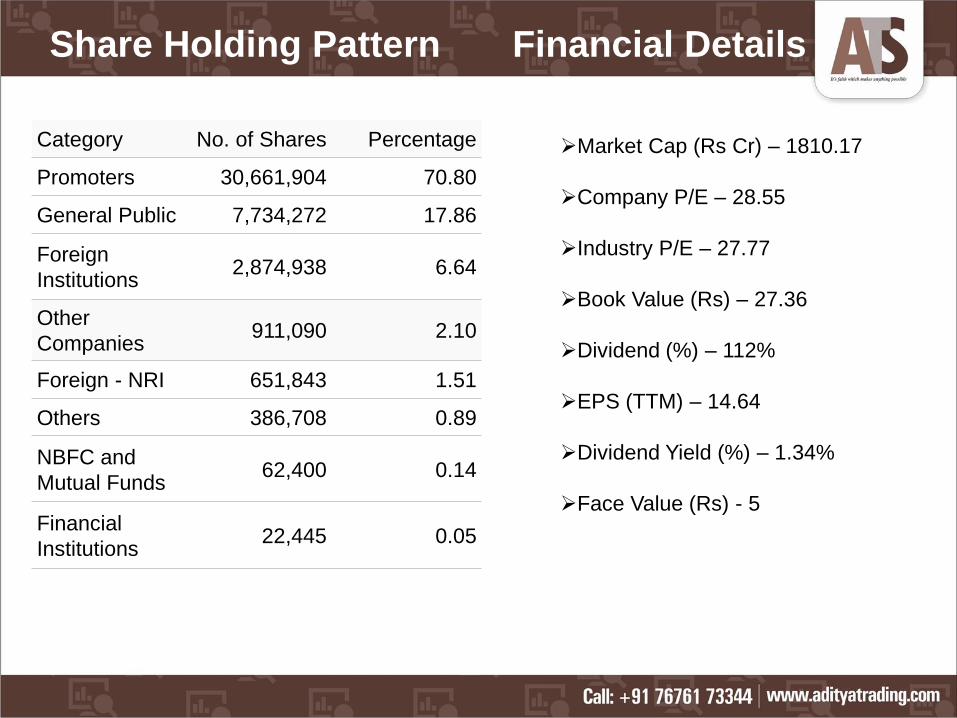
Category No. of Shares Percentage
Promoters 30,661,904 70.80
General Public 7,734,272 17.86
Foreign
Institutions2,874,938 6.64
Other
Companies911,090 2.10
Foreign - NRI 651,843 1.51
Others 386,708 0.89
NBFC and
Mutual Funds62,400 0.14
Financial
Institutions22,445 0.05
Market Cap (Rs Cr) – 1810.17
Company P/E – 28.55
Industry P/E – 27.77
Book Value (Rs) – 27.36
Dividend (%) – 112%
EPS (TTM) – 14.64
Dividend Yield (%) – 1.34%
Face Value (Rs) - 5
Share Holding Pattern Financial Details
Industry Details
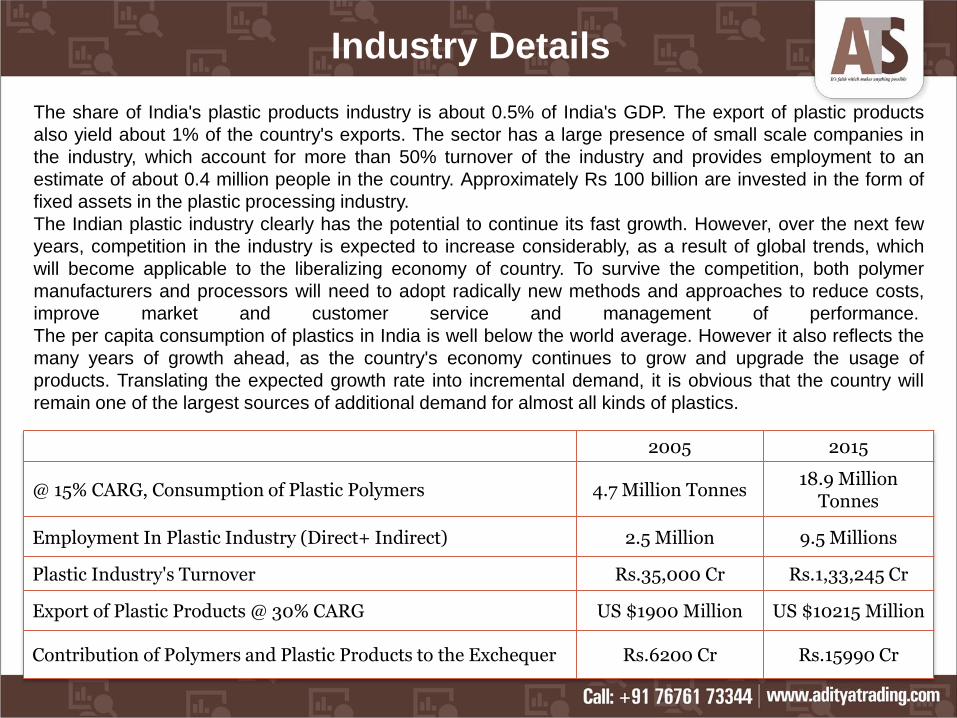
The share of India's plastic products industry is about 0.5% of India's GDP. The export of plastic products
also yield about 1% of the country's exports. The sector has a large presence of small scale companies in
the industry, which account for more than 50% turnover of the industry and provides employment to an
estimate of about 0.4 million people in the country. Approximately Rs 100 billion are invested in the form of
fixed assets in the plastic processing industry.
The Indian plastic industry clearly has the potential to continue its fast growth. However, over the next few
years, competition in the industry is expected to increase considerably, as a result of global trends, which
will become applicable to the liberalizing economy of country. To survive the competition, both polymer
manufacturers and processors will need to adopt radically new methods and approaches to reduce costs,
improve market and customer service and management of performance.
The per capita consumption of plastics in India is well below the world average. However it also reflects the
many years of growth ahead, as the country's economy continues to grow and upgrade the usage of
products. Translating the expected growth rate into incremental demand, it is obvious that the country will
remain one of the largest sources of additional demand for almost all kinds of plastics.
2005 2015
@ 15% CARG, Consumption of Plastic Polymers 4.7 Million Tonnes18.9 Million
Tonnes
Employment In Plastic Industry (Direct+ Indirect) 2.5 Million 9.5 Millions
Plastic Industry's Turnover Rs.35,000 Cr Rs.1,33,245 Cr
Export of Plastic Products @ 30% CARG US $1900 Million US $10215 Million
Contribution of Polymers and Plastic Products to the Exchequer Rs.6200 Cr Rs.15990 Cr
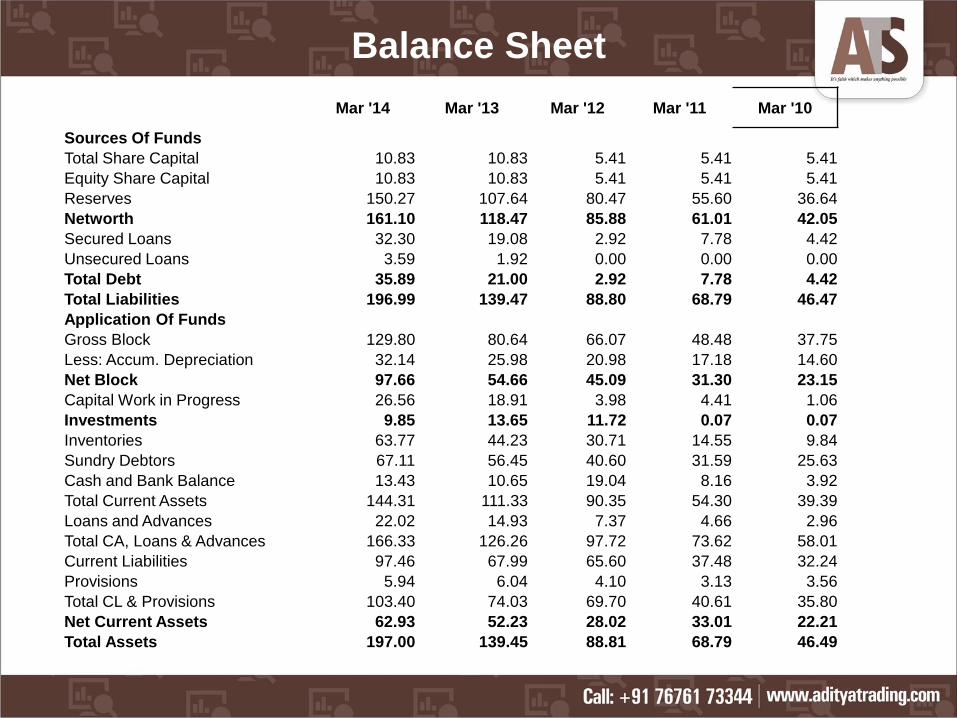
Mar '14 Mar '13 Mar '12 Mar '11 Mar '10
Sources Of Funds
Total Share Capital 10.83 10.83 5.41 5.41 5.41
Equity Share Capital 10.83 10.83 5.41 5.41 5.41
Reserves 150.27 107.64 80.47 55.60 36.64
Networth 161.10 118.47 85.88 61.01 42.05
Secured Loans 32.30 19.08 2.92 7.78 4.42
Unsecured Loans 3.59 1.92 0.00 0.00 0.00
Total Debt 35.89 21.00 2.92 7.78 4.42
Total Liabilities 196.99 139.47 88.80 68.79 46.47
Application Of Funds
Gross Block 129.80 80.64 66.07 48.48 37.75
Less: Accum. Depreciation 32.14 25.98 20.98 17.18 14.60
Net Block 97.66 54.66 45.09 31.30 23.15
Capital Work in Progress 26.56 18.91 3.98 4.41 1.06
Investments 9.85 13.65 11.72 0.07 0.07
Inventories 63.77 44.23 30.71 14.55 9.84
Sundry Debtors 67.11 56.45 40.60 31.59 25.63
Cash and Bank Balance 13.43 10.65 19.04 8.16 3.92
Total Current Assets 144.31 111.33 90.35 54.30 39.39
Loans and Advances 22.02 14.93 7.37 4.66 2.96
Total CA, Loans & Advances 166.33 126.26 97.72 73.62 58.01
Current Liabilities 97.46 67.99 65.60 37.48 32.24
Provisions 5.94 6.04 4.10 3.13 3.56
Total CL & Provisions 103.40 74.03 69.70 40.61 35.80
Net Current Assets 62.93 52.23 28.02 33.01 22.21
Total Assets 197.00 139.45 88.81 68.79 46.49
Balance Sheet
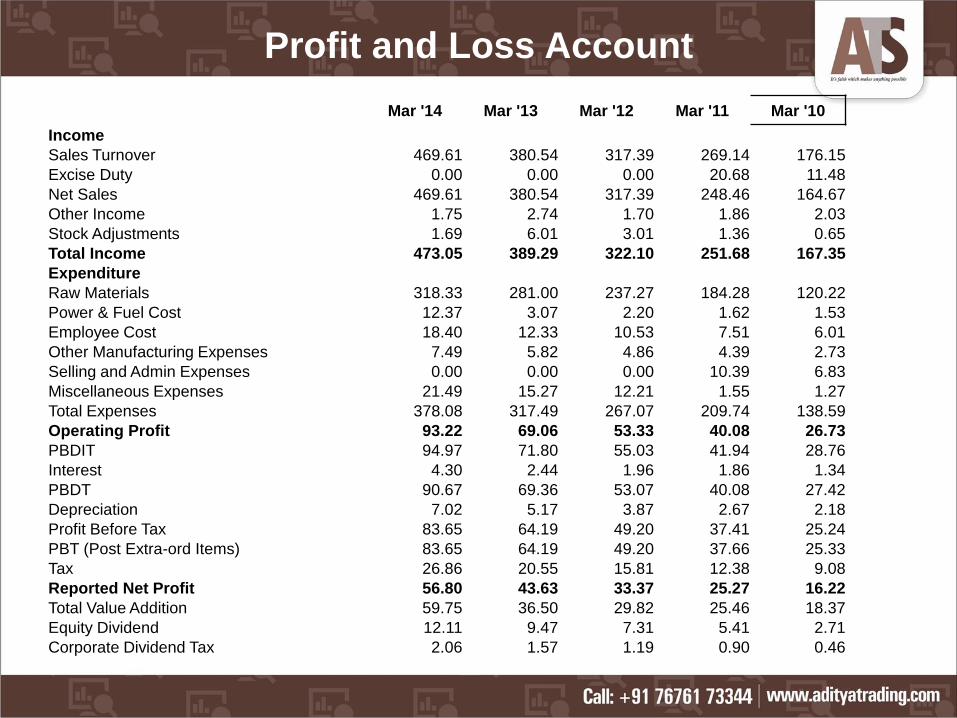
Profit and Loss Account
Mar '14 Mar '13 Mar '12 Mar '11 Mar '10
Income
Sales Turnover 469.61 380.54 317.39 269.14 176.15
Excise Duty 0.00 0.00 0.00 20.68 11.48
Net Sales 469.61 380.54 317.39 248.46 164.67
Other Income 1.75 2.74 1.70 1.86 2.03
Stock Adjustments 1.69 6.01 3.01 1.36 0.65
Total Income 473.05 389.29 322.10 251.68 167.35
Expenditure
Raw Materials 318.33 281.00 237.27 184.28 120.22
Power & Fuel Cost 12.37 3.07 2.20 1.62 1.53
Employee Cost 18.40 12.33 10.53 7.51 6.01
Other Manufacturing Expenses 7.49 5.82 4.86 4.39 2.73
Selling and Admin Expenses 0.00 0.00 0.00 10.39 6.83
Miscellaneous Expenses 21.49 15.27 12.21 1.55 1.27
Total Expenses 378.08 317.49 267.07 209.74 138.59
Operating Profit 93.22 69.06 53.33 40.08 26.73
PBDIT 94.97 71.80 55.03 41.94 28.76
Interest 4.30 2.44 1.96 1.86 1.34
PBDT 90.67 69.36 53.07 40.08 27.42
Depreciation 7.02 5.17 3.87 2.67 2.18
Profit Before Tax 83.65 64.19 49.20 37.41 25.24
PBT (Post Extra-ord Items) 83.65 64.19 49.20 37.66 25.33
Tax 26.86 20.55 15.81 12.38 9.08
Reported Net Profit 56.80 43.63 33.37 25.27 16.22
Total Value Addition 59.75 36.50 29.82 25.46 18.37
Equity Dividend 12.11 9.47 7.31 5.41 2.71
Corporate Dividend Tax 2.06 1.57 1.19 0.90 0.46

Dividend and Bonus History
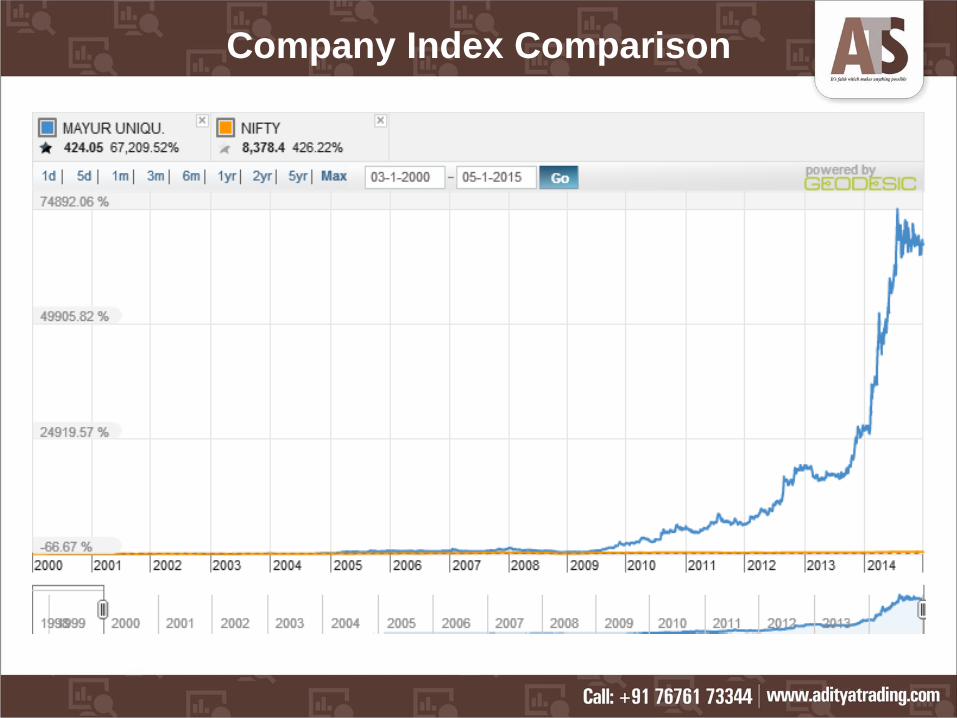
Company Index Comparison
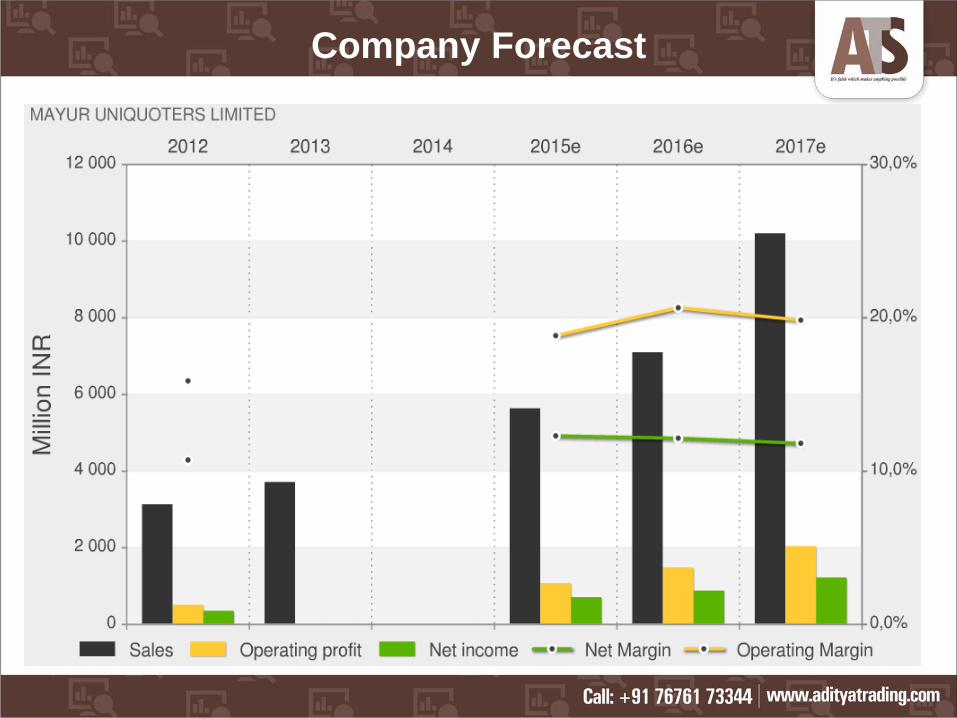
Company Forecast
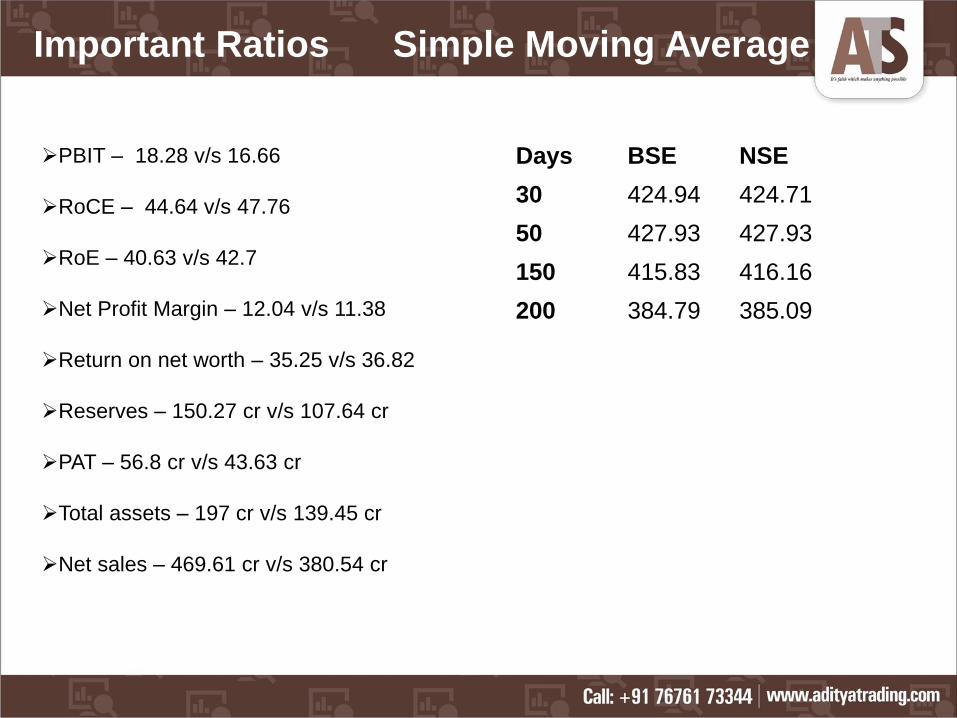
PBIT – 18.28 v/s 16.66
RoCE – 44.64 v/s 47.76
RoE – 40.63 v/s 42.7
Net Profit Margin – 12.04 v/s 11.38
Return on net worth – 35.25 v/s 36.82
Reserves – 150.27 cr v/s 107.64 cr
PAT – 56.8 cr v/s 43.63 cr
Total assets – 197 cr v/s 139.45 cr
Net sales – 469.61 cr v/s 380.54 cr
Days BSE NSE
30 424.94 424.71
50 427.93 427.93
150 415.83 416.16
200 384.79 385.09
Important Ratios Simple Moving Average
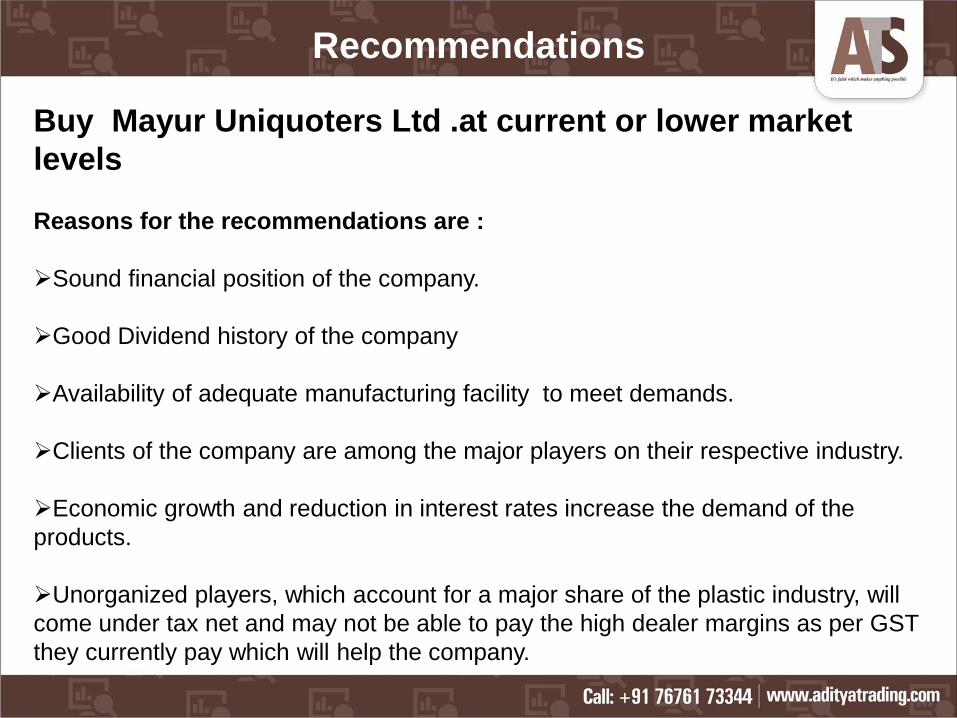
Recommendations
Buy Mayur Uniquoters Ltd .at current or lower market
levels
Reasons for the recommendations are :
Sound financial position of the company.
Good Dividend history of the company
Availability of adequate manufacturing facility to meet demands.
Clients of the company are among the major players on their respective industry.
Economic growth and reduction in interest rates increase the demand of the
products.
Unorganized players, which account for a major share of the plastic industry, will
come under tax net and may not be able to pay the high dealer margins as per GST
they currently pay which will help the company.