atos 2016 annual results9 | atos – 2016 annual results potential visa holder costs and border tax...
TRANSCRIPT

2016 annual results
Bezons February 22, 2017
2 | Atos – 2016 annual results
▶This document contains forward-looking statements that involve risks and uncertainties, including references, concerning the Group's expected growth and profitability in the future which may significantly impact the expected performance indicated in the forward-looking statements. These risks and uncertainties are linked to factors out of the control of the Company and not precisely estimated, such as market conditions or competitors behaviors. Any forward-looking statements made in this document are statements about Atos’ beliefs and expectations and should be evaluated as such. Forward-looking statements include statements that may relate to Atos’ plans, objectives, strategies, goals, future events, future revenues or synergies, or performance, and other information that is not historical information. Actual events or results may differ from those described in this document due to a number of risks and uncertainties that are described within the 2015 Registration Document filed with the Autorité des Marchés Financiers (AMF) on April 7, 2016 under the registration number: D.16-0300 and its update filed with the Autorité des Marchés Financiers (AMF) on August 4, 2016 under the registration number: D.16-0300-A01. Atos does not undertake, and specifically disclaims, any obligation or responsibility to update or amend any of the information above except as otherwise required by law. This document does not contain or constitute an offer of Atos’ shares for sale or an invitation or inducement to invest in Atos’ shares in France, the United States of America or any other jurisdiction.
▶Revenue organic growth is presented at constant scope and exchange rates. Operating margin is presented excluding the amortization of equity based compensation plans and free cash flow is presented excluding proceeds from equity based compensation.
▶Business Units include North America (NAM: USA, Canada, and Mexico), Germany, United-Kingdom & Ireland, France, Benelux & The Nordics (BTN: Belgium, Denmark, Estonia, Finland, Luxembourg, the Netherlands, and Sweden), Worldline, and Other Business Units including Central & Eastern Europe (CEE: Austria, Bulgaria, Croatia, Czech Republic, Greece, Hungary, Italy, Lithuania, Poland, Romania, Russia, Serbia, Slovakia, Switzerland, and Turkey), Iberia (Spain and Portugal), Asia-Pacific (APAC: Australia, China, Hong Kong, India, Indonesia, Japan, Malaysia, New Zealand, Philippines, Singapore, Taiwan, and Thailand), South America (SAM: Argentina, Brazil, Colombia, and Uruguay), Middle East & Africa (MEA: Algeria, Benin, Burkina Faso, Egypt, Gabon, Ivory Coast, Kingdom of Saudi Arabia, Lebanon, Madagascar, Mali, Mauritius, Morocco, Qatar, Senegal, South Africa, Tunisia, and UAE), Major Events, and Cloud & Enterprise Software.
▶Atos decided, as early as upon its acquisition, to retain only a part of the Unify business. As a result, the Software & Platforms business, along with the customers and the countries that were planned to be managed through indirect channels, have been accounted for as discontinued operations since they are in the process of being disposed. Therefore, as Atos is well engaged in the disposal process for the Unify business it has decided to divest, financial KPIs presented in this document reflect only the business of Unify it will ultimately retain, unless otherwise expressly stated. The forward looking statement regarding the Unify business to be potentially disposed of is also provided separately. In the event that the disposal is not concluded at the latest at the release of H1 results, the business to be potentially disposed of will thereafter be integrated and reflected in the KPIs.
Disclaimer

3 | Atos – 2016 annual results
1.2016 key figures, strategy update, and objectives
2.Commercial activity
3.Operational & financial performance
4.Conclusion and Q&A
Agenda
2016 key figures, strategy update & objectives Thierry Breton Chairman & CEO

5 | Atos – 2016 annual results
2016 key figures (1/2)
Revenue
€11.7bn +13% at constant exchange rates
Book to bill
111% vs. 105% in 2015
Order entry
€13.0bn +16% year-on-year
Operating margin
€1,104m +20% year-on-year
Operating margin rate
9.4% +110bps at constant scope
and exchange rates
Organic growth
+1.8% +1.9% in Q4

6 | Atos – 2016 annual results
2016 key figures (2/2)
Net income Group share
€567m +40% year-on-year
Free cash flow
€579m +47% year-on-year
Basic Earnings Per Share
€5.47 +36% year-on-year
OM conversion to FCF
52.5% vs. 43% in 2015
Net cash position
€481m Intact capability to finance
future developments
Total number of employees
100,096 +10% year-on-year
* Including Unify Software & Platforms discontinued operations
*
7 | Atos – 2016 annual results
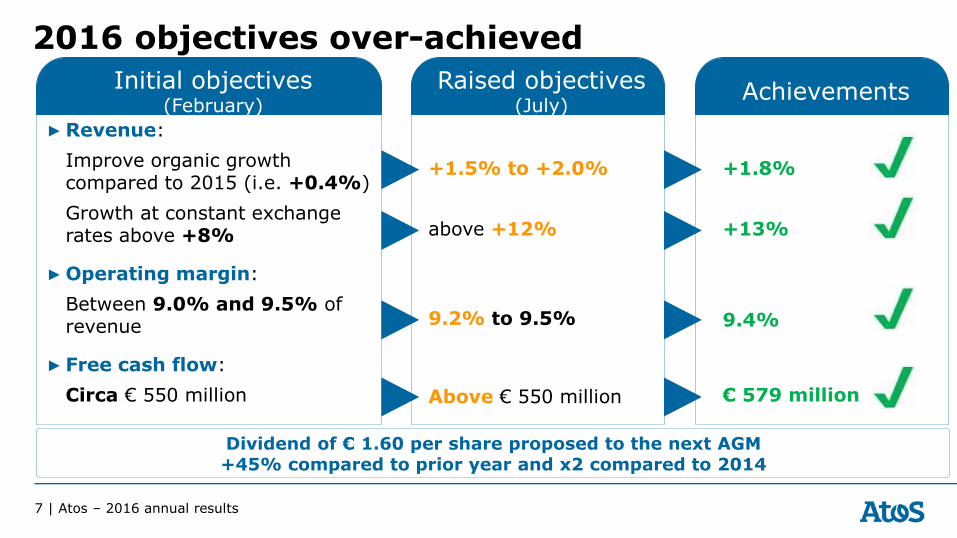
2016 objectives over-achieved
+1.5% to +2.0%
above +12%
9.2% to 9.5%
Above € 550 million
+1.8%
+13%
9.4%
€ 579 million
▶Revenue:
Improve organic growth compared to 2015 (i.e. +0.4%)
Growth at constant exchange rates above +8%
▶Operating margin:
Between 9.0% and 9.5% of revenue
▶ Free cash flow:
Circa € 550 million
Dividend of € 1.60 per share proposed to the next AGM +45% compared to prior year and x2 compared to 2014
Raised objectives (July)
Achievements Initial objectives (February)

8 | Atos – 2016 annual results
Atos position in the new global environment (1/3)
New economic environment
•Expected GDP growth slowdown: Atos protected by multi-year contracts business model •Brexit expected to last >2 years: low exposure to discretionary expenses and Financial Services and naturally hedged to GBP evolution •Large public investment program expected: Atos long term partner of the public/defense sector
•GDP growth improvement expected in Continental Europe •Atos became a “Societas Europaea” (European Company) in 2012 and Atos CEO is the Chairman of the Association of European Companies (ASEP) •Atos not exposed to medium term interest rates increase •Atos positioned to seize increase to 2% of European GDP in Defense and Cybersecurity. Atos CTO chairman of ECSO (European Cyber Security Org.) •Atos CEO co-chaired with SAP’s CEO the European Cloud Partnership
•Positive forecasts on GDP growth •Corporate tax relief •Large US clients served by US teams: 2013: 3,700 US staff 2016: 8,400 US staff
•Atos CEO member of the US “Business Council”
9 | Atos – 2016 annual results
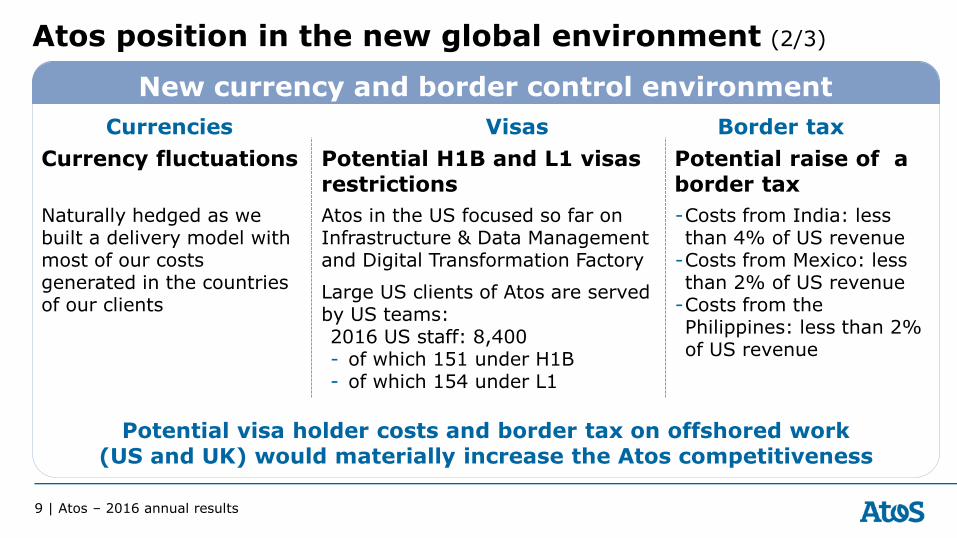
Potential visa holder costs and border tax on offshored work (US and UK) would materially increase the Atos competitiveness
Atos position in the new global environment (2/3)
New currency and border control environment
Currencies
Currency fluctuations Potential H1B and L1 visas restrictions
Potential raise of a border tax
Visas Border tax
Naturally hedged as we built a delivery model with most of our costs generated in the countries of our clients
Atos in the US focused so far on Infrastructure & Data Management and Digital Transformation Factory
Large US clients of Atos are served by US teams: 2016 US staff: 8,400 - of which 151 under H1B - of which 154 under L1
-Costs from India: less than 4% of US revenue
-Costs from Mexico: less than 2% of US revenue
-Costs from the Philippines: less than 2% of US revenue

10 | Atos – 2016 annual results
Atos position in the new global environment (3/3)
New technological breakthroughs
Atos end-to-end offerings perfectly answering client needs
A Group built year after year to reap the high growth of the
digital transformation wave with strong visibility and resilience
A unique fully end-to-end digital transformation model to generate organic
growth while providing significant cost reduction and productivity increase to our
clients Atos Digital Transformation Factory c. 40% of 2019 revenue
Winning market shares with our allies
Atos has built the perfect platform for IT digitization
A technology and partnership focus on cybersecurity and cognitive computing
(Codex), a brand new landscape of growth for our clients

11 | Atos – 2016 annual results
Access to multi-billion yearly R&D spending through an extensive and advanced network of partners

12 | Atos – 2016 annual results
10
11
8
4
12
16
21
27 64
2016 2017e 2018e 2019e 3-yearplan
CloudSAP HANADigital WorkplaceCodexOthers
The Digital Transformation Factory leadership program
Digital transformation certification training (In thousands of certified people)
33
13
8
12
x2
Improved training effort (In thousands of trainings hours)
x2
2016 2019e 2013
2,500
540
1,200

13 | Atos – 2016 annual results
▶ Revenue growth: Circa +6% at constant exchange rates, above +2% organically.
▶ Operating margin: Between 9.5% and 10.0% of revenue.
▶ Free cash flow: Operating margin conversion rate to free cash flow at between 55% and 58%.
2017 objectives: Significant further improvements towards 2019 Ambition

Commercial activity Patrick Adiba Chief Commercial Officer

15 | Atos – 2016 annual results
Commercial activity dashboard
€21.4bn
Backlog
1.8 years of revenue
111%
€6.5bn
Qualified pipeline
6.4 months of revenue
€13.0bn
Book to bill ratio Order entry
+16% year-on-year 119% in Q4

16 | Atos – 2016 annual results
2 064 2 1132 209
2 666
2 4272 514
2 708
3 036
2 757
2 940
2 777
3 244
-1.8% -2.0%
-0,9%
+0.1% +0.2% +0.3% +0.5%+0.4%
+1.6%+1.8% +1.8%
1.9%
-3,0%
-2,0%
-1,0%
0,0%
1,0%
2,0%
3,0%
4,0%
1 200
1 700
2 200
2 700
3 200
Q12014
Q22014
Q32014
Q42014
Q12015
Q22015
Q32015
Q42015
Q12016
Q22016
Q32016
Q42016
Statutory revenue (€m)
Organic evolution %
Integration and restructuring
Sales reorganization
Phase 1 of new business model
An accelerating trend of revenue organic growth driven by the Group commercial dynamism
Phase 2
+2% to
+3% organic growth

17 | Atos – 2016 annual results
2016 revenue performance by market
In € million
% organic
growth
Manufacturing, Retail & Transportation +0.6%
Public & Health +3.8%
Telcos, Media & Utilities +2.1%
Financial Services +0.4%
TOTAL GROUP +1.8%
* At constant scope and exchange rates
35%28%
20%17%
Manufacturing, Retail &
Transportation
Public & Health
Financial Services
Telcos, Media & Utilities

18 | Atos – 2016 annual results
End-to-end digital transformation on time, at specs, at cost
1. Legacy infrastructure to cloud transformation and cloud orchestration
2. Application cloudification, migration and maintenance
3. Enterprise processes to cloud transformation with best in class SAP HANA-bullion appliance
4. Data value creation with cognitive and analytics in Atos Codex
5. Addition of cloud mobility and collaboration platform for connected workforce with Circuit and unified communications
6. End-to-end security of platforms, data and users
7. Monetization of new cloud enabled services with Worldline
Why do we win when leveraging Atos Digital Transformation factory ?

19 | Atos – 2016 annual results
Phase 2 organic growth leveraging Atos Digital Transformation Factory
Sales management
Customer satisfaction
Go-to-market
Net Promoter Score: 50%
Focus on TOP 200 accounts
Phase 1 of new business model (+1% to +2%)
Sales efficiency improvement: incentives, skilling, new tools
Net Promoter Score: 54% coverage extended to 80% of total
revenue
“Account plan as a contract” extended to 80% of total
revenue
Phase 2 (+2% to +3%)
2016: revenue organic growth in all markets

20 | Atos – 2016 annual results
1. Cloud transformation
2. Application cloudification
3. SAP HANA-bullion appliance
4. Atos Codex
5. Collaboration and UC
6. End-to-end security
7. Monetization
Main Q4 wins leveraging Atos Digital Transformation factory
Global industry conglomerate
North American chemicals group
European utility infrastructure
operator
World class public institution
European savings and investments
bank

Operational & financial performance Elie Girard Group CFO

22 | Atos – 2016 annual results
Constant scope and exchange rates figures reconciliation
▶ Scope effect mainly related to Xerox ITO, Unify, Equens, Paysquare, Komerçni Banka Smartpay, and Anthelio
▶ Exchange rates effect mainly coming from the British pound
In € million 2016 2015 % change
Statutory revenue 11,717 10,686 +9.7%
Exchange rates effect -295
Revenue at constant exchange rates 11,717 10,390 +12.8%
Scope effect 1,128
Exchange rates effect on acquired/disposed perimeters -4
Revenue at constant scope and exchange rates 11,717 11,515 +1.8%
Statutory operating margin 1,104 883.7 +24.9%
Equity based compensation reclassification 33.3
Scope effect 73.3
Exchange rates effect -31.3
Operating margin at constant scope and exchange rates 1,104 959.0 +15.1%
as % of revenue 9.4% 8.3%

23 | Atos – 2016 annual results
2016 performance by Division
▶ Positive growth reached every quarter of the year for each of the divisions
▶ Strong margin improvement, €+145 million like-for-like, €+178 million excluding pensions one-off effects
In € million 2016 2015* % organic 2016 2015* 2016 2015*
Infrastructure & Data Management 6,595 6,539 +0.9% 682.9 555.5 10.4% 8.5%
Business & Platform Solutions 3,194 3,169 +0.8% 206.1 199.1 6.5% 6.3%
Big Data & Cybersecurity 666 591 +12.8% 111.9 102.1 16.8% 17.3%
Corporate costs -93.9 -71.1 -0.9% -0.7%
Worldline 1,261 1,216 +3.7% 196.9 173.4 15.6% 14.3%
TOTAL GROUP 11,717 11,515 +1.8% 1,104 959.0 9.4% 8.3%
* At constant scope and exchange rates
Revenue Operating margin Operating margin %

24 | Atos – 2016 annual results
Infrastructure & Data Management
▶ Organic growth and operating margin benefitting from the transition of Atos customers to hybrid cloud infrastructures
▶ Contribution from the successful execution of the large Unify restructuring program
▶ 46,824 direct staff at the end of 2016
30%
21%20%
8%
7%
14%
North America
United-Kingdom &
IrelandGermany
Benelux & The Nordics
France
Other countries
In € million 2016 2015* % organic
Revenue 6,595 6,539 +0.9%
Operating margin 682.9 555.5
Operating margin rate 10.4% 8.5%
* At constant scope and exchange rates

25 | Atos – 2016 annual results
Business & Platform Solutions
▶ Steady top line improvement quarter after quarter fueled by Digital Transformation projects
▶ First phase of margin turn-around thanks to better project and workforce management
▶ 32,577 direct staff at the end of 2016
27%
18%
13%
11%
31%
France
Germany
Benelux & The Nordics
United-Kingdom &
Ireland
Other countries
In € million 2016 2015* % organic
Revenue 3,194 3,169 +0.8%
Operating margin 206.1 199.1
Operating margin rate 6.5% 6.3%
* At constant scope and exchange rates

26 | Atos – 2016 annual results
28%
25%23%
14%
10%
Cloud Apps Build & Deploy
Apps Mgt. Services Multi-Supplier Integr.
SAP HANA Transformation
Atos Cloud Foundry
RedHat Openshift SAP HANA DB
SAP S4 Hana Hybris
Digital Workplace Customer
Experience
Atos Codex Analytics
Internet of Things Industry 4.0
Vertical solutions Transversal features
(Automation, Robotics, Enterprise Platform)
Microsoft O365
Unify Openscape
PEGA
Atos Canopy Compose
Multiple teams around the globe
Organization
Finance Resource management
Global “tower” approach
Project margin tracking
Non billable HC focus
Reactive staffing at signature
Proactive staffing & training
Industrializing Application Services
Multiple systems
Processes & tools
Single system
Savings
Offshore
Rightsizing Automation
Overhead
Delayering

27 | Atos – 2016 annual results
Big Data & Cybersecurity
▶ High revenue and operating margin growth led by a strong demand for state of the art solutions
– Business expansion in new geographies
– Increasing contribution from the private sector
▶ 3,726 direct staff at the end of 2016
In € million 2016 2015* % organic
Revenue 666 591 +12.8%
Operating margin 111.9 102.1
Operating margin rate 16.8% 17.3%
* At constant scope and exchange rates
55%
11%
5%
5%
5%
20%
France
Germany
United-Kingdom &IrelandNorth America
Benelux & The Nordics
Other countries

28 | Atos – 2016 annual results
Worldline
▶ Sustained dynamics of payment businesses
▶ Compensation for two contracts terminated
▶ 8,132 direct staff at the end of 2016 of which circa 1,200 from acquisitions
In € million 2016 2015* % organic
Revenue 1,261 1,216 +3.7%
Operating margin 196.9 173.4
Operating margin rate 15.6% 14.3%
* At constant scope and exchange rates
32%
30%
9%
9%
6%
13%France
Benelux
Germany & CEE
United-Kingdom
Asia & India
Other countries

29 | Atos – 2016 annual results
2016 performance by Business Unit
▶ Germany recovery plan strongly materializing
▶ North America, Worldline, and France fueling revenue growth
▶ UK & Ireland growing 4.5% in H2
▶ Strong operating margin improvement in most of the geographies
In € million 2016 2015* % organic 2016 2015* 2016 2015*
North America 2,061 1,972 +4.5% 240.8 182.9 11.7% 9.3%
Germany 1,954 1,856 +5.3% 200.9 138.7 10.3% 7.5%
United-Kingdom & Ireland 1,790 1,797 -0.4% 238.8 196.7 13.3% 10.9%
France 1,709 1,671 +2.3% 125.4 102.9 7.3% 6.2%
Benelux & The Nordics 986 1,064 -7.3% 71.5 98.4 7.3% 9.2%
Other Business Units 1,956 1,938 +0.9% 127.3 139.4 6.5% 7.2%
Global structures** -97.7 -73.3 -0.9% -0.7%
Worldline 1,261 1,216 +3.7% 196.9 173.4 15.6% 14.3%
TOTAL GROUP 11,717 11,515 +1.8% 1,104 959.0 9.4% 8.3%
* At constant scope and exchange rates
** Global structures include the Global Divisions costs not allocated to the Group Business Units and Corporate costs
Revenue Operating margin Operating margin %

30 | Atos – 2016 annual results
Unify cost synergies and savings generation above initial expectations
Cost base evolution (in € million)
2016 net income of Unify Software & Platforms*: € 11.7 million In line with the objective set at the time of the acquisition
Confirming the € 100 million 2017 EBITDA target and supporting valuation
* Discontinued operations
471
2015
336
2016
Personnel expenses
-29% (-1,098 headcounts)
81
2015
47
2016
IT costs
-43%
35
2015
27
2016
Real estate
-23%
233
2015
204
2016
Other non-personnel costs
-12%
819
2015
613
2016
TOTAL de ces 4 éléments
-25%

31 | Atos – 2016 annual results
2016 headcount evolution
91,322
100,0968,131
17,606 16,963
Headcount as of
31/12/15
Scope Hiring Leavers,
restructuring
& dismissals
Headcount as of
31/12/16

32 | Atos – 2016 annual results
Income statement
In € million 2016 2015 % yoy
Revenue 11,717 10,686 +10%
Operating margin 1,104 917 +20%
% of revenue 9.4% 8.6%
Reorganization, Rationalisation, Integration & acquisition costs -167 -190
Equity based compensation -50 -33
Amortization of intangible assets (PPA from acquisitions) -96 -72
Others 22 -33
Operating income 813 589 +38%
Net financial expenses -49 -45
Profit before tax 764 544 +40%
Tax charge -145 -110
Effective tax rate -19.0% -20.2%
Share of net profit of associates 1 3
Net income 620 437 +42%
Non-controlling interests 53 31
Net income Group share 567 406 +40%

33 | Atos – 2016 annual results
531
36
265
406
567
2014 2015 2016
Net income Group share
Visa share
2.67
4.01
5.47
2.64
3.98
5.44
2014 2015 2016
Basic EPS Group share (in € per share)
Diluted EPS Group share (in € per share)
Net Income and EPS Group share evolution
x2

34 | Atos – 2016 annual results
Cash flow statement
293
393
579
40%43%
52.5%
3.5%
4.5%
5.5%
6.5%
7.5%
8.5%
0
100
200
300
400
500
600
700
2014 2015 2016
Free cash flow
Free cash flow / Operating margin
In € million 2016 2015
OMDA 1,375 1,200
Capital Expenditures -421 -441
Change in working capital requirement -38 49
Cash from operations 915 808
Reorganisation, Rationalisation & Integration -149 -238
Taxes paid -129 -106
Net cost of financial debt paid -18 -17
Other changes -40 -54
Free cash flow 579 393
Net (acquisitions) / disposals -707 -860
Capital increase 28 58
Visa share 36 -
Dividends paid to the owners of the parent -47 -31
Change in net cash -111 -439
Impact of foreign exchange rate fluctuation 0 43
Opening net cash / debt 593 989
Closing net cash 481 593

35 | Atos – 2016 annual results
593
481
+579-707
+28+36
-47 0
Net cash
31/12/15
Free cash flow Net
Acquisitions /
Disposals
Capital
increase
Visa share Dividend
paid
Translation
differences
effect
Net cash
31/12/16
Net cash evolution

36 | Atos – 2016 annual results
▶ Shareholder equity +18%
▶ Gross debt including €600m straight bond and €300m Euro PP
▶ Net pension provision: €1.25bn (c. 75% without funding obligations)
Solid financial structure
Capacity for further development
Simplified balance sheet
Assets Liabilities
Current assets: 3.73
Non-current assets: 2.63
Goodwill: 3.86
Cash: 2.12
Other current liabilities:
4.39
Shareholders’ equity: 4.84
Other non-current liabilities: 1.63
Gross debt: 1.64
31 December 2016 € 13.4 billion
Assets Liabilities
Current assets: 3.17
Non-current assets: 2.44
Goodwill: 3.12
Cash: 1.95
Other current liabilities:
3.93
Shareholders’ equity: 4.10
Other non-current liabilities: 1.30
Gross debt: 1.35
31 December 2015 € 10.7 billion
Assets held for sale: 1.01
Liabilities held for sale: 0.85

37 | Atos – 2016 annual results
9.4%9.2%
9.5%
to
10.0%
-15bps -5bps -35bps +30bps
+25bps
+5bps +30bps
2016 12 month
scope effect
FX effect as of
end of January
2016 pro
forma
Pensions
one-off
Infrastructure
& Data
Management
Business &
Platform
Solutions
Big Data &
Cybersecurity
Worldline 2017e
2016 to 2017 operating margin: forecasted evolution

38 | Atos – 2016 annual results
579
+10
+90
+40
+20 -30 +25 -20
-15-15
2016 Additional2016 FCF
fromacquisitions(pro forma)
2017operating
marginincrease
Pensionsone-offs
replacementby cashmargin
Projectmanagementimprovement
Capexnetof
depreciations
Restructuringdecrease
Equensintegration
Tax Others 2017e
2016 to 2017 free cash flow: forecasted evolution
52.5% OM
conversion to FCF
55% to
58% OM
conversion to FCF

Conclusion and Q&A Thierry Breton Chairman & CEO

40 | Atos – 2016 annual results
Take-aways and main priorities in 2017
Benefiting from the new world environment thanks to our technologic / geographic / business mix
Accelerate catch-up in Business & Platform Solutions
Pursue acquisition strategy creating value for our shareholders with financial discipline
Atos Digital Transformation Factory four our customers increasing the IT spending to digital
Status on Unify Software & Platforms
Expected 2017 perfectly in line with 3-year plan objectives


Atos, the Atos logo, Atos Codex, Atos Consulting, Atos Worldgrid, Worldline, BlueKiwi, Bull, Canopy the Open Cloud Company, Unify, Yunano, Zero Email, Zero Email Certified and The Zero Email Company are registered trademarks of the Atos group. April 2016. © 2016 Atos. Confidential information owned by Atos, to be used by the recipient only. This document, or any part of it, may not be reproduced, copied, circulated and/or distributed nor quoted without prior written approval from Atos.
Thanks