ater';' and ice area expansion - twdb.texas.gov€¦ · a similar report was prepared for...
TRANSCRIPT

...•... ATER';' CONV
AND
ICE AREA EXPANSION
TumerCollie~Braden Inc. Engineers • Planners • Project Managers
March 2000

RECEIVED
MAR 2 72000 TlJCtj M&.?;=
GRANTS MANAGEMENT
PRELIMINARY ENGINEERING FEASIBILITY REPORT TRINITY COUNTY REGIONAL WATER SUPPLY SYSTEM
SURFACE WATER CONVERSION AND SERVICE AREA EXPANSION
PREPARED FOR TRINITY RIVER AUTHORITY OF TEXAS
TC&B JOB NO. 15-46100-001 MARCH 2000
TURNER COLLIE & BRADEN INC. Engineers· Planners· Project Managers

TABLE OF CONTENTS
SECTION
EXECUTIVE SUMMARY
I. INTRODUCTION
General Scope and Objectives Water System Overview TNRCC Criteria Water Transmission System
II. EXISTING FACILITIES
Existing Trinity Plant Facilities Existing HRWSS Plant Facilities Operating Experience at the Trinity Plant Operating Records
III. WATER DEMAND PROJECTIONS AND PLANT CAPACITY
Methodology Water Demand Projections Plant Capacity
IV. PROCESS ALTERNATIVES AND TREATMENT EQUIPMENT
Raw Water Supply Raw Water Quality Finished Water Quality Process Selection Disinfection Evaluation Membrane Technology Recommendations
V. SURFACE WATER PLANT ADDITION AT TRINITY PLANT
Expansion Approach Raw Water Supply Facilities Surface Water Treatment System Finished Water Storage and Pumping Facilities Sludge Handling Facilities
TumerCollie(f1Braden Inc.
Page
I - I I - I 1-2 1-2 1-2
II - I II - I II-2 II-2
III - I III - I III - 3
IV - I IV - I IV - I IV - 2 IV -3 IV - 6 IV - 9
v - I V -I V -2 V -3 V -3

VI. EXPANSION OF HRWSS PLANT AND FINISHED WATER PIPELINE EXTENSION
Expansion Approach Raw Water Supply Facilities Surface Water Treatment System Chemical Feed Systems Finished Water Storage and Pumping Facilities Pipeline Extension
Vll. NEW CENTRALIZED SURFACE WATER PLANT
Location Criteria Raw Water Supply Facilities Surface Water Treatment System Finished Water Storage and Pumping Facilities Sludge Handling Facilities
VllI. FACILITY COSTS
Probable Capital Cost Estimates Anticipated Finished Water Costs Transmission System Costs Probable Membrane System Costs
IX. CONCLUSIONS AND RECOMMENDATIONS
APPENDICES
Appendix A Appendix B Appendix C AppendixD Appendix E
Water Demand Projections SDW A Regulations Summary Water Transmission System Evaluation Plant Operating Records TWDB Review Comments
TurnerCollie(6Braden Inc.
Toe-II
VI -1 VI-I VI-I VI - I VI-2 VI-2
VII - I VII - I VII - 1 VII - 2 VII - 3
VIII - 1 VIII - 1 VIII - 1 VIII - 2

EXHIBITS
Exhibit I Exhibit IA Exhibit 2 Exhibit 3 Exhibit 4 Exhibit 5 Exhibit 6
Location Map TCRWSS Facilities Map Trinity Plant Location Map Trinity Plant Expansion Site Plan Trinity Plant Flow Diagram HRWSS Plant Transmission Line Extension New Plant Location Map
TurnerCollie@Braden Inc.
Toe-II
t

EXECUTIVE SUMMARY
This study was undertaken to investigate modifications and/or alternatives to the current Trinity County Regional Water Supply System (TCRWSS) facilities to convert to surface water due to declining rates of production of the existing well field. Additionally, the study included a review of the feasibility of expanding the service area to include two new customers in addition to the six current TCRWSS customers.
The scope of the study included the evaluation of the following three alternatives:
• Convert the existing TCRWSS plant to a surface water treatment facility with supplemental groundwater supply.
• Obtain finished water from the Huntsville water treatment plant by pipeline transmission.
• Identify potentiallocation(s) for a new TCRWSS surface water plant at a more centralized site in the service area, including the expanded service area created by the addition of the potential two new customers.
To determine the appropriate size for the treatment plant, water demand projections were prepared for the planning year 2010. The surface water plant capacity was based on the following criteria:
• Provide for the projected growth of the service area based on the customer provided rates of growth.
• Comply with the TNRCC 0.6 gpm per connection supply requirement.
For the purposes of this study, the capacity of the surface water plant required to provide water to the six existing customers is 3.5 mgd. For the alternative of adding the two potential customers to the system, the capacity increases to 4.1 mgd. The surface water plant capacity is based on the water demand projections less the contribution of the customer facilities and the existing Trinity Plant (400 gpmlO.58 mgd).
Based on the demonstrated success of conventional treatment technology on the Trinity River water at the TRA Huntsville and Livingston plants, the recommended treatment configuration is clarification followed by filtration and disinfection. An evaluation of membrane technology was performed as part of the process review. Based on the raw water quality in the Trinity River at the Lake Livingston area, membrane treatment is a viable option. Improvement of the raw water quality would be required prior to feeding the membranes. Consideration should be given to further evaluating the membrane option under the preliminary engineering phase of the project.
For the service condition of providing a 3.5 mgd surface water treatment plant to supply the six existing customers, an expansion of the existing Trinity plant is recommended. For the service condition of providing a 4.1 mgd plant to supply the six existing customers and the two potential new customers, a new centralized plant in the Sebastopol area is recommended.
Turner Collie@'Braden Inc.

SECTION I - INTRODUCTION
GENERAL
This report has been prepared pursuant to the Engineering Services Agreement dated April 28, 1999 between the Trinity River Authority of Texas (TRA) and Turner Collie & Braden Inc. (TC&B).
The purpose of the report is to investigate modifications and/or alternatives to the current Trinity County Regional Water Supply System (TCRWSS) facilities to convert to surface water due to declining rates of production of the existing well field. Additionally, the report includes a review of the feasibility of expanding the service area to include two new customers.
A similar report was prepared for a 1.0 mgd expansion of the Trinity plant by TC&B in 1990. This study and report are an extension of the 1990 report.
SCOPE AND OBJECTIVES
This report presents the findings of TC&B' s evaluation of the expansion alternatives for the TCRWSS in accordance with the Basic Engineering Services contained in Article III of the Engineering Services Agreement. The Scope of Work includes the following tasks:
• Collect and evaluate background information related to the project.
• Collect and evaluate facility information at the TCRWSS plant and the Huntsville Regional Water Supply System (HRWSS) plant.
• Evaluate the water treatment equipment and process alternatives for converting the existing TCRWSS plant to a surface water treatment facility with supplemental groundwater supply.
• Evaluate the alternative of obtaining finished water from the HRWSS water treatment plant by pipeline transmission.
• Identify potentiallocation(s) for a new TCRWSS surface water plant at a more centralized site in the service area, including the expanded service area created by the addition of the potential two new customers.
• Evaluate and recommend water treatment equipment and process alternatives for the new facilities identified above.
• Prepare estimates of probable costs for the study alternatives.
• Prepare and present a draft and final Preliminary Engineering Feasibility Report summarizing the findings and recommendations of the study.
Alternatives
Three alternatives are being evaluated to address the required supply capacity proposed for the TCRWSS. These alternatives include the following:
• Expansion of the existing Trinity plant facility.
TurnerCollie@Bradenlnc.

1-2
• Expansion of the HRWSS plant and extension of the transmission pipeline along FM 980 to the Trinity plant.
• New centralized surface water treatment plant.
WATER SYSTEM OVERVIEW
The TCR WSS, which is owned and operated by TRA, supplies potable water to an essentially rural service area northeast of Huntsville, in the southwest portion of Trinity County, Texas. The general location of the TCRWSS is shown in Exhibit 1. The system, which began operation in September 1983, conveys finished water from the existing treatment plant to six existing customers: City of Trinity, City of Groveton, Westwood Shores Municipal Utility District, Trinity Rural Water Supply Corporation, Glendale Water Supply Corporation, and Riverside Water Supply Corporation. These water supply entities receive water into their system storage tanks for subsequent distribution. Several of the individual suppliers have existing water wells or treatment plants that are used as a backup water supply. Exhibit 1A shows the location and size of the TCRWSS components.
The study will also examine the feasibility of expanding the service area to include the Lake Livingston Water and Sewer Service Corporation and the Onalaska Water Supply Corporation.
TNRCC CRITERIA
As required by the Texas Natural Resource Conservation Commission (TNRCC) regulation 30 T AC 290, the supply capacity of the TCRWSS plant is recommended to be at least 0.6 gallons per minute per connection, less the supply capacity of the individual customers. Furthermore, the peak pumping capacity required by TNRCC for the customer's system is at least 2.0 gallons per minute per connection.
For this study, the supply requirement of 0.6 gpm/connection will be used as the basis of determining the capacity of the plant.
The distribution pumping requirement of2.0 gpm/connection will also be determined, but since the pumpage is provided by the individual customers and not TCRWSS no specific details or costs are included in this study for implementation of necessary improvements. This will be the responsibility of each individual customer.
WATER TRANSMISSION SYSTEM
An additional work task was added to the scope of this report to evaluate the water transmission system for the two water plant locations presented herein. The transmission system evaluation is discussed in Appendix C.
Turner Collie (f1Braden Inc.

TRA/TCRWSS SURFACE WATER CONVERSION
FEASIBILITY REPORT
LOCATION MAP
TumerCollie@'BIadenInc. EnglnHrs • Plamers • Project Managers
EXHIBIT: JOB No. 15-46100-001 DATE: OCT., 1999

SECTION II - EXISTING FACILITIES
EXISTING TRINITY PLANT FACILITIES
The TCRWSS treatment plant is located immediately east of State Highway 19, between the cities of Riverside and Trinity. The facilities include an infiltration well field south of the plant site on the banks of Lake Livingston for water supply, with a 16-inch well collection line extending to the plant. The untreated water is metered as it enters the plant. Pre-treatment includes aeration by an induced draft aerator, disinfection using chlorine, and pH adjustment using caustic soda. The water flows by gravity from the aerator tower to a bank of four 10.5 foot diameter filters. Filtered water is collected in a common filtered water chamber and then flows to a 500,000 gallon reinforced concrete clearwell, with fluoridation and post-chlorination accomplished in the interconnecting piping.
The filtered water chamber also provides a source of water for backwashing, which is supplemented as required by a 500 gpm backwash pump that transfers water from the clearwell. Backwash wastewater flows from the filters by gravity to an in-ground, concrete-lined and covered 42,000 gallon backwash settling basin. A self-priming pump adjacent to the backwash basin allows transfer of settled water back to the head of the plant. Piping from the basin sump to a hose connection at grade is provided for removal of settled solids.
Three vertical turbine high service pumps, two rated at 700 gpm and one rated at 350 gpm, take suction from the clearwell and pump finished water to the customers via a pipeline transmission system. Pressure maintenance is provided by continuous operation of the various high service pumps with high pressure bypass to the clearwell.
EXISTING HRWSS PLANT FACILITES
The Huntsville Regional Water Supply System facility is a conventional sedimentation and filtration plant that began operation in 1980. The facility is rated at 8 mgd for potable water production and is currently undergoing an expansion of the Raw Water Pump Station and some plant components to increase the plant capacity to supply 6 mgd process water to a local industry. The raw water source is the Trinity River. The plant is owned and operated by TRA.
The Raw Water Pump Station consists of vertical turbine pumping units that convey water from the river to the plant. Following chemical additions, the raw water is treated in solids contact type clarifiers followed by dual media gravity filters for solids and microbiological contaminant removal. The treated water is stored in a 400,000 gallon clearwell for distribution to the City of Huntsville and the Texas Department of Criminal Justice (TDCJ) Estelle and Ellis Units. The finished water pump station consists of three pumps rated at 1,870 gpm. The pumps are housed in a single story metal building.
The existing HRWSS pipeline to the TDCJ units is a 20 inch ductile iron (class 250) transmission line operating with a pressure of approximately 75 psig leaving the HRWSS plant. The City of Huntsville has a contract with the TDCJ to supply 1.2 mgd to the Estelle and Ellis Units via the 20 inch transmission line.
TurnerCollie(b'Braden Inc.

II - 2
OPERATING EXPERIENCE AT THE TRINITY PLANT
The TCRWSS Plant was placed into operation in September 1983. A review of operation and maintenance (O&M) information supplied by TRA indicates a somewhat variable annual production rate for the plant. For the years 1984-1998, the annual average production was 0.906 mgd, with a peaking factor of about 1.6 (peak day vs average day). Prior to 1988, the annual production rate was in excess of 1.0 mgd; however, during that year Lake Livingston dropped to an historical low, and production capacity from the TCRWSS plant was dramatically reduced as a result of the low lake level. Since that time, even though the production capacity for the plant has recovered, the system operation has never attained to the pre 1988 levels. As production for the plant decreased the O&M cost/1000 gallon increased, demonstrating the effects of various fixed costs. For example, prior to 1988, O&M cost were less than $1.00/1000 gallon while after that year the O&M costs have been around $1.3011 000 gallon. Since the TCRWSS customers are contractually obligated only for minimum debt service charges, reduced water consumption by one party shifts operational and treatment cost to the others.
The most significant operational experience at the TCRWSS plant has been the decline in production capability ofthe well field. The hydraulic limitation of the field became fairly significant in the summer of 1985, when low lake water levels impeded the operation of several wells. This condition was repeated again in the fall of 1988, when the record low level for Lake Livingston (5.75-feet below normal pool elevation) diminished the well field capacity to about 300-400 gpm. The low supply rate contributed to higher water costs for 1988 as described above. This pattern has continued as drought conditions have occurred during succeeding years (i.e., 1996 and 1998).
While there have been several test reports and analyses of the TCRWSS well field, a summary report by R.W. Harden and Associates, Inc. dated March 26, 1986 drew the following conclusion.
"The hydraulic character of the alluvium in and adjacent to the Riverside well field limits the amount of water available to the well field under typical lake level conditions occurring in the last two years to approximate 1 mgd. The well field in its present configuration is not able to provide for future increased water needs. Also, substantially lower lake levels that have occurred in the past may result in a significantly reduced capacity of the well field as would any future decreases in specific capacity of the well."
The Harden report suggested various options that might be explored to restore adequate groundwater supply to the TCRWSS, including recharge channels or infiltration galleries to reinstate the capacity of the existing well field, construction of a supplemental shallow well field approximately twice the size of the existing field, or deep wells (presumably located a significant distance from the TCRWSS plant).
OPERATING RECORDS
Operating records for the three TRA water plants are included in Appendix D.
TurnerColliec9Braden Inc.
SECTION III - WATER DEMAND PROJECTIONS AND PLANT CAPACITY
METHODOLOGY
At the initial project meeting between TRA and TC&B, it was agreed the water study would be prepared based on projected water demands through the year 20 I 0 and the new system would comply with the TNRCC supply criteria of 0.6 gpm per connection.
The service area for the study was the current service area of the six existing customers and the potential two new customers.
For assessing the 2010 requirements, three growth projections were used. The first projection was based on Texas Water Development Board (TWDB) published growth projections for the City customers, and TWDB "county-other" growth rates for the non-City customers. The second projection method was based on telephone conversation input on predicted growth from the customer representatives. The third method was based on a projection of the 1995-1999 average growth reported on a questionnaire completed by each of the customers. The TWDB projected growth for the customers was found to be around 0.5% per year. The 1995-1999 questionnaire average growth rates varied by customer but were generally in the 1.5% to 3.5% range. The customer provided projected growth rates generally fell between the TWDB and the questionnaire rates.
WATER DEMAND PROJECTIONS
After review of preliminary data with the TRA and the customers, the basis for sizing the new surface water plant was determined to be as follows:
• Provide for the projected growth of the service area based on the customer provided rates of growth.
• Comply with the TNRCC 0.6 gpm per connection supply requirement.
The water supply requirements to meet the above criteria are present in Table III-I. Data sheets presenting the customer provided rates of growth and the resulting water demand projections are located in Appendix A.
Distribution pump age to meet the TNRCC 2.0 gpm per connection pumping requirement will be provided by the individual customers through their pumping and distribution systems. The distribution pumpage requirements of each customer are also presented in Table III-I.
TurnerCollie@Bradenlnc.

TABLE 111·1 SUMMARY OF TCRWSS WATER SUPPLY REQUIREMENTS AND
CUSTOMER PUMPAGE REQUIREMENTS
Connection Projection for 2010 Based on Rate of Increase From Discussion with Customer
---- -- - --- --
Number TCRWSS Supply Reqm't Customer Pumpage Reqm't Customer Year Connections in Addition to Current Customer in Addition to Current Customer
Supply (gpm) Pumpage (gpm)
City of Trinity 1999 1740 527 2180 2010 1899 623 2499
Trinity Rural Water Supply Corporation 1999 1120 492 1820 2010 1724 855 3028
Glendale Water Supply Corporation 1999 310 ·3 ·280 2010 410 57 -79
City of Groveton 1999 569 341 1138 2010 601 361 1202
Westwood Shores MUD 1999 604 282 208 2010 950 490 899
Riverside Water Supply Corporation 1999 1456 -30 2032 2010 2105 359 3331
Subtotal Existing Customers 1999 5799 1643 7378 2010 7690 2744 10960
Lake Livingston Water and Sewer Service Corporation 1999 424 254 98 2010 527 316 304
Onalaska Water Supply 1999 1320 55 1800 2010 1473 147 2105
Subtotal Potential New Customers 1999 1744 309 1898 2010 2000 463 2410
Total Existing and Potential New Customers 1999 7543 1952 9276 2010 9690 3207 13369

III - 3
PLANT CAPACITY
Based on the water demands presented above and a joint decision between the TRA and customers to limit the supply of the TCRWSS current well field to 400 gpm (0.576 mgd), the plant capacity was identified as 3.38 mgd for the six existing customers and 4.04 mgd when including the two new potential customers. The plant capacity requirements for 1999 and 2010 are presented in Table 1II-2 and 111-3, respectively.
Service Area
Description
Existing Customers
Potential Customers
Total
TABLEIII-2 SUMMARY OF PLANT CAPACITY REQUIREMENTS
1999 DEMANDS
Current Supply Required to Meet Additional Plant Capacity TCRWSS Supply TNRCC Required to SatisfY Supply
Capacity (See Note 1) Requirement
1050 gpm / 1.51 mgd 1643 gpm / 2.36 mgd 593 gpm / 0.85 mgd
o gpm /0 mgd 309 gpm / 0.45 mgd 309 gpm I 0.45 mgd
1050 gpm / 1.51 mgd 1952 gpm / 2.81 mgd 902 gpm / 1.30 mgd
. . . . Note I. AdditIOnal supply IS TCR WSS component and IS equal to the TNRCC reqUirement less the customer facIlIty contnbutIOn .
Service Area
Description
Existing Customers
Potential Customers
Total
TABLEIII-3 SUMMARY OF PLANT CAPACITY REQUIREMENTS
2010 DEMANDS
Current Supply Required to Meet Additional Plant Capacity TCRWSS Supply TNRCC Required to SatisfY Supply
Capacity (See Note 1) Requirement
400 gpm / 0.58 mgd 2744 gpm / 3.95 mgd 2344 gpm / 3.38 mgd
o gpm/O mgd 463 gpm / 0.67 mgd 463 gpm / 0.67 mgd
400 gpm / 0.58 mgd 3207 gpm / 4.62 mgd 2807 gpm / 4.04 mgd
. . . . Note I. AddItIOnal supply IS TCR WSS component and IS equal to the TNRCC reqUirement less the customer facIlIty contnbutlOn .
TurnerCollie«JBraden Inc.

III - 4
For the purposes of this study, the capacity of the surface water plant facilities required to provide water to the six existing customers is 3.5 mgd with a hydraulic capacity of 5.0 mgd.
For the alternative of adding the two potential customers to the system, the capacity increases to 4.1 mgd with a hydraulic capacity of 5.0 mgd.
The surface water plant capacity is based on the water demand projections less the contribution of the customer facilities and the existing Trinity Plant (400 gpmlO.58 mgd).
Turner Collie (0'Braden Inc.

SECTION IV - PROCESS ALTERNATIVES AND TREATMENT EQUIPMENT
RAW WATER SUPPLY
The raw water source for the proposed surface water expansion is the Trinity River at Lake Livingston. Lake Livingston is a water supply reservoir with a total size of approximately 90,000 acres. The reservoir is impounded by the Livingston Dam and water from the lake is used for municipal and industrial water supply, recreation, and irrigation.
On an average annual basis, the new surface water plant would divert approximately 1,120 acre-feet per year (ac-ftlyr) of water from the Trinity River / Lake Livingston beginning as soon as 2001. The diversion will increase up to approximately 3,920 ac-ftlyr by the year 2010. It is assumed that the TRA currently has sufficient water rights and/or they will purchase them.
RAW WATER QUALITY
The Trinity River / Lake Livingston water is generally considered to be a good quality surface water supply, however turbidity levels are quite variable. Turbidities generally are lower in the eastern end of the lake. The water is also considered to be moderately hard, with total hardness (as CaC03) in the 75 - 150 parts per million (ppm) range. No raw water quality sampling or testing was performed as part of this investigation. Raw water quality data from the HRWSS treatment plant was used for the planned expansion.
FINISHED WATER QUALITY
In general, the finished water quality must meet standards for potability, bacteriological quality, and chemical quality. There are numerous regulations regarding the chemical quality of the finished water that a water treatment plant must meet. The principle regulations are the Safe Drinking Water Act (SDWA) and the Surface Water Treatment Rule (SWTR). Both of these regulations where written by the United States Environmental Protection Agency (EPA) in response to a mandate from Congress to regulate what is, and isn't in, drinking water. A summary of the SDW A regulations is included in Appendix B.
The Safe Drinking Water Act is the regulatory basis for providing a safe and reliable public drinking water supply. This act establishes water quality standards, treatment standards and monitoring requirements that are applicable to this project. The EPA has administrative responsibility for the Safe Drinking Water Act. The EPA establishes specific water quality limits and treatment goals and administers them through their rules. The existing Surface Water Treatment Rule specifies Maximum Contaminant Levels (MCL's) for a broad range of organic and inorganic contaminants. Organic and inorganic chemicals in a water supply pose a threat to the public health. The EPA has established the maximum contaminant level that can be present in drinking water while protecting the public health. The finished water produced by the Trinity WTP must be in compliance with these MCL's.
Turner Collie <f5'Btaden Inc.

IV -2
Potability
Potability are those properties of the finished water that are the most readily noticed and perceived by the customer. They include taste, odor, color, hardness, and clarity (turbidity). The turbidity of the finished water is used as a gross indicator of the performance of the treatment system. Current State regulations require the treatment system to produce water with a turbidity of less than or equal to 0.5 Nephelometric Turbidity Unit (NTU). The EPA passed new regulations in December 1998 that reduces the allowable turbidity to 0.3 NTU.
Bacteriological Quality
Water treated and distributed through a centralized distribution system must be of the highest quality to prevent the outbreak and spread ofwater-bome diseases. Consequently, the total treatment process must achieve at least a 99.9 percent (3-log) inactivation and/or removal of Giardia Lamblia cysts and at least 99.99 percent (4-log) inactivation and/or removal of viruses. Additionally, the water must be disinfected so that it is fecal coliform and Escherichia Coli free. To meet the bacteriological quality, the regulations require a minimum residual of 0.5 mg/l chloramine or 0.2 mg/l free chlorine, depending on disinfectant used.
PROCESS SELECTION
Required Treatment
The previous narrative defines the required finished water quality in terms of specific water quality parameters. The proposed water source, the Trinity River, is widely used as a public water supply. Multiple water providers, including the City of Huntsville use the river and impoundments as a source of drinking water. The raw water contains particulate inert and organic matter that are measured as turbidity, color, and taste. Standard treatment for these parameters includes clarification followed by filtration. Subsequent disinfection processes provide the microbiological protection required by the EPA.
Based on the demonstrated success of this treatment technology on this source water at the TRA Huntsville and Livingston plants, the recommended treatment configuration is clarification followed by filtration and disinfection. The recommended process is proposed to be implemented in the form of pre-engineered reactor clarifiers and filtration units for the following reasons:
• Lower capital costs in comparison to site specific engineered treatment facilities employing flocculation, sedimentation, and filtration.
• Previous successful experience by the TRA with this technology and type of equipment and the desire to use it on this project.
TurnerCollie@Braden Inc.

IV -3
Design Capacity
Section III of this report provided background information on the development of the required plant capacity. In summary, the plant capacity for this project is 3.5 mgd. The intent of this capacity is to serve the maximum daily demand of the system. Delivering the peak day demand means that the treatment plant is sized to deliver the design flow over a period of 24 hours.
DISINFECTION EVALUATION
The purpose of disinfection is to destroy or otherwise inactivate microbiological pathogens including bacteria, cysts, and viruses that have not otherwise been removed in the treatment process. The most widely used disinfection system both historically and today is application of chlorine. The use of chlorine as an effective disinfectant for public water supplies began in the late 1800's to early 1900's. Since the mid-1900's, alternative disinfection systems such as chlorine dioxide, ozone, and chloramines have been developed and have been used effectively in both European and u.S. water treatment plants. UV radiation, bromine, iodine and bromine chloride have also been used as disinfectants, though not to the extent as the disinfectants previously mentioned.
Recent discoveries have shown that, in addition to destroying and deactivating pathogenic microorganisms, chlorine also reacts with natural organic compounds (humic and fulvic acids) and bromides found in surface waters to form trihalomethanes (THMs). The most common THMs are chloroform, dichlorobromomethane, dibromochloromethane and bromoform. THMs, or disinfection by-products (DBPs), if present in significant quantities, can cause cancer in laboratory animals, and as such, may have adverse health consequences for people. As a result, the EPA developed regulations to limit the exposure of populace to DBPs in drinking water. The combination of more stringent regulations and increased awareness of the health effects of chlorinated disinfection by-products has prompted the investigation and use of alternate disinfectants as well as alternate methods of chlorine application to reduce DBP levels.
Current federal drinking water regulations require 99.99% (4-log) removal/inactivation of viruses and 99.9% (3-log) removal/inactivation of Giardia Lamblia. Generally, a combination of both filtration and disinfection is used successfully to achieve a 4-log removal of viruses and a 3-log removal of bacteria. Since most filtration plants are granted a 2-log virus removal credit and a 2.5-log Giardia Lamblia removal credit, the remaining 2-log removal of viruses and 0.5-log removal of Giardia Lamblia must be achieved by disinfection.
Federal regulations had also established a limit of 0.10 mg/L for disinfection by-products, measured as annual average total trihalomethanes (TIHM). But new rules issued by the EPA on December 16, 1998, revised both the disinfection and disinfection by-product standards to provide both additional microbiological protection and reduced exposure to disinfection by-products. The new Enhanced Surface Water Treatment Rule (ESWTR) and the DisinfectantlDisinfection By-Product Rule (DIDBPR) establish a limit of 0.08 mg/L ofTTHM and also a limit of 0.06 for total haloacetic acids (THAA). Public Water Systems that employ conventional filtration and serve 10,000 or more people must comply with the new regulations within 36 months. Based on the service area population
Turner Collie (f1Braden Inc.

IV -4
projections and the proposed process, the Trinity WTP will be required to comply with the new regulations.
The final versions of the ESWTR and D/DBPR were published in Federal Register on December 16, 1998 and included several notable changes to the existing regulations. The most notable changes are summarized as follows:
• The Turbidity Standard was reduced from 0.5 NTU to 0.3 NTU in 95 percent of samples.
• A 2-log removal of Cryptosporidium is required. A 2 log credit is given for well operated plants.
• The TTHM concentration was reduced to 0.08 mg/1.
• The total concentration of5 Haloacetic Acids (THAA's) was established as 0.06 mg/1.
• The maximum concentration of Bromate was limited to 0.01 mg/1.
• Maximum Residual Disinfection Limits were established as follows:
I. Chlorine: 4.0 mglL. 11. Chloramine: 4.0 mglL 1Il. Chlorine Dioxide: 0.8 mglL
The EPA has defined a promulgation date of 2002 for an another set of rules to further revise the above standards. Proposed revisions include a reduction in the TTHM limit to 0.04 mgIL and a more stringent Cryptosporidium standard. The selection of equipment for the Trinity WTP is based on the revised ESWTR and DIDBPR rules rather than the potential regulations because the long-term rules are very tentative and may, or may not, come to fruition in 2002.
The TNRCC recognizes the following four disinfectant alternatives: chlorine, chloramines, chlorine dioxide and ozone. Chlorine disinfection refers to the application of gaseous chlorine or liquid bleach resulting in the formation of free chlorine species to destroy harmful microorganisms. Chloramines utilized in disinfection are formed by the combination of chlorine and ammonia in the treated water and thus requires a dual feed system. Chlorine dioxide is typically generated on site and is dosed in a manner similar to chlorine dosing. Like chlorine dioxide, ozone is generated on-site but is dosed using a specially designed reactor with a short contact time. Because ozone cannot be used as a residual disinfectant, chloramines are typically used in conjunction with ozone as the primary disinfectant to maintain a residual in the distribution system. A comparison of the four disinfectant alternatives is presented in Table JV-J.
TurnerCollie@Braden Inc.

Disinfectant Strength-Giardia Lamblia
Disinfectant Strength-Viruses
By Products:
- THM Formation
- Others
Ease of Operation
Required Contact Time
Used for Residual Disinfectant in Distribution System
Capital Cost
Operating Cost
TABLE IV-l
DISINFECTANT COMPARISON
Chlorine Dioxide Ozone Free Chlorine
Excellent (as Excellent Excellent HOC!)
Excellent (as
Excellent Excellent HOC!)
Yes Unlikely Unlikely Chlorinated Chlorinated Aldehydes, and oxidized aromatic aromatic intermediates, compounds, carboxylic acids, chloramines chlorate, chlorite phthalates and
chlorophenols
Difficult, yet Moderate Gas: Moderate manageable Liquid: Easy
Moderate Short Moderate
No-Alternate Yes Required Yes
Low for Ozone,
High Considering Additional Residual Disinfection
High System Moderate
High High Low
SOURCE: National Academy of Science (1980), EPA (1981), Lawrence et al. (1980).
TurnerCollie(9Braden Inc.
IV -5
Chloramine
Moderate
Low (Good at long contact times)
Unlikely
Unknown
Moderate
Long
Yes
Moderate
Moderate

IV - 6
Since chlorine dioxide and chloramines are currently successfully used at the Huntsville and Livingston plants, they have been selected for the Trinity expansion. Since the four disinfectants discussed here are not totally effective against Cryptosporidium (which may be regulated in the next 5 years), a change in process may be required if Cryptosporidium becomes regulated.
CT Compliance Program
The Surface Water Treatment Rule requires conventional water treatment plants using surface waters to achieve a 3-log (99.9%) removal/inactivation of Giardia Lamblia cysts and a 4-log (99.99%) removal/inactivation of viruses between a point where the raw water is not subject to recontamination by surface runoff and a point upstream of the first consumer. The first consumer for the Trinity WTP is the plant itself(water is used for potable uses inside the plant). Therefore, all disinfection must be accomplished prior to finished water pumping.
The SWTR Guidance Manual allows conventional treatment plants using filtration to take a 2.5-log removal/inactivation credit for Giardia Lamblia and a 2-log removal/inactivation credit for viruses. The remaining removal/inactivation (O.5-log for Giardia and 2-log for viruses) is accomplished by the combination of contact time and disinfectant residual concentration and is commonly referred to as CT. CT is the residual concentration (in mg/l) multiplied by the time (in minutes) that the disinfectant is in contact with the water. The time used in calculating CT is the time that 90 percent of the water will be exposed to disinfection and is referred to as TIO. TIO is calculated based on theoretical detention times at maximum operating flows and baffling factors from the SWTR Guidance Manual. The SWTR Guidance Manual defines the required CT as a function of inactivation ratio, water temperature, water pH, type of disinfectant, and type of organism (Giardia or viruses). This requirement will be addressed during the design phase of the project.
MEMBRANE TECHNOLOGY
Currently, the recommended treatment process for the Trinity water treatment plant generally consists of coagulation, clarification, filtration, and disinfection with chlorine compounds. Although the conventional treatment process is capable of meeting the current project goals, several trends have occurred in the water treatment industry that warrant further investigation because of their possible application to this project. The trends are fueled by new regulations and consumer demands. Anticipated future regulations combined with lower quality source water may render conventional plants incapable of providing the necessary treatment without significant modification in the future. The necessary modifications are usually add-on processes that result in both increased cost and increased overall process complexity and potentially a decrease in process reliability.
The new technologies in use and under development attempt to address the existing and anticipated needs of water treatment utilities in an economical manner. Membranes are one such technology. Membrane technology uses selectively permeable membranes to remove impurities from water. There are four general classes of membranes: 1) microfiltration, 2) ultrafiltration, 3) nanofiltration, and 4) reverse osmosis. Micro- and ultrafiltration membranes are classified as low-pressure
TurnerCollie@Bradenlnc.

IV -7
membranes «100 psi operating pressure) while nanofiltration and reverse osmosis are classified as high-pressure (>100 psi operating pressure), diffusion-controlled membranes.
The type of membrane dictates the selectivity ofthe process. Microfiltration with a pore size range of 0.1 to 5.0 microns provides a barrier to particles larger than 0.5 microns. Microfiltration is capable of removing most bacteria and both Giardia and Cryptosporidium cysts but is generally incapable of removing viruses, colloids, including many color forming compounds, or dissolved solids. However, microfiltration will remove these smaller particles to the extent the smaller particles are associated with larger diameter particles of a size able to be removed by the membrane. In general, low quality source water applied to microfiltration membranes should be pretreated to remove most of the suspended solids. Such reduction in the solids content reduces the likelihood that the membrane will clog and will reduce the chlorine demand of the treated water.
Ultrafiltration with a pore size range of 0.002 to 0.1 microns removes all particles greater than or equal to roughly 0.01 microns. Thus, ultrafiltration is capable of removing some colloids, including some color contributing colloidal particles, bacteria, most viruses and some organic compounds. Just as in microfiltration, low quality source water should be pretreated to reduce rapid clogging of the ultrafiltration membrane.
Nanofiltration membranes with nominal pore sizes of 0.00 1 microns provide a positive barrier to almost all viruses, all bacteria, and colloids and color forming compounds while retaining some ions in the treated water. The smaller pore size of nanofiltration membranes lends to a greater degree and frequency of clogging. The smaller pore size also decreases the permeate flux (treated water production rate), and increases the backwash frequency.
Reverse osmosis (RO), the highest pressure and most selective of the four membrane types, is capable of removing ions of low molecular weights, bacteria, colloids and viruses and produces permeate continually without the need to backwash. However, the water treated with an RO membrane must be of very high quality to deter membrane fouling. As such, significant pretreatment is generally required. Oftentimes, pretreatment for RO membranes includes inline microfiltration or ultrafiltration units to increase productivity and efficiency. In general, the high operating pressure and small pore size contribute to more rapid membrane degradation. As such, the life of an RO membrane is significantly less than micro filtration and ultrafiltration membranes. RO membranes must typically be replaced every 2-5 years depending upon the composition of the membrane.
Further evaluation ofnanofiltration and reverse osmosis (high pressure systems) for treatment of Trinity River water is not deemed prudent at this time because neither technology is suited to direct treatment of the raw water source. Therefore, further evaluation and discussion will focus on lowpressure, micro-and ultrafiltration membrane technologies.
Relative to solids in the raw water, Trinity River would be considered a good quality raw water source, however turbidity levels are quite variable. As such both micro filtration and ultrafiltration membrane technologies are suitable for use in treating Trinity River raw water. However, raw water data available at this time indicates elevated levels of color. Neither microfiltration nor ultrafiltration
TurnerCollie@Braden Inc.

is effective at consistently removing color in raw water without the addition of chemical pretreatment.
IV - 8
Another consideration in the use of micro- and ultrafiltration to treat Trinity River water is that the application of membrane treatment processes is vendor and raw water specific. This means that membrane performance for a particular raw water will vary with each brand of membrane. Therefore, specific membrane evaluations can only be made through pilot or full-scale studies using the proposed membrane or membranes to treat the actual raw water source. The TNRCC requires pilot plant studies prior to the use of membranes for the production of potable water.
Potential Membrane Advantages
In general, for high quality, low-turbidity waters, membrane technology can be used for direct treatment and thus avoid extensive pretreatment processes and simplify the treatment scheme. However, direct treatment of surface waters with elevated levels of color, TOC, and/or other contaminants will usually require some form of pretreatment. Depending on the source water, pretreatment mayor may not include pre-filtration, pH adjustment, preoxidation, and coagulation/sedimentation. Pretreatment for membrane technologies generally requires fewer treatment chemicals and smaller doses of those chemicals when compared to traditional water treatment plants. As a result, the product water from a traditional water treatment plant contains higher levels of treatment chemicals than does the product water from membrane plants. Also, since fewer chemicals are applied to membrane processes as compared to conventional process, the quantity of solids to be processed in the waste streams is reduced.
Because of their small pore size, micro- and ultrafiltration membrane systems effectively remove pathogens from the treated water. Microfiltration and ultrafiltration membranes generally achieve full log removal of Giardia and I-log to 3-log removal of viruses. However, regulatory agencies including the TNRCC adhere to a multiple barrier approach to ensure the health and welfare of the public. As such, full pathogen removal credits are not granted to membrane systems at this time. As such, disinfectants must still be used to obtain the remainder of the required removal as well as to maintain the required disinfectant residual in the distribution system. Generally, the amount of additional disinfectant is less than that required by a conventional water treatment plant. Consequently, membrane systems will not form disinfection by-products as readily as conventional treatment processes.
Other potential advantages with membrane technology are a smaller footprint, modularity of design, simple operation, and a higher degree of automation. These advantages contribute to both lower land and operation costs and facilitate treatment plant expansion.
Potential Membrane Disadvantages
While membrane technologies have many advantages, they also have potential problems. The problems that must be addressed in applying membrane technology to water treatment plants include membrane fouling, possible formation and management of a concentrated liquid waste stream, comparable to higher capital costs than conventional treatment, and membrane integrity monitoring.
TurnerCoIlie@Bradenlnc.

IV -9
RECOMMENDATIONS
For this study, conventional treatment using pre-engineered units similar to the HRWSS plant is recommended. Based on the final number of customers served by the plant, the plant capacity, and the time available for implementation of the new plant, the option of membrane technology should be further evaluated. This further evaluation should occur under the preliminary engineering phase of the project.
TurnerCollie@Bradenlnc.

SECTION V - SURFACE WATER PLANT ADDITION AT TRINITY PLANT
EXPANSION APPROACH
For purposes of this evaluation, the existing TCRWSS groundwater supply and treatment facilities are assumed to remain functional and to have a rated capacity of 400 gpm (0.576 mgd). The plant upgrade would consist of a parallel, surface water treatment train designed in accordance with current TNRCC criteria. The surface water system was generally modeled after the HRWSS plant, given the similar raw water quality and considering TRA's operating experience and historical data from that facility. Information on the configuration of the Huntsville plant was supplied by TRA personnel and supplemented by a site visit and discussions with the HRWSS plant staff.
The existing TCRWSS aerator,fiIters, and associated piping were assumed to remain "dedicated" to the existing groundwater treatment train and were not considered integrable with a new surface water addition. The parallel treatment trains would be joined at the existing c1earwell and existing high service pumps and related facilities would need to be compatible with the total finished water production capability of the upgraded plant. Other existing facilities, including the control/service building, chemical storage and feed equipment, and site improvements, would be integrated with the surface water train, if practical. Assumptions for utilization of these items are presented in this section.
RAW WATER SUPPLY FACILITIES
The selection of a potential raw water intake location and design of the associated facilities is one of the most critical aspects of this evaluation. The construction cost of this component is a significant portion of the overall surface water upgrade cost. Further, these costs are highly variable, depending on the actual physical characteristics of the river at the intake site, configuration of the intake and pump station facilities, and routing of the raw water pipeline to the TCRWSS plant.
Criteria for selection of a suitable raw water intake site include proper access to the main river channel at a location that is within a reasonable distance from the existing plant site. An initial review of the riverfront in the vicinity of the TCRWSS plant was performed using topographic maps and potential sites were subsequently reviewed in the field. Two locations were identified close to the plant site. The first raw water intake site is located just downstream of a south-to-west bend in the river, approximately 1,200 feet north-northeast of the existing plant. The second location is across Highway 19 from the plant at the site of what appears to be a drainage slough off the main river channel. Costs for the two locations will be similar. The final decision of which location to select may be based on property acquisition considerations. The location of the potential raw water pump stations is shown on Exhibit 2.
Given the potential for large, floating objects during flood events, a submerged water intake piped to a raw water pump station on the adjacent bank is preferred over a floating pump station or in-river structure. The water intake would be located several feet below the lowest expected water level and protected by a trash screen. Multiple intake points at various levels may be required and should be evaluated in the design phase. The pump station would consist of a reinforced concrete sump with
TurnerCollie@Braden Inc.

V -2
submersible pumps. Ancillary items would include an access road, electrical service and controls. A 16-inch-diameter raw water pipeline would be constructed across State Highway 19 and the Missouri Pacific railroad, then southwest to the plant. The State is currently widening State Highway 19. During the design phase, the selected raw water pump station location and pipeline configuration must be carefully coordinated with the State. If the water plant is expanded beyond it's 3.5 mgd capacity, a second parallel raw water line would be required.
Pertinent topographic information for the potential raw water pump station and existing treatment plant sites as shown on Exhibit 2 is as follows:
• Trinity River Normal Water Surface Elevation 131 ft.
• Potential RW Pump Station Site Elevation 150 ft.
• Alternate RW Pump Station Site Elevation 140 ft.
• TCRWSS Plant Site Elevation = 144 ft.
SURFACE WATER TREATMENT SYSTEM
The surface water facility would generally consist of raw water flow measurement and control; chemical addition and in-line mixing; flocculation and sedimentation occurring in the proposed clarifier basin; additional chemical treatment, as required, following sedimentation; filtration; disinfection; and transfer to storage in the existing clearwell. Raw sludge from the clarifier and backwash wastewater solids would be pumped to lagoons for decanting and long term storage prior to disposal.
Given the relatively small size of the TCRWSS plant, pre-engineered treatment equipment is the most economical approach for the clarifier and filter units for this facility. Two water treatment equipment manufacturers (lnfilco-Degremont Inc. (101) and US Filter) were contacted through local representatives for recommendations and budget estimates for clarification and filtration equipment for the TCRWSS upgrade. The responses from 101 and US Filter were similar in concept, configuration, and cost of the equipment and were used as the basis for site layout and probable construction costs. Both manufacturers offer circular, solids-contact type clarifiers with flocculation and settling zones combined in one basin. Two reactor clarifier costs have been obtained from the manufacturers. One for welded steel tanks, including equipment, and the second for equipment only. For the second condition of equipment only, concrete basins will be constructed for each unit. The cost of concrete basins is included in the cost estimate presented in Section VIII.
Filtration facilities would consist of multi-cell, dual media units with concrete basins. Two new backwash pumps would be required, with piping and valving provided to take water from the clearwell through the existing 18-inch suction piping and discharge to the backwash system at the new filters. Backwash wastewater would be piped from the filters to the existing backwash settling basin. The settling basin would be modified to allow variable decant and recycle of clarified
TurnerCollie@'Braden Inc.

'----,..C,.,.L-POTENTIAL RAW WATE PUMP STATION
PROPOSED 16" RAW WATER PIPELINE
TRINITY PLANT LOCATION MAP
TumerCollie@,BradenInc. Engine.,.! • Plamers • Project Managers
2 JOB No. 15-46100-001 CATE: OCT., 1999
C)
~ N I X w
a a

V -3
backwash water. A backwash wastewater transfer pump would pump settled solids from the basin sump to new sludge lagoons.
Treatment of surface water will require the addition of several chemicals not currently used at the TCRWSS plant, including alum and polymer for coagulation, lime for alkalinity adjustment, carbon for taste and odor, and chlorine dioxide and ammonia. New chemical metering pumps and storage tanks would be required for the surface water train. The existing chlorination and caustic systems will remain dedicated to the existing groundwater plant.
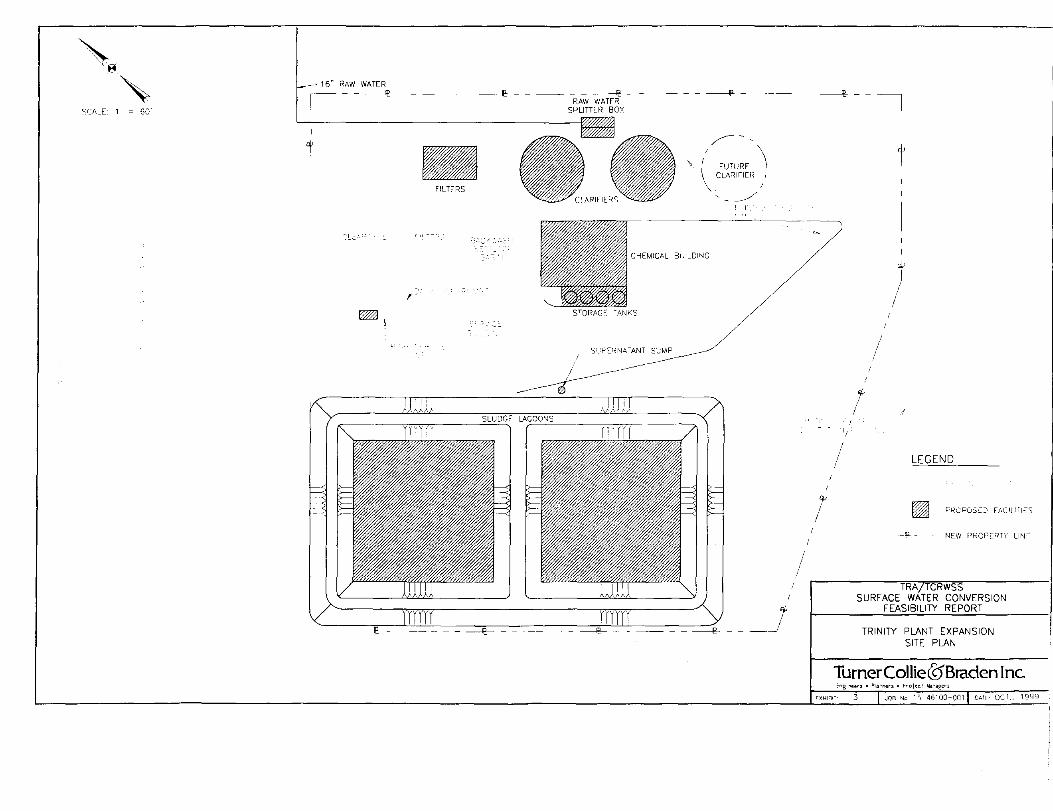
Each of the new chemicals require storage facilities and feed equipment, the latter preferably located indoors for protection from the elements. Given the limited space available in the existing TCRWSS building and the configuration of the site, a new chemical building would be added with the surface water upgrade. In addition to the new chemical feed systems, the building would house much of the electrical and motor control equipment associated with the plant expansion. Outdoor storage tanks will be required for alum and aqueous ammonia and should be located adjacent to the plant roadway to facilitate truck unloading. The physical location of the chemical building and other surface water treatment components is shown in Exhibit 3. The flow diagram for the upgraded plant is shown in Exhibit 4. Component sizing criteria are presented in Table V-I located at the end of this section.
FINISHED WATER STORAGE AND PUMPING FACILITIES
The existing c1earwell, with a total volume of 500,000 gallons, is adequate for the expanded plant. There are three existing high service pumps, two rated for 700 gpm and the third rated for 350 gpm, providing a "firm" capacity of 1,050 gpm, or approximately 1.5 mgd. The high service pump station should be upgraded to a firm capacity of approximately 4.0 mgd to be compatible with the production capability of the improved TCRWSS plant. Two new vertical turbine pumps with a nominal rating of at least 1,200 gpm are required. The new pumps would be located adjacent to the existing units, with suction and discharge piping extended accordingly. Final pump selection during design phase will depend on an analysis of the distribution system and required operating pressures.
SLUDGE IIA.J.~DLING FACILITIES
Raw sludge from the clarifier and settled solids from the backwash settling basin would be pumped to new lagoons for water volume reduction and storage. Two lagoons of earthen dike construction would be provided, with an area of about 0.6 acres each. Each lagoon would be fitted with inlet feed and takeoff piping, the latter consisting of a "swing joint" or similar device for variable level decanting. The decant or supernatant from the lagoons would flow to a sump for subsequent pumped recycle to the beginning of the surface water treatment train. Operation of the lagoons would alternate with one lagoon in continuous operation until filled when the second lagoon would be placed into service. Disposal of lagoon sludge would be on a contract basis, as has been the practice at the Huntsville plant.
TurnerCollie<9Braden Inc.

., z o , , .,
SUPERNATANT
SLUDCr-:
BACKWASH WASTE
w
" o
" ~
SUPERNATANT
':""
L.J
LEGEND
~ PRQPCSEQ ~-'''C _IT ::.._
SLUDGE TO D'SPOSAL
TRA/TCRWSS SURFACE WATER CONVERSION
FEASIBILITY REPORT
PLANT FLOW DIAGRAM
TumerCollie<£)Braden Inc. [ng'~"e'5 • Plannec, • Projcc' ~"ageC\
EXH!BIT JOB _'10. 15- l 610Q-QO\ I lJA'l OC-:-" 1999
~. '~
~ SC!\~.L " 60'
-- '6" RAW WATER r------
'I
':1....:::'
~\
- - -- - - --- - - -- - - -- - - --"I' - - -- - - --'e- - - I RAW WATER
SPLITTER BOX
~-,
" / \ \ FUTURE \ l' \ CLARIFIER I
I
/' FILTERS
r '( ,:-,
;-STQRA,GF: TANKS
I
/
- - ---'I'-- - - . -- -. - __ 1
/
/
1
/
/
l
) /
.1
LEGEND
~ PRCPOSCJ Fi\CIU11~S
-lP- - NEW PRC~TqTY LlN~
r-------------~TDR·A'/9T~rcRmWu~~~~-------------
TRINITY PLANT EXPANSION SITE PLAN
TumerCollie@'BradenInc.

TABLE V-I
FACILITIES DESIGN SUMMARY SURFACE WATER TREATMENT ADDITION AT TRINITY PLAl~T
1. Plant Capacity
Design Maximum Hydraulic Capacity
2. Raw Water Pump Station
Number of Pumps Rated Capacity, each Station Capacity, finn Pipeline to Plant
3. Clarifier
Type Number of Units Total Detention Time Net Surface Area Rise Rate Reaction Zone Detention Time
4. Filters
Type Number of Cells Total Surface Area Filter Rate
5. Clearwell
Existing Size Increase Capacity
6. Filter Backwash Pumps
Backwash Rate Pump Rate
TurnerCollie@Bradenlnc.
3.5 mgd/2,431 gpm 5.0 mgd/3,472 gpm
3 1,225 gpm 2450 gpml3.5mgd 16 inch
Reactor Clarifier 2 2.9 hours 1,859 square feet 0.93 gpmls.f. 60 minutes
Dual Media 4 808 s.f. 3.0 gpmls.f.
500,000 gallons None
20 gpmls.f. As required by mfr.
V -4

V-5
7. Clarifier Sludge Tranllfer fumll~
Average Sludge Production 17,sOO~d Maximum Sludge Production 35,000 gpd Number of Pumps 2 Rated Capacity, each 300 gpm
8. Sludge Lagoons
Number of Lagoons 2 Volume per Lagoon 958,000 gallons
9. Supernatant ReQ~d!:: £lIml2ll
Maximum Supernatant Return 60,000 gpd Number of pumps 2 Rated Capacity, each 80 gpm
10. Water DilltributjQD £lIml2~
Number of Existing Pumps 3 Rated Capacity, P-l and P-2 700 gpm Rated Capacity, P-3 350 gpm Number of Proposed Pumps 2 Rated Capacity, P-4 and P-5 1,200 gpm HSPS Capacity, firm 2950 gpm/4.2 mgd
II. Alum Feed S~st!::m
Type 48% solution Average Dosage 75 mg/l Number of Pumps 2 Pump Rate 1-100 gph Storage Tank Volume . 20,000 gallons/30 days
12. Caustic Feed S~llt!::m
Type 50% solution Average Dosage 50 mg/l Number of Pumps 2 Pump Rate 1-65 gph Storage Tank Volume 7,500 gallons/30 days
13. CQagulant Aid ~QI~er Fe~d S~stem
Type liquid, cationic Average Dosage 2mg/l Number of Feed Units 2
TurnerCollie@'Sradenlnc.

V -6
Polymer Feed Rate 0.04-1.2 gph Storage Drums 55 gallons
14. Filter Aid Pol)1!!er Feed Sj::stem
Type liquid, anionic Average Dosage 1.5 mg/l Number of Feed Units 2 Polymer Feed Rate 0.04-1.0 gph Storage Drums 55 gallons
15. Activated Carbon Feed Sj::stem
Type dry powder Maximum Dosage 10 mg/l Day Tank Capacity 2 @ 500 gallons each Number of Pumps 2 Pump Rate 1-100 gph
16. Ammonia Feed Sj::stem
Type aqueous, 28% solution Average Dosage 0.7 mg/I Number of Pumps 2 Pump Rate 0.05 - 3 gph Storage Tank 500 gallons/30 days
17. Lime Feed Sj::stem
Type dry powder Average Usage 160lbs/day Day Tank Capacity 200 gallons Number of Pumps 2 Pump Rate 0-25 gph
18. FerrQus Chloride Feed Sj::stem
Type agueous, 39% solution Average Dosage 20 mg/I Number of Pumps 2 Pump Rate 0-15 gph Storage Tank 7,500 gallons/30 days
TurnerCollie@'BradenInc

19. Chlorine
Type Average Dosage Maximum Usage
20. Chlorine Dioxide
Type A verage Dosage Maximum Usage
TumerCollie~Braden Inc.
V -7
gas supply, solution feed 1.0 mg/l 1701bs/day
solution feed 2.0 mg/l 85lbs/day

SECTION VI - EXPANSION OF HRWSS PLANT AND FINISHED WATER PIPELINE EXTENSION
EXPANSION APPROACH
To supply the 3.5 mgd required for the TCRWSS, several areas of the HRWSS plant require expansion and/or improvement. The plant is currently rated at 6 mgd average and 8 mgd peak. The current rated plant capacity is committed to supplying existing customers. An expansion is underway at the plant to provide process water for a local industry. This expansion will not provide additional capacity for the TCR WSS. A review was conducted of each major process at the plant to identify where expansion would be required to supply water to TCRWSS. Four major areas of expansion were identified: raw water supply, treatment equipment, chemical feed systems, and finished water storage and pumping. Component sizing criteria for the expansion equipment are included in Table VI-I located at the end of this section.
RAW WATER SUPPLY FACILITIES
An additional raw water supply pump would be required at the raw water pump station. A 2780 gpm (4.0 mgd) vertical turbine unit is recommended to match the equipment planned under the current expansion. In order to maintain current system operating pressures in the raw water system, the existing 30 inch raw water line would require a parallel line to convey the additional flow to the plant. A parallel 20 inch raw water line is required to maintain similar operating pressures.
SURFACE WATER TREATMENT SYSTEM
The plant's three reactor clarifiers, each rated at 4.6 MOD, are dedicated to existing customers. A new fourth clarifier would be required for the TCRWSS demand. A unit similar to the existing units is planned. Similarly, the gravity filters are dedicated to existing customers and a new filter unit would be required for the TCRWSS demand. A four cell covered unit is planned. Other components of the treatment system (backwash pumps, sludge handling pumps, storage lagoons) are considered adequate for the addition of the TCRWSS demand.
CHEMICAL FEED SYSTEMS
A review of the current chemical feed systems identified expansions or additions would be required for the following systems:
• Alum (feed pumps and storage tank) • Caustic (feed pumps and storage tank) • Coagulant Aid Polymer (feed pumps and storage tank) • Ammonia (feed pump) • Chlorine (500 lb/day unit) • Chlorine Dioxide (modify existing equipment)
TumerCollie@Bradenlnc.

The other chemical systems (activated carbon, lime, and ferrous chloride) are adequate for the planned expansion.
FINISHED WATER STORAGE AND PUMPING FACILITIES
VI-2
The existing 400,000 gallon clearwell requires an additional 175,000 gallons to comply with TNRCC criteria. A reinforced concrete clearwell structure would be located adjacent to the existing clearwell. Two additional high service pumps each rated at 2400 gpm would be required to pump the expansion flow. The pumps would be housed in a metal building similar to the existing pump station.
PIPELINE EXTENSION
In order to convey the treated water from the HRWSS plant to the TCRWSS plant, an extension is required of the finished water transmission line that currently conveys water to the TDCJ units along FM 980. In sizing the line, the TDCJ demand used for this study was 1.2 mgd per the TDCJ contract with the City of Huntsville.
Several line sizes and flow rates were evaluated as part of this study. In order to maintain similar operating pressures in the line for 3.5 mgd, a 14 inch extension would be required from the current end of the line at the Ellis Unit to the Trinity plant. System pressures in the 20 inch 114 inch line would need to be increased by approximately 10 psig to accommodate the increased flow. To provide 5.0 mgd capacity, an 18 inch extension is required with no adjustment to current system operating pressures. The length of the pipeline extension is approximately 32,000 feet.
An 18 inch line is recommended for the transmission line extension. The route of the 18 inch line is shown in Exhibit 5.
Pertinent topographic information for this alternative as shown on Exhibit 5 is as follows:
•
•
•
•
•
•
Trinity River Normal Water Surface Elevation
HRWSS Raw Water Pump Station Elevation
HR WSS Plant Site Elevation
Existing 20" Pipeline - N. G. Elevation at entrance to Ellis Unit
Proposed 18" Pipeline - N. G. Elevation at Riverside
TCRWSS Plant Site Elevation
TurnerCollie@'Bradenlnc.
= 131 ft.
154 ft.
= 265 ft.
= 200 ft.
= 190 ft.
144 ft.

,
/'";~
__ ..a1.]
.r.:;'."
, ?:-~~~~,
'"
-.
.-

TABLE VI-l
FACILITIES DESIGN SUMMARY EXPANSION OF HRWSS PLANT AND
FINISHED WATER PIPELINE EXTENSION
1. Plant Capacity
Design Maximum Hydraulic Capacity
2. Raw Water Pump Station
Number of Pumps
3.5 mgdl2,431 gpm 5.0 mgdl3,472 gpm
1 2780 gpml4.0 mgd
VI-3
Rated Capacity (match current expansion sizes) Current Pipeline to Plant Additional Pipeline to Expand to 3.5 mgd
30 inch, reach of 36 inch 20 inch
3. Clarifier
Type Number of Units Total Detention Time Net Surface Area Rise Rate Reaction Zone Detention Time
4. Filters
Type Number of Cells Total Surface Area Filter Rate
5. Clearwell
Existing Size Increase Capacity
6. Filter Backwash Pumps
Backwash Rate Pump Rate
TurnerCollie@Bradenlnc.
Reactor Clarifier 2 2.9 hours 1,859 square feet 0.93 gpm/s.f. 60 minutes
Dual Media 4 808 s.f. 3.0 gpmls.f.
500,000 gallons 175,000 gallons
20 gpmls.f. As required by mfr.

VI-4
7. Clarifier Sludge Transfer Pumps
Expansion Requirement None (gravity flow)
8. Sludge Lagoons
Number of Current Lagoons 3 Expansion Requirements None
9. Supernatant Rec~cIe Pumps
Expansion Requirements None
10. Water Distribution Pumps
Number of Existing Pumps 3 Rated Capacity Existing Pumps 1,870 gpml2.7 mgd Number of Proposed Pumps 2 Rated Capacity, P-4 and P-5 2,400 gpml3.5 mgd each
11. Alum Feed S~stem
Type 48% solution Average Dosage 75 mg/I Number of Pumps 2 Pump Rate 1-100 gph Storage Tank Volume 20,000 gallons/30 days
12. Caustic Feed S~stem
Type 50% solution Average Dosage 50 mg/I Number of Pumps 2 Pump Rate 1-65 gph Storage Tank Volume 7,500 gallons/30 days
13. Coagulant Aid Pol~mer Feed S~stem
Type liquid, cationic Average Dosage 2 mg/I Number of Feed Units 2 Polymer Feed Rate 0.04-1.2 gph Storage Drums 55 gallons
14. Filter Aid Pol:aner Feed S~stem
Expansion Requirements None
TurnerCollie0Braden Inc.

VI-5
15. Activated Carbon Feed System
Expansion Requirements None
16. Ammonia Feed System
Type aqueous, 28% solution Average Dosage 0.7 mg/l Number of Pumps 1 Pump Rate 0.05 -3 gph Storage Tank Expansion Requirement None
17. Lime Feed System
Expansion Requirements None
18. Ferrous ChlQride Feed System
Type agueous, 39% solution Average Dosage 20 mg/I Expansion Requirements None
19. Chlorine
Type gas supply, solution feed Average Dosage 2.0 mg/I Expansion Requirements 500 Ib/day unit
20. Chlorine DiQxide
Type solution feed A verage Dosage 1.0 mg/l Expansion Requirements Minor equipment
upgrades
Turner CoIlie(0'Braden Inc.

SECTION VII - NEW CENTRALIZED SURFACE WATER PLANT
LOCATION CRITERIA
The location of a new centralized surface water plant was evaluated based on the addition of the two potential customers on the east side of the TCRWSS service area and the benefit gained by the addition of a second pressure distribution point to the system. Two potential locations were identified, one south of Sebastopol and the second along FM 356 at White Rock Creek. The locations of the two potential sites are shown on Exhibit 6.
Pertinent topographic information for the potential raw water pump station and the proposed treatment plant sites as shown on Exhibit 6 is as follows:
• Trinity River Normal Water Surface Elevation = 131 ft.
• Proposed RW Pump Station Site Elevation 150 ft.
• Proposed Water Plant Site Elevation = 200 ft.
• Alternate RW Pump Station Site Elevation = 150 ft.
• Alternate Water Plant Site Elevation 170 ft.
RAW WATER SUPPLY FACILITIES
A new raw water supply facility similar to the station proposed under the Trinity plant expansion would be required. Due to site elevations, the White Rock Creek station would be similar in operating head to the station proposed at the Trinity plant. The Sebastopol station would require a higher head pump to accommodate the higher plant elevation.
A submerged water intake piped to a raw water pump station on the adjacent bank is preferred over a floating pump station or in-river structure. The water intake would be located several feet below the lowest expected water level and protected by a trash screen. Multiple intake points at various levels may be required and should be evaluated in the design phase. The pump station would consist of a reinforced concrete sump with submersible pumps. Ancillary items would include an access road, electrical service and controls. A 16-inch-diameter raw water pipeline would be constructed across country to the plant. A waterline easement would be required for the raw water line.
SURFACE WATER TREATMENT SYSTEM
A system similar to the Trinity plant expansion is proposed for the new plant. The surface water facility would generally consist of raw water flow measurement and control; chemical addition and in-line mixing; flocculation and sedimentation occurring in the proposed clarifier basin; additional chemical treatment, as required, following sedimentation; filtration; disinfection; and transfer to
TumerCollie<9Braden Inc.

VII-2
storage in the existing clearwell. Raw sludge from the clarifier and backwash wastewater solids would be pumped to lagoons for decanting and long term storage prior to disposal. The flow diagram for the upgraded plant is similar to the Trinity Plant expansion alternative as shown in Exhibit 4, except there are no existing facilities. Component sizing criteria are presented in Table VIJ-J located at the end of this section.
Given the relatively small size of the TCRWSS plant, pre-engineered treatment equipment is the most economical approach for the clarifier and filter units for this facility. Two water treatment equipment manufacturers (Infilco-Degremont Inc. (IDI) and US Filter) were contacted through local representatives for recommendations and budget estimates for clarification and filtration equipment for the TCRWSS upgrade. The responses from IDI and US Filter were similar in concept, configuration, and cost of the equipment and were used as the basis for site layout and probable construction costs. Both manufacturers offer circular, solids-contact type clarifiers with flocculation and settling zones combined in one basin. Two reactor clarifier costs have been obtained from the manufacturers. One for welded steel tanks, including equipment, and the second for equipment only. For the second condition of equipment only, concrete basins will be constructed for each unit. The cost of concrete basins is included in the cost estimate presented in Section VIII.
Filtration facilities would consist of multi-cell, dual media units with concrete basins. Two backwash pumps would be required, with piping and valving provided to take water from the c1earwell and discharge to the backwash system at the new filters. Backwash wastewater would be piped from the filters to a backwash settling basin. The settling basin would allow variable decant and recycle of clarified backwash water. A backwash wastewater transfer pump would pump settled solids from the basin sump to new sludge lagoons.
Treatment of surface water will require the addition of several chemicals not currently used at the TCRWSS plant, including alum and polymer for coagulation, lime for alkalinity adjustment, carbon for taste and order, and chlorine dioxide. New chemical metering pumps and storage tanks would be required for the surface water train.
Each of the new chemicals require storage facilities and feed equipment, the latter preferably located indoors for protection from the elements. A new chemical building is planned. In addition to the new chemical feed systems, the building would house the plant electrical and motor control equipment. Outdoor chemical storage tanks would be located adjacent to the plant roadway to facilitate truck unloading.
Jar tests and/or a pilot study of the clarifier and filter units may be necessary to obtain information for final design.
FINISHED WATER STORAGE AND PUMPING FACILITIES
A new clearwell and high service pump station would be required with the new plant. A 500,000 gallon concrete c1earwell is proposed with a 3.5 mgd high service pump station. Either vertical
TumerCollie@'Bradenlnc.

i;""~~,j'C; .. ",~~ PROt;OS£O"l;:~'r'./,o, .. ,A. .ALlER.· .. NArff.:1£'. ~,~j)~i;:-:' , RAW WATERLINE" • ", RAW, WAljll "'h:.-i)1
-::....-TO TRINITY
_FV »'.
Loi!!' 2r SCALE IN tu:r
\
, ' :~~~ATlON • , ';...'~.'.' .,' "':"l "
1_\,' ,.-,,-"-. -,',. ";,. r .. ,;,:.." " '. .:--"111:. :$iNArs' ... ,' '.' " " P\:AN't 'SI;;,t' { I;,' ,", " 'f(, "",
-.~'-~: 8~::."~"':·<:" .e
~.t{:~'. ~ "",'<,\ }"" ~,.,.~' '\~\ , '
",_1'\, J .. ,J. f;C~""·'''·t ...
'-f
"
-T r" •• -! ,- ..s " ,.
".
j
I '.: 'J
'"i-
. I
r" I
, I'
i CHITA Y
/· ~ ___ ; >'.' .TO
~~11
/
I j
I
/ '/
I
:' .. ~~-:. ~~ '.
., .,..
,~
I-"'''}'
",.>1
,'I
;.14· r'a"'l .h..,1,;,
'.~~' ~~' i ~ ,. ,
f..Tr«k
c ... ,tk-
.~
"'<
,~
" , " "
',r.>?
i i ,
.-' ;1
'-'r .
"
I,
'\ ..... ", '
",
, TO
:", 'i,g.N.AlAS.. KA, ,; \. )'
') '\ j. ,
1RAITCRWSS SURFACE WATER CONVERSION
FEASIBIUlY REPORT
NEW PLANT LOCATION MAP
TurnerCollie@'BJadenInc EngrllMl"& • Planner' • ProJlICt tenogrl
EXHIBIT: 6 JOB 1«1. 15-46100-0011 CATE: OCT., 1999

VII-3
turbine or horizontal split case pumps would be used for high service. The selection would be made during final design based on the required discharge pressure of the plant.
SLUDGE HANDLING FACILITIES
New sludge facilities would be required for the plant. Raw sludge from the clarifier and settled solids from the backwash settling basin would be pumped to new lagoons for water volume reduction and storage. Two lagoons of earthen dike construction would be provided, with an area of about 0.6 acres each. Each lagoon would be fitted with inlet feed and takeoff piping, the latter consisting of a "swing joint" or similar device for variable level decanting. The decant or supernatant from the lagoons would flow to a sump for subsequent pumped recycle to the beginning of the surface water treatment train. Operation of the lagoons would alternate with one lagoon in continuous operation until filled when the second lagoon would be placed into service. Disposal of lagoon sludge would be on a contract basis, as has been the practice at the Huntsville plant.
Turner Collie <f1Braden Inc.

VII-4
TABLE VII-l
FACILITIES DESIGN SUMMARY NEW CENTRALIZED SURFACE WATER PLANT
1. Plant Capacity
Design Maximum Hydraulic Capacity
2. Raw Water Pump Station
Number of Pumps Rated Capacity, each Station Capacity, firm Pipeline to Plant
3. Clarifier
Type Number of Units Total Detention Time Net Surface Area Rise Rate Reaction Zone Detention Time
4. Filters
Type Number of Cells Total Surface Area Filter Rate
5. Clearwell
Size
6. Filter Backwash Pumps
Backwash Rate Pump Rate
7. Clarifier Sludge Transfer Pumps
Average Sludge Production Maximum Sludge Production Number of Pumps Rated Capacity, each
Turner Collie (0'Braden Inc.
3.5 mgd/2,431 gpm 5.0 mgd/3,472 gpm
3 1,225 gpm 2450 gpml3.5mgd 16 inch
Reactor Clarifier 2 2.9 hours 1,859 square feet 0.93 gpmls.f. 60 minutes
Dual Media 4 808 s.f. 3.0 gpmls.f.
500,000 gallons
20 gpmls.f. As required by mfr.
17,500 gpd 35,000 gpd 2 300 gpm

VII- 5
8. Sludge Lagoons
Number of Lagoons 2 Volume per Lagoon 958,000 gallons
9. SUQernatant Recxcle PumQs
Maximum Supernatant Return 60,000 gpd Number of pumps 2 Rated Capacity, each 80 gpm
10. Water Distribution PumQs
Number of Pumps 3 Rated Capacity 1,215 gpm HSPS Capacity, firm 2430 gpm/3.5 mgd
11. Alum Feed Sxstem
Type 48% solution Average Dosage 75 mg/l Number of Pumps 2 Pump Rate 1-100 gph Storage Tank Volume 20,000 gallons/30 days
12. Caustic Feed Sxstem
Type 50% solution Average Dosage 50 mg/l Number of Pumps 2 Pump Rate 1-65 gph Storage Tank Volume 7,500 gallons/30 days
13. Coagulant Aid Polxmer Feed Sxstem
Type liquid, cationic Average Dosage 2 mg/I Number of Feed Units 2 Polymer Feed Rate 0.04-1.2 gph Storage Drums 55 gallons
14. Filter Aid Polxmer Feed Sxstem
Type liquid, anionic Average Dosage 1.5 mg/l Number of Feed Units 2 Polymer Feed Rate 0.04-1.0 gph Storage Drums 55 gallons
TurnerCollie(9Braden Inc.

VII- 6
15. Activated Carbon Feed S:r:stem
Type dry powder Maximum Dosage 10 mg/I Day Tank Capacity 2 @ 500 gallons each Number of Pumps 2 Pump Rate 1-100 gph
16. Ammonia Feed S:r:stem
Type aqueous, 28% solution Average Dosage 0.7 mg/I Number of Pumps 2 Pump Rate 0.05 -3 gph Storage Tank 500 gallons/30 days
17. Lime Feed System
Type dry powder Average Usage 160lbs/day Day Tank Capacity 200 gallons Number of Pumps 2 Pump Rate 0-25 gph
18. Ferrous Chloride Feed S:r:stem
Type agueous, 39% solution Average Dosage 20 mg/I Number of Pumps 2 Pump Rate 0-15 gph Storage Tank 7,500 gallons/30 days
19. Chlorine
Type gas supply, solution feed Average Dosage 1.0 mg/l Maximum Usage 170lbs/day
20. Chlorine Dioxide
Type solution feed Average Dosage 2.0 mg/l Maximum Usage 85lbs/day
TurnerCollie@'Braden Inc.

SECTION VIII - FACILITY COSTS
PROBABLE CAPITAL COST ESTIMATES
This section presents the probable capital cost estimates for the three expansion alternatives based on conventional treatment. The capital cost estimates include engineering, land acquisition, administrative costs, and facility construction plus a 20 percent contingency. The engineering costs include surveying, geotechnical investigations, preliminary engineering, and final design. Estimated land acquisition costs were assumed to be $10,000 per acre. Construction costs were developed using bid tabulations for similar projects, equipment manufacturer's budget estimates, and conceptual estimating based on unit prices obtained from RS Means, 1999.
The probable capital cost estimate for a 3.5 mgd surface water plant addition at the existing Trinity plant is presented in Table VIII-I. The estimated project cost is $6,760,000 or $1.93 per gallon. If the plant capacity is increased to 4.1 mgd to service the two new potential customers, then the estimated project cost is $7,900,000.
The probable capital cost estimate for a 3.5 mgd expansion ofthe HRWSS plant and extension of the FM 980 transmission pipeline is presented in Table VIII-2. The estimated project cost is $11,283,000 or $3.22 per gallon
The probable capital cost estimate for a new 3.5 mgd centralized surface water plant is presented in Table VJJI-3. The estimated project cost is $7,754,000 or $2.22 per gallon. If the plant capacity is increased to 4.1 mgd to service the two new potential customers, then the estimated project cost is $9,100,000.
ANTICIPATED FINISHED WATER COSTS
The TRA operates two surface water plants in the Lake Livingston area, the HRWSS plant and the Livingston Regional Water Supply System (LRWSS) plant. The current finished water costs for the plants are $1.3711000 gallons and $1.88/1000 gallons, respectively. Although the raw water quality at the Trinity plant location is expected to be similar to the raw water quality experienced at the HRWSS plant, the Trinity plant would be smaller and the high service pumps would operate at a higher pressure requiring additional power. The anticipated finished water costs for the new Trinity plant are expected to be similar to the costs experienced at the LRWSS plant.
TRANSMISSION SYSTEM COSTS
In addition to the cost for a plant expansion or a new plant, there may be costs for improvements to the finished water transmission system to convey the increased water capacity required by the expansion from the plant to the customers. The transmission system improvements for the Trinity and HRWSS expansion alternatives would be the same. The transmission system improvements for a new plant in the Sebastopol area may be more extensive than the improvements for the Trinity plant since the new location is at the end of the current system where the line sizes are the smallest.
TumerCollie(dSraden Inc.

VIII - 2
An evaluation of the transmission system was not included in the current scope of work. The transmission system requirements will require evaluation in subsequent phases ofthe project.
PROBABLE MEMBRANE SYSTEM COSTS
The option of using a membrane treatment system was discussed in Section IV. Based on the raw water quality in the Trinity River at the Lake Livingston area, a membrane system is a viable option. Based on manufacturer's budget cost data provided by IDI and US Filter, the equipment membrane component of the plant would be approximately $3,500,000. Based on a review of Trinity River water by two membrane manufacturers, improvement of the raw water quality would be required prior to feeding the membranes. However, since no data is currently available on the specific improvements required for the raw water, an allowance for chemical additions was the only process included in the cost for the membrane system. The probable capital cost of a membrane system is estimated to be in the order of$7,000,000 to $8,000,000. For this option a minimum three month pilot study is recommended to provide information necessary for a full scale design.
TurnerCollie(b'Sraden Inc.

VIII - 3
TABLE VIII-l PROBABLE CAPITAL COST ESTIMATE
3.5 MGD EXPANSION OF THE TRINITY PLANT
DESCRIPTION ESTIMATED COST Raw Water Intake and Pump Station $700,000 Raw Water Pipeline $145,000 Clarifier $820,000 Filter $855,000 Sludge Handling Facilities $100,000 Chemical Systems $925,000 Finished Water Distribution $130,000 Electrical and Instrumentation/Controls $500,000 SiteworklMiscellaneous $550,000
Subtotal Project Cost $4,725,000
Contingency (20 percent) $945,000
Engineering $850,000
Land Acquisition $45,000
Total Capital Cost $6,565,000
Legal and Administrative Fees (3 percent) $195,000
TOTAL PROJECT COST $6,760,000
TurnerCollie@'Braden Inc.

TABLE VIII - 2 PROBABLE CAPITAL COST ESTIMATE
3.5 MGD EXPANSION OF THE HRWSS PLANT
DESCRIPTION ESTIMATED COST Raw Water Pump Station $92,000 Raw Water Pipeline $1,656,000 Clarifier $785,000 Filter $855,000 Sludge Handling Facilities $0 Chemical Systems $175,000 Finished Water Distribution $368,000 Electrical and Instrumentation/Controls $100,000 SiteworklMiscellaneous $240,000
Subtotal Plant Project Cost $4,271.000
FM 980 Pipeline Extension $3,670,000
Subtotal Project Cost $7,941,000
Contingency (20 percent) $1,588,000
Engineering $1,429,000
Land Acquisition $0
Total Capital Cost $10,958,000
Legal and Administrative Fees (3 percent) $325,000
TOTAL PROJECT COST $11,283,000
Turner Collie <9Braden Inc.
VIII - 4
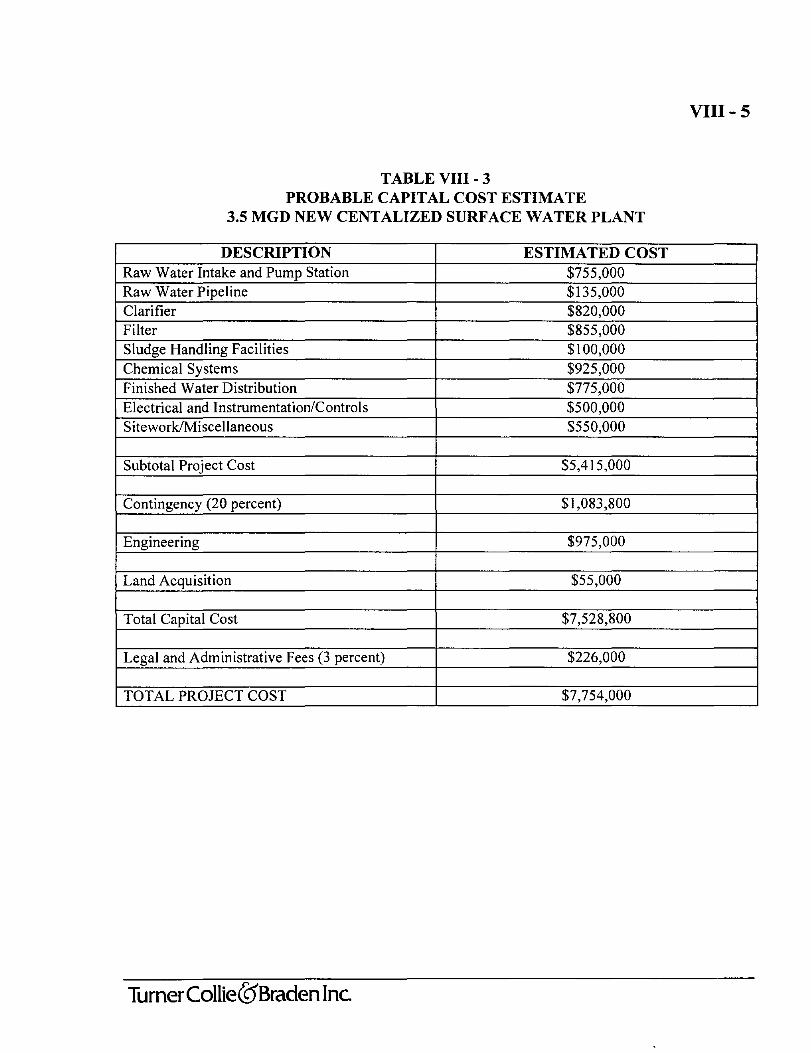
VIII - 5
TABLE VIII - 3 PROBABLE CAPITAL COST ESTIMATE
3.5 MGD NEW CENTALIZED SURFACE WATER PLANT
DESCRIPTION ESTIMATED COST Raw Water Intake and Pump Station $755,000 Raw Water Pipeline $135,000 Clarifier $820,000 Filter $855,000 Sludge Handling Facilities $100,000 Chemical Systems $925,000 Finished Water Distribution $775,000 Electrical and Instrumentation/Controls $500,000 SiteworklMiscellaneous $550,000
Subtotal Project Cost $5,415,000
Contingency (20 percent) $1,083,800
Engineering $975,000
Land Acquisition $55,000
Total Capital Cost $7,528,800
Legal and Administrative Fees (3 percent) $226,000
TOTAL PROJECT COST $7,754,000
TurnerColliec9Braden Inc.

SECTION IX - CONCLUSIONS AND RECOMMENDATIONS
Based on the probable capital cost estimates presented in Section VIII for the three alternatives, the HRWSS plant expansion and pipeline extension alternative is not considered a viable alternative due to the high construction cost. The costs for a raw water pipeline addition and the approximate six mile extension of the transmission line from the Ellis Unit to the Trinity plant are the primary components contributing to the higher cost for this alternative.
The capitol costs for the other two alternatives are fairly similar. The size of the two facilities and the treatment equipment would be approximately the same for either location. The raw water quality in the Sebastopol areas may be better than the Trinity location since turbidity levels are reported to be lower on the east side of the lake. It is expected that the distribution system improvements would be more costly for a Sebastopol location than a Trinity location. The major advantage to the Sebastopol location would be providing service to the two potential new customers. It would also provide a second pressure distribution point for the system which would improve overall system operation.
For the service condition of providing a 3.5 mgd plant to supply the six existing customers, an expansion of the existing Trinity plant is recommended. Note that this alternative may require improvements to the distribution system and those costs are not addressed in this study.
For the service condition of providing a 4.1 mgd plant to supply the six existing customers and the two potential new customers, a new centralized plant in the Sebastopol area is recommended. Note that this alternative will require improvements to the distribution system and those costs are not addressed in this study.
TurnerCollie(O'Braden Inc.

APPENDIX A
WATER DEMAND PROJECTIONS
TurnerCollie©'Braden Inc.

9130/99
Water Supply and Distribution Pumpage Analysis Customer City of Trinity TNRCC Supply Requirement: 0.6 gal per min per connection (total) TNRCC Pumpage Requirement: 2.0 gal per min per connection (total)
Connections Served
Year I 1995 1996 1997 1998 1999 Connections 1 1665 1672 1680 1705 1740 % Increase in ConnlYear 0.420 0.478 1.488 2.053
Customer Requested Growth Projection 0.80% Projected Increase in Connections 2000 - 2010 159 Total Projected Connections Year 2010 1899
Water Supply Requirements Current TNRCC Customer
Number Supply .6gpm Shortfall--Year Conn By Customer per conn TCRWSS
(gpm) Provides (gpm 1999 1740 517 1044 527 2010 1899 517 1140 623
Water Pumpage Requirements Current TNRCC Customer
Number Pumpage 2.0gpm Shortfall--Year Conn By Customer per conn Customer
(gpm) Provides (gpm 1999 1740 1300 3480 2180 2010 1899 1300 3799 2499
Appendix A - , of 8
For Reference Only TWDB Questionnaire Growth Growth
Projection Projection 0.50% 1.11%
98 225 1838 1965
Trinlly

9130/99
Water Supply and Distribution Pumpage Analysis Customer Trinity Rural Water Supply Corporation TNRCC Supply Requirement: 0.6 gal per min per connection (total) TNRCC Pumpage Requirement: 2.0 gal per min per connection (total)
Connections Served
Year I 1995 1996 1997 199B Connections I 825 900 1093 1094 % Increase in ConnlYear 9.091 21.444 0.091
1999 1120 2.377
Customer Requested Growth Projection 4.00% Projected Increase in Connections 2000 • 2010 604 Total Projected Connections Year 2010 1724
Water Supply Requirements Current TNRCC Customer
Number Supply .6gpm Shortfall-Year Conn By Customer per conn TCRWSS
(gpm) Provides (gpm 1999 1120 1BO 672 492 2010 1724 180 1035 855
Water Pumpage Requirements Current TNRCC Customer
Number Pumpage 2.0gpm Shortfall·· Year Conn By Customer per conn Customer
(gpm) Provides (gpm 1999 1120 420 2240 1B20 2010 1724 420 3448 3028
Appendix A • 2 of 8
For Reference Only TWDB Questionnaire Growth Growth
Projection Projection 0.50% 8.25%
63 1559 1183 2679
TRWSC

9/30/99
Water Supply and Distribution Pumpage Analysis Customer Glendale Water Supply Corporation TNRCC Supply Requirement: 0.6 gal per min per connection (total) TNRCC Pumpage Requirement: 2.0 gal per min per connection (total)
Connections Served
Year I 1995 1996 1997 1998 1999 Connections I 280 290 299 304 310 % Increase in ConnlYear 3.571 3.103 1.672 1.974
Customer Requested Growth Projection 2.58% Projected Increase in Connections 2000 - 2010 100 Total Projected Connections Year 2010 410
Water Supply Requirements Current TNRCC Customer
Number Supply .6gpm Shortfall --Year Conn By Customer per conn TCRWSS
(gpm) Provides (gpm) 1999 310 189 186 -3 2010 410 189 246 57
Water Pumpage Requirements Current TNRCC Customer
Number Pumpage 2.0gpm Shortfall--Year Conn By Customer per conn Customer
(gpm) Provides (gpm 1999 310 900 620 -280 2010 410 900 821 -79
Appendix A - 3 of 8
For Reference Only TWDB Questionnaire Growth Growth
Projection Projection 0.50% 2.58%
17 100 327 410
Glendale

9130/99
Water Supply and Distribution Pumpage Analysis Customer City of Groveton TNRCC Supply Requirement: 0.6 gal per min per connection (total) TNRCC Pumpage Requirement: 2.0 gal per min per connection (total)
Connections Served
Year I 1995 1996 1997 1998 1999 ConnectionsJ 514 536 547 562 569 % Increase in ConnNear 4.280 2.052 2.742 1.246
Customer Requested Growth Projection 0.50% Projected Increase in Connections 2000 - 2010 32 Total Projected Connections Year 2010 601
Water Supply Requirements Current TNRCC Customer
Number Supply .6gpm Shortfall-Year Conn By Customer per conn TCRWSS
(gpm) Provides (gpm 1999 569 0 341 341 2010 601 a 361 361
Water Pumpage Requirements Current TNRCC Customer
Number Pumpage 2.0gpm Shortfall--Year Conn By Customer per conn Customer
(gpm) Provides (gpm 1999 569 0 1138 1138 2010 601 a 1202 1202
Appendix A • 4 of B
For Reference Only TWDB Questionnaire Growth Growth
Projection Projection 0.50% 2.58%
32 184 601 753
Groveton

9/30/99
Water Supply and Distribution Pumpage Analysis Customer Westwood Shores MUD TNRCC Supply Requirement: 0.6 gal per min per connection (total) TNRCC Pumpage Requirement: 2.0 gal per min per connection (total)
Connections Served
Year 1 1995 1996 1997 1998 1999 Connections I 527 544 564 588 604 % Increase in ConnlYear 3.226 3.676 4.255 2.721
Customer Requested Growth Projection 4.20% Projected Increase in Connections 2000 - 2010 346 Total Projected Connections Year 2010 950
Water Supply Requirements Current TNRCC Customer
Number Supply .6gpm Shortfall--Year Conn By Customer per conn TCRWSS
(gpm) Provides (gpm 1999 604 80 362 282 2010 950 80 570 490
Water Pumpage Requirements Current TNRCC Customer
Number Pumpage 2.0gpm Shortfall--Year Conn By Customer per conn Customer
(gpm) Provides (gpm 1999 604 1000 1208 208 2010 950 1000 1899 899
Appendix A - 5 of 8
For Reference Only TWDB Questionnaire Growth Growth
Projection Projection 0.50% 3.47%
34 275 638 879
Westwood Shores MUD

9/30/99
Water Supply and Distribution Pumpage Analysis Customer Riverside Water Supply Corporation TNRCC Supply Requirement: 0.6 gal per min per connection (total) TNRCC Pumpage Requirement: 2.0 gal per min per connection (total)
Connections Served
Year I 1995 1996 1997 1998 1999 Connections I no data 1317 1354 1421 1456 % Increase in ConnlYear 2.809 4.948 2.463
Customer Requested Growth PrOjection 3.41% Projected Increase in Connections 2000 - 2010 649 Total Projected Connections Year 2010 2105
Water Supply Requirements Current TNRCC Customer
Number Supply .6gpm Shortfall-Year Conn By Customer per conn TCRWSS
(gpm) Provides (gpm 1999 1456 904 874 -30 2010 2105 904 1263 359
IWater Pumpage Requirements Current TNRCC Customer
Number Pumpage 2.0 gpm Shortfall-Year Conn By Customer per conn Customer
(gpm) Provides (gpm 1999 1456 880 2912 2032 2010 2105 880 4211 3331
Appendix A - 6 of 8
For Reference Only TWDB Questionnaire Growth Growth
Projection Projection 0.90% 3.41%
151 649 1607 2105
Riverside WSC

9/30/99
Water Supply and Distribution Pumpage Analysis Customer Lake Livingston Water and Sewer Service Corporation TNRCC Supply Requirement: 0.6 gal per min per connection (total) TNRCC Pumpage Requirement: 2.0 gal per min per connection (total)
Connections Served
Year I 1995 1996 1997 1998 1999 Connections I 530 508 592 525 424 % Increase in ConnlYear -4.151 16.535 -11.318 -19.238
Customer Requested Growth Projection 2.00% Projected Increase in Connections 2000 - 2010 103 Total Projected Connections Year 2010 527
Water Supply Requirements Current TNRCC Customer
Number Supply .6gpm Shortfall-Year Conn By Customer per conn TCRWSS
(gpm) Provides (gpm 1999 424 0 254 254 2010 527 0 316 316
Water Pumpage Requirements Current TNRCC Customer
Number Pumpage 2.0gpm Shortfall-Year Conn By Customer per conn Customer
(gpm) Provides (gpm 1999 424 750 848 98 2010 527 750 1054 304
Appendix A· 7 of 8
For Reference Only TWDB Questionnaire Growth Growth
Projection Projection 0.50% -4.54%
24 -170 448 254
Lake Livingston WSSC

9/30/99
Water Supply and Distribution Pumpage Analysis Customer Onalaska Water Supply TNRCC Supply Requirement: 0.6 gal per min per connection (total) TNRCC Pumpage Requirement: 2.0 gal per min per connection (total)
Connections Served
Year j 1995 1996 1997 1998 1999 Connections I 1180 1220 1270 1288 1320 % Increase in ConniYear 3.390 4.098 1.417 2.484
Customer Requested Growth Projection 1.00% Projected Increase in Connections 2000 - 2010 153 Total Projected Connections Year 2010 1473
Water Supply Requirements Current TNRCC Customer
Number Supply .6gpm Shortfall-Year Conn By Customer per conn TCRWSS
(gpm) Provides (gpm 1999 1320 737 792 55 2010 1473 737 884 147
Water Pumpage Requirements Current TNRCC Customer
Number Pumpage 2.0gpm Shortfall-Year Conn By Customer per conn Customer
(gpm) Provides (gpm 1999 1320 840 2640 1800 2010 1473 840 2945 2105
Appendix A - 8 of 8
For Reference Only TWDB Questionnaire Growth Growth
Projection Projection 1.10% 2.85%
169 478 1489 1798
Onalaska

APPENDIXB
SDWA REGULATIONS SUMMARY
Turner Collie (0'Sraden Inc.

Safe Drinking Water Act Regulations Summary Maximum
Maximum Contaminant Regulations Contaminant level
level (MCl), mg/l Monitoring Requirements Notes
Goal (MClG), mg/l
Stage 1 Disinfectants and Compliance schedule: Disinfection Byproducts Rule December 2001 for
Disinfectants public water systems
Chlorine/Chloramines - (PWSs) serving more maximum residual
maximum residual monitor at the same sample than 10,000; Chlorine disinfectant level goal locations as the Total December 2003 for
(MRDLG) - 4 disinfectant level (MRDL) - 4
Coliform Rule. Compliance PWSs serving less
based on running annual than 10,000.
Chloramines MRDLG -4 arithmetic average of monthly
MRDL -4 averages.
Chlorine Dioxide and Chlorite Chlorine Dioxide MRDLG -0.8 MRDL - 0.8 daily sample at distribution
system entry point
Disinfection By-products Triha/omethanes
Chloroform 0 -Bromodichloromethane 0 -Dibromochloromethane 0.06 -Bromoform 0 -
TTHM and HAA5 - four Total trihalomethanes
0.080 quarterly samples.
(TTHM's) -
Compliance based on running annual average.
Ha/oacetic Acids
L.-Dichloroacetic. acid 0 -
Appendix B - SDWA Regulations - 1 of 4

Safe Drinking Water Act Regulations Summary Trichloroacetic acid 0.3 -Total haloacetic acids plus monochloroacetic acid and
0.060 Same as TIHM. mono- and dibromoacetic
-acids (HAAS)
One sample per month Bromate 0 0.010 (ozone systems only) and
running annual average. Chlorite 0.8 1.0 Same as chlorine dioxide.
The removal of TOC to reduce the formation of OBPs is achieved by the treatment technique of enhanced
Source and treated water coagulation or Total Organic Carbon - Treatment technique TOC samples once per enhanced softening
month. that specifies the percentage of influent TOC that must be removed based on the raw water TOC and alkalinity levels.
Appendix B - SDWA Regulations - 2 of 4

Safe Drinking Water Act Regulations Summary Iinterim Enhanced Surface Water Treatment Rule
Cryptosporidium 0 99% removal required for
systems with filters Applicable only to
I At no time can turbidity go surface water or above 5 nephelolometric ground water under I
turbidity units (NTU). Conventional and direct
the direct influence I
Systems that filter must filtration systems must
(GWUDI) of surface I
ensure that the turbidity go no measure combined filter
water systems that I Turbidity N/A effluent turbidity at least every
higher than 1 NTU (0.5 NTU four hours and continuously
serve 10,000 or more
for conventional or direct people. I
filtration) in at least 95% of monitor turbidity of each individual filter. I
the daily samples in any month. I
Surface Water Treatment Rule I
Giardia lamblia 0 99.9% removal/inactivation Enteric viruses 0 99.99% removal/inactivation Legionella 0 no limit
I
Heterotrophic Plate Count N/A No more than 500 bacterial For turbidity, grab samples at Must maintain a
colonies per milliliter least every four hours or disinfectant residual I
At no time can turbidity go continuous monitoring. greater than 0.2 mg/L
above 5 nephelolometric Continuous chlorine residual entering the
turbidity units (NTU). required for systems >3,300. distribution system and
Systems that filter must One to four grab samples per a detectable level
Turbidity N/A ensure that the turbidity go no
day are allowed for systems throughout the higher than 1 NTU (0.5 NTU <3,300. distribution system.
I
for conventional or direct I
filtration) in at least 95% of the daily samples in any I
month. I
Appendix B - SDWA Regulations - 3 of 4

Safe Drinking Water Act Regulations Summary Total Coliform Rule
No more than 5% samples
Total coliforms 0 total coliform-positive in a For both surface waters and
month1 groundwaters, the total number and location of
Every sample that has total samples is based on the
Fecal coliforms 0 coliforms must be analyzed population served and a for fecal coliforms. There system-specific sampling
cannot be any fecal coliforms. plan.
E. Coli 0 -
For lead and copper, after All systems exceeding
Lead 0 Action Level2 = 0.015 corrosion controls are either the lead or initiated or optimized, follow- copper Action Levels up monitoring is every six must provide corrosion months. Systems that control treatment and continuously meet the Action public education.
Copper 1.3 Action Level2 = 1.3 Levels can reduce monitoring Systems> 50,000 to annually and then to every must optimize three years. corrosion control.
Inorganic Chemicals' Organic Chemicals' Radionuclides' Information Collection Rule'
1 For water systems that collect fewer than 40 routine samples per month, no more than one sample can be total coliform-positive.
2 For lead and copper, the Action Level cannot be exceeded in more than 10% of the tap water samples.
3 See Additional Safe Drinking Water Act Regulations table.
Appendix B - SDWA Regulations. 4 of 4

Additional Safe Drinking Water Act Regulations
Maximum Maximum Regulations Contaminant level Contaminant level Monitoring Requirements Notes
Goal (MClG), mgll (MCl), mgll
Once per year for surface waters. Once every three years for
Inorganic Chemicals groundwater for IOC's, not including Asbestos, Lead and Copper, Nitrate, Nitrite, and Radionuclides.
Antimony 0.006 0.006 Arsenic none 0.05 Asbestos (fiber> 10Jlm) 7 million fibers per liter 7 MFL Once every nine years. Barium 2.0 2.0 Beryllium 0.004 0.004 Cadmium 0.005 0.005 Chromium (total) 0.1 0.1 Copper 1.3 Action Level = 1.3 Same as lead. Cyanide (as free cyanide) 0.2 0.2 Fluoride 4.0 4.0
After corrosion controls are All systems exceeding either initiated or optimized, follow-up the lead or copper Action monitOring is every six months. Levels must provide
Lead zero Action Level = 0.015 Systems that continuously meet corrosion control treatmElnt the Action Levels can reduce and public education. monitoring to annually and then to Systems> 50,000 must every three years. optimize corrosion control.
Inorganic mercury 0.002 0.002 Nickel - 0.1
Nitrate (measured as nitrogen) 10.0 10.0 Groundwater annually; Surface water Quarterly.
Nitrite (measured as nitrogen) 1.0 1.0 One sample every three years.
Selenium 0.05 0.05 Thallium 0.0005 0.002
-- ---
Appendix B - Additional SDWA Regulations - 1 of 4
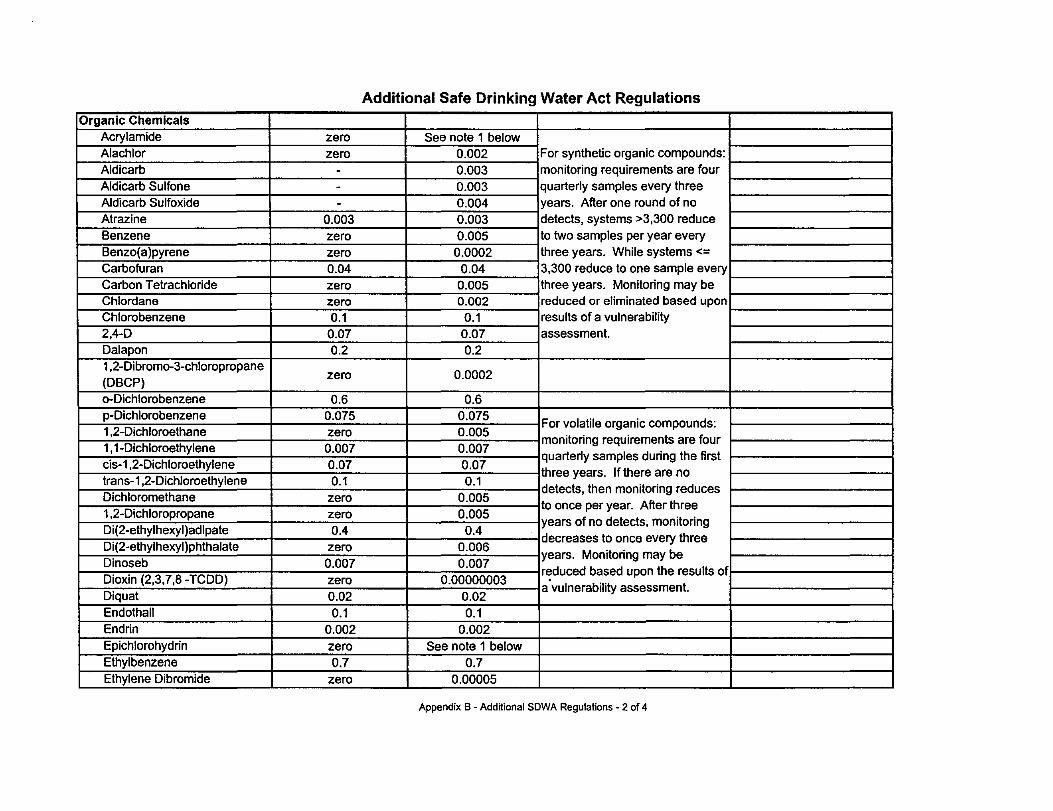
Additional Safe Drinking Water Act Regulations Organic Chemicals
Acrylamide zero See note 1 below Alachlor zero 0.002 For synthetic organic compounds: Aldicarb - 0.003 monitoring requirements are four Aldicarb Sulfone - 0.003 quarterly samples every three Aldicarb Sulfoxide - 0.004 years. After one round of no Atrazine 0.003 0.003 detects, systems >3,300 reduce Benzene zero 0.005 to two samples per year every Benzo(a)pyrene zero 0.0002 three years. While systems <= Carbofuran 0.04 0.04 3,300 reduce to one sample every Carbon Tetrachloride zero 0.005 three years. Monitoring may be Chlordane zero 0.002 reduced or eliminated based upon Chlorobenzene 0.1 0.1 results of a vulnerability 2,4-D 0.07 0.07 assessment. Dalapon 0.2 0.2 1,2-Dibromo-3-chloropropane
zero 0.0002 (DBCP) o-Dichlorobenzene 0.6 0.6 p-Dichlorobenzene 0.075 0.075
For volatile organic compounds: 1,2-Dichloroethane zero 0.005 1,1-Dichloroethylene 0.007 0.007
monitoring requirements are four
cis-1,2-Dichloroethylene 0.07 0.07 quarterly samples during the first
trans-1,2-Dichloroethylene 0.1 0.1 three years. If there are no
Dichloromethane zero 0.005 detects, then monitoring reduces
1,2-Dichloropropane zero 0.005 to once per year. After three
Di(2-ethylhexyl)adipate 0.4 0.4 years of no detects, monitoring
Di(2-ethylhexyl)phthalate zero 0.006 decreases to once every three
Dinoseb 0.007 0.007 years. Monitoring may be reduced based upon the results of
Dioxin (2,3,7,8 -TCDD) zero 0.00000003 a'vulnerability assessment.
Diquat 0.02 0.02 Endothall 0.1 0.1 Endrin 0.002 0.002 Epichlorohydrin zero See note 1 below Ethylbenzene 0.7 0.7 Ethylene Dibromide zero 0.00005
Appendix B - Additional SDWA Regulations - 2 of 4

Additional Safe Drinking Water Act Regulations Glyphosate 0.7 0.7 Heptachlor zero 0.0004 Heptachlor Epoxide zero 0.0002 Hexachlorobenzene zero 0.001 Hexachlorocyclopentadiene 0.05 0.05 Lindane 0.0002 0.0002 Methoxychlor 0.04 0.04 Oxamyl (Vydate) 0.2 0.2 Polychlorinated Biphenyls
zero 0.0005 (PCBs) Pentachlorophenol zero 0.001 Picloram 0.5 0.5 Simazine 0.004 0.004 Styrene 0.1 0.1 Tetrachloroethylene zero 0.005 Toluene 1.0 1.0 Total Trihalomethanes
0.08 (TTHM)
none
Toxaphene zero 0.003 2.4,5-TP (Silvex) 0.05 0.05 1,2,4-Trichlorobenzene 0.07 0.07 1,1,1-Trichloroethane 0.20 0.2 1,1,2-Trichloroethane 0.003 0.005 Trichloroethylene zero 0.005 Vinyl Chloride zero 0.002 Xylenes (total) 10.0 10.0
- _. __ .- --
Appendix B - Additional SDWA Regulations - 3 of 4

Additional Safe Drinking Water Act Regulations
Radionuclides Beta particles and photon Every four years - quarterly emitters
none 4 millirems per year samples.
Gross alpha particle activity none 15 picocuries per liter Every four years - quarterly
(pCi/L) samples. Radium 226 and Radium 228 (combined)
none 5 pCi/L Every four years - quarterly samples.
Information Collection Rule
Applicable to: public water
Disinfectant residuals, systems using surface water to
trihalomethanes, haloacetic monitor monthly for 18 months for
The Information Collection
acids, haloacetonitriles, both disinfection by-products
Rule requires certain PWSs
halo ketones, chloral hydrate, (DBPs) and microbials (pop. >=
to gather DIDBP and
chlorite, chlorate, bromide, - 100,000); public water systems microbial information from
bromate, total organic halides - their treatment processes.
using groundwater to monitor
(TOX), total organic carbon monthly for 18 months for only
The information collected will
(TOC), viruses, coliforms, DBPs (pop.>=100,OOO); public
be sent directly to the
Giardia, Cryptosporidium. water systems using groundwater
USEPA and will become the
to perform treatment studies (pop. basis for future regulations.
50,000 to < 100,000).
Consumer Confidence Reports (CCR) Rule
Requires public water systems to prepare and distribute CCR - -to their customers annually.
, - -- _. -- -- ---- ------ -
1 Each water system must certify, in writing, to the state (using third party or manufacturer's certification) that when acrylamide and epichlorohydrin are used in drinking water systems, the combination (or product) of dose and monomer level does not exceed the levels specified, as follows:
Acrylamide = 0.05% dosed at 1 mg/L (or equivalent) Epichlorohydrin = 0.01% dosed at 20 mg/L (or equivalent)
Appendix B - Additional SDWA Regulations - 4 of 4
i

APPENDIXC
WATER TRANSMISSION SYSTEM EVALUATION
TurnerCollie@'Bradenlnc.

Turner Colliecf1Braden Inc. Engineers • Planners • Project Managers
March 15,2000
Mr. Jim Sims, P.E. Regional Manager Trinity River Authority of Texas 1117 10th Street Huntsville, Texas 77342
Re:
Subject:
Trinity County Regional Water Supply System Surface Water Conversion and Service Area Expansion TC&B Project No. 15-46100-001
Transmission System Analysis TC&B Project No. 15-46100-002
Dear Mr. Sims:
P.O. Box 130089 Houston, Texas 77219-0089 5757 Woodway 77057·1599 713 780·4100 Fax 713 780·0838
This letter summarizes the results of the transmission system analysis that was authorized on December 6, 1999 as an additional work task associated with the above-referenced project The purpose of the analysis was to identify the requirements for an expanded water transmission system that would supply the 2010 demands identified in the referenced report
The methodology followed in the analysis is as follows:
• Develop a model that simulates the existing TCRWSS transmission system and pressurelflow conditions. The purpose of this simulation is to confirm that the model is accurate.
• Modify the existing system model to evaluate the expansion alternatives.
• Perform steady-state models ofthe expansion alternatives that address 2010 customer demands for the six current customers and potential customers. Of the two potential customers discussed in the referenced report, only Lake Livingston WSSC was included in the analysis. Onalaska was assumed to not be joining the TCRWSS for modeling purposes at this time.
• Perform steady stated runs to identify 2010 pump station and transmission system improvements for each alternative.
E,l,lhli,h~d in 1'1 .. 1,
Engineering Exc~llence for Over One-Half Centurv
COlORADO / FLORIDA / PENNSYLVANIA / TEXAS / WASHINGTON D.C.

Turner Collie (6Sraden Inc. March 15,2000 Mr. Jim Sims, P.E. Trinity River Authority of Texas Page 2
• A service pressure of 10 psi was established at the top of the customer's tank to allow for the customer's on-site piping losses.
The analysis of the transmission system addres~es five scenarios as follows.
• Current Conditions: The Current Condition scenario simulates the existing system configuration (pipe diameters and lengths, pump ratings, pressure regulator settings) and the current actual demands as obtained from TCRWSS.
• Alternative 1 models the Surface Water Plant Addition at Trinity Plant for the six existing customers for 2010 demands presented in the referenced report.
• Alternative 1A models the Surface Water Plant Addition at Trinity Plant for the six existing customers and the addition of Lake Livingston WSSC at Oakridge II for the 2010 demands presented in the referenced report.
• Alternative 2 models the New Centralized Surface Water plant at Sebastopol with the Trinity Plant remaining in service for the six existing customers for the 2010 demands presented in the referenced report.
• Alternative 2A models the New Centralized Surface Water plant at Sebastopol with the Trinity Plant remaining in service for the six existing customers and the addition of Lake Livingston WSSC at Oakridge II for the 2010 demands presented in the referenced report.
The analyses were performed using the PIPE2000 computer model. The Hazen-Williams C factors used for the transmission lines are presented in Table 1.
Table 1 - Hazen-Williams C Factors
Line Size and Condition Hazen-Williams C Factor 3",6",8" old and new 120
1 0" old and new 110 16" old pipe 130
16", 18",20",24" new pipe 140

Turner Collie (6Braden Inc.-March 15,2000 Mr_ Jim Sims, P.E. Trinity River Authority of Texas Page 3
The demands and elevations at each customer are presented in Table 2. The demands for the current condition are based on information received from TCRWSS. Demands for the 2010 alternatives are based on Table III-I, Summary of TCRWSS Water Supply Requirement§ And Customer Pumpage Requirements, as presented in the referenced report.
Table 2 - System Elevations and Demands
Customer Elevation (top of Demand - Current Alternatives 1 & 2 Alternatives lA & the tank) (ft) Condition (gpm) Demand - 2010 2A Demand - 2010
Condition (gpm) Condition (gpm) Riverside 254 21 359 359
City of Trinity 348 283 623 623 Glendale 347 21 57 57
City of Groveton 340 174 361 361 Chita (Trinity 421 44- 359 359
Rural) Oakridge I (Lake 164 71 (1) 0 0
Livingston WSSC) Oakridge II (Lake 224 N/A 0 316
Livingston WSSC) Westwood Shores 195 104 490 490
MUD Lake L Acres 409 60 496 496 (Trinity Rural)
Onalaska Not Included 0 0 0 Total Demand 778 (1.1 mgd) 2745 (3.95 mgd) 3061 (4.4 mgd)
(1) Currently part ofthe City of Trinity's allocation.
Summary of Current Conditions Model
The line size diameters, pump operating points, and the pressure regulating settings were obtained form the system design plans prepared by Turner Collie & Braden Inc. in 1981 Gob number 7188-002) and supplemental data obtained from the TCRWSS. A summary ofthe pipe sizes and Pressure Regulating Valve (PRV) settings is presented in Table 3.

Turner Collie(f1Braden Inc. March 15, 2000 Mr. Jim Sims, P.E. Trinity River Authority of Texas Page 4
Table 3 - Current Line Sizes and PRY Settings
Customer Pipe Diameter (in) PRY Settings (psi) Riverside 6 81
City of Trinity 16 N/A Glendale 12 94
City of Groveton 12 N/A
Chita (Trinity Rural) 6 N/A Oakridge I (Lake Livingston 3 80
WSSC) Westwood Shores MUD 8 84
Lake L Acres 6 N/A (Trinity Rural)
Trinity Water Treatment 16 158 Plant
The Current Condition flows to each customer are presented in Table 2. Based on the current high service pumps (HSP) #1 (three stages) and HSP #2 (six stages) operating and the system PRY settings, the resultant pressures at the customer facilities are presented in Table 4 and shown on the attached system schematic drawing. The pressures are at the top ofthe tank and generally represent the pressures experienced by TCRWSS confirming the accuracy of the model.
Table 4 - Current Condition Model Results
Customer Pressure Results (psi) Riverside 32.9
City of Trinity 64.5 Glendale 52.3
City of Groveton 52.3 Chita (Trinity Rural) 27.4
Oakridge I (Lake 70.8 Livingston WSSC) Westwood Shores 78.5
MUD Lake L Acres (Trinity 35.5
Rural) Trinity Water 179.4
Treatment Plant

Turner Collie (6Braden Inc. March 15, 2000 Mr. Jim Sims, P.E. Trinity River Authority of Texas Page 5
Summary of Alternative 1 - Surface Water Plant Addition at Trinity Plant
Alternative 1 addresses the 2010 demands shown in Table 2. The 2010 total demand is 2744 gpm for the six existing customers. Lake Livingston WSSC (Oakridge) is not included as a customer of the City of Trinity in this alternative. Since the total pumping capacity at the existing Trinity Plant is 1750 gpm, an additional pumping unit is required to meet demands. The model includes two HSP #1 (three stages) and three HSP #2 (six stages), for a total capacity of2800 gpm. To supply water at an adequate pressure at Chita, an upgrade ofthe pump operating head was required as follows:
HSP #1: three stages, operating point: 350 gpm @407 ft. HSP #2: six stages, operating point: 700 gpm @ 438 ft.
In order to achieve a pressure of at least 10 psi at each customer, some increases in the transmission line sizes were required. The upgraded line sizes and the revised pressure regulator settings, as well as the resultant system pressure readings at each customer are presented in Table 5 and shown on the attached system schematic drawing.
Table 5 - Alternative 1 Model Results
Customer PRY Settings (psi) Pressure Results (psi) Riverside 134 9.4
City ofTrinity N/A 53.9 Glendale 63 18.9
City of Groveton N/A 10.4 Chita N/A 15.9
(Trinity Rural) Oakridge II (LL WSSC) Included in lA Included in IA Westwood Shores MUD 35 9.5
Lake L Acres (Trinity N/A 15.2 Rural)
Trinity Water Treatment 185 185.9 Plant

Turner Collie (6Braden Inc.. March 15,2000 Mr. Jim Sims, P.E. Trinity River Authority of Texas Page 6
Summary of Altemative lA - Surface Water Plant Addition at Trinity Plant
Alternative lA addresses the 2010 demands shown in Table 2 for the six existing customers and Lake Livingston WSSC. The 2010 total demand is 2744 gpm for the six existing customers and 316 gpm for Lake Livingston WSSC (Oakridge). For the 2010 condition, Lake Livingston WSSC plans to replace Oakridge I with a centralized facility herein called Oakridge II. Since the total pumping capacity at the existing Trinity Plant is 1750 gpm, an additional pumping unit is required to meet demands. The model includes one HSP #1 (three stages) and four HSP #2 (six stages), for a total capacity of3150 gpm. To supply water at an adequate pressure at Chita, an upgrade of the pump operating head was required as follows:
HSP #1: three stages, operating point: 350 gpm @407 ft. HSP #2: six stages, operating point: 700 gpm @ 438 ft.
In order to achieve a pressure of at least 10 psi at each customer some increases in the transmission line sizes were required. The upgraded line sizes, the revised pressure regulator settings, as well as the resultant system pressure readings at each customer are presented in Table 6 and shown on the attached system schematic drawing.
Table 6 - Alternative lA Model Results
Customer PRY Settings (psi) Pressure Results (psi) Riverside 134 9.4
City ofTrinity N/A 42.9 Glendale 63 18.9
City of Groveton N/A 10.4 Chita N/A 9
(Trinity Rural) Oakridge II (LL WSSC) N/A 92.8 Westwood Shores MUD 35 9.5
Lake L Acres (Trinity Rural) N/A 12.4 Trinity Water Treatment 185 186.7
Plant

Turner Collie (6Braden Inc. March 15, 2000 Mr. Jim Sims, P.E. Trinity River Authority of Texas Page 7
Summary of Alternative 2 - New Centralized Surface Water Plant at Sebastopol
Alternative 2 addresses the 2010 demands shown in Table 2. The 2010 total demand is 2744 gpm for the six existing customers. Lake Livingston WSSC (Oakridge) is not included as a customer of the City of Trinity in this alternative. Alternative 2 considers both the construction of a new centralized plant in the vicinity of Sebastopol and the decrease in capacity of the existing Trinity Plant to 400 gpm. For this alternative the Trinity Plant was modeled with only one pump HSP #1 (three stages). During peak demand periods the Trinity Plant will supply Riverside with its demand of359 gpm with a minimal contribution to the rest of the system. The operating point ofHSP #1 at Trinity Plant is 350 gpm @ 378 ft. The 2010 total demand is 2744 gpm, of which 359 gpm (Riverside demand) is supplied from the Trinity Plant. The remaining demand will be provided by the new centralized plant (referred to as the Sebastopol Water Plant). The Sebastopol pumping capacity is provided by one HSP# 1 (three stages) and three HSP #2 (six stages).
In order to achieve a pressure of at least 10 psi at each customer's tank, certain line sizes were increased and some PRY settings were revised. Additionally, since there is a pressure gradient between the Trinity Plant and the City of Trinity, a flow control valve was added to the model to limit the flow from the Trinity Plant to 400 gpm. The sizes of the lines, the PRY settings, as well as the resultant system pressure readings at each customer are presented in Table 7 and shown on the attached system schematic drawing.
Table 7 - Alternative 2 Model Results
Customer Pressure Settings (psi) Pressure Results (psi) Riverside 135 . 10.4
City ofTrinity N/A 39.2 Glendale 62 17.9
City of Groveton N/A 9.4 Chita N/A 26.6
(Trinity Rural) Oakridge II (LL WSSC) Included in 2A Included in 2A Westwood Shores MUD 35 9.5
Lake L Acres (Trinity N/A 25.9 Rural)
Trinity Water Treatment 158 161.9 Plant
Sebastopol Water Treatment N/A 169.7 Plant

Turner Collie (6Sraden Inc. March 15, 2000 Mr. Jim Sims, P.E. Trinity River Authority of Texas Page 8
Summary of Alternative 2A - New Centralized Surface Water Plant at Sebastopol
Alternative 2A addresses the 2010 demands shown in Table 2 for the six existing customers (2744 gpm) and Lake Livingston WSSC (Oakridge - 316 gpm). For the 2010 condition, Lake Livingston WSSC plans to replace Oakridge I with a centralized facility herein called Oakridge II. Alternative 2A considers both the· construction of a new centralized plant in the vicinity of Sebastopol and the decrease in capacity of the existing Trinity Plant to 400 gpm. For this alternative the Trinity Plant was modeled with only one pump HSP #1 (three stages). During peak demand periods the Trinity Plant will supply Riverside with its demand of 359 gpm with a minimal contribution to the rest of the system. The operating point ofHSP #1 at Trinity Plant is 350 gpm @ 378 ft. The 2010 total demand is 2744 gpm, of which 359 gpm (Riverside demand) is supplied from the Trinity Plant. The remaining demand will be provided by the new centralize~ plant (Sebastopol Water Plant). The Sebastopol pumping capacity is provided by one HSP# 1 (three stages) and four HSP #2 (six stages).
In order to achieve a pressure of at least 10 psi at each customer's tank, certain line sizes were increased and some PRY settings were revised. Additionally, since there is a pressure gradient between the Trinity Plant and the City of Trinity, a flow control valve was added to the model to limit the flow from the Trinity Plant to 400 gpm. The sizes of the lines, the PRY settings, as well as the resultant system pressure readings at each customer are presented in Table 8 and shown on the attached system schematic drawing.
Table 8 - Alternative 2A Model Results
Customer PRY Settings (psi) Pressure Results (psi) Riverside 135 10.4
City of Trinity N/A 40 Glendale 62 17.9
City of Groveton N/A 9.4 Chita N/A 11.9
(Trinity Rural) Oakridge II (LL WSSC) N/A 133.6 Westwood Shores MUD 35 9.5
Lake L Acres (Trinity Rural) N/A 35.4 Trinity Water Treatment Plant 158 161.9 Sebastopol Water Treatment N/A 170.2
Plant

Turner Collie (6Braden Inc. March 15,2000 Mr. Jim Sims, P.E. Trinity River Authority of Texas Page 9
A summary of the probable construction costs for the transmission line improvements is presented on the attached cost summary sheet. The costs are based on installation of new lines rather than the addition of a second parallel line. The value of adding new lines to loop the system will be evaluated during the preliminary engineering phase of the project.
If there are any questions concerning the above analysis results, please give me a call.
Very truly yours,
Jim Johnson, P.E. Project Manager
JJ:dm
Attachments
P;\1546100\TWDB Final FilelReport Files\Appendix CIsims21.doc

o
Riverside 32.9
Trinity County Regional Water Supply System Current Condition
WTP
Oakridge I 70.8
't!_ - .••• ~-'-o _ 0 . a'
•• 0
Chita 27.4
January 28, 2000
Groveton 52.3
Pipe Diameter c::::J <= 6 _<=8 fill!!I'lI < = 1 0 _ <=12
- <=16 mD >16

o
o
Riverside 9.4
Trinity County Regional Water Supply System Alternative 1 - Surface Water Plant Addition at Trinity Plant
WTP
We.twood Shore. 9.S
January 31, 2000
Groveton 10.4
Pipe Diameter c:::J <= 6 -<=8 IlI'iID <= 10 _ <=12 _ <=16
I!IB'I > 16

o
o
RGlrcrside 9.4
Trinity County Regional Water Supply System Alternative lA - Surface Water Plant Addition at Trinity Plant
January 31,2000
Groveton 10.4
Pipe Diameter c::::::I <= 6 _<=8 am.J <= 10 _ <=12 _ <=16 I!Ii!!iI > 1 6

o
o·
Ri.,ocrside 10.4
January 28, 2000
Trinity County Regional Water Supply System Alternative 2 - New Centralized Surface Water Plant at Sebastopol
o
Groveton 9.4
Pipe Diameter c:::J <= 6 _<=8 IIIIEI <= 10 _ <=12 _ <=16
I!li!ilm > 1 6
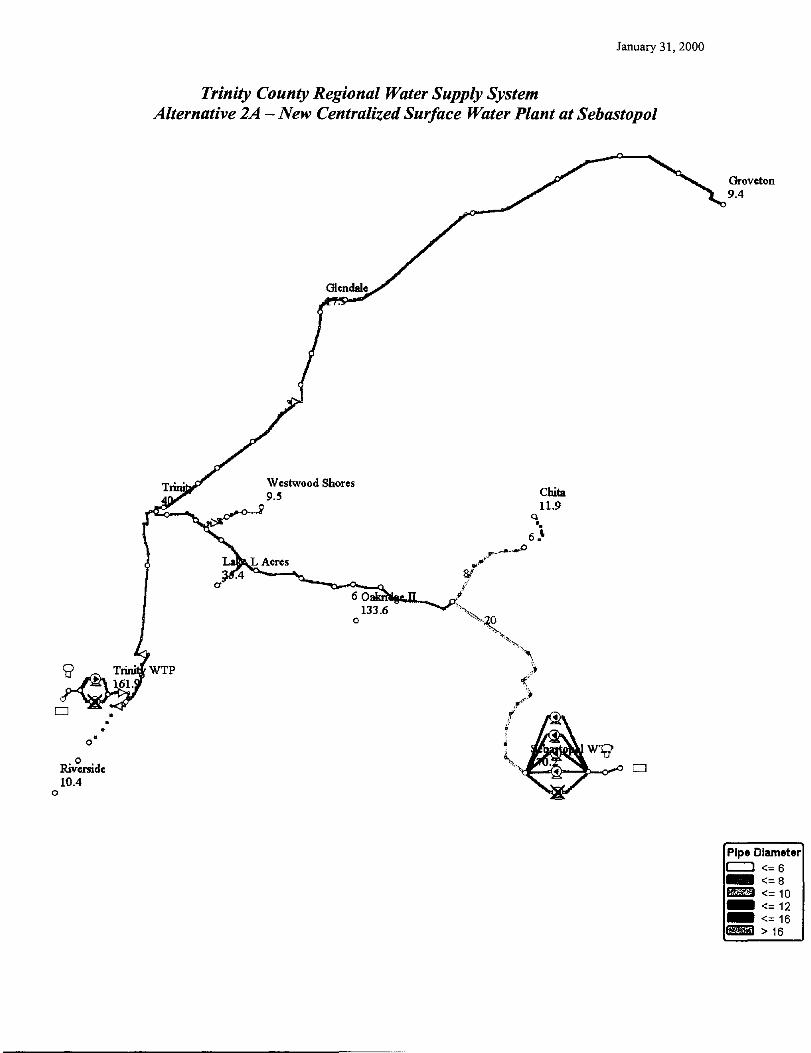
o
o·
Ri,zrsidc 10.4
January 31, 2000
Trinity County Regional Water Supply System Alternative 2A - New Centralized Surface Water Plant at Sebastopol
o
Q
Chita 11.9
'0 6.'
">", ~-<.!r-~<1"""" o
Groveton 9.4
Pipe Diameter c::J <= 6 _<=8 _ <=10 _ <=12 _ <=16 li!l!IiI > 1 6

3114/00
Summary of Probable Construction Costs for TCRWSS Transmission System Improvements TC&B Job No. 15-46100-002
Table 1 - Cost Summary for Expansion of Existing Trinity Plant
Altemative 1 - Expand Trinity Plant Alternative 1A - Expand Trinity Plant Pipeline Segment for 6 Existing Customers for 6 Existing Customers + LLWSSC
Size LF $/LF Cost Size LF $/LF Cost IHwy 356 from Trinity to Sebastopol 16 43800 55 $2,409,000 18 13200 80 $1,056,000
20 15300 110 $1,683,000 24 15300 140 $2,142,000
Sebastopol to Chita 16 18900 55 $1,039,500 18 18900 80 $1,512,000
Hwy 356 to Lake L Acres 8 3000 17 $51,000 10 3000 25 $75,000
Hwy 356 to Oakridge II $0 6 500 11 $5,500
Total Probable Cost $3,499,500 $6,473,500
Table 2 - Cost Summary for New Plant at Proposed Location Shown on Exhibit 6 (Chalk Bluff)
Alternative 2 - Sabastopol Plant for Alternative 2A - Sabastopol Plant for 6 Pipeline Segment 6 Existing Customers Existing Customers + LLWSSC
Size LF $/LF Cost Size LF $/LF Cost Hwy 356 from Trinity to Sebastopol 12 2500 32 $80,000 12 6400 32 $204,800
16 32400 55 $1,782,000 16 28500 55 $1,567,500
Sebastopol to Chita 8 18900 17 $321,300 6 6500 11 $71,500 8 12400 17 $210,800
Hwy 356 to Lake L Acres 8 3000 17 $51,000 8 3000 17 $51,000
Hwy 356 to Oakridge II $0 6 500 11 $5,500
New Sebastopol Plant to Transmission System (plant located at Proposed location as shown on Exhibit 6) 16 18350 55 $1,009,250 20 18350 110 $2,018,500
Total Probable Cost Proposed Plant Location $3,243,550 $4,129,600
LineCost-1 P:115-461001002IConst Cost Summary.xls

Summary of Probable Construction Costs for TCRWSS Transmission System Improvements TC&B Job No. 15-46100-002
Table 3 - Cost Summary for New Plant at Altemate Location Shown on Exhibit 6 (White Rock Creek)
Alternative 2 - Sabastopol Plant for 6 Alternative 2A - sabastopol Plant for Existing Customers 6 Existing Customers + LLWSSC
Pipeline Segment Size LF $/LF Cost Size LF $/LF Cost
Hwy 356 from Trinity to Sebastopol 12 2500 32 $80,000 12 6400 32 $204,800 16 32400 55 $1,782,000 16 28500 55 $1,567,500
Sebastopol to Chita 8 18900 17 $321,300 6 6500 11 $71,500 8 12400 17 $210,800
iHwy 356 to Lake L Acres 8 3000 17 $51,000 8 3000 17 $51,000
Hwy 356 to Oakridge II $0 6 500 11 $5,500
New Sebastopol Plant to Transmission System (plant located at Alternate location as shown on Exhibit 6) 16 1000 55 $55,000 20 1000 110 $110,000
Total Probable Cost Alternate Plant Location" $2,289,300 $2,221,100
"Remarks: The cost for the Alternate plant location would be applicable to either the White Rock Creek location shown on Exhibit 6 or to a plant located at the intersection of Hwy 356 and Hwy 355. Factors such as raw water quality will be evaluated during the preliminary engineering phase
3115100 LineCost-2 P:II5-461001002lConst Cost Summary.xls

APPENDIXD
PLANT OPERATING RECORDS
TurnerCollie<9Braden Inc.

HUNTSVILLE REGIONAL WATER SUPPLY SYSTEM Expenditure History - Unaudited
Account 1993 1994 1995 1996 1997 5 VR AVG
4000 Salaries $154,359 $152,244 $163,586 $172,104 $187,271 165,913 4010 Salaries - Part Time 5,978 5,178 3,409 4,596 6,200 5,072 4020 FICA 12,085 11,670 12,573 13,109 14,244 12,736 4030 Health/Life 14,570 9,989 11,538 13,149 14,640 12,777 4040 Pension 11,289 11,009 12,629 13,341 21,375 13,929 4060 Unemployment 491 947 0 0 0 288 4070 Recognition 62 453 60 571 0 229 4080 Education 0 0 0 0 1,335 267 4100 Office Supplies 1,112 795 896 1,137 721 932 4110 Dues & Subs. 720 336 581 302 580 504 4120 Fees OfT Dues & Subs. 446 465 915 3,387 5,292 2,101 4130 Maint. Supplies 8,744 8,535 10,517 9,463 9,932 9,438 4140 Lab Supplies 3,541 3,667 4,200 2,917 4,427 3,750 4150 Chemicals 185,799 177,861 227,420 232,690 273,196 219,393 4160 Petroleum Products 2,657 4,837 1,770 4,007 3,897 3,434 4170 Instrument Supp.lRep. 1,661 1,286 1,761 1,369 2,235 1,662 4200 Auditing 4,500 4,500 4,500 4,500 4,750 4,550 4210 Engineering 0 16,774 47,380 2,700 0 13,371 4220 Legal 0 0 0 0 0 0 4230 Outside Services 57,659 8,041 19,607 20,095 14,787 24,038 4240 Professional Servo 1,556 2,231 3,526 3,079 4,365 2,951 4300 Telephone 4,423 4,366 4,049 4,199 4,520 4,311 4310 Postage 677 695 752 735 671 706 4320 Printing & 8inding 333 3,610 2,286 1,717 291 1,647 4330 Insurance Payments 31,262 30,223 29,958 34,046 35,800 32,258 4360 Travel 564 396 162 328 365 363 4370 Laundry/Uniform Rental 4,688 3,741 4,022 3,552 3,359 3,872 4380 Training 1,945 1,294 1,871 1,962 2,726 1,960 4410 Water 67,890 67,890 86,140 86,140 86,140 78,840
4420 Power 208,062 216,023 214,123 224,212 243,575 221,199
4430 R&M-Imp. OfT Bldg. 1,666 3,839 0 18,338 0 4,769 4440 R&M-Equipment 1,158 2,688 1,735 1,889 1,240 1,742 4450 R&M-Plant 8,750 25,591 11,949 17,712 23,169 17,434
4460 R&M-Vehicles 1,064 712 1,011 184 443 683 4470 R&M-Emergency 0 0 0 0 0 0 4490 Off-Site Sludge Disposal 73,600 52,800 106,250 77,550 4510 Equip. Rental 669 1,318 474 794 620 775 4650 Operating Overhead 105,905 118,755 129,032 146,195 151,271 130,232 4660 Admin. Overhead 51,725 47,576 57,660 51,475 55,360 52,759 4700 Land 0 0 0 0 0 0 4720 Buildings 0 0 9,467 0 0 1,893 4740 Imp. OfT Bldg. 0 0 4,300 7,046 0 2,269 4760 Mach. & Equip. 25,435 13,233 24,012 24,713 25,264 22,531
4800 Bond Prin. Pay. 420,000 450,000 480,000 510,000 670,000 506,000
4810 Interest 358,838 340,247 320,172 298,571 450,013 353,568 4820 Paying Agent Fees 652 2,464 1,482 1,425 1,667 1,538
TOTALS $1,762,935 $1,755,479 $1,985,125 $1,990,549 $2,431,991 1,985,216
(#413 in '81 inc. chern.) Ii vB AVa Total Pumpage in 1,000 gal. 1,353,583 1,289,061 1,328,459 1,531,790 1,773,924 1,455,363 Max. Pumped (peak daily) 7,779 6,721 7,507 7,763 8,038 7,562
lin 1,000 gaL) Treated Water Cost $1.30 $1.36 $1.49 $1.30 $1.37 $ 1.37
(per 1,000 gal.) O&M Cost (per 1,000 gaL) $0.73 $0.75 $0.89 $0.77 $0.74 $ 0.77
Total Pumpage as MGD 3.71 3.53 3.64 4.20 4.86 3.99
Chemical Cost / MG $ 137 $ 138 $ 171 $ 152 $ 154 $ 150
Power Cost / MG $ 154 $ 168 $ 161 $ 146 $ 137 $ 153
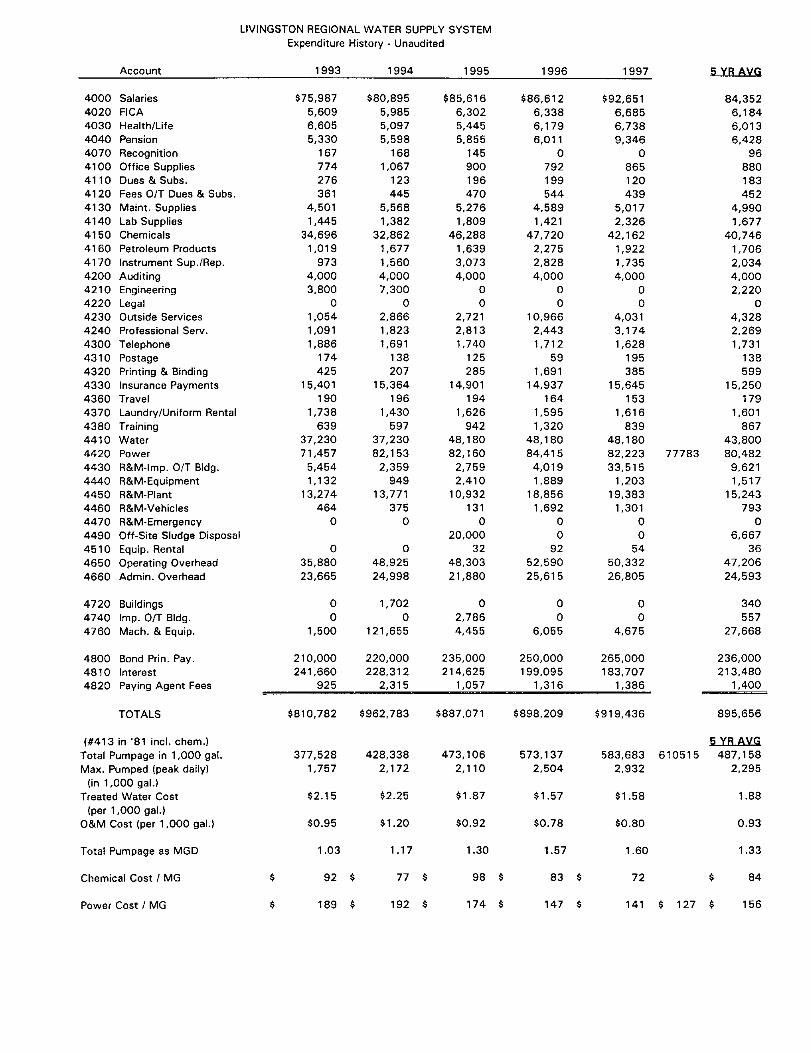
LIVINGSTON REGIONAL WATER SUPPLY SYSTEM Expenditure History - Unaudited
Account 1993 1994 1995 1996 1997 5:iB AllG
4000 Salaries $75,987 $80,895 $85,616 $86,612 $92,651 84,352 4020 FICA 5,609 5,985 6,302 6,338 6,685 6,184 4030 Health/Life 6,605 5,097 5,445 6,179 6,738 6,013 4040 Pension 5,330 5,598 5,855 6,011 9,346 6,428 4070 Recognition 167 168 145 0 0 96 4100 Office Supplies 774 1,067 900 792 865 880 4110 Dues & Subs. 276 123 196 199 120 183 4120 Fees OtT Dues & Subs. 361 445 470 544 439 452 4130 Maint. Supplies 4,501 5,568 5,276 4,589 5,017 4,990 4140 Lab Supplies 1,445 1,382 1,809 1,421 2,326 1,677 4150 Chemicals 34,696 32,862 46,288 47,720 42,162 40,746 4160 Petroleum Products 1,019 1,677 1,639 2,275 1,922 1,706 4170 Instrument Sup.lRep. 973 1,560 3,073 2,828 1,735 2,034 4200 Auditing 4,000 4,000 4,000 4,000 4,000 4,000 4210 Engineering 3,800 7,300 0 0 0 2,220 4220 Legal 0 0 0 0 0 0 4230 Outside Services 1,054 2,866 2,721 10,966 4,031 4,328 4240 Professional Servo 1,091 1,823 2,813 2,443 3,174 2,269 4300 Telephone 1,886 1,691 1,740 1,712 1,628 1,731 4310 Postage 174 138 125 59 195 138 4320 Printing & 8inding 425 207 285 1,691 385 599 4330 Insurance Payments 15,401 15,364 14,901 14,937 15,645 15,250 4360 Travel 190 196 194 164 153 179 4370 Laundry/Uniform Rental 1,738 1,430 1,626 1,595 1,616 1,601 4380 Training 639 597 942 1,320 839 867 4410 Water 37,230 37,230 48,180 48,180 48,180 43,800 4420 Power 71,457 82,153 82,160 84,415 82,223 77783 80,482 4430 R&M-Imp. OIT 8ldg. 5,454 2,359 2,759 4,019 33,515 9,621 4440 R&M-Equipment 1,132 949 2,410 1,889 1,203 1,517 4450 R&M-Plant 13,274 13,771 10,932 18,856 19,383 15,243 4460 R&M-Vehicles 464 375 131 1,692 1,301 793 4470 R&M-Emergency 0 0 0 0 0 0 4490 Off-Site Sludge Disposal 20,000 0 0 6,667 4510 Equip. Rental 0 0 32 92 54 36 4650 Operating Overhead 35,880 48,925 48,303 52,590 50,332 47,206 4660 Admin. Overhead 23,665 24,998 21,880 25,615 26,805 24,593
4720 Buildings 0 1,702 0 0 0 340 4740 Imp. OtT Bldg. 0 0 2,786 0 0 557 4760 Mach. & Equip. 1,500 121,655 4,455 6,055 4,675 27,668
4800 Bond Prin. Pay. 210,000 220,000 235,000 250,000 265,000 236,000 4810 Interest 241,660 228,312 214,625 199,095 183,707 213,480 4820 Paying Agent Fees 925 2,315 1,057 1,316 1,386 1,400
TOTALS $810,782 $962,783 $887,071 $898,209 $919,436 895,656
(#413 in '81 incl. chern.) 5 :iB AllG Total Pumpage in 1,000 gal. 377,528 428,338 473,106 573,137 583,683 610515 487,158 Max. Pumped (peak daily) 1,757 2,172 2,110 2,504 2,932 2,295
(in 1,000 gal.) Treated Water Cost $2.15 $2.25 $1.87 $1.57 $1.58 1.88
(per 1,000 gal.) O&M Cost (per 1,000 gal.) $0.95 $1.20 $0.92 $0.78 $0.80 0.93
Total Pumpage as MGD 1.03 1.17 1.30 1.57 1.60 1.33
Chemical Cost / MG $ 92 $ 77 $ 98 $ 83 $ 72 $ 84
Power Cost / MG $ 189 $ 192 $ 174 $ 147 $ 141 $ 127 $ 156

TRINITY COUNTY REGIONAL WATER SUPPLY SYSTEM Expenditure History - Unaudited
Account 1993 1994 1995 1996 1997 5 VR AVG
4000 Salaries $98,145 $106,351 $109,333 $105,201 $110,299 105,866 4010 Salaries - Part-Time 440 5,853 400 101 2,374 1,834 4020 FICA 7,442 8,316 8,520 7,874 8,210 8,072 4030 Health/Life 8,365 6,175 6,809 7,520 9,155 7,605 4040 Pension 5,960 7,273 7,269 6,921 9,152 7,315 4060 Unemployment Compo 0 0 0 0 0 0 4070 Recognition 0 38 470 166 205 176 4100 Office Supplies 420 827 776 716 624 673 4110 Dues & Subs. 213 229 135 205 121 181 4120 Fees OfT Dues & Subs. 916 1,778 1,042 757 837 1,066 4130 Maint. Supplies 3,279 3,426 2,958 3,296 3,915 3,375 4140 Lab Supplies 1,087 1,224 1,179 1,090 1,014 1,119 4150 Chemicals 3,772 3,405 4,555 5,619 5,808 4,632 4160 Petroleum Products 1,860 1,871 2,048 2,695 2,738 2,242 4170 Instrument Sup./Rep. 1,958 6,758 4,554 5,493 2,899 4,332 4200 Auditing 4,500 4,500 4,500 4,500 4,500 4,500 4210 Engineering 3,800 1,770 31,400 0 0 7,394 4220 Legal 0 0 47 0 15 12 4230 Outside Services 13,220 8,183 22,705 10,939 15,528 14,115 4240 Professional Servo 852 192 775 668 145 526 4300 Telephone 1,412 1,917 1,513 1,752 1,560 1,631 4310 Postage 127 211 48 59 166 122 4320 Printing & Binding 260 210 318 71 0 172 4330 Insurance Payments 15,511 16,854 16,932 16,123 17,470 16,578 4360 Travel 203 234 122 133 147 168 4370 Laundry/Uniform Rental 2,816 2,428 2,261 2,039 2,290 2,367 4380 Training 884 1,392 1,136 1,517 2,140 1,414 4410 Water 20,805 20,805 20,805 20,805 20,805 20,805 4420 Power 82,338 59,710 45,634 59,099 69,342 63,225 4430 R&M-Imp. OfT Bldg. 210 3,067 3,937 4,399 1,393 2,601 4440 R&M-Equipment 1,008 3,217 667 1,119 1,248 1,452 4450 R&M-Plant 14,505 22,762 36,552 19,936 26,781 24,107 4460 R&M-Vehicles 820 545 469 828 995 731 4510 Equip. Rental 529 344 138 604 1,045 532 4520 Rent - Other Property 9,614 8,510 9,280 9,086 10,356 9,369 4650 Operating Overhead 36,985 41,520 42,786 45,940 44,539 42,354 4660 Admin. Overhead 26,405 33,137 35,240 29,960 32,830 31,514 4720 Buildings 0 11,761 0 5,877 0 3,528 4740 Imp. OfT Bldg. 0 0 184,811 3,119 38,675 45,321 4760 Mach. & Equip. 10,588 63,661 6,239 8,490 2,509 18,297
4840 Contract Principal Pay. 24,734 0 0 0 0 4,947 4850 Contract Interest Pay. 1,298 0 0 0 0 260 4800 80nd Prin. Pay. 25,000 30,000 30,000 30,000 30,000 29,000 4810 Interest 99,229 97,875 96,375 94,688 93,375 96,308 4820 Paying Agent Fees 175 350 375 200 375 295
TOTALS $531,685 $588,679 $745,113 $519,605 $575,580 592,132
5 vB A~G Total Pumpage in 1,000 gal. 320,462 283,680 309,337 302,866 345,204 312,310
Max. Pumped (peak daily as MGD) 1.368 1.373 1.360 1.312 1.415 1.366
Treated Water Cost (per 1,000 gaL) $1.66 $2.08 $2.41 $1.72 $1.67 $1.91
O&M Cost (per 1,000 gaL) $1.27 $1.62 $2.00 $1.30 $1.31 $1.50
Average Daily Pumpage as MGD 0.88 0.78 0.85 0.83 0.95 0.86
Power Cost / MG $ 257 $ 210 $ 148 $ 195 $ 201 $202

APPENDIXE
TWDB REVIEW COMMENTS
TurnerCollie@'Braden Inc.
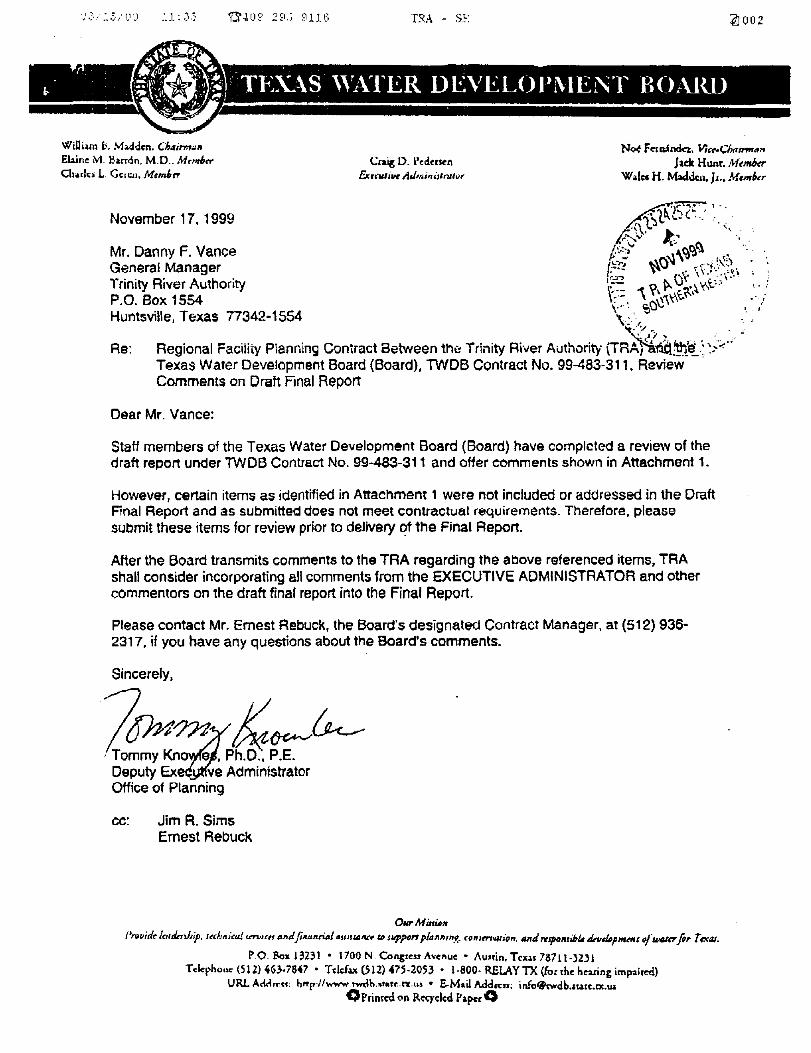
IRA - S~: ~002
WiIIi.m ~. M..tdm. ClJllirm~" Ewne M. Buron. M.D .. Member Ch.d .. l Go,,,,,. M.mb.,.
(;ra~ D. l·ed.~n i!J.'nllliw AJ"l;,,,)I,'1lIIJ'
N~ F~~ndq. v" ... <..nn".".,," Jack Hunt. Mtmbtr
W.'e< H. MoJdc .. , J'" M,,,,6u
November 17. 1999
Mr. Danny F. Vance General Manager Trinity River Authority P.O. Box 1554
~F'""""' '. 4ii)l~'-':!(".·:.
J::'\\.", ". ' ~r'~"'" "~ ~ _.
P:.:" ~:\f(,~., ''-. . f ~>.. ..\U" \"j .':.' .--~ \"' 0:: 'i .••••• ~\' .. ,,,, ClI' \ .'\.,
~'. ~_ '\ ", \I- ,~,~ y.,i:.'.1 '.' , \: -.' ..... ui \\\;; .' i ". '0'-' '.' Huntsville, Texas 77342-1554 \:', ~ .. :/ -. .
Ae: ~~.J~I ~ .
Regional Facility Planning Contract Between the Trinity River Auth"rity (TRA)'iIdtt~;~.:~ :::"," Texas Water Development Board (Board), TWDB Contract No. 99-483-311. Review . Comments on Draft Final Report
Dear Mr. Vance:
Staff members of the Texas Water Development Board (Board) have completed a review of the draft report under TWDS Contract No. 99-483-311 and offer comments shown in Attachment 1.
However, certain items as identified in Attachment 1 were not included or addressed in the Draft Final Report and as submitted does not meet contractual requiremeI1t$. Therefore, please submit these items for review prior to delivery C?f the Final Report.
After the Board transmits comments to the TRA regarding the above referenced items, TRA shall consider incorporating all comments from the EXECUTIVE ADMINISTRATOR and other commentors on the draft final report into the Final Report.
Please contact Mr. Ernest Rebuck, the Board's designated Contract Manager. at (512) 936-2317, if you have any questions about the Board's comments.
Sincerely,
76M~;:;C<-'L , Tommy Kno a, Ph.D .• P.E.
Deputy Exe ve Administrator Office of Planning
cc: Jim R. Sims Ernest Rebuck
Ow Mini#,. l'roClid~ ie.luknJJip. udJnJ'clli crrJ1JCtr 11,,,1 jilUl"riA' 4SJiflAlIt"' ttl supp"rt ,lallnm.f'.. (Onltn'lliitm, 4IJa rttpDlrfiJJi6 an"IRp",ntl II/UNltn' fl,. T tXQJ.
P.o. Box 13231 • 1700 N Cancro .. Av."ue • Au .. in. Tex •• 78711-)2)1 Telephone (512) 463,7847 • Told"" ()12J.475-20H • 1·800· RELAY TX (foeth. heuin, impai,ed)
URL Ad,h ... , h"p,lIwww rwdb .... u ..... \ ... E-M.a A.dd~ .. : info@<wdb ..... tc.oc.w ()Printcd <>1\ Reqclcd ('.perC)

: • .'. : '.' ':5 q' f \.-' ,~ .. -. ~' IRA - 5:0,
ATTACHMENT 1 TEXAS WATER DEVELOPMENT BOARD
DRAFT REPORT REVIEW COMMENTS TWDB Contract No. 99-483-311
"Trinity County Regional Water Supply System Surface Water Conversion and Service Area Expansion"
SCOPE OF WORK COMMENTS
The following items from the scope of work (SOW) either are missing or are inadequately addressed in the draft report:
Task (1) Collect and evaluate background information related to the project such a8 water demand projections and service areas of the partiCipating customers, especially the new potential customers. as well as topographic Information needed for determination of a feasible raw water intake location.
Comment The repo" satisfactorily addresses water demand prOjections; however no information such as location. size. or existing facilities is provided for the service areas. Topographic information is not included. Although Exhibits 5 and 6 use USGS quadrangle maps 8S a base, the contour elevations are not legible. Pertinent topographic points could be marked and labeled on Exhibits 5 and 6, or the topographic information could be presented in a table.
TasK (2) Collect and evaluate existing site-specific facility information sueh as existing Trinity County Regional Water Supply System (TCRWSS) and Huntsville Regional Water Supply System (HRWSS) water treatment and transmission facilities and related operating records.
Comment The report provides a good deSCription of the faCilities for. both the rCRWSS and HRWSS water treatment plants. However information on the location and size of the existing transmission faciUties is not included. with the exception of the relatively small section from the TCAWSS plant to Riverside shown in exhibit 5. Information on operating records. except for certain statistics on annual production and two O&M costs for the TCRWSS plant. is missing.
OTHER COMMENTS
The Executive Summary and pg. 111-4 l;tate that the capacity of the surface water plant facilities needed to provide water to the existing customers is 3.5 mgd and that for both existing and two potential customers is 4.1 mgd. Since the projected water demands exceed these amounts, the report should note In the Executive Summary and possible on pg. 111-4. that the existing well field will continue to supply 400 gpm (0.576 mgd).
The report on pg. 11-2 states that the 0 & M cost for the TCRWSS plant was $1.0011000 gal prior to 1988 and $1.30/1000 gal after 1988. due to decreased production capacity. Additional explanation should be provided on why the cost increaSed so Significantly.
f; U03

03/15/00 11:36 '5'409 295 9116 TRA - SR
Table 111-2 on pg. 111-3 contains a typo. The entry under ·Supply Required to Meet TNRCC· requirements for "Existing Customers" should be 2744 gpmt3.95 mgd instead of 2744 gpmt23.95 mgd.
Overall the report contains a good discussion of membrane technology. However, the following points should be consider9d:
(a) The classification of the four membrane types, pgs. IV-6 and IV-7 should nota that microfiltration and ultrafiltration generally operate at "line" pressure. Also pressure ranges for low and high pressure should be provided.
(b) The statement in the first complete paragraph on pg. IV-7 that low quality source water would require pretreatment prior to microfiltration Is misleading. since it has not been established what level of pretreatment, if any, would be required for Lake Uvingston or Trinity river water. There is a s;milar concern with respect to the fiiSt paragraph una&; "Potential Membrane Advantages" on pg. IV-8 which states that pre-filtration, pH adjustment, preoxidation and coagulation/sedimentation may be required.
(c) The reference to the disposal of concentrate waste streams under 'Pressure Membrane Disadvantages', shOUld be more specific. Micrcfiltration and ultrafiltration. which are the membrane systems that would be applicable to the Trinity County Regional Water . Supply System, are backwashed, and generally the backwash is circulated to the head of the plant in a similar manner as for conventional water treatment plants. In effect .the disposal of concentrate waste streams is of concern only with nanofiltration and reverse osmosis systems, which may not be applicable in this case;
(d) The membrane system cost data on pg. VIII-2 is unclear as to what pmcesses, such as pretreatment, are included.
The report recommends conventional treatment using pre-engineered units. This conclusion appears pre-mature In that the report also recommends further evaluation of membrane technology during the preliminary engineering phase of the project
The report refers to at least two reports, I.e. a TC&B report in 1990 and one by R.W. Harden and Assoc. in 1986. The full reference for these reports should be provided, preferably in a 'Ust of References".
~ 00"

, ..
TEXr\S 'VATER DEVELop~rE~T BOARD
Willim, Is. M.ddcn. r..7w.;"nIJ FJolhlC .\1. -Barrcin, M.D., "'J~mboCh>rl<> L. Ceren, Mmdm'
February 28, 2000
Mr. Danny F. Vance General Manager . Trinity River Authority P.O. Box 1554 Huntsville, Texas 77342·1554
Crnig D. Pedcm:n .&-t~·lIiJt·t .JIdminiltr4tl)"
Re: Regional Facility Planning Contract Between the Trinity River Authority (TRA) and the Texas Water DevelopmenfBoard (Board), TWDBContract No. 99-483-311, Review Comments on Draft Fin"!1 Report . .
Dear Mr. Vance:
Staff members of the Texas Water Development Board have completed a review of the revised draJ:t final report under TWDB Contract No. 96-483·189. Board staff offers the additional comments to the draft report as shown in Attachment 1. As stated in the above referenced contract, TRA will consider incorporating comments, as shown in the letter dated November 17, 1999, Attachment 1, from the EXECUTIVE ADMINISTRATOR and other com mentors on the draft final report into a final report. TRA must include a copy of the EXECUTIVE ADMINISTRATOR's comments in the final report.
The Board looks forward to receiving one (1) unbound camera-ready onginaland nit1e (9) bound double-sided copies of the Final Report on this planning project. Please contact Mr Ernest Rebuck, the Board's designated Contract Manager, at (512) 936-2317 if you have any questions about the Board's comments. .
Sincerely, .
?-1;;'nl~~-' -I' L T/~my Knowl ~.E Deputy Exec tive Administrator Office of Planning
Enclosures cc: Ernest Rebuck
OIl1"Minin1l Pn>l,j,u l,tUlrrJJip, J~,.'Jmiud U?'viUI IJP.J jinuPlLi..J Iluisidnv hI ruIJ,tJrll'fg""ing. nJIIU'MJ(dUtn. and I'rf/X'Mibk In.,k;pm''~t tf UJtltrr for T,xns ..
r.o.&,x 13231 • 1700 N. Cung=. A,.nur • Au>tin,T.xu 78711-32;1 . Tdoplwnd5I1HG3-7847 • Tekfu (512)475·Z053 • l.aOO.F.ELAY1X(fortb<he~impIDo::d)
URL Addr.,,; bnp./lwww.twdb.lt2t •. tx.IU·E-M.irAdd._.inl .. lli.twdh ..... <c.rY .• Lt
. Op,.inr~d un ~r.r.yrl,"d P:t~l 0 .

03/15/00 11:18 '6'409 295 9116 TRA - SR
'-.-.
ATTACHMENT 1
TEXAS WATER DEVELOPMENT BOARD Review Comments to Revised Draft Final R.p~!"t:
"Trinity County Regional Water Supply System Surface Water-Conversion and Service Area Expansion"
Contract No. 99-483-311
1. The report should state that prlHlngineered treatment plants, such as described on pg. VII-2, will require a minimum three-month piiot study to be consistent with the statement to that effect on pg. VIII-2 under Probably Membrane System Costs. This is based on a telephone conversation with Joe Strouse, who is the Team Leader of Plans Review for TNRCC
2. The report on pg. VIII-2 states that two membrane manufacturers reviewed the Trinity River water. Please include the names of those manufacturers.
flJ 003

Trinity River Authority of Texas Trinity County Regional
Water Supply System Surface Water Conversion
And Service Area Expansion
March 2000 Contract No. 99-483-311
The following map is not attached to this report. Due to its size, it could not be copied. It is located in the official file and may be copied upon request.
TRA/TCRWSS- January 2000
Surface Water Conversion Feasibility Report Job No. 15-46100-001 Exhibit: 1A
Please contact Research and Planning Fund Grants Management Divison at (512) 463-7926 for copies.