at the end of the clinical experience 9.22.17.docx · web viewthe university of nebraska-lincoln...
TRANSCRIPT

Nebraska Department of Education Rule 24 ReportELEMENTARY EDUCATION
(Content Area)Educator Preparation Content Program Review
Name of institution University of Nebraska-Lincoln
Date Submitted 3.20.2017
Contact Person Thomas Wandzilak
Phone/Fax 402-472-8626
Email [email protected]
Folio type: X Regular Mini Advanced Program
Program(s) Covered by this FolioEndorsement(s) Type Grade Level Program Level
List Endorsements
Field K-6 BaccalaureateMaster’s
Elementary Education,Grades K-6
Is the endorsement offered at more than one site? Yes X NoIf yes, list additional sites where endorsement is offered:
Institution Accreditation Status: X National X State
Is this a Nationally Accredited Program? X Yes NoIf Yes, list Accrediting Organization: CAEP Attach National Letter to
Cover Sheet
Report to the Nebraska Department of EducationUniversity of Nebraska—Lincoln
Folio Initial Level—June 2017
INTRODUCTION AND WELCOMEThe purpose of this section is to provide general background information on the University of Nebraska-Lincoln and the College of Education and Human Sciences. In addition, information is provided on the teacher education program, admission and retention standards the field experiences in which student participate, and information on the key assessments used in Section 2 concerning data that have been collected in support of our programs.
Here is a list of websites that can provide some additional information on the university, the college, and our teacher education program:
http://www.unl.edu/This is the University of Nebraska-Lincoln website.
https://bulletin.unl.edu/undergraduate/This is the link for the undergraduate bulletin.
https://bulletin.unl.edu/undergraduate/college/Education+%26+Human+SciencesThis is the link for the College of Education and Human Sciences section in the Undergraduate Bulletin.
http://www.unl.edu/gradstudies/bulletinThis is the link for the Graduate Bulletin.
http://cehs.unl.edu/The is the link for the website for the College of Education and Human Sciences
http://cehs.unl.edu/ssc/undergraduate-advising/

This is the link for our program sheets for all of the programs offered through the College of Education and Human Sciences. Program sheets will also be available for multiple years.
If you have any questions, feel free to contact Tom Wandzilak, Certification Officer, College of Education and Human Sciences at:
402-472-8626 or [email protected]
SECTION 1: CONTEXTUAL INFORMATION NARRATIVE
SECTION 1A: ENDORSEMENT PROGRAM/CONTEXTUAL INFORMATION
The link to the Rule 20 Folio is:http://cehs.unl.edu/cehs/nde/Rule20.pdf
Mission Statement:ion StatementThe University of Nebraska-Lincoln (UNL), chartered by the Legislature in 1869, is the part of the University of Nebraska system that serves as both the land-grant and the comprehensive public University for the State of Nebraska.
Through its three primary missions of teaching, research, and service, UNL is the state's primary intellectual center providing leadership throughout the state through quality education and the generation of new knowledge. UNL's graduates and its faculty and staff are major contributors to the economic and cultural development of the state. UNL attracts a high percentage of the most academically talented Nebraskans, and the graduates of the University form a significant portion of the business, cultural, and professional resources of the State. The quality of primary, secondary, and other post-secondary educational programs in the state depends in part on the resources of UNL for curricular development, teacher training, professional advancement, and enrichment activities involving the University's faculty, museums, galleries, libraries, and other facilities. UNL provides for the people of the state unique opportunities to fulfill their highest ambitions and aspirations, thereby helping the state retain its most talented youth, attract talented young

people from elsewhere, and address the educational needs of the nontraditional learner.
The University of Nebraska-Lincoln has been recognized by the Legislature as the primary research and doctoral degree granting institution in the state for fields outside the health professions. Through its service and outreach efforts the University extends its educational responsibilities directly to the people of Nebraska on a state-wide basis.
The College of Education and Human SciencesThe College of Education and Human Sciences (CEHS) was founded on August 18, 2004, by Teachers College and The College of Human Resources and Family Sciences with each founding college contributing extensive history and tradition. The College of Education and Human Sciences offers excellent educational advancement to both undergraduate and graduate students, serving approximately 2,800 undergraduates and 1,000 graduate students each year.
Education courses first became a part of the University curriculum in 1895 with the organization of a Department of Education designed to prepare students for teaching careers. On Valentine’s Day, 1908, the Board of Regents established a Teachers College. Since that time, the College has been highly respected for its programs preparing teachers, administrators, and specialists for the education of children, youth, and adults. The quality of these programs is reflected in outstanding educational leadership in communities across the state and in the nation in teaching, administration, communication disorders, special education, and educational psychology.
Teacher Education ProgramsTeacher education programs are found in five departments in CEHS as well as in two other colleges on campus. The College of Fine and Performing Arts (CFPA) oversees Music Education whereas Agriculture Education, Horticulture Education, and Industrial Technology are located in the College of Agricultural Sciences and Natural Resources. Even though these programs are housed outside of CEHS, they must comply with state rules and regulations tied to teacher education. The majority of the teacher education programs are located in the Department of Teaching, Learning and Teacher Education (TLTE). There are currently 40 endorsement areas offered at the undergraduate and graduate levels through the University. Options exist for students to complete initial teacher certification and teaching endorsements at the undergraduate and graduate levels. All programs leading to an initial teaching certificate will also require the completion of an undergraduate or graduate degree. Individuals interested in adding one or more teaching endorsements may do so without pursuing a degree.
1B. STANDARDS OF ADMISSION, RETENTION, TRANSITION, AND COMPLETION
Admission to the University of Nebraska-LincolnAdmission to the University is based on a student’s demonstrated academic preparation for University-level work (see Appendix—Table 1). Admission standards to the University are established by the University of Nebraska Board of Regents and apply to all new, first time, degree-seeking students. This includes freshman as well as transfer students. The admission standards apply to general admission to the University as well as admission to the College of Education and Human Sciences.
Admission to the Teacher Education Program (TEP)Admission to the College of Education and Human Sciences does not guarantee admission to a teacher education program. Admission to the advanced phases of teacher education is selective and, in some endorsements, highly competitive. Selection to a TEP is based upon the following criteria:
1. Completion of at least 30 credit hours (Elementary Education) or 42 credit hours (Secondary Education) with a minimum 2.5 GPA.
2. Completion of TEAC 331 or 430 or 431 or 434 or 437 or 496 (3 hrs.) or approved course, and EDPS 250 or 251 with a 2.5 cumulative average in the two classes, no grade lower than a C.
3. Documentation of proficiency in reading, writing, and mathematics through successful completion of a basic skills examination that meets the Nebraska Department of Education competency requirement.
4. Completion of one course in communication studies selected from COMM 109, 205, 209, 210, or 341, or an approved substitute.
5. Faculty recommendations.6. Demonstration of attaining particular learning outcomes in the program.7. Completion of a personal and professional fitness self-disclosure form.
Admission to Student TeachingAll students who are candidates for an appropriately endorsed Nebraska Teacher’s certificate are required to student teach. Students who plan to student teach in the fall semester must complete the student teaching application form and

submit it by the preceding March 1 to the Director of Field Experiences in 104 Henzlik Hall; students planning to student teach in the spring semester must apply by the preceding October 1. The basic program for student teaching provides for a full-day experience on a semester basis. Students enrolled in an elementary education dual major will complete requirements for student teaching in both majors. Admission to student teaching requires the following:
1. Matriculation in a teacher education program in the College of Education and Human Sciences, the Graduate College, or dual matriculation in the College of Education and Human Sciences and another college.
2. Admission to a teacher education program.3. Senior standing (89 hours or more) with a minimum cumulative GPA of 2.75.4. Application for and completion of a senior check.5. Minimum average of 2.5 in each endorsement area (in the case of Middle Grades Endorsement, a 2.5 in each
academic area) with no grade below C.6. A minimum grade point average of 2.5 in pre-professional and professional education courses with no grade below
a C in pre-professional education courses and no grade below a C+ in professional education courses.7. Completion of a criminal history check that will be conducted by an independent party (lab fee required).
Retention1. Must maintain a minimum cumulative GPA of 2.75.2. Must maintain a minimum average of 2.5 in each endorsement area (in the case of Middle Grades Endorsement, a
2.5 in each academic area) with no grade below C.3. Must maintain a minimum grade point average of 2.5 in pre-professional and professional education courses with
no grade below a C in pre-professional education courses and no grade below a C+ in professional education courses.
4. Must meet student teaching application deadlines.5. Must meet criminal history requirements at all times.
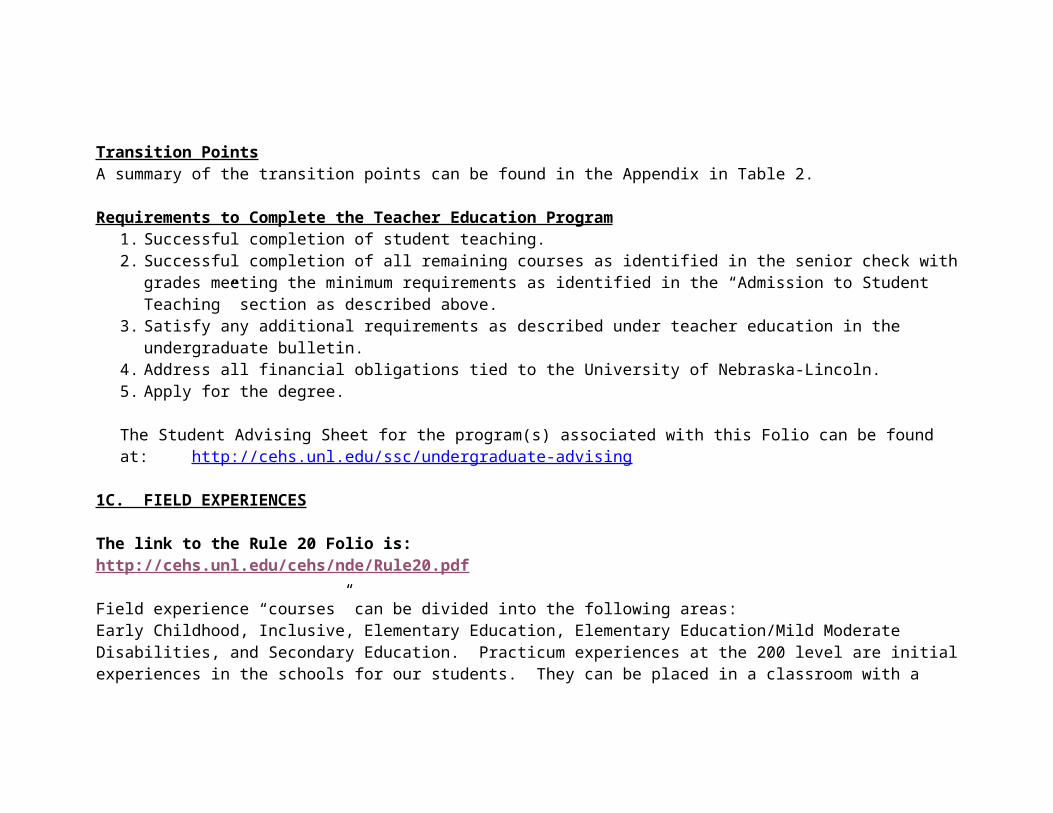
Transition PointsA summary of the transition points can be found in the Appendix in Table 2.
Requirements to Complete the Teacher Education Program1. Successful completion of student teaching.

2. Successful completion of all remaining courses as identified in the senior check with grades meeting the minimum requirements as identified in the “Admission to Student Teaching” section as described above.
3. Satisfy any additional requirements as described under teacher education in the undergraduate bulletin.4. Address all financial obligations tied to the University of Nebraska-Lincoln.5. Apply for the degree.
The Student Advising Sheet for the program(s) associated with this Folio can be found at:http://cehs.unl.edu/ssc/undergraduate-advising
1C. FIELD EXPERIENCES
The link to the Rule 20 Folio is:http://cehs.unl.edu/cehs/nde/Rule20.pdf
Field experience “courses” can be divided into the following areas:Early Childhood, Inclusive, Elementary Education, Elementary Education/Mild Moderate Disabilities, and Secondary Education. Practicum experiences at the 200 level are initial experiences in the schools for our students. They can be placed in a classroom with a teacher at the appropriate grade level for their respective content area. Secondary students are placed individually in middle grades or secondary classrooms whereas elementary students are placed in pairs in elementary classrooms. In all instances, university students have opportunities to work with K-12 learners individually or in small groups. In some instances, they may be given full-class opportunities to work with learners. Students completing 397 level practica have expanded responsibilities where they will have greater classroom responsibilities that will include the teaching of multiple lessons as a requirement for the experience as well as teacher assistant roles during each day. The 497 experience is student teaching where the university student takes on more and more responsibilities that would be equivalent to those taken on by the classroom teacher. These responsibilities include, but are not limited to, the preparation of lesson plans and materials for teaching and assessment, the teaching of classes, grading formative and summative materials, working with students after class, attending staff/faculty meetings, and speaking with parents where necessary, all under the guidance of a cooperating teacher. Please see Table 3 in the Appendices for a summary of the Field Experience hour requirements associated with each practicum course and the related endorsements.
1D. PROGRAM COMPLETERS

Table 4 – Program Completers
Program Completers and Level – Content AreaAcademic Year Number of Endorsement Program Completers
Bac Post BacAlternate
Route MastersEd.
Specialist PhD20 14 to 20 15 124 15
20 15 to 20 16 144 12
SECTION 2: ENDORSEMENT PROGRAM KEY ASSESSMENTS AND RELATED DATA
ARTIFACT 1Table 5
Summary Table of Endorsement Program Key AssessmentsREGULAR FOLIOS
Name of Assessmentused for the following areas:
Type or Form of Assessment
Brief Description of Assessment, including indicated information obtained from Assessment
When Assessment is Administered
Specific Items
1Content-Praxis II or GPA
Cumulative GPASummative
Numerical computation of grades based onquality points earned divided by credithours completed
Ongoing—throughout one’s college career. Cumulative GPA is what is reported.
Specific to content area
Praxis II Comparison to a Standard
For elementary students, this test has been used todocument one being highly qualified (minimumscore of 159) for No Child Left
Just before or during clinical practicum (student teaching)
Specific to content area

Behind.For secondary students, we piloted results for the2014-2015 academic year. Results will be used as a requirement fro teacher certification at all levelsstarting September 1, 2015.
CEHS Student Teaching Instrument
Summative This instrument consists of 14 items that is completedby the student teacher supervisor and cooperatingteacher on the basis of one being proficient, basic orunsatisfactory on each item.
At the end of the Clinical Experience
Item 1
Administrator Survey
Summative This is a 21-item instrument that is completed byschool administrators at the end of a candidate’sfirst year of
In March/April at the end of the candidate’s first year of teaching
Standards 4.1, 4.2, 4.3

teaching. It is now administered bythe Nebraska Department of Education.
Candidate Teacher Survey
Summative This is a 23-item instrument that is completed byprogram completers at the end of the first year ofteaching. It is administered by the College ofEducation and Human Sciences at UN-L.
In March/April at the end of the candidate’s first year of teaching
Items 1 & 2
2 Content - Knowledge
Cumulative GPA Summative Numerical computation of grades based onquality points earned divided by credithours completed
Ongoing—throughout one’s college career. Cumulative GPA is what is reported.
Specific to content area
Praxis II Comparison to a Standard
For elementary students, this test has been used todocument one being highly qualified (minimumscore of 159) for No Child Left
Just before or during clinical practicum (student teaching)
Specific to content area

Behind.For secondary students, we piloted results for the2014-2015 academic year. Results will be used as a requirement fro teacher certification at all levelsstarting September 1, 2015.
CEHS Student Teaching Instrument
Summative This instrument consists of 14 items that is completedby the student teacher supervisor and cooperatingteacher on the basis of one being proficient, basic orunsatisfactory on each item.
At the end of the Clinical Experience
Item 1
Administrator Survey
Summative This is a 21-item instrument that is completed byschool administrators at the end of a candidate’sfirst year of
In March/April at the end of the candidate’s first year of teaching
Standards 4.1, 4.2, 4.3, 5.1, 5.2

teaching. It is now administered bythe Nebraska Department of Education.
Candidate Teacher Survey
Summative This is a 23-item instrument that is completed byprogram completers at the end of the first year ofteaching. It is administered by the College ofEducation and Human Sciences at UNL.
In March/April at the end of the candidate’s first year of teaching
Item 14
3 Learner/Learning Environments
CEHS Student Teaching Instrument
Summative This instrument consists of 14 items that is completedby the student teacher supervisor and cooperatingteacher on the basis of one being proficient, basic orunsatisfactory on each item.
At the end of the Clinical Experience
Items 2 & 3
Administrator Survey
Summative This is a 21-item instrument that is
In March/April at the end of the
Standards 1.1, 1.2, 1.3,

completed byschool administrators at the end of a candidate’sfirst year of teaching. It is now administered bythe Nebraska Department of Education.
candidate’s first year of teaching
2.1, 2.2, 2.3, 3.1, 3.2, 3.3
Candidate Teacher Survey
Summative This is a 23-item instrument that is completed byprogram completers at the end of the first year ofteaching. It is administered by the College ofEducation and Human Sciences at UNL.
In March/April at the end of the candidate’s first year of teaching
Items 3 & 4
4 Instructional Practices - Knowledge
CEHS Student Teaching Instrument
Summative This instrument consists of 14 items that is completedby the student teacher supervisor and cooperatingteacher on the basis of one being
At the end of the Clinical Experience
Items 2, 3, & 6

proficient, basic orunsatisfactory on each item.
Administrator Survey
Summative This is a 21-item instrument that is completed byschool administrators at the end of a candidate’sfirst year of teaching. It is now administered bythe Nebraska Department of Education.
In March/April at the end of the candidate’s first year of teaching
Standards 7.1, 7.2, 7.3, 8.1, 8.2, 8.3
Candidate Teacher Survey
Summative This is a 23-item instrument that is completed byprogram completers at the end of the first year ofteaching. It is administered by the College ofEducation and Human Sciences at UNL.
In March/April at the end of the candidate’s first year of teaching
Items 7, 8, 9, 16, 17 & 20
5 Instructional Practices - Effectiveness
CEHS Student Teaching Instrument
Summative This instrument consists of 14 items that is completedby the student
At the end of the Clinical Experience
Items 2, 3, & 5

teacher supervisor and cooperatingteacher on the basis of one being proficient, basic orunsatisfactory on each item.
Administrator Survey
Summative This is a 21-item instrument that is completed byschool administrators at the end of a candidate’sfirst year of teaching. It is now administered bythe Nebraska Department of Education.
In March/April at the end of the candidate’s first year of teaching
Standards 6.1, 6.2
Candidate Teacher Survey
Summative This is a 23-item instrument that is completed byprogram completers at the end of the first year ofteaching. It is administered by the College ofEducation and Human Sciences at UNL.
In March/April at the end of the candidate’s first year of teaching
Item 10

6 Professional Responsibility
CEHS Student Teaching Instrument
Summative This instrument consists of 14 items that is completedby the student teacher supervisor and cooperatingteacher on the basis of one being proficient, basic orunsatisfactory on each item.
At the end of the Clinical Experience
Items 12 & 14
Administrator Survey
Summative This is a 21-item instrument that is completed byschool administrators at the end of a candidate’sfirst year of teaching. It is now administered bythe Nebraska Department of Education.
In March/April at the end of the candidate’s first year of teaching
Standards 9.1, 9.2, 9.3, 9.4, 10.1, 10.2
Candidate Teacher Survey
Summative This is a 23-item instrument that is completed byprogram completers at the end of the first year ofteaching. It is
In March/April at the end of the candidate’s first year of teaching
Items 12 & 15

administered by the College ofEducation and Human Sciences at UN-L.
7 Overall Proficiency
Administrator Survey
Summative This is a 21-item instrument that is completed byschool administrators at the end of a candidate’sfirst year of teaching. It is now administered bythe Nebraska Department of Education.
In March/April at the end of the candidate’s first year of teaching
Standard 11.1
Candidate Teacher Survey
Summative This is a 23-item instrument that is completed byprogram completers at the end of the first year ofteaching. It is administered by the College ofEducation and Human Sciences at UNL.
In March/April at the end of the candidate’s first year of teaching
Item 23
8 Optional Assessment

REQUIRED RULE 24 FOLIO APPENDICES
Table 1UNL Admission Requirements
English 4 units of EnglishAll units must include intensive reading and writing experience
Mathematics 4 units of mathematicsMust include Algebra I, II. Geometry and one additional unit that builds on a knowledge of algebra or geometry.
Natural Science 3 units of natural sciencesIncluding at least 2 units selected from biology, chemistry, physics, and earth sciences. One of the units must include laboratory instruction.
Social Studies 3 units of social studiesAt least one unit of American and/or world history and one additional unit of history, American government and/or geography
Foreign Language 2 units of foreign languageMust include 2 units of the same foreign language. Students who are unable to take two years of foreign language in high school may still qualify for admission. Such students will be required to take two semesters of foreign language at the University of Nebraska. These students are required to complete 16 units of academic courses for admission.
Class Rank or ACT/SAT
For assured admission you must also graduate in the upper half of your class, or have an ACT composite score of 20 or higher, or an SAT combined score of 950. All freshman applicants under the age of 23 are required to submit an official ACT or SAT score.
Transfer For assured admission, in addition to completion of core course requirements, you must also show a C average (2.0 on a 4.0 scale) for your cumulative grade point average and a C average on your most recent term of college enrollment

Table 2Major Transition Points
Acceptance into University(Prior to Freshman year)
Acceptance into Teacher Education program(Sophomore year)
Acceptance into Student Teaching(Semester before Student Teaching)
Program Completion/Graduation(After Student Teaching)
-- Completion of specific number of high school units.-- Appropriate ACT /SAT score
--Credit hour minimum--Minimum grades in specific courses-- CORE Academic Tests-- Faculty recommendations-- Completion of Prof. & Personal Fitness Form-- Criminal History check
-- Admission to TEP-- Credit Hour /overall 2.75 GPA minimum-- 2.5 GPA in content areacourses, no grade below a C--2.5 GPA in Prof. ed – specific grade requirements for methods courses-- Criminal History check
-- 120 + credit hours-- successful completion of Student Teaching-- Maintain GPA minimum requirements-- Completion of a senior check--Met all financial obligations-- Apply for degree

Table 3Summary Table of Practicum and Clinical Experiences
Course Cr Days/Wk
Hrs/Day
Weeks Total Hrs
ELED Sec. Ed.
ELED/SPED
ECE Unif
ELED/ECE
TEAC 297A
1 2 3 14 84 84 84 84 84
297B 2 2 7 14 140 140 140 140EDPS 297
1 2 1 14 25
397A 3 2 7 14 196 196 196 196497A 12 5 8 16 640 640 640 640297 1 2 1 10 20 20397 3 5 2 12 120 120397D 3 2 8 15 240 240497 12 5 8 16 640 640497A 6 5 8 40 400 400SPED 397
3 3 4 12 144 120
SPED 496Y
1 2 4 14 56 56
497M 9 5 8 10 400 400CYAF 270L
2 1 4 14 52 52 52
271L 1 1 3 12 36 36 36374L 1 1 3 15 45 45 45497A 9 5 4 16 320 320 320Total -- ----- -------- --------- ------- 1060 780 1340 1473 1513

Instruments Used in Key Assessments:
In order to view the instruments used for the different surveys the provided data for this report, go to the “Instruments” folder at the State Approval website and select each of the following:
Student Teaching Final Evaluation used in Fall 2014–Spring 2015—All Program Completers
Student Teaching Final Evaluation used in Fall 2015–Spring 2016—All Program Completers
NDE First-Year Administrator Survey
First-Year Teacher Survey
SECTION 2: KEY ASSESSMENTS AND FINDINGS — Artifact 2
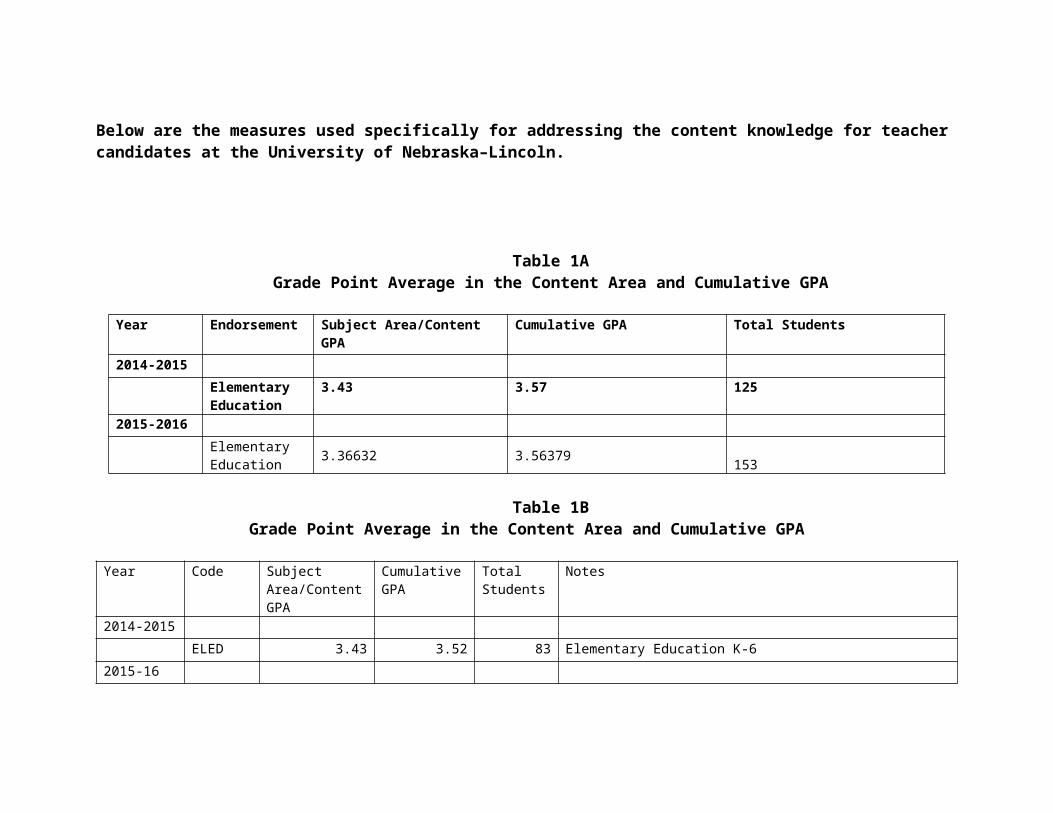
1. Content KnowledgeBelow are the measures used specifically for addressing the content knowledge for teacher candidates at the University of Nebraska–Lincoln.

Table 1A Grade Point Average in the Content Area and Cumulative GPA
Year Endorsement Subject Area/Content GPA Cumulative GPA Total Students
2014-2015Elementary Education
3.43 3.57 125
2015-2016Elementary Education 3.36632 3.56379 153
Table 1BGrade Point Average in the Content Area and Cumulative GPA
Year Code Subject Area/Content GPA
Cumulative GPA
Total Students
Notes
2014-2015ELED 3.43 3.52 83 Elementary Education K-6
2015-16ELED 3.36632 3.54869 103 Elementary Education

Table 2APraxis II—September 2014—August 2015
Pass Rate Based on Nebraska Cut Score
Praxis II – September 2014 – August 2015Pass Rate Based on Nebraska Cut Score
Endrsmnt Test # Cut Score
UNL N
UNL # Passing
UNL # Failing
UNL %age Pass
UNL Mean
State N
State %age Pass
StateMean
National N National %age National
MeanELED 5017 153 151 142 9 94.04 170.66 803 90.78 167.94 4491 91.27 168.74
Table 2BPraxis II – September 2015 – August 2016
Pass Rate Based on Nebraska Cut ScoreEndrsmnt Test # Cut
ScoreUNL N
UNL # Passing
UNL # Failing
UNL %age Pass
UNL Mean
State N
State %age Pass
StateMean
National N National %age National
MeanELED 5017 153 197 190 7 96.45 171.98 849 94.35 168.85 4996 92.77 169.15
Response from College of Education & Human Sciences Student Teaching Instrument Teacher Candidate Summative Evaluation on Subject Matter Knowledge for the 2014-2015 Academic Year for Teaching in General (Item 1).

Table 3AItem 1: Subject Matter Knowledge for Teaching in General
2014-2015Subject Area Scoring
Year # Item Endorsement Unsatisfactory Basic Proficient Grand Total
2014- 2015
1 Subject Matter Knowledge for Teaching in general. Demonstrates capacity to make content knowledge accessible to students.
Early Childhood Education & Elementary Education (ECED)
0 0.00% 0 0.00% 5 100.00% 5
Elementary Education (ELED)
0 0.00% 0 0.00% 95 100.00% 95
Response from College of Education & Human Sciences Student Teaching Instrument Teacher Candidate Summative Evaluation for the 2015-2016 Academic Year on Subject Matter Knowledge for Teaching (Item 3—Table 3B)—LIVETEXT version.

Table 3BItem 3: Subject Matter Knowledge for Teaching in General
2015-2016Subject Area Scoring
Year # Item Endorsement Unacceptable Emergent Sufficient Advanced Grand Total
2015- 2016
3 Subject Matter Knowledge for Teaching.
Subject matter Knowledge for Teaching. Make content knowledge accessible for students
Elementary Ed 0 0.00% 2 2.00% 46 46.00% 52 52.00% 100
Elementary Ed & Early Childhood Ed
0 0.00% 0 0.00% 1 12.50% 7 87.50% 8
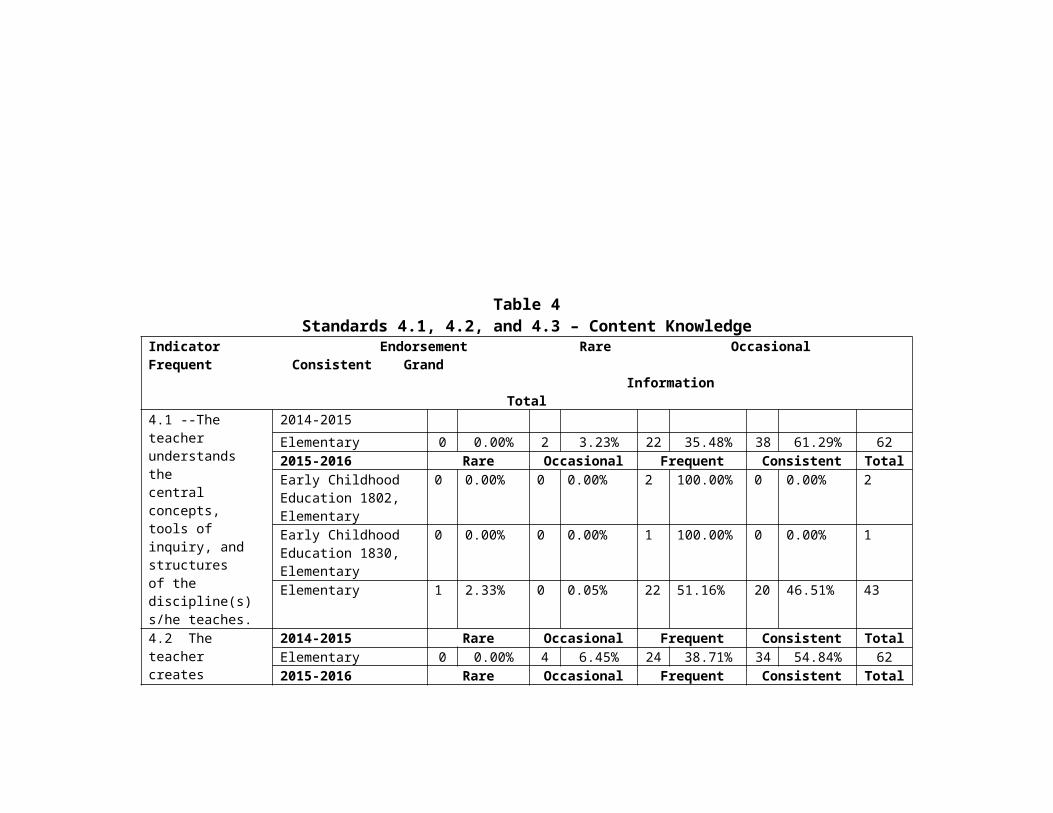
Responses from First Year Administrator Survey: Preparation of Candidate to Teach Content Area.

Table 4Standards 4.1, 4.2, and 4.3 – Content Knowledge
Indicator Endorsement Rare Occasional Frequent Consistent Grand Information Total
4.1 --Theteacher understands thecentral concepts, tools of inquiry, and structuresof the discipline(s) s/he teaches.
2014-2015Elementary 0 0.00% 2 3.23% 22 35.48% 38 61.29% 622015-2016 Rare Occasional Frequent Consistent TotalEarly Childhood Education 1802, Elementary
0 0.00% 0 0.00% 2 100.00% 0 0.00% 2
Early Childhood Education 1830, Elementary
0 0.00% 0 0.00% 1 100.00% 0 0.00% 1
Elementary 1 2.33% 0 0.05% 22 51.16% 20 46.51% 434.2 Theteacher creates learningexperiences that make these aspects of thediscipline accessible and meaningful for studentsto assure mastery of content.
2014-2015 Rare Occasional Frequent Consistent TotalElementary 0 0.00% 4 6.45% 24 38.71% 34 54.84% 622015-2016 Rare Occasional Frequent Consistent TotalEarly Childhood Education 1802, Elementary
0 0.00% 0 0.00% 2 100.00% 0 0.00% 2
Early Childhood Education 1830, Elementary
0 0.00% 0 0.00% 0 0.00% 1 100.00% 1
Elementary 1 2.33% 3 0.05% 19 44.19% 20 46.51% 43
4.3 Theteacher integrates NebraskaContent Standards and/or professional standardswithin instruction.
2014-2015 Rare Occasional Frequent Consistent TotalElementary 0 0.00% 7 11.29% 19 30.65% 36 58.06% 622015-2016 Rare Occasional Frequent Consistent TotalEarly Childhood Education 1802, Elementary
0 0.00% 0 0.00% 1 50.00% 1 50.00% 2
Early Childhood Education 1830, Elementary
0 0.00% 0 0.00% 1 100.00% 0 0.00% 1

Elementary 1 2.33% 0 0.05% 14 32.56% 27 62.79% 43
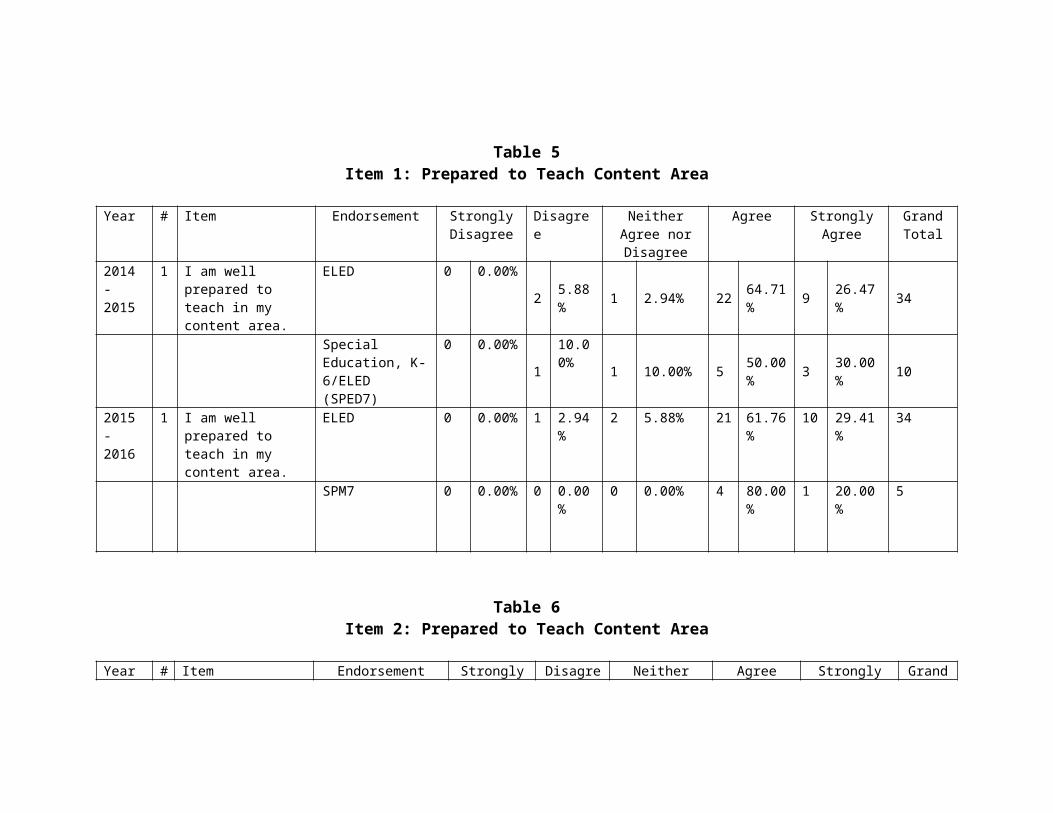
Responses From First Year Candidate Survey: Items Related to Preparation to Teach Content Knowledge (Item 1) and Prepared to Teach Content Area (Item 2).
Table 5Item 1: Prepared to Teach Content Area
Year # Item Endorsement Strongly Disagree
Disagree Neither Agree nor Disagree
Agree Strongly Agree
Grand Total
2014 - 2015
1 I am well prepared to teach in my content area.
ELED 0 0.00%
2 5.88% 1 2.94% 22 64.71% 9 26.47% 34
Special Education, K-6/ELED (SPED7)
0 0.00%
1
10.00%
1 10.00% 5 50.00% 3 30.00% 10
2015 - 2016
1 I am well prepared to teach in my content area.
ELED 0 0.00% 1 2.94% 2 5.88% 21 61.76%
10 29.41% 34
SPM7 0 0.00% 0 0.00% 0 0.00% 4 80.00%
1 20.00% 5
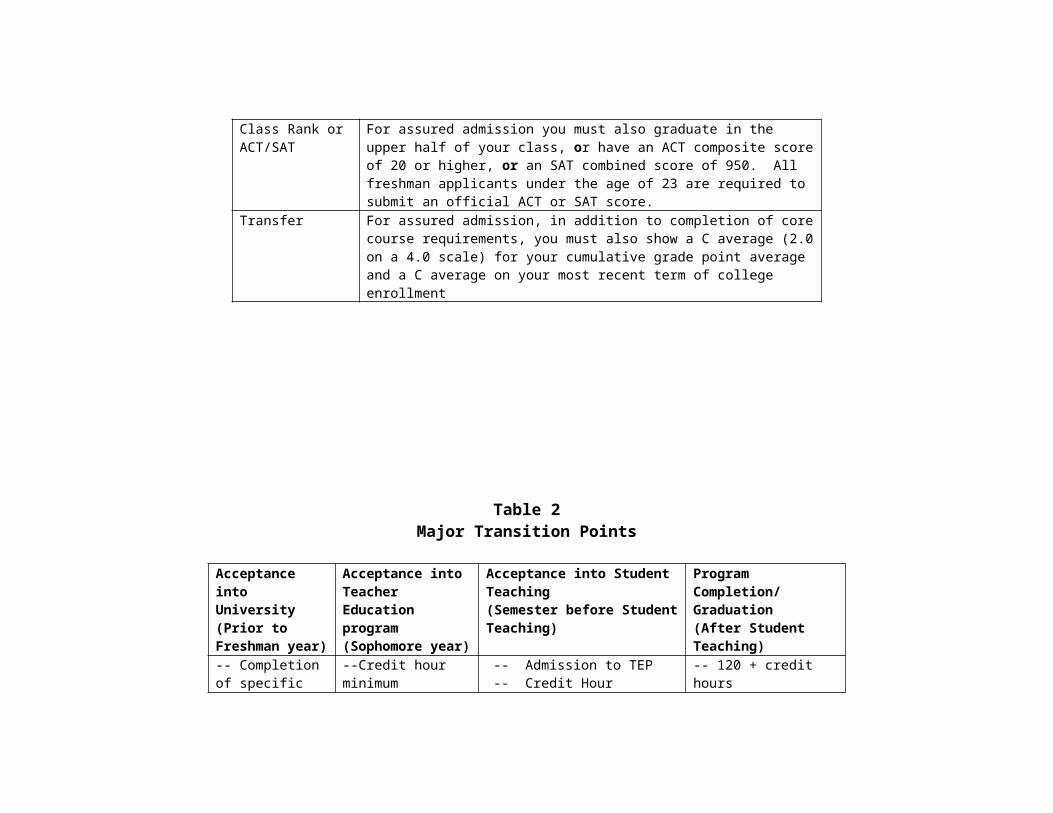
Table 6Item 2: Prepared to Teach Content Area
Year # Item Endorsement Strongly Disagree
Disagree Neither Agree nor Disagree
Agree Strongly Agree
Grand Total
2014 - 2015
2 I am confident in my level of subject matter knowledge.
ELED 0 0.00% 3 8.82% 1 2.94% 20 58.82% 10 29.41% 34
Special Education, K-6 & ELED K-6 (SPED7)
0 0.00% 0 0.00% 1 10.00% 5 50.00% 4 40.00% 10
2015-2016
2 I am confident in my subject matter knowledge.
ELED 0 0.00% 1 3.03% 3 9.09% 20 60.61% 9 27.27% 33
ELED/SEC 0 0.00% 0 0.00% 0 0.00% 0 0.00% 1 100.00% 1
SPM7 0 0.00% 0 0.00% 0 0.00% 3 60.00% 2 40.00% 5

Narrative:In regard to the elementary education program, the tables above demonstrate a positive and consistent trend in Praxis II scores. The data also demonstrate that GPA may be down slightly (3.36632 in 2015-2016 from 3.43 in 2014-2015); however, the total number of students for this period has increased significantly, from 83 to 103. Praxis II scores are consistently high, above national and state average, for this period. The revisions to the student teaching rubric between 2014-2015 and 2015-2016 provide more detailed insight into student teachers’ actual performance and preparation in the content areas. Additional years of data will enable more comprehensive understanding of the trends in content area knowledge for our graduates, because we have implemented the same rubric across all practica and student teaching experiences.
2. Content AreaSee Tables 1-6 from Content Area #1 above (first 8 tables in that section)

Table 7Responses from First Year Administrator Survey: Application of Content
Indicator Endorsement Rare Occasional Frequent Consistent Grand Information Total5.1 The teacher candidate understands how to connect concepts across disciplines
2014-15Elementary 1 1.61% 6 9.68% 27 43.55% 28 45.16% 622015-2016 Rare Occasional Frequent Consistent TotalEarly Childhood Education 1802, Elementary
0 0.00% 0 0.00% 1 50.00% 1 50.00% 2
Early Childhood Education 1830, Elementary
0 0.00% 0 0.00% 1 100.00% 0 0.00% 1
Elementary 1 2.33% 2 0.05% 25 58.14% 14 32.56% 43Special Education, Elementary
0 0.00% 0 0.00% 10 50.00% 10 50.00% 20
5.2 The teacher candidate uses differing perspectives to engage students in critical thinking, creativity, and collaborative problem solving related to authentic local and global issues
2014-2015 Rare Occasional Frequent Consistent TotalElementary 1 1.61% 7 11.29% 24 38.71% 30 48.39% 622015-2016 Rare Occasional Frequent Consistent TotalEarly Childhood Education 1802, Elementary
0 0.00% 0 0.00% 1 50.00% 1 50.00% 2
Early Childhood Education 1830, Elementary
0 0.00% 0 0.00% 0 0.00% 1 100.00% 1
Elementary 1 2.33% 3 0.05% 24 55.81% 15 34.88% 43Special Education, Elementary
0 0.00% 0 0.00% 8 40.00% 12 60.00% 20
Responses From First Year Candidate Survey: Items Related to Teaching Subject Matter Materials in Ways Meaningful to Learners (Item 14).
Table 8Item 14: Prepared to Teach Content Area
Year # Item Endorsement Strongly
DisagreeDisagree Neither Agree
nor DisagreeAgree Strongly
AgreeGrand Total
2014 - 2015
14 I teach subject matter in ways that are meaningful to learners.
ELED 0 0.00% 0 0.00% 2 6.06% 19 57.58% 12 36.36% 33
Special Education, K-6/ELED, K-6 (SPED7)
0 0.00% 0 0.00% 1 10.00% 4 40.00% 5 50.00% 10
2015-2016
14 I teach subject matter in ways that are meaningful to learners.
ELED 0 0.00% 0 0.00% 4 12.12% 21 63.64% 8 24.24% 33
ELED/SEC 0 0.00% 0 0.00% 0 0.00% 1 100.00% 0 0.00% 1
SPM7 0 0.00% 0 0.00% 1 20.00% 2 40.00% 2 40.00% 5
Narrative:The above tables demonstrate that administrators are consistently rating our students high across 2014-2015 and 2015-2016 with regard to our former teacher candidates’ ability to cover concepts across disciplines, think critically, and problem solve collaboratively. Ratings of “frequent” and “consistent,” the highest categories for the evaluation rubric, range from 86-90%. Nearly all former students self-report that they agree or strongly agree that they are prepared to teach subjects in meaningful ways.
3. Learner/Learning Environments
Response From College of Education & Human Sciences Student Teaching Instrument Teacher Candidate Summative Evaluation on Planning for Learning for the 2014-2015 Academic Year (Item 2—Table 9A).

Table 9AItem 2: Subject Planning for Learning
2014-2015Subject Area Scoring
Year # Item Endorsement Unsatisfactory Basic Proficient Grand Total
2014- 2015
2 Demonstrates capacity to create useable lesson and unit plans that are based upon knowledge of the discipline, students, and curricular goals
Early Childhood Education/ELED (ECED)
0 0.00% 1 20.00% 4 80.00% 5
ELED 0 0.00% 3 3.06% 95 96.94% 98
Special Education, K-6/ ELED, K-6 (SPM7)
1 2.56% 5 12.82% 33 84.62% 39
Response From College of Education & Human Sciences Student Teaching Instrument Teacher Candidate Summative Evaluation for the 2015-2016 Academic Year on Planning for Learning (Item 4—Table 9B)—LIVETEXT version.
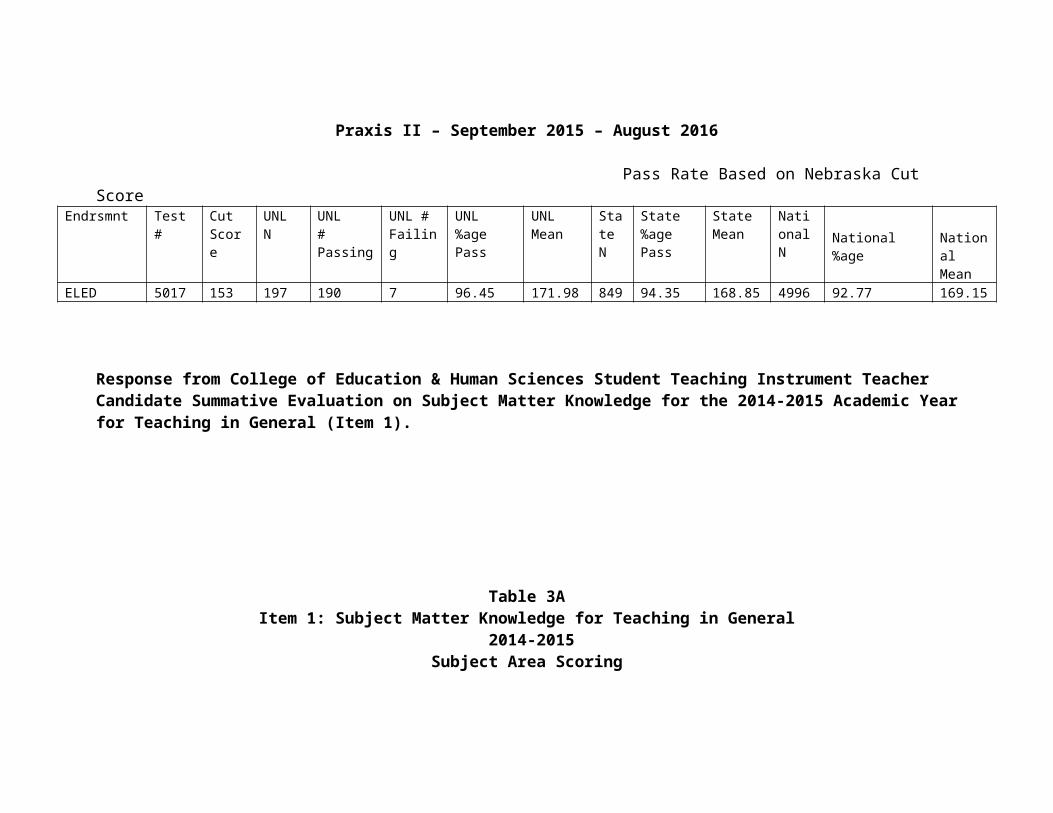
Table 9BItem 4: Planning for Learning
2015-2016Subject Area Scoring
Year # Item Endorsement Unacceptable Emergent Sufficient Advanced Grand Total
2015- 2016
4 Planning for learning:Creates usable lessons and unit plans based on knowledge of the discipline, students, and curricular goals
Elementary Ed 0 0.00% 1 1.00% 33 33.00% 66 66.00% 100
Elementary Ed & Early Childhood Ed
0 0.00% 0 0.00% 1 12.50% 7 87.50% 8
Elementary & Special Education
0 0.00% 0 0.00% 12 23.53% 39 76.47% 51
Response From College of Education & Human Sciences Student Teaching Instrument Teacher Candidate Summative Evaluation for the 2014-2015 Academic Year on Instructional Enactment (Item 3—Table 10A).

Table 10AItem 3: Instructional Enactment
2014-2015Subject Area Scoring
Year # Item Endorsement Unsatisfactory Basic Proficient Grand Total
2014- 2015
3 Demonstrates Capacity to implement, modify, and adapt plans that are responsive to students and curricular goals
ELED 0 0.00% 5 5.10% 93 94.90% 98
Special Education, K-6/ELED, K-6 (SPM7)
0 0.00% 4 10.26% 35 89.74% 39
Response From College of Education & Human Sciences Student Teaching Instrument Teacher Candidate Summative Evaluation for the 2015-2016 Academic Year on Responsive Teaching (Item 5—Table 10B). LIVETEXT version.
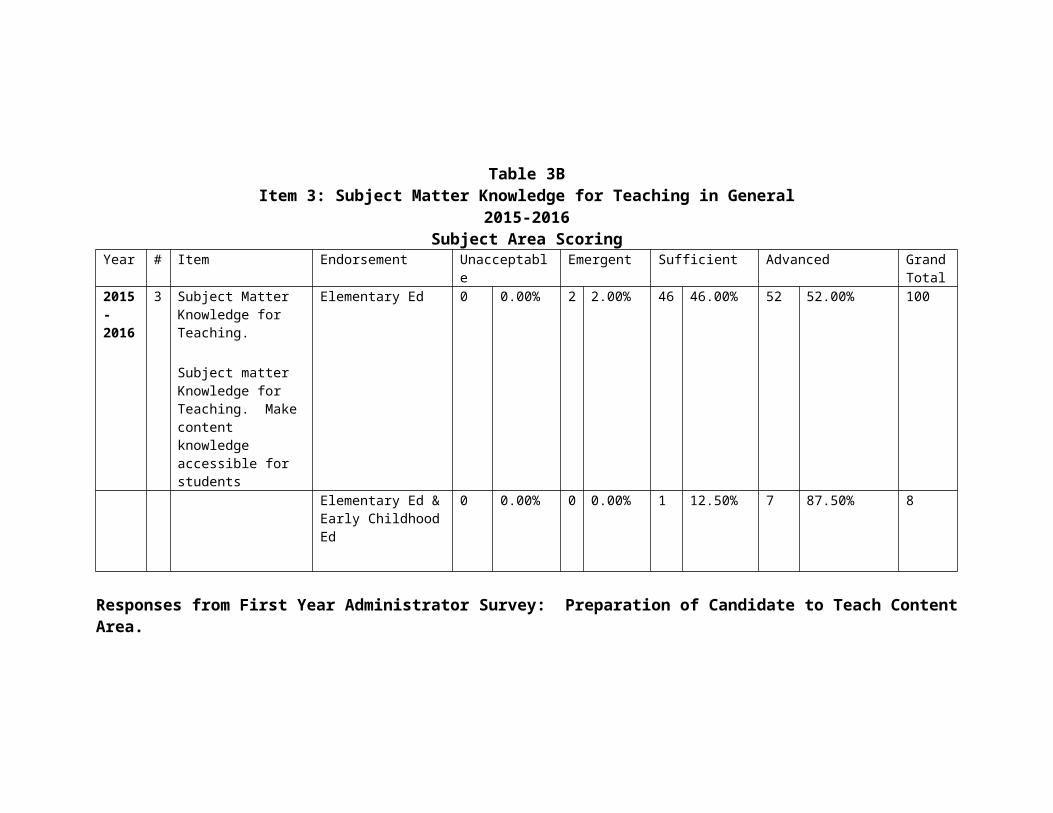
Table 10BItem 5: Responsive Teaching
2015-2016Subject Area Scoring
Year # Item Endorsement Unacceptable Emergent Sufficient Advanced Grand Total
2015- 2016
5 Responsive Teaching:Skillfully implements lessons that are flexible and intentional to meet individual student needs
Elementary Ed 0 0.00% 1 1.00% 34 34.00% 65 65.00% 100
Elementary Ed & Early Childhood Ed
0 0.00% 0 0.00% 1 12.50% 7 87.50% 8
Elementary & Special Education
0 0.00% 1 1.96% 15 29.41% 35 68.63% 51
Responses From First Year Administrator Survey: Items Related to Student Development, Learning Differences, and Learning Environments: Student Development (Standards 1.1, 1.2, and 1.3); Learning Differences (Standards 2.1 and 2.2); Learning Environments (Standards 3.1 and 3.2).
Table 11
Standards 1.1, 1.2, and 1.3: Student Development
Indicator Endorsement Rare Occasional Frequent Consistent Grand Information Total
1.1 The teacher understands how students grow and develop.
2014-2015Elementary 0 0.00% 3 4.84% 26 41.94% 33 53.23% 62
2015-2016 Rare Occasional Frequent Consistent TotalEarly Childhood Education 1802, Elementary
0 0.00% 0 0.00% 2 100.00% 0 0.00% 2
Early Childhood Education 1830, Elementary
0 0.00% 0 0.00% 0 0.00% 1 100.00% 1
Elementary 1 2.33% 4 0.05% 15 34.88% 23 53.49% 43Special Education, Elementary
0 0.00% 0 0.00% 5 25.00% 15 75.00% 20
2014-2015 Rare Occasional Frequent Consistent Total 2 0.00% 4Elementary 0 0.00% 3 4.84% 26 41.94% 28 52.83% 532015-2016 Rare Occasional Frequent Consistent Total 4 57.14% 7Early Childhood Education 1802, Elementary
0 0.00% 0 0.00% 1 50.00%
33 53.23% 62Early Childhood Education 1830, Elementary
0 0.00% 0 0.00% 0 0.00%
2 50.00% 4Elementary 1 2.33% 4 0.05% 16 37.21% 32 53.33% 60Special Education, Elementary
0 0.00% 0 0.00% 6 30.00%12 70.59% 17
2014-2015 Rare Occasional Frequent Consistent Total 3 0.00% 4Elementary 0 0.00% 4 6.45% 21 33.87% 28 52.83% 53
2015-2016 Rare Occasional Frequent Consistent Total 4 57.14% 7Early Childhood 0 0.00% 0 0.00% 0 0.00% 37 59.68% 62

Education 1802, ElementaryEarly Childhood Education 1830, Elementary
0 0.00% 0 0.00% 0 0.00%
2 50.00% 4Elementary 1 2.33% 6 0.05% 15 34.88% 32 54.24% 59Special Education, Elementary
0 0.00% 0 0.00% 8 40.00%8 47.06% 17
Table 12Standards 2.1 and 2.2: Learning Differences
Indicator Endorsement Rare Occasional Frequent Consistent Grand Information Total2.1 The teacher understands individual differences and diverse cultures and communities
2014-2015Elementary 0 0.00% 4 6.45% 27 43.55% 31 50.00% 622015-2016 Rare Occasional Frequent Consistent TotalEarly Childhood Education 1802, Elementary
0 0.00% 0 0.00% 0 0.00% 2 100.00% 2
Early Childhood Education 1830, Elementary
0 0.00% 0 0.00% 1 100.00% 0 0.00% 1
Elementary 1 2.33% 5 0.05% 10 23.26% 27 62.79% 43Special Education, Elementary
0 0.00% 0 0.00% 5 25.00% 15 75.00% 20
2.2 The teacher ensures inclusive learning environments that enable each student to meet high demands
2014-2015 Rare Occasional Frequent Consistent TotalElementary 0 0.00% 3 4.84% 23 37.10% 36 58.06% 622015-2016 Rare Occasional Frequent Consistent TotalEarly Childhood Education 1802, Elementary
0 0.00% 0 0.00% 1 50.00% 1 50.00% 2
Early Childhood Education 1830, Elementary
0 0.00% 0 0.00% 1 100.00% 0 0.00% 1
Elementary 1 2.33% 6 0.05% 14 32.56% 22 51.16% 43Special Education, Elementary
0 0.00% 0 0.00% 4 20.00% 16 80.00% 20
Table 13Standards 3.1 and 3.2: Learning Environments

Indicator Endorsement Rare Occasional Frequent Consistent Grand Information Total3.1 The teacher works with others to create environments that support individual and collaborative learning.
2014-2015Elementary 0 0.00% 2 3.23% 21 33.87% 38 61.29% 622015-2016 Rare Occasional Frequent Consistent TotalEarly Childhood Education 1802, Elementary
0 0.00% 0 0.00% 1 50.00% 1 50.00% 2
Early Childhood Education 1830, Elementary
0 0.00% 0 0.00% 0 0.00% 1 100.00% 1
Elementary 1 2.33% 6 0.05% 14 32.56% 22 51.16% 43Special Education, Elementary
0 0.00% 0 0.00% 4 20.00% 16 80.00% 20
3.2 The teacher creates environments that encourage positive social interaction, active engagement in learning, and self-motivation.
2014-2015 Rare Occasional Frequent Consistent TotalElementary 1 1.61% 2 3.23% 20 32.26% 39 62.90% 622015-2016 Rare Occasional Frequent Consistent TotalEarly Childhood Education 1802, Elementary
0 0.00% 0 0.00% 0 0.00% 2 100.00% 2
Early Childhood Education 1830, Elementary
0 0.00% 0 0.00% 0 0.00% 1 100.00% 1
Elementary 1 2.33% 6 0.05% 12 27.91% 24 55.81% 43Special Education, Elementary
0 0.00% 0 0.00% 3 15.00% 17 85.00% 20
3.3 The teacher manages student behavior to promote a positive learning environment.
2014-2015 Rare Occasional Frequent Consistent Total
Elementary 0 0.00% 3 4.84% 22 35.48% 37 59.68% 62
2015-2016 Rare Occasional Frequent Consistent TotalEarly Childhood Education 1802, Elementary
0 0.00% 0 0.00% 1 50.00% 1 50.00% 2

Early Childhood Education 1830, Elementary
0 0.00% 0 0.00% 0 0.00% 1 100.00% 1
Elementary 2 4.65% 7 0.11% 16 37.21% 18 41.86% 43Special Education, Elementary
0 0.00% 1 0.00% 5 25.00% 14 70.00% 20
Responses From First Year Candidate Survey: Items Related to Student Learning: Understands How Learners Learn (Item 3), and Adapts to Developmental Strategies of Learners (Item 4).
Table 14Item 3: Understands How Learners Learn

Year # Item Endorsement Strongly Disagree
Disagree Neither Agree nor Disagree
Agree Strongly Agree Grand Total
2014 - 2015
3 I positively impact the learning and development of all students.
ELED
0 0.00%
1
2.94%
0
0.00%
15
44.12%
18
52.94%
34
Special Education K-6 & ELED K-6 (SPED7)
0 0.00%
0
0.00%
0
0.00%
5
50.00%
5
50.00%
10
2015-2016
3 I positively impact the learning and development of all students.
ELED 0 0.00% 0 0.00% 4 12.12% 17 51.52% 12 36.36% 33
ELED/SEC 0 0.00% 0 0.00% 0 0.00% 0 0.00% 1 100.00% 1
SPM7 0 0.00% 0 0.00% 0 0.00% 3 60.00% 2 40.00% 5
Table 15Item 4: Adapts to Developmental Strategies of Learners

Year # Item Endorsement Strongly Disagree
Disagree Neither Agree nor Disagree
Agree Strongly Agree
Grand Total
2014 - 2015
4 I adapt to different developmental stages of learners.
ELED
0 0.00% 00.00%
3
8.82%
1647.06%
15
44.12%
34
Special Education K-6 & ELED K-6 (SPED7)
0 0.00% 00.00%
0
0.00%
550.00%
5
50.00%
10
2015-2016
4 I adapt to different developmental stages of learners
ELED 0 0.00% 0 0.00%
5 15.15% 16 48.48%
12 36.36% 33
ELED/SEC 0 0.00% 0 0.00%
0 0.00% 0 0.00% 1 100.00%
1
SPM7 0 0.00% 0 0.00%
0 0.00% 3 60.00%
2 40.00% 5
Narrative:The changes to the evaluation rubric between 2014-2015 and 2015-2016 have provided more detailed information regarding our teacher candidates’ preparation. The same rubric has been implemented across all practica and student

teaching experiences. Examining the above tables reveals that our teacher candidates are primarily being rated in the highest categories. Our students grew from 96% to 98.92% in planning for learning, from 93.6% to 98.92% in instructional enactment/responsive teaching, and from 4.84% to 85.98% in learning differences 3.3. However, they fell from 95.17% to 88.37% in student development 1.1, from 95.17% to 90.57% in student development 1.2, 93.73% to 86.7% in student development 1.3, from 93.55% to 88.68% in learning differences 2.1, from 95.16% to 86.79% in learning differences 2.2, from 96.73% to 86.79% in learning differences 3.1, from 95.16% to 86.8% in learning differences 3.2, from 98% to 90% in understanding how learners learn, and from 91.8% to 84% in adapting to developmental strategies of learners.

4. Instructional Practices–Candidate Knowledge and SkillsResponse from College of Education & Human Sciences Student Teaching Instrument Teacher Candidate Summative Evaluation for the 2014-2015 Academic Year on Planning for Learning, Instructional Enactment (Item 2—Table 16A)
Table 16AItem 2: Subject Planning for Learning
2014-2015Subject Area Scoring
Year # Item Endorsement Unsatisfactory Basic Proficient Grand Total
2014- 2015
2 Demonstrates capacity to create useable lesson and unit plans that are based upon knowledge of the discipline, students, and curricular goals
Early Childhood Education/ELED (ECED)
0 0.00% 1 20.00% 4 80.00% 5
ELED 0 0.00% 3 3.06% 95 96.94% 98
Special Education, K-6/ ELED, K-6 (SPM7)
1 2.56% 5 12.82% 33 84.62% 39
Response From College of Education & Human Sciences Student Teaching Instrument Teacher Candidate Summative Evaluation on Planning for Learning for 2015-2016 Academic Year on Planning for Learning (Item 4—Table 16B)—LIVETEXT version.
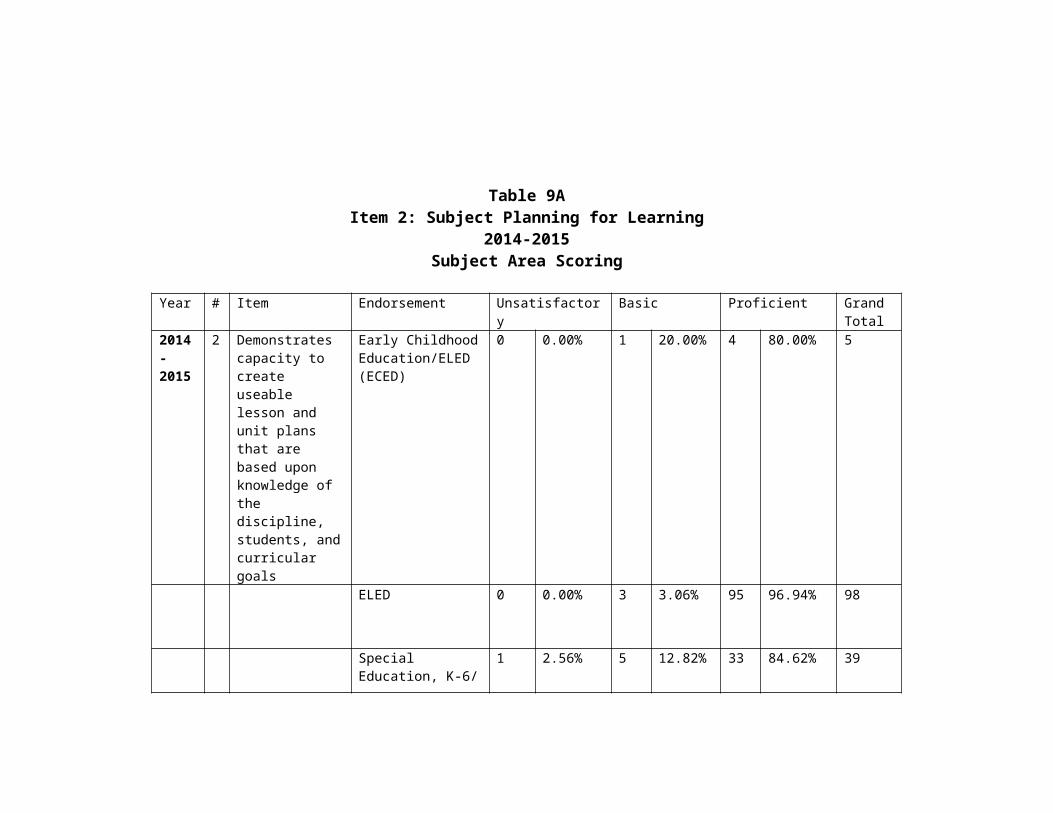
Table 16BItem 4: Planning for Learning
2015-2016Subject Area Scoring
Year # Item Endorsement Unacceptable Emergent Sufficient Advanced Grand Total
2015- 2016
4 Planning for learning:Creates usable lessons and unit plans based on knowledge of the discipline, students, and curricular goals
Elementary Ed 0 0.00% 1 1.00% 33 33.00% 66 66.00% 100
Elementary Ed & Early Childhood Ed
0 0.00% 0 0.00% 1 12.50% 7 87.50% 8
Elementary & Special Education
0 0.00% 0 0.00% 12 23.53% 39 76.47% 51
Response From College of Education & Human Sciences Student Teaching Instrument Teacher Candidate Summative Evaluation for the 2014-2015 Academic Year on the Learning Environment (Item 3)

Table 17AItem 3: Instructional Enactment
2014-2015Subject Area Scoring
Year # Item Endorsement Unsatisfactory Basic Proficient Grand Total
2014- 2015
3 Demonstrates Capacity to implement, modify, and adapt plans that are responsive to students and curricular goals
ELED 0 0.00% 5 5.10% 93 94.90% 98
Special Education, K-6/ ELED, K-6 (SPM7)
0 0.00% 4 10.26% 35 89.74% 39
Response From College of Education & Human Sciences Student Teaching Instrument Teacher Candidate Summative Evaluation on Planning for Learning for the 2015-2016 Academic Year on Responsive Teaching (Item 5—Table 17B)— LIVETEXT version.

Table 17BItem 5: Responsive Teaching
2015-2016Subject Area Scoring
Year # Item Endorsement Unacceptable Emergent Sufficient Advanced Grand Total
2015- 2016
5 Responsive Teaching:
Skillfully implements lessons that are flexible and intentional to meet individual student needs
Elementary Ed 0 0.00% 1 1.00% 34 34.00% 65 65.00% 100
Elementary Ed & Early Childhood Ed
0 0.00% 0 0.00% 1 12.50% 7 87.50% 8
Elementary & Special Education
0 0.00% 1 1.96% 15 29.41% 35 68.63% 51
Response From College of Education & Human Sciences Student Teaching Instrument Teacher Candidate Summative Evaluation for the 2014-2015 Academic Year on the Learning Environment (Item 6—Table 18A).

Table 18AItem 6: Learning Environment
2014-2015Subject Area Scoring
Year # Item Endorsement Unsatisfactory Basic Proficient Grand Total
2014- 2015
6 Learning Environment. Demonstrates capacity to create classroom communities that invite students’ engagement and learning, encourages positive social interaction and self-motivation.
Early Childhood Education/ELED (ECED)
0 0.00% 0 0.00% 5 100.00% 5
ELED 0 0.00% 7 7.14% 91 92.86% 98
Special Education, K-6/ ELED, K-6 (SPM7)
0 0.00% 3 7.69% 36 92.31% 39
Response From College of Education & Human Sciences Student Teaching Instrument Teacher Candidate Summative Evaluation on Planning for Learning for the 2015-2016 Academic Year on Learning Culture (Item 10—Table 18B)—LIVETEXT version.

Table 18B -- Item 10: Learning Culture2015-2016
Subject Area ScoringYear # Item Endorsement Unacceptable Emergent Sufficient Advanced Grand
Total2015- 2016
10 Learning Culture:Creates classroom communities that invite student engagement and learning and encourage positive social interactions.
Elementary Ed 0 0.00% 0 0.00% 33 33.33% 66 66.67% 99
Elementary Ed & Early Childhood Ed
0 0.00% 0 0.00% 2 25.00% 6 75.00% 8
Elementary & Special Education
0 0.00% 0 0.00% 7 14.58% 41 85.42% 48

Responses From First Year Administrator Survey: Items Related to Planning for Instruction (Standards 7.1, 7.2, and 7.3) and Instructional Strategies (Standards 8.1, 8.2, and 8.3)
Table 19Standards 7.1, 7.2, and 7.3: Planning for Instruction
Indicator Endorsement Rare Occasional Frequent Consistent Grand Information Total7.1 The teacher plans instruction that supports every student in meeting rigorous learning goals.
2014-2015Elementary 0 0.00% 5 8.06% 24 38.71% 33 53.23% 62
Early Childhood 0.00% 1 14.29% 2 28.57% 4 57.14% 7Elementary 0.00% 5 8.06% 24 38.71% 33 53.23% 62Middle Grades 0.00% 0.00% 1 25.00% 3 75.00% 4Content (Subject Area) Endorsements 0.00% 4 6.78% 22 37.29% 33 55.93% 59Special Education 1 5.88% 4 23.53% 6 35.29% 6 35.29% 17 Total 1 0.67% 14 9.40% 55 36.91% 79 53.02% 149
2015-2016 Rare Occasional Frequent Consistent TotalEarly Childhood Education 1802, Elementary
0 0.00% 0 0.00% 0 0.00% 2 100.00% 2
Early Childhood Education 1830, Elementary
0 0.00% 0 0.00% 0 0.00% 1 100.00% 1
Elementary 1 2.33% 4 0.05% 21 48.84% 17 39.53% 43Special Education, Elementary
0 0.00% 0 0.00% 7 35.00% 13 65.00% 20
7.2 The teacher
2014-2015 Rare Occasional Frequent Consistent TotalElementary 0 0.00% 5 8.06% 23 37.10% 34 54.84% 62

candidate draws upon knowledge of content areas, curriculum, cross-disciplinary skills, technology, and pedagogy.
2015-2016 Rare Occasional Frequent Consistent TotalEarly Childhood Education 1802, Elementary
0 0.00% 0 0.00% 2 100.00% 0 0.00% 2
Early Childhood Education 1830, Elementary
0 0.00% 0 0.00% 0 0.00% 1 100.00% 1
Elementary 2 4.65% 2 0.11% 22 51.16% 17 39.53% 43Special Education, Elementary
0 0.00% 0 0.00% 9 45.00% 11 55.00% 20
7.3 The teacher draws upon knowledge of students and the community context.
2014-2015 Rare Occasional Frequent Consistent TotalElementary 0 0.00% 4 6.45% 23 37.10% 35 56.45% 622015-2016 Rare Occasional Frequent Consistent TotalEarly Childhood Education 1802, Elementary
0 0.00% 0 0.00% 1 50.00% 1 50.00% 2
Early Childhood Education 1830, Elementary
0 0.00% 0 0.00% 1 100.00% 0 0.00% 1
Elementary 1 2.33% 5 0.05% 18 41.86% 19 44.19% 43Special Education, Elementary
0 0.00% 0 0.00% 7 35.00% 13 65.00% 20

Table 20Standard 8.1, 8.2, and 8.3: Instructional Strategies
Indicator Endorsement Rare Occasional Frequent Consistent Grand Information Total8.1 The teacher understands a variety of instructional strategies.
2014-2015Elementary 0 0.00% 7 11.29% 18 29.03% 37 59.68% 62
2015-2016 Rare Occasional Frequent Consistent TotalEarly Childhood Education 1802, Elementary
0 0.00% 0 0.00% 0 0.00% 2 100.00% 2
Early Childhood Education 1830, Elementary
0 0.00% 0 0.00% 1 100.00% 0 0.00% 1
Elementary 2 4.65% 1 0.11% 18 41.86% 21 48.84% 43Special Education, Elementary
0 0.00% 0 0.00% 4 20.00% 16 80.00% 20
8.2 The teacher uses a variety of instructional strategies to encourage students to develop deep understanding of content areas and their connection and to build skills to apply knowledge in meaningful ways.
2014-2015 Rare Occasional Frequent Consistent TotalElementary 0 0.00% 7 11.29% 24 38.71% 31 50.00% 62
2015-2016 Rare Occasional Frequent Consistent TotalEarly Childhood Education 1802, Elementary
0 0.00% 0 0.00% 0 0.00% 2 100.00% 2
Early Childhood Education 1830, Elementary
0 0.00% 0 0.00% 1 100.00% 0 0.00% 1
Elementary 1 2.33% 2 0.05% 20 46.51% 19 44.19% 43Special Education, Elementary
0 0.00% 0 0.00% 5 25.00% 15 75.00% 20
8.3 The teacher 2014-2015 Rare Occasional Frequent Consistent Total

utilizes available technology for instruction and assessment.
Elementary 0 0.00% 4 6.45% 23 37.10% 35 56.45% 62
2015-2016 Rare Occasional Frequent Consistent TotalEarly Childhood Education 1802, Elementary
0 0.00% 0 0.00% 2 100.00% 0 0.00% 2
Early Childhood Education 1830, Elementary
0 0.00% 0 0.00% 1 100.00% 0 0.00% 1
Elementary 1 2.33% 3 0.05% 16 37.21% 22 51.16% 43Special Education, Elementary
0 0.00% 1 0.00% 4 20.00% 15 75.00% 20
Responses From First Year Candidate Survey: Items Related to Creating Effective Instructional Plans (Item 7), Working Effectively as Part of an Instructional Planning Team (Item 8), Classroom Management (Item 9), Instruction Requires Problem Solving or Critical Thinking Skills (Item 16), Instruction is Adapted to the Needs of Learners with Special Needs (Item 17), and Use of Multiple Methods to Teach (Item 20).

Table 21Item 7: Create Effective Instructional Plans
Year # Item Endorsement Strongly
DisagreeDisagree Neither Agree
nor DisagreeAgree Strongly
AgreeGrand Total
2014 - 2015
7 I create effective instructional plans.
ELED
0 0.00%
0
0.00%
2
5.88%
19
55.88%
13
38.24%
34
Special Education K-6 & ELED K-6 (SPED7)
0 0.00%
0
0.00%
1
10.00%
5
50.00%
4
40.00%
10
2015-2016
7 I create effective new lesson plans
ELED 0 0.00% 1 3.03% 7 21.21% 18 54.55% 7 21.21% 33
ELED/SEC 0 0.00% 0 0.00% 0 0.00% 1 100.00% 0 0.00% 1
SPM7 0 0.00% 0 0.00% 0 0.00% 4 80.00% 1 20.00% 5

Table 22Item 8: Work Effectively as a Part of an Instructional Team
Year # Item Endorsement Strongly Disagree
Disagree Neither Agree nor Disagree
Agree Strongly Agree
Grand Total
2014 - 2015
8 I work effectively as part of an instructional planning team.
ELED
0 0.00%
1
2.94%
1
2.94%
14
41.18%
18
52.94%
34
Special Education K-6 & ELED K-6 (SPED7)
0 0.00%
1
10.00%
1
10.00%
2
20.00%
6
60.00%
10
2015-2016
8 I work effectively as part of an instructional team
ELED 0 0.00% 3 9.09% 1 3.03% 16 48.48% 13 39.39% 33
ELED/SEC 0 0.00% 0 0.00% 0 0.00% 1 100.00% 0 0.00% 1
SPM7 0 0.00% 0 0.00% 0 0.00% 3 60.00% 2 40.00% 5
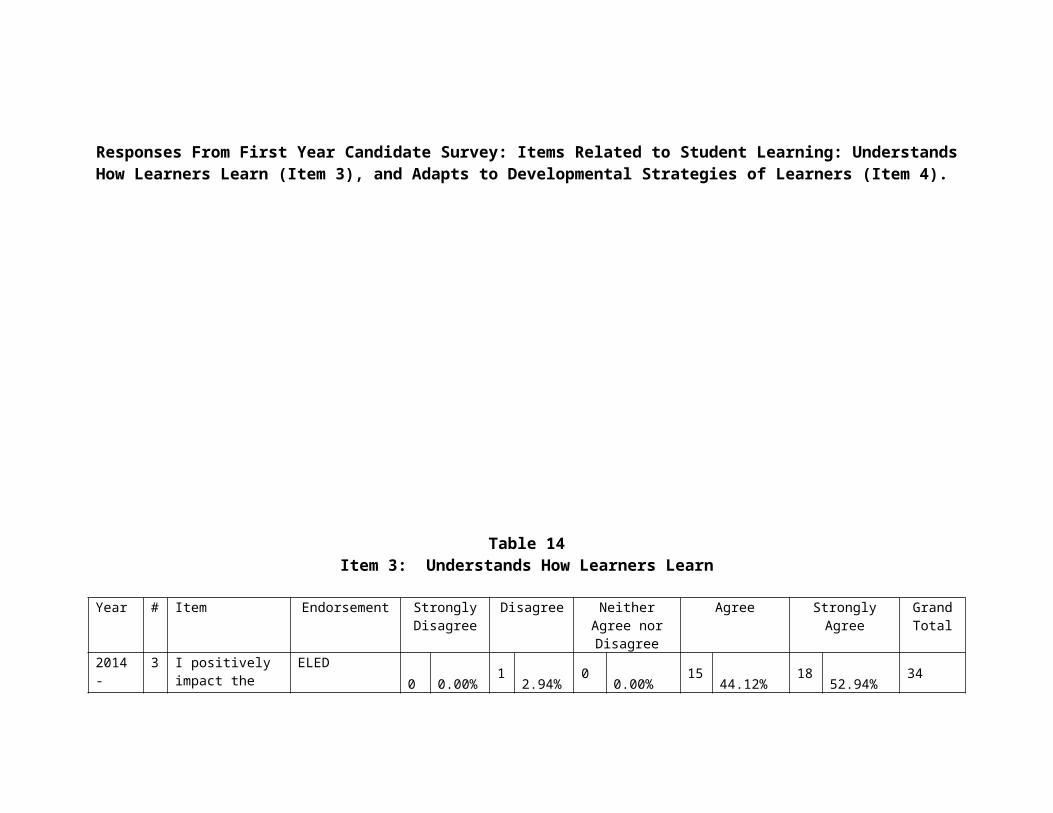
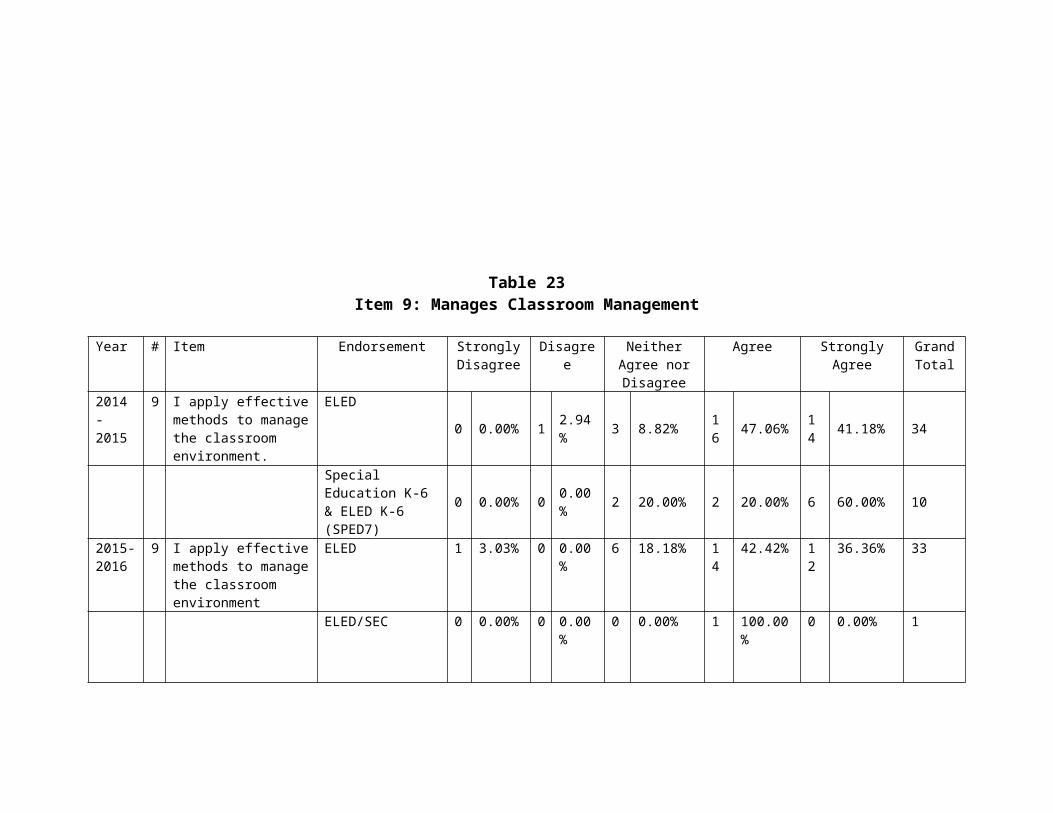
Table 23Item 9: Manages Classroom Management
Year # Item Endorsement Strongly Disagree
Disagree Neither Agree nor Disagree
Agree Strongly Agree Grand Total
2014 - 2015
9 I apply effective methods to manage the classroom environment.
ELED
0 0.00% 1 2.94% 3 8.82% 16 47.06% 14 41.18% 34
Special Education K-6 & ELED K-6 (SPED7) 0 0.00% 0 0.00% 2 20.00% 2 20.00% 6 60.00% 10
2015-2016
9 I apply effective methods to manage the classroom environment
ELED 1 3.03% 0 0.00% 6 18.18% 14
42.42% 12 36.36% 33
ELED/SEC 0 0.00% 0 0.00% 0 0.00% 1 100.00% 0 0.00% 1
SPM7 0 0.00% 0 0.00% 1 20.00% 2 40.00% 2 40.00% 5

Table 24Item 16: Instruction Requires Student Problem Solving and/or Critical Thinking Skills
Year # Item Endorsement Strongly Disagree
Disagree Neither Agree nor Disagree
Agree Strongly Agree
Grand Total
2014 - 2015
16 My instruction requires student problem solving and/or critical thinking skills.
ELED
0
0.00% 0 0.00% 5 14.71% 18 52.94% 11 32.35% 34
Special Education K-6 & ELED K-6 (SPED7)
0
0.00% 0 0.00% 0 0.00% 5 50.00% 5 50.00% 10
2015-2016
16 My instruction requires student problem solving and/or critical thinking skills
ELED 0 0.00% 1 3.03% 3 9.09% 23 69.70% 6 18.18% 33
ELED/SEC 0 0.00% 0 0.00% 0 0.00% 1 100.00% 0 0.00% 1
SPM7 0 0.00% 0 0.00% 1 20.00% 3 60.00% 1 20.00% 5

Table 25Item 17: Adapt Instruction to Meet Needs of Learners With Special Needs
Year # Item Endorsement Strongly Disagree
Disagree Neither Agree nor Disagree
Agree Strongly Agree
Grand Total
2014 - 2015
17 I adapt my instruction to the needs of learners with special needs.
ELED
0
0.00% 1 2.94% 6 17.65% 13 38.24% 14 41.18% 34
Special Education K-6 & ELED K-6 (SPED7)
0
0.00% 0 0.00% 0 0.00% 4 40.00% 6 60.00% 10
2015-2016
17 I adapt my instruction to the needs of learners with special needs.
ELED 0 0.00% 0 0.00% 6 18.18% 19 57.58% 8 24.24% 33
ELED/SEC 0 0.00% 0 0.00% 0 0.00% 0 0.00% 1 100.00% 1
SPM7 0 0.00% 0 0.00% 0 0.00% 1 20.00% 4 80.00% 5

Table 26Item 20: Use Multiple Methods to Teach
Year # Item Endorsement Strongly Disagree
Disagree Neither Agree nor Disagree
Agree Strongly Agree
Grand Total
2014 - 2015
20
I use multiple methods to teach.
ELED
0 0.00% 0 0.00%
3
8.82%
14
41.18%
17
50.00%
34
Special Education K-6 & ELED K-6 (SPED7)
0 0.00% 0 0.00%
1
10.00%
7
70.00%
2
20.00%
10
2015-2016
20
I use multiple methods to teach
ELED 0 0.00% 0 0.00% 3 9.09% 19 57.58% 11 33.33% 33
ELED/SEC 0 0.00% 0 0.00% 0 0.00% 1 100.00% 0 0.00% 1
SPM7 0 0.00% 1 20.00% 0 0.00% 2 40.00% 2 40.00% 5

Narrative:The changes to the rubric have resulted in more detailed information about our teacher candidates’ instructional practices. Although at first glance, it might appear that our ratings have fallen, the expansion from three categories to four has resulted in the former category “proficient” now being split into “sufficient” and “advanced.” Thus, these categories, the “agree” and ”strongly agree”, and “frequent” and “consistent” must be added to compare the data. This examination reveals that our students increased from 96% to 98.92% in planning for learning, from 93.6% to 98.92% in instructional enactment/responsive teaching, from 92.8% to 99.45% in learning culture/learning environment, from 88.71% to 94.23% in instructional strategies 8.1, from 88.71% to 92.30% in instructional strategies 8.2, from 89.8% to 90% in working effectively as a part of an instruction team, from 87.8% to 88% in instruction involving student problem solving or critical thinking skills, and from 87.8% to 90% in using multiple methods to teach. Our students, however, decreased from 91.94% to 90.56% in planning for instruction 7.1, from 91.94% to 90.56% in planning instruction 7.2, and from 93.46% to 86.79% in planning instruction 7.3, from 93.46% to 90.39% in instructional strategies 8.3, from 93.9% to 84% in creating effective instructional plans, from 89.8% to 80% in classroom management, and from 85.7% to 84% in adapting instruction to meet needs of learners with special needs.

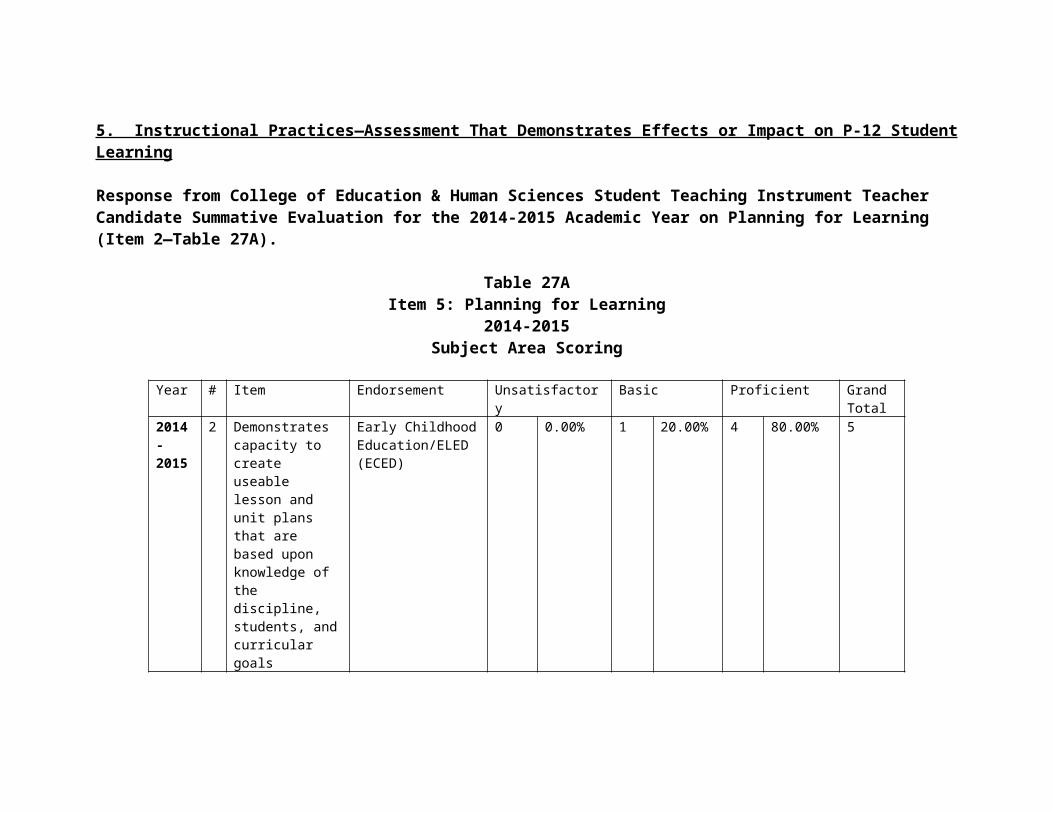
5. Instructional Practices—Assessment That Demonstrates Effects or Impact on P-12 Student Learning
Response from College of Education & Human Sciences Student Teaching Instrument Teacher Candidate Summative Evaluation for the 2014-2015 Academic Year on Planning for Learning (Item 2—Table 27A).
Table 27AItem 5: Planning for Learning
2014-2015Subject Area Scoring
Year # Item Endorsement Unsatisfactory Basic Proficient Grand Total
2014- 2015
2 Demonstrates capacity to create useable lesson and unit plans that are based upon knowledge of the discipline, students, and curricular goals
Early Childhood Education/ELED (ECED)
0 0.00% 1 20.00% 4 80.00% 5
ELED 0 0.00% 3 3.06% 95 96.94% 98
Special Education, K-6/ ELED, K-6 (SPM7)
1 2.56% 5 12.82% 33 84.62% 39

Response From College of Education & Human Sciences Student Teaching Instrument Teacher Candidate Summative Evaluation on Planning for Learning for 2015-2016 Academic Year on Planning for Learning (Item 4—Table 27B). LIVETEXT version.
Table 27B Item 4: Planning for Learning
2015-2016Subject Area Scoring
Year # Item Endorsement Unacceptable Emergent Sufficient Advanced Grand Total
2015- 2016
4 Planning for learning:Creates usable lessons and unit plans based on knowledge of the discipline, students, and curricular goals
Elementary Ed 0 0.00% 1 1.00% 33 33.00% 66 66.00% 100
Elementary Ed & Early Childhood Ed
0 0.00% 0 0.00% 1 12.50% 7 87.50% 8
Elementary & Special Education
0 0.00% 0 0.00% 12 23.53% 39 76.47% 51
Response From College of Education & Human Sciences Student Teaching Instrument Teacher Candidate Summative Evaluation for the 2014-2015 Academic Year on Instructional Enactment (Item 3—Table 28A).

Table 28AItem 3: Instructional Enactment
2014-2015Subject Area Scoring
Year # Item Endorsement Unsatisfactory Basic Proficient Grand Total
2014- 2015
3 Demonstrates Capacity to implement, modify, and adapt plans that are responsive to students and curricular goals
Early Childhood Education/ELED (ECED)
0 0.00% 1 20.00% 4 80.00% 5
ELED 0 0.00% 5 5.10% 93 94.90% 98
Special Education, K-6/ ELED, K-6 (SPM7)
0 0.00% 4 10.26% 35 89.74% 39
Response From College of Education & Human Sciences Student Teaching Instrument Teacher Candidate Summative Evaluation on Planning for Learning for 2015-2016 Academic Year on Responsive Teaching (Item 5—Table 28B)—LIVETEXT version.

Table 28BItem 5: Responsive Teaching
2015-2016Subject Area Scoring
Year # Item Endorsement Unacceptable Emergent Sufficient Advanced Grand Total
2015- 2016
5 Responsive Teaching:
Skillfully implements lessons that are flexible and intentional to meet individual student needs
Elementary Ed 0 0.00% 1 1.00% 34 34.00% 65 65.00% 100
Elementary Ed & Early Childhood Ed
0 0.00% 0 0.00% 1 12.50% 7 87.50% 8
Elementary & Special Education
0 0.00% 1 1.96% 15 29.41% 35 68.63% 51
Response From College of Education & Human Sciences Student Teaching Instrument Teacher Candidate Summative Evaluation for the 2014-2015 Academic Year on Classroom Interaction with Students (Item 5—Table 29A).

Table 29AItem 5: Classroom Interaction With Students
2014-2015Subject Area Scoring
Year # Item Endorsement Unsatisfactory Basic Proficient Grand Total
2014- 2015
5 Demonstrate a capacity to interact with learners in supportive and constructive ways
Early Childhood Education/ELED (ECED)
0 0.00% 0 0.00% 5 100.00% 5
ELED 0 0.00% 2 2.04% 96 97.96% 98
Special Education, K-6/ ELED, K-6 (SPM7)
0 0.00% 0 0.00% 39 100.00% 39
Response From College of Education & Human Sciences Student Teaching Instrument Teacher Candidate Summative Evaluation on Planning for Learning for the 2015-2016 Academic Year on Relationships with Students (Item 7—Table 29B)—LIVETEXT version.

Table 29BItem 7: Relationships With Students
2015-2016Subject Area Scoring
Year # Item Endorsement Unacceptable Emergent Sufficient Advanced Grand Total
2015- 2016
7 Relationships with Students:Develops and Maintains rapport with individual and groups of students
Elementary Ed 0 0.00% 0 0.00% 20 20.00% 80 80.00% 100
Elementary Ed & Early Childhood Ed
0 0.00% 0 0.00% 0 0.00% 8 100.00% 8
Elementary & Special Education
0 0.00% 1 1.96% 3 5.88% 47 92.16% 51
Responses From First Year Administrator Survey on Assessment (Items 6.1 and 6.2)

Table 30Standard 6.1 and 6.2: Assessment
Indicator Endorsement Rare Occasional Frequent Consistent Grand Information Total6.1 The teacher understands multiple methods of assessment
2014-2015Elementary 0 0.00% 5 8.06% 26 41.94% 31 50.00% 622015-2016 Rare Occasional Frequent Consistent TotalEarly Childhood Education 1802, Elementary
0 0.00% 0 0.00% 0 0.00% 2 100.00% 2
Early Childhood Education 1830, Elementary
0 0.00% 0 0.00% 1 100.00% 0 0.00% 1
Elementary 1 2.33% 5 0.05% 20 46.51% 17 39.53% 43Special Education, Elementary
0 0.00% 1 0.00% 7 35.00% 12 60.00% 20
6.2 The teacher uses multiple methods of assessment to engage students in their own growth, to monitor student progress, and to guide the teacher candidate’s and student’s decision making.
2014-2015 Rare Occasional Frequent Consistent TotalElementary 0 0.00% 4 6.45% 27 43.55% 31 50.00% 62
2015-2016 Rare Occasional Frequent Consistent TotalEarly Childhood Education 1802, Elementary
0 0.00% 0 0.00% 1 50.00% 1 50.00% 2
Early Childhood Education 1830, Elementary
0 0.00% 0 0.00% 1 100.00% 0 0.00% 1
Elementary 1 2.33% 7 0.05% 22 51.16% 13 30.23% 43Special Education, Elementary
0 0.00% 1 0.00% 7 35.00% 12 60.00% 20

Responses From First Year Candidate Survey: Items Related to Assessment: Create Effective Assessments to Measure Learning (Item 10).
Table 31Standard 10: Creates Effective Assessments to Measure Learning
Year # Item Endorsement Strongly Disagree
Disagree Neither Agree nor Disagree
Agree Strongly Agree
Grand Total
2014 - 2015
10 I create effective assessments to measure learning.
ELED
1
2.94%
1
2.94%
3
8.82%
23
67.65%
6
17.65%
34
Special Education K-6 & ELED K-6 (SPED7) 0
0.00%
2
20.00%
0
0.00%
5
50.00%
3
30.00%
10
2015-2016
10 I create effective assessments to measure learning
ELED 0 0.00% 2 6.25% 4 12.50% 20 62.50% 6 18.75% 32
ELED/SEC 0 0.00% 0 0.00% 0 0.00% 1 100.00%
0 0.00% 1
SPM7 0 0.00% 0 0.00% 0 0.00% 3 60.00% 2 40.00% 5

Narrative:The data reveal a consistent pattern of strong elementary education performance with respect to instructional practices. The only instance of unsatisfactory practices among our teacher candidates was a single student in 2014-2015, standard 10. Evaluations and administrator surveys indicate that 80% or more meet or exceed all standards within this focal point.
6. Professional Responsibility
Response From College of Education & Human Sciences Student Teaching Instrument Teacher Candidate Summative Evaluation for the 2014-2015 Academic Year on Collaborative Relationships (Item 12—Table 32A).
Table 32A

Item 12: Collaborative Relationships and Professional Conduct2014-2015
Subject Area Scoring
Year # Item Endorsement Unsatisfactory Basic Proficient Grand Total
2014- 2015
12 Collaborative Relations and Professional Conduct. Demonstrates a capacity to work with other practitioners to improve teaching for the benefit of students’ learning.
Early Childhood Education/ELED (ECED)
0 0.00% 0 0.00% 5 100.00% 5
ELED 0 0.00% 6 6.12% 92 93.88% 98
Special Education, K-6/ ELED, K-6 (SPM7)
0 0.00% 3 7.69% 36 92.31% 39
Response From College of Education & Human Sciences Student Teaching Instrument Teacher Candidate Summative Evaluation on Planning for Learning for 2015-2016 Academic Year on Collaborative Relations and Professional Conduct (Item 13’Table 32B). LIVETEXT version.

Table 32BItem 13: Collaborative Relations and Professional Conduct
2015-2016Subject Area Scoring
Year # Item Endorsement Unacceptable Emergent Sufficient Advanced Grand Total
2015- 2016
13 Collaborative Relations and Professional Conduct:Uses effective communication and consultation techniques with other professionals and families for the benefit of student learning
Elementary Ed 0 0.00% 0 0.00% 41 41.00% 59 59.00% 100
Elementary Ed & Early Childhood Ed
0 0.00% 0 0.00% 2 25.00% 6 75.00% 8
Elementary & Special Education
0 0.00% 1 1.96% 12 23.53% 38 74.51% 51
Response From College of Education & Human Sciences Student Teaching Instrument Teacher Candidate Summative Evaluation Relationships for the 2014-2015 Academic Year on Reflection and Professional Growth (Item 14—Table 33A).
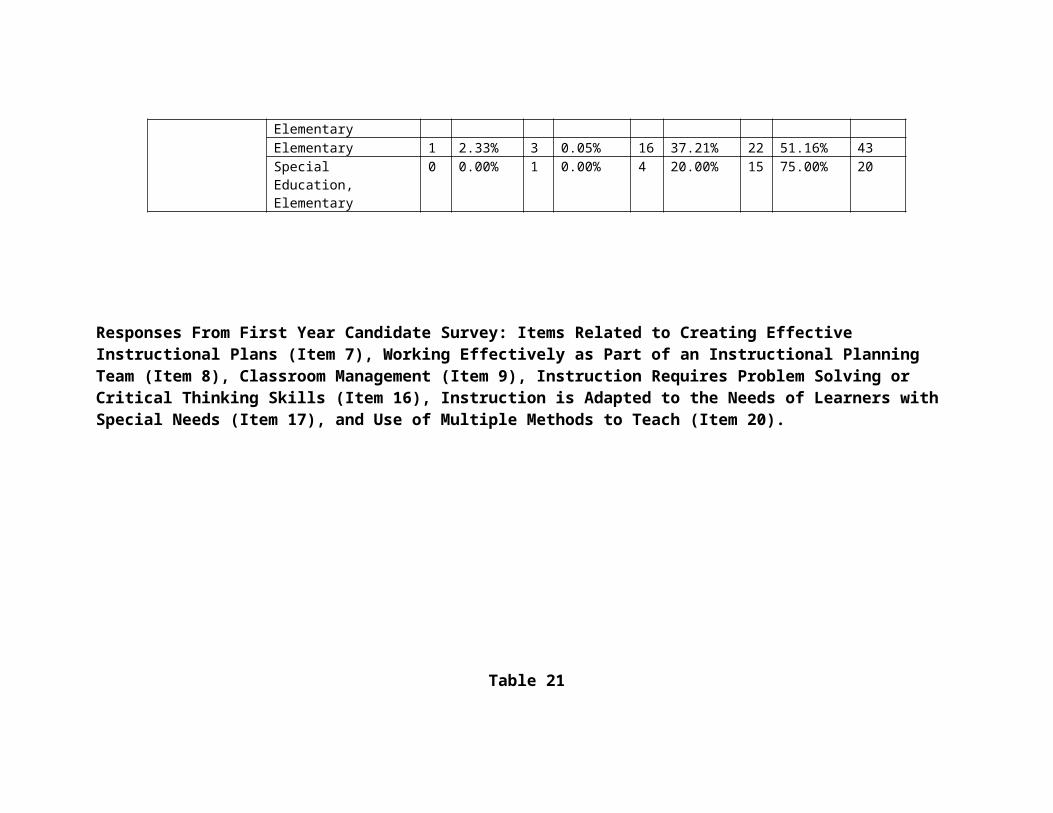
Table 33AItem 14: Reflection and Professional Growth
2014-2015Subject Area Scoring
Year # Item Endorsement Unsatisfactory Basic Proficient Grand Total
2014- 2015
14 Reflection and Professional Growth. Demonstrates capacity to continually evaluate how choices and actions affect students and others in the learning community and actively seeks opportunities to grow professionally.
Early Childhood Education/ELED (ECED)
0 0.00% 0 0.00% 5 100.00% 5
ELED 0 0.00% 7 7.14% 91 92.86% 98

Special Education, K-6/ ELED, K-6 (SPM7)
0 0.00% 1 2.56% 38 97.44% 39
Response From College of Education & Human Sciences Student Teaching Instrument Teacher Candidate Summative Evaluation for the 2015-2016 Academic Year—Reflective Practices and Professional Growth (Item 14—Table 33B)—LIVETEXT version.
Table 33B

Year # Item Endorsement Unacceptable
Emergent Sufficient Advanced Grand Total
2015- 2016
14
Reflective Practices and Professional Growth:Continually evaluates how choices and actions affects students and others in the learning community, makes necessary adjustments and actively seeks opportunities to grow professionally
Elementary Ed 0 0.00% 1 1.00% 38
38.00% 61 61.00% 100
Elementary Ed & Early Childhood Ed
0 0.00% 0 0.00% 2 25.00% 6 75.00% 8
Elementary & Special Education
1 1.96% 0 0.00% 12
23.53% 38 74.51% 51
Item 14: Reflective Practices and Professional Growth2015-2016
Subject Area Scoring
Responses From First Year Administrator Survey: Items Related to Professional Learning and Ethical Practice (Standards 9.1, 9.2, 9.3, and 9.4) and Leadership and Collaboration (Standards 10.1 and 10.2)
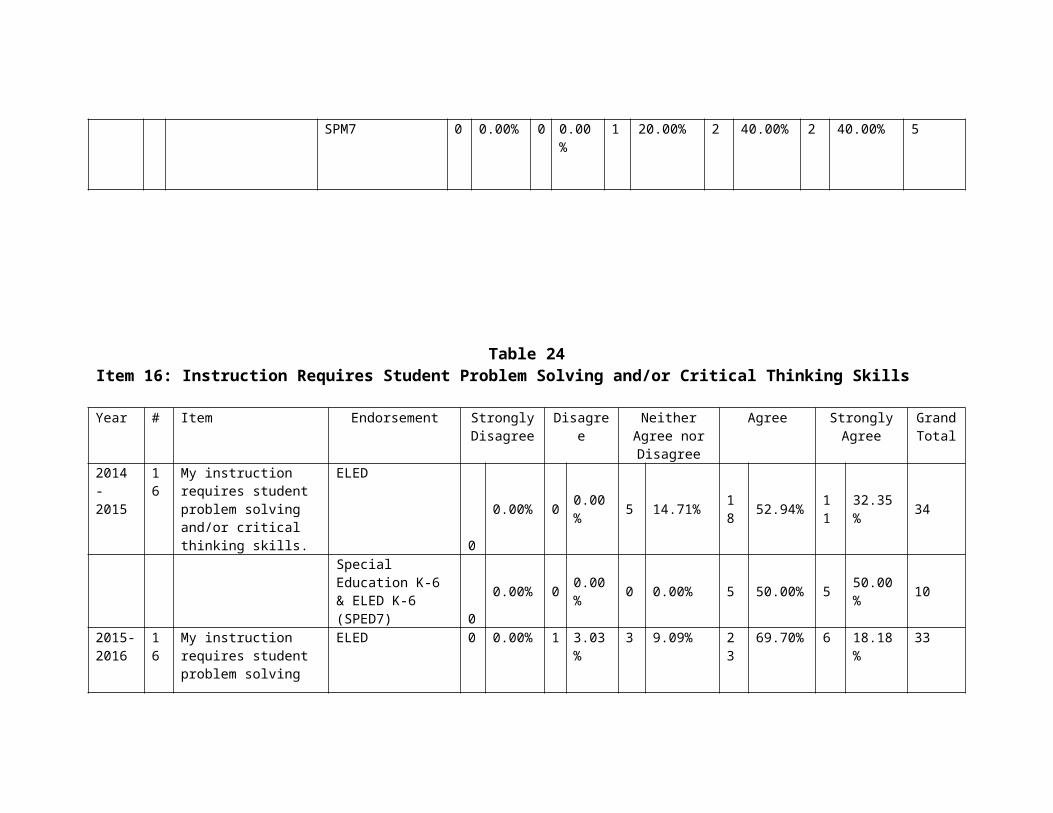
Table 34Standards 9.1, 9.2, 9.3, and 9.4: Professional Learning and Ethical Practice
Indicator Endorsement Rare Occasional Frequent Consistent Grand Information Total9.1 The teacher engages in ongoing professional learning.
2014-2015Elementary 0 0.00% 9 14.52% 12 19.35% 41 66.13% 622015-2016 Rare Occasional Frequent Consistent TotalEarly Childhood Education 1802, Elementary
0 0.00% 0 0.00% 0 0.00% 2 100.00% 2
Early Childhood Education 1830, Elementary
0 0.00% 0 0.00% 0 0.00% 1 100.00% 1
Elementary 1 2.33% 3 0.05% 11 25.58% 28 65.12% 43
Special Education, Elementary
0 0.00% 1 0.00% 3 15.00% 16 80.00% 20
9.2 The teacher models ethical professional practice.
2014-2015 Rare Occasional Frequent Consistent TotalElementary 0 0.00% 4 6.45% 10 16.13% 48 77.42% 62
2015-2016 Rare Occasional Frequent Consistent TotalEarly Childhood Education 1802, Elementary
0 0.00% 0 0.00% 0 0.00% 2 100.00% 2
Early Childhood Education 1830, Elementary
0 0.00% 0 0.00% 0 0.00% 1 100.00% 1
Elementary 1 2.33% 0 0.05% 11 25.58% 31 72.09% 43Special Education, Elementary
0 0.00% 0 0.00% 3 15.00% 17 85.00% 20
9.3 The teacher uses evidence to
2014-2015 Rare Occasional Frequent Consistent TotalElementary 1 1.61% 0 0.00% 28 45.16% 33 53.23% 62

continually evaluate his/her practice, particularly the effects of his/her choices and actions on others (students, families, other professionals, and the community), and adapts practice to meet the needs of each student.
2015-2016 Rare Occasional Frequent Consistent TotalEarly Childhood Education 1802, Elementary
0 0.00% 0 0.00% 1 50.00% 1 50.00% 2
Early Childhood Education 1830, Elementary
0 0.00% 0 0.00% 0 0.00% 1 100.00% 1
Elementary 1 2.33% 2 0.05% 17 39.53% 23 53.49% 43Special Education, Elementary
0 0.00% 0 0.00% 5 25.00% 14 70.00% 20
9.4 The teacher models professional dispositions for teaching.
2014-2015 Rare Occasional Frequent Consistent TotalElementary 1 1.61% 2 3.23% 15 24.19% 44 70.97% 622015-2016 Rare Occasional Frequent Consistent TotalEarly Childhood Education 1802, Elementary
0 0.00% 0 0.00% 0 0.00% 2 100.00% 2
Early Childhood Education 1830, Elementary
0 0.00% 0 0.00% 0 0.00% 1 100.00% 1
Elementary 1 2.33% 2 0.05% 15 34.88% 25 58.14% 43Special Education, Elementary
0 0.00% 0 0.00% 5 25.00% 15 75.00% 20

Table 35Standards 10.1 and 10.2: Leadership and Collaboration
Indicator Endorsement Rare Occasional Frequent Consistent Grand Information Total
10.1 The teacher seeks opportunities to take responsibility for student learning
Elementary 0 0.00% 5 8.06% 19 30.65% 38 61.29% 622015-2016 Rare Occasional Frequent Consistent TotalEarly Childhood Education 1802, Elementary
0 0.00% 0 0.00% 1 50.00% 1 50.00% 2
Early Childhood Education 1830, Elementary
0 0.00% 0 0.00% 0 0.00% 1 100.00% 1
Elementary 1 2.33% 5 0.05% 13 30.23% 24 55.81% 43Special Education, Elementary
0 0.00% 1 0.00% 4 20.00% 15 75.00% 20
10.2 The teacher seeks opportunities, including appropriate technology, to collaborate with students, families, colleagues, and other school professionals, and community members to ensure student growth
2014-2015 Rare Occasional Frequent Consistent TotalElementary 0 0.00% 3 4.84% 25 40.32% 33 53.23% 62
2015-2016 Rare Occasional Frequent Consistent TotalEarly Childhood Education 1802, Elementary
0 0.00% 0 0.00% 1 50.00% 1 50.00% 2
Early Childhood Education 1830, Elementary
0 0.00% 0 0.00% 0 0.00% 1 100.00% 1
Elementary 1 2.33% 5 0.05% 14 32.56% 23 53.49% 43Special Education, Elementary
0 0.00% 2 0.00% 2 10.00% 16 80.00% 20

Responses From First Year Candidate Survey: Items Related to Professional Responsibility: Works Effectively With Parents (Item 12) and Takes Advantage of Opportunities to Grow Professionally (Item 15).
Table 36Item 12: Works Effectively with Parents
Year # Item Endorsement Strongly Disagree
Disagree Neither Agree nor Disagree
Agree Strongly Agree
Grand Total
2014 - 2015
12 I work effectively with parents
ELED
0
0.00%
0
0.00%
2
5.88%
16
47.06%
16
47.06%
34
Special Education K-6 & ELED K-6 (SPED7)
0
0.00%
0
0.00%
0
0.00%
4
40.00%
6
60.00%
10
2015-2016
12 I work effectively with parents
ELED 0 0.00% 2 6.06% 3 9.09% 20 60.61% 8 24.24% 33
ELED/SEC 0 0.00% 0 0.00% 0 0.00% 1 100.00%
0 0.00% 1
SPM7 0 0.00% 0 0.00% 0 0.00% 3 60.00% 2 40.00% 5
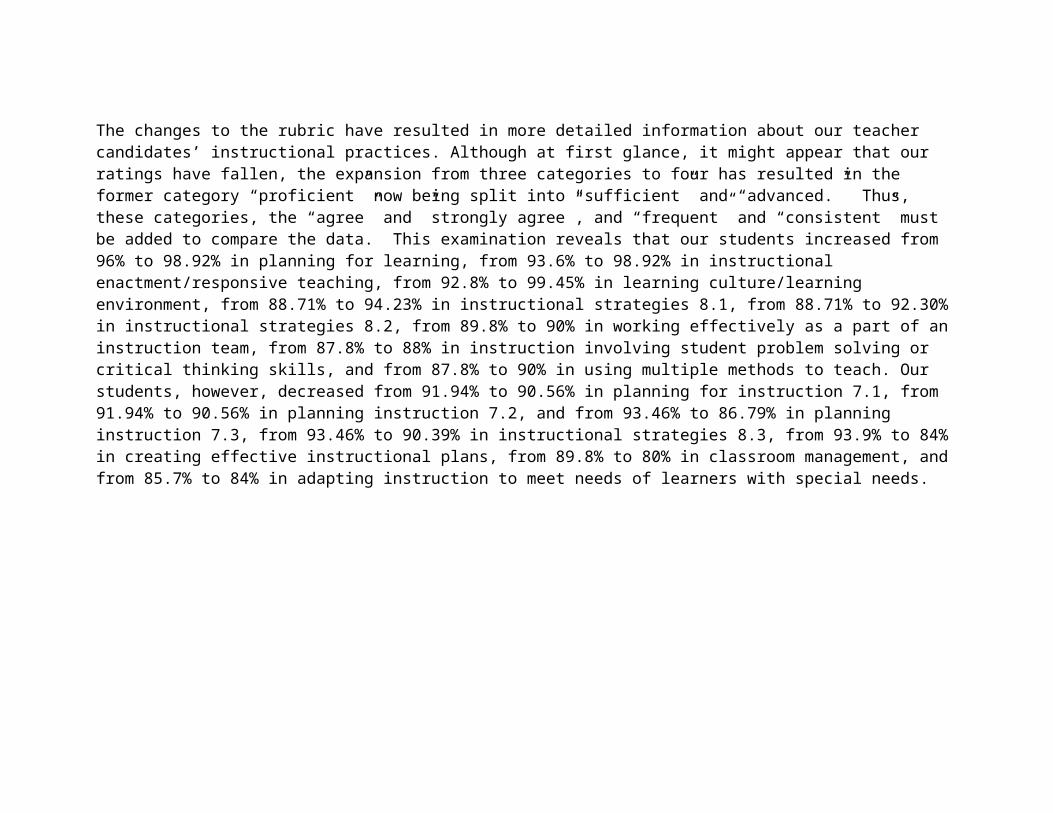
Table 37Item 15: Takes Advantage of Opportunities to Grow Professionally
Year # Item Endorsement Strongly Disagree
Disagree Neither Agree nor Disagree
Agree Strongly Agree
Grand Total
2014 - 2015
15
I take advantage of opportunities to grow professionally.
ELED
0 0.00% 0 0.00%
2
5.88%
14
41.18%
18
52.94%
34
Special Education K-6 & ELED K-6 (SPED7)
0 0.00% 0 0.00%
1
10.00%
4
40.00%
5
50.00%
10
2015-2016
15
I take advantage of opportunities to grow professionally
ELED 0 0.00% 1 3.03% 1 3.03% 22 66.67% 9 27.27% 33
ELED/SEC 0 0.00% 0 0.00% 0 0.00% 1 100.00%
0 0.00% 1
SPM7 0 0.00% 0 0.00% 0 0.00% 4 80.00% 1 20.00% 5
Narrative:The above tables demonstrate strong, consistent, positive performance in professional responsibility. Our teacher candidates have increased from 2014-2015 in most areas within professional development, from 93.6% to 99.46% in collaborative relationships and professional conduct, from 92.8% to 98.92% in reflective practices and professional growth, from 85.48% to 90.56% in professional learning and ethical practice 9.1, from 93.55% to 98.12% in professional learning and ethical practice 9.2. Small drops were observed in a few areas, from 97.39% to 92.45% in professional learning and ethical practice 9.3, from 95.16% to 94.79% in professional learning and ethical practice 9.4, from 91.94 to 86.8 in leadership and collaboration 10.1, from 95.08% to 86.80% in leadership and collaboration 10.2, and from 95.9% to 84% in working effectively with parents. No growth was observed in taking advantage of opportunities to grow professionally; however, the rate of 96% is high and positive.
7. Overall Proficiency
Response to Administrative Survey: Items on Impact of Student Learning and Development (Standard 11.1)

Table 38 Standard 11.1: Impact of Student Learning and Development
Indicator Endorsement Rare Occasional Frequent Consistent Grand Information Total11.1 The teacher positively impacts the learning and development for all students
2014-2015Elementary 0 0.00% 2 3.23% 18 29.03% 42 67.74% 62
2015-2016 Rare Occasional Frequent Consistent TotalEarly Childhood Education 1802, Elementary
0 0.00% 0 0.00% 0 0.00% 2 100.00% 2
Early Childhood Education 1830, Elementary
0 0.00% 0 0.00% 0 0.00% 1 100.00% 1
Elementary 1 2.33% 4 0.05% 15 34.88% 23 53.49% 43Special Education, Elementary
0 0.00% 0 0.00% 2 10.00% 18 90.00% 20
Responses From First Year Candidate Survey: Items Related to Overall Proficiency: I Am an Excellent Teacher (Item 23).
Table 39

Item 23: I Am an Excellent Teacher
Year # Item Endorsement Strongly Disagree
Disagree Neither Agree nor Disagree
Agree Strongly Agree
Grand Total
2014 - 2015
23 I am an excellent teacher.
ELED
1
2.94%
1
2.94%
7
20.59%
20
58.82%
5
14.71%
34
Special Education K-6 & ELED K-6 (SPED7)
0
0.00%
1
10.00%
2
20.00%
5
50.00%
2
20.00%
10
2015-2016
23 I am an excellent teacher
ELED 0 0.00% 3 9.09% 5 15.15% 20 60.61% 5 15.15% 33
ELED/SEC 0 0.00% 0 0.00% 0 0.00% 1 100.00%
0 0.00% 1
SPM7 0 0.00% 0 0.00% 2 40.00% 1 20.00% 2 40.00% 5
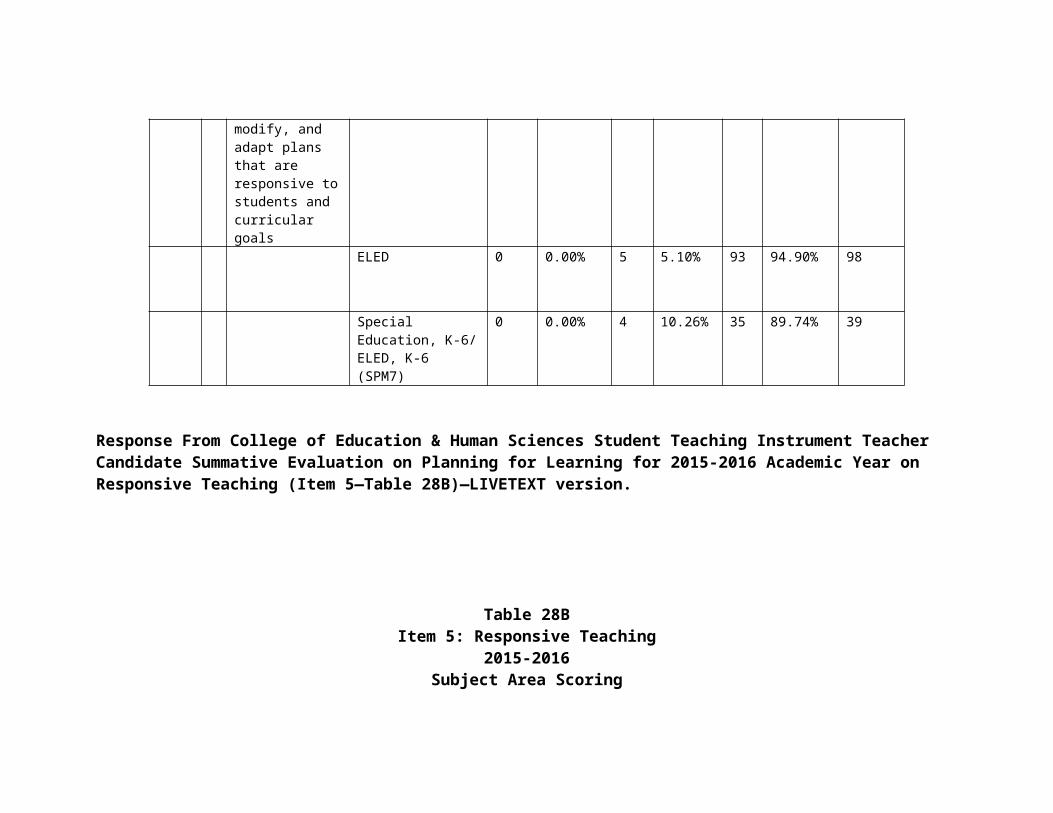
Narrative:From 2014-2015 to 2015-2016 on the item “I am an excellent teacher,” our students increased their agreement with the prompt from 58.9% in 2014-2015 to 60.6% in 2015-2016 (and from 14.7% strongly agree in 2014/2015 to 15.2% in 2015/2016). This indicates majority agreement with the statement, “I am an excellent teacher.” There is general consistency (a bit of a drop in 2015-2016) on the administrator survey of our teachers with 90 to 95% of administrators indicating that our first year teachers “positively impact the learning and development for all students” either frequently or consistently. The data come from both administrators and first year teachers themselves. There is general agreement between administrators and first year teachers on the items assessing their positive impact on students. The items are not identical between the surveys. We find the item, “I am an excellent teacher” to be overly vague and open to multiple interpretations. The lack of coherence between the items makes it difficult to interpret the data.
SECTION 3: USE OF RELATED DATA AND INFORMATION FOR CONTINUOUS PROGRAM IMPROVEMENT OF ENDORSEMENT PROGRAM — Artifact 3
Content Knowledge summaryThe content knowledge of elementary teachers is paramount. Elementary teachers are those who set students on their learning trajectories in all core academic areas. As a result, Elementary teachers have to master multiple subjects, not just theoretically sound but also in developmentally appropriate ways. This mix is not easily achieved and the Elementary Education faculty pays constant attention to the growth in content area relevant knowledge by partnering with other departments and aligning coursework and experiences.
One such emphasis is the use of enhancement courses, one in each of the four core areas. Enhancement courses are carefully selected to foster further development of content relevant knowledge as the pedagogical knowledge is developing. Some great examples can be seen in Literacy and language enhancements that include courses on Writing Communities and Writing Development in the English Department.
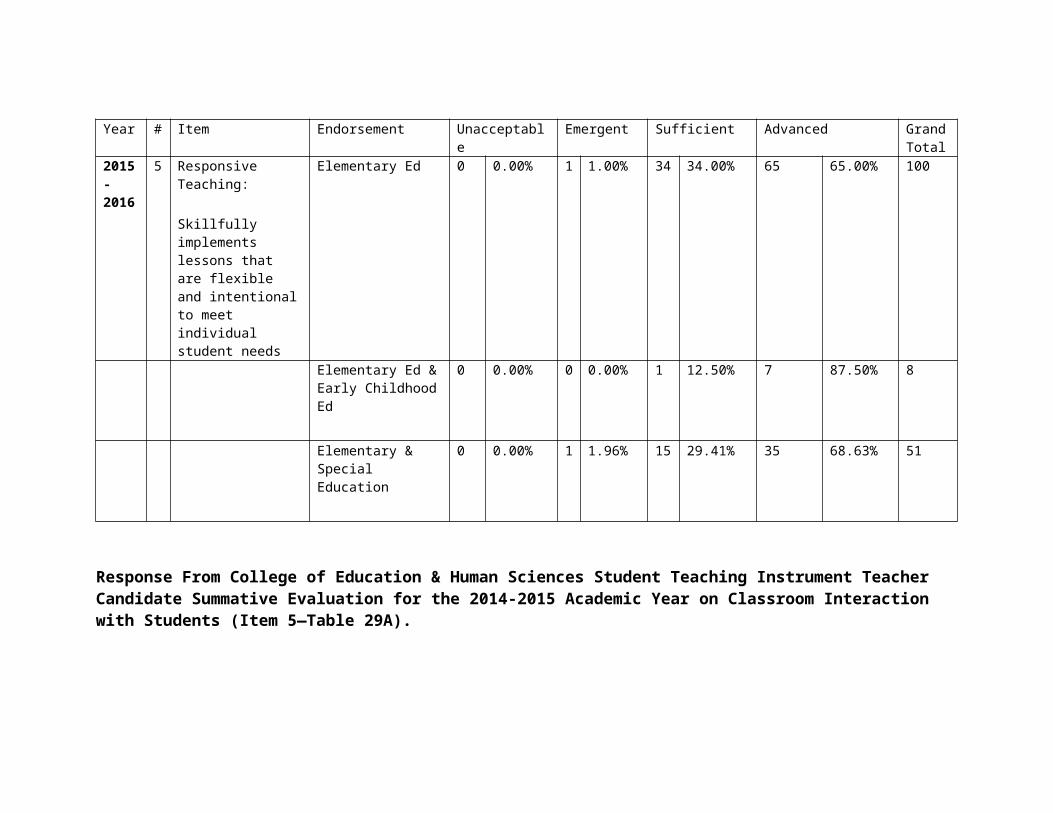
The evidence presented in this section shows that Elementary Education graduates have excellent content knowledge. The evidence is that this knowledge is built throughout the program as is evident in GPA and student teaching reviews as well as after teachers are placed in their respective schools. Teachers who are confident in their content knowledge will be better teachers. What is reassuring is that administrators who work directly with them actually have even more confidence in the first year teachers than the teachers themselves have in their own content knowledge.
The Praxis II pass rates are a strong outcome indicator because the Praxis II measures direct subject matter knowledge as it applies to teaching in the elementary grades.
Pedagogical Knowledge Summary:Pedagogical knowledge in the elementary grades is very tightly linked to content knowledge. This link is the rationale behind the program’s effort noted in a previous section to align the two sets of skills so they support each other. The departure point for the program, however, is the consideration of the whole child. That is, all teacher knowledge, be it about content or pedagogy, must start with considering the child first. Understanding the child entails academic, social, biological, and social aspects that must be taken into account as our students and graduates plan and execute instruction. This approach is embedded into all pre-professional and professional courses. This notion of embedding key concepts in all pedagogy-oriented classrooms is part of our vision of integrated studies in elementary education.
All indicators presented here show that elementary education students show strong pedagogical knowledge that is visible to others (supervisors and administrators). Although we see the results as very strong, we are continuously working to improve our students’ skills in ways that will be described in the final section of this folio.
Skills SummaryThe data presented in the above tables shows that Elementary Program graduates are adept at designing learning environments and using multiple methods to deliver meaningful content. The skills associated with the design of instruction are a part of every step in the program. At the risk of being redundant we point out that they are based on the assessment of the Whole Child (i.e., planning and carrying out instruction is carefully linked to multi-faceted assessment procedures).An example of such embedded practice can be seen in the Literacy block. During this time students are in practicum classes while participating in an integrated Reading and Language Arts methods block. They are required to observe and reflect on the whole classroom including student motivation, backgrounds, social interactions (see example directions in

the appendix). Later in the semester they are asked to focus on an individual student for a case study assessing multiple literacy needs and suggesting possible approaches for future instructional plans. Even in the summative assessments of the class the Yearlong Plan and the Final exam assessment has a central place.Finally we note that the development of technology skills is an area where our students are performing below our expectations. We will address this issue and our response to this challenge in the final section of this folio.
Dispositions SummaryTeachers College has emphasized in the past the concept of the Scholar Practitioner—an educator who is always reflective, actively seeking to improve her practice. As Teachers College merged to create the College of Education and Human Sciences a new emphasis was added—an emphasis on families and communities placing educational practice within a more general context. Both emphases show strong outcomes in Elementary Students both before and after graduation from the program.
The program achieves these results through a conscious design of coursework and practicum experiences. In course work the emphasis is on social development (e.g., in EDPS 250: Fundamentals of Child Development) and the role of communities (e.g., CEHS 200). Recognizing the crucial role of family and community, we have also added a course focusing on the role of family. Starting in 2009 all students in the Elementary program participate in CYAF 380 (Working with Families in Communities and Schools). Students are purposefully placed during the Math block (the first methods block in the program) in schools that serve underprivileged students. This placement is intended to make sure students experience communities that are often (but not always) very different from the ones in which they grew up. Students are encouraged to participate in parent teacher conferences and other activities that connect school and community during practicum and student teaching experiences.
Reflective practice is developed in the program to become second nature to our students. As part of the selective admissions process students are asked to reflect on their path into the ElEd program using an original metaphor. This sets the stage for a strong reflective component throughout the program. In each professional methods class and each practicum experience students are asked to reflect on their own work and find ways to improve it. This growth in personal reflection is most evident in student exit portfolios as students look back at the work they have done as emerging professionals.
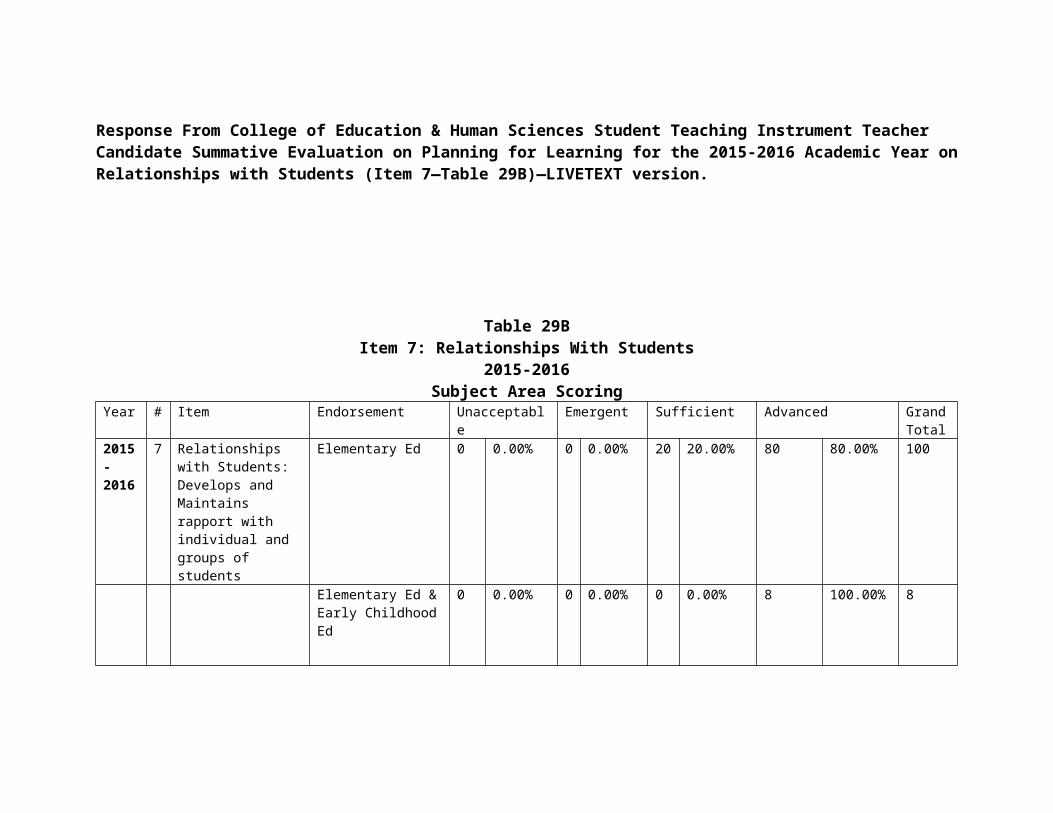
We believe that individual reflection is only a part of successful professional life. The complimentary disposition is the ability to successfully work in teams. Here too the concept is reinforced through the program. For example, students are placed in tandem in their practicum settings forcing them to negotiate their instruction both with their classroom teachers and their practicum partners. In and out of class assignments are often done in teams or with peer feedback—encouraging reflection with professional colleagues and not just instructors.
Finally, as part of program development we have redesigned the seminar that accompanies student teaching. The new focus of the seminar (TEAC 403A) is on building professional communities. The students are asked to participate in professional learning communities online as well as in professional development days built as professional conferences in which students choose the strand of talks and discussion best suited to their needs.
P-12 Learning Summary:We believe that the continuum of P-12 learning and development is embedded first and foremost in assessment practices. An understanding of where the child is from multiple perspectives helps the teacher decide how best to conduct her part of scaffolding further growth.Assessment is integrated into the very fabric of the Elementary Education program. Students assess their own learning through reflection, portfolios.
Section 4: Program ImprovementAs a result of our own assessment data and the APR visit in 2007 the Elementary Education program redesigned the program to capitalize on our strength and create a unique identity and sense of purpose in our students.This Program Improvement plan is a summary of 2 years of deliberations and planning. In each segment of the plan, we highlight goals, actions, and curricular changes. The goal is to shape program development for the following years based on a few principles:
An Integrated program in Elementary Education that focuses on the Whole Child and capitalizes on the unique position of the College of Education and Human Sciences as a multidisciplinary hub of research and knowledge about Schools, Children, Families, and Communities.
The department’s conceptual map. Ten principles that guide our department’s work (see appendix). An integration of faculty research into the program. Attention to program assessment (the instrument shown above) and evaluation (outside visits and accreditation).

Integrative Studies in Elementary Education include two main concepts: My Classroom Space and the ISEE seminar: Tying the program together are two intertwined elements, an online classroom space and the professional seminar (newly designed TEAC 403a). The two features are meant to create the “glue” that helps tie the discrete experiences in the program in cohesive and reflective ways. It extends students’ thinking and development as teachers and makes the developmental process more transparent to the student themselves, to faculty, evaluators, and visitors. The online classroom space will start in the pre-professional stage with TEAC 259, whereas the professional seminar will be integrated into the student teaching experience.
The adjustments in technology are also a response to the lower scores about technology use of graduates. Moving the basic technology course TEAC 259 to the pre-professional phase, and a renewed emphasis on the use of developmentally appropriate use of technology in methods courses and professional development will create a better foundation for teacher instruction and use of new media skills.
My Classroom Space—The space will be similar to social networking sites (e.g., Facebook, LinkedIn, & Ning) but with a professional emphasis. In this site students will represent their work in ways that force them to summarize and articulate their vision for teaching and include different media (e.g., video, podcasts, pictures, text). The site will include a blog for reflection and avenues for different faculty to visit and provide feedback as the website evolves. Students will continue to have access to My Classroom Space after they leave the program as a way to assist in induction and connect them to UNL. The site enables peer feedback. This component can be extremely useful to both new students entering the program and current students. Students more advanced in the program will provide feedback for newer students as well as clarify their own thinking as they work in the Professional Development Strand. Initial contact with the ALTC has brought about a lot of interest. For example, the site has the potential to be used as an exit portfolio.
ISEE Professional Development Strand—A series of three professional development meetings in the final semester that all Elementary Education students take during the student teaching. This additional course becomes a capstone course for both the Elementary Education program and the undergraduate experience as a whole. During the strand, students will be guided by a team of two faculties and a graduate student (El Ed., foundations, and a graduate student). These teams will lead the seminar of about 20 students. Because the students will be at a mix of stages in the program, peer interaction will occur cross cohorts and increase the ways students can learn from each other. The team has multiple members to allow multiple viewpoints and continuity. The strand can combine a limited number of face-to-face meetings with synchronous (e.g., Breeze and phone) and asynchronous electronic meetings (e.g., discussion board), using at least in

part the “My Classroom Space.” This is an effort to create a community of professionals and an experience that would help create the integrated vision.
Integrating methods for teaching English Learners for all future teachers.In response to demographic change in the state and the nation, the Elementary Education program will increase the emphasis on English learners. The program now includes a two-credit introduction to language development and key instructional approaches with English learners. The integration of methods for English learners has three components: A two-credit course on second language development and key instructional approaches with English learners. This
course will be part of the first professional semester, known as the math block. Professional Development for all methods instructors. All methods instructors will participate in a professional
development opportunity focused on language acquisition and ELL integration in the general classroom. The PD will be repeated on a cycle—probably once every 3 years.
Embedded Instruction—All methods faculty will integrate an emphasis on ELLs in their methods classes. ELL faculty will be present in one class meeting in Reading/LA methods classes. Specific evaluated products including attention to ELL students will emerge in Social Studies and Science methods, as those are the areas in which ELL students need the most support.
A Focus on Families and CommunitiesIn response to the mission of the College of Education and Human Sciences to enhance the lives of individuals, families, schools, and communities, and to strengthen the relationships among them, the Elementary Education Program is adding an emphasis on a deeper understanding of communities. In many ways the approach here is similar to that of the ELL emphasis, namely, specialized courses, embedding into instruction and assignments in methods classes, and finally professional development for faculty.This theme is not new. In CEHS 200 (the college signature course) and TEAC 330 (Multicultural education), there is extensive discussion of communities and families. In addition, practicum experiences and methods classes integrated family and community oriented practices.As part of program development the Elementary Education program is adding CYAF 380–Working with Families in Communities and Schools, as a class that will help future teachers better understand the obstacles families face and learn about ways in which they can respond to those needs.
Increasing Content Knowledge in Elementary Teachers

Program assessments show a favorable picture as concerns content knowledge. As part of the pursuit of excellence the Elementary Education faculty is constantly striving to make sure that teacher content knowledge is enhanced using the best resources UNL as a comprehensive university has to offer. A new set of courses was approved for the 2009-2010 bulletin (see appendix). The emphasis in these courses is on the relevancy of content for elementary teachers: For example students have a series of writing-related courses in the English department, which is known nationally for its focus on writing research and development in K12 classrooms.
Reading Center Experience for All. The UNL Institute of Reading is a regional initiative in response to the mission of UNL and the College of Education and Human Sciences, in particular. The Institute will provide the tools and guidance leading to the achievement of critical literacy in the local community, the Great Plains Region, and the nation at-large. To achieve critical literacy throughout Nebraska and the U.S., we will use an inclusive model that encompasses pre-service and in-service teachers, school-age students, and families. The Institute is a dedicated center that combines teaching, research, service, and outreach.
In recognizing the central place literacy has in Elementary school curriculum every pre-service and in-service teacher at UNL in the Elementary Education Programs will participate in academic and clinical experiences at the UNL Reading Center. The newly created center will serve as a hub for research in Literacy Instruction and Teacher Development. Until now Reading Center experiences were a mandatory part of Special Education and Inclusive education programs, but served only as an enhancement course for Elementary Education majors. From 2009-2010 the Reading Center experience will become part of the Elementary Education Program.
In the center, students participate in a class focused on teaching struggling readers and writers, with closely supervised tutoring sessions and immediate feedback by faculty supervisors.