astaldi società per azioni società per azioni astaldi società per azioni registered offices: via...
TRANSCRIPT

ASTALDI Società per Azioni
ASTALDI Società per Azioni
Registered offices: Via Giulio Vincenzo Bona 65, Rome
Share capital 113,043,750,000 Lire fully paid-up
Rome Company Register 00398970582 (Tax Number)
(previously registered 847/50 at the Court of Rome)
R.E.A. (Economic and Administrative Index) n°. 152353
VAT number 00880281001
________________
Attachment “B”
Consolidated financial statements at 31 December 2000
2000 1999
BALANCE SHEET
ASSETS
A) Subscribed capital unpaid - - - - - -
B) Fixed assets:
I - Intangible fixed assets :
1) Formation and start-up 5,583,014,132 63,752,200
3) Patents and rights to use patents of others 2,434,060,504 2,056,279,867
4) Concessions, licenses, trademarks and similar rights 827 843
5) Goodwill 420,621,787 3,039,141,152
7) Other :
a) Construction site installation costs 17,624,074,600 18,700,451,161
b) Cost of preparing tenders 2,108,411,407 2,601,835,624
1
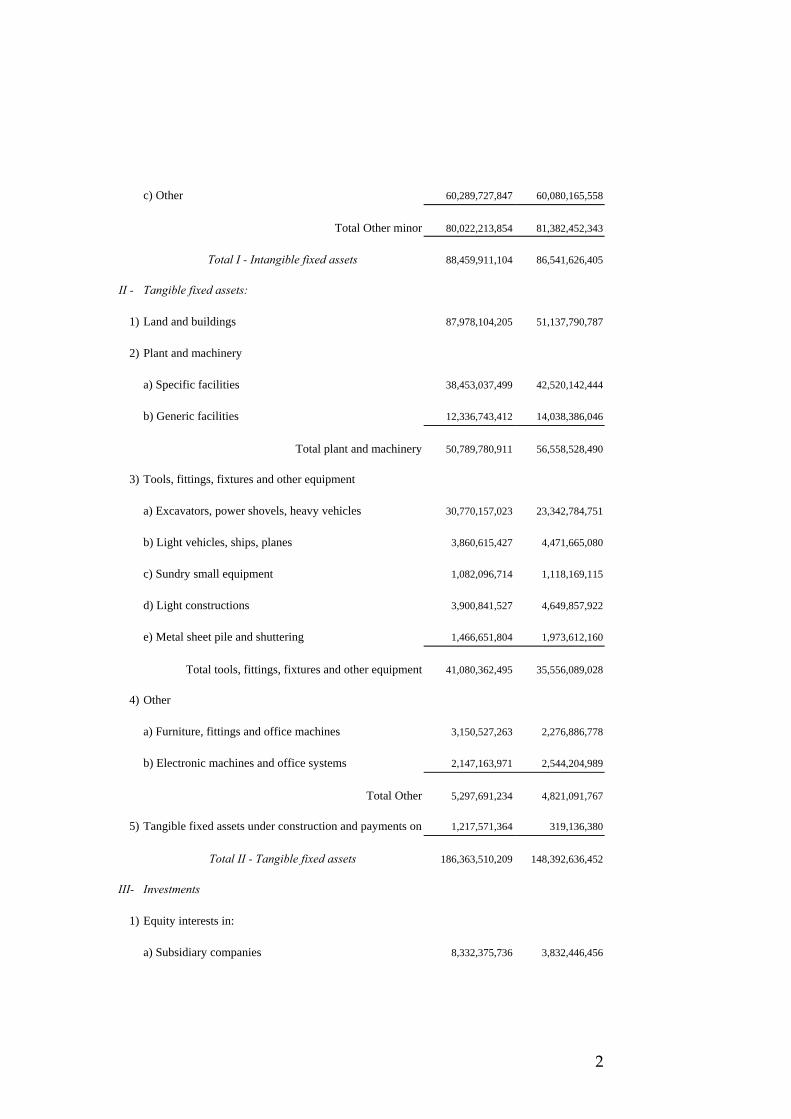
c) Other 60,289,727,847 60,080,165,558
Total Other minor 80,022,213,854 81,382,452,343
Total I - Intangible fixed assets 88,459,911,104 86,541,626,405
II - Tangible fixed assets:
1) Land and buildings 87,978,104,205 51,137,790,787
2) Plant and machinery
a) Specific facilities 38,453,037,499 42,520,142,444
b) Generic facilities 12,336,743,412 14,038,386,046
Total plant and machinery 50,789,780,911 56,558,528,490
3) Tools, fittings, fixtures and other equipment
a) Excavators, power shovels, heavy vehicles 30,770,157,023 23,342,784,751
b) Light vehicles, ships, planes 3,860,615,427 4,471,665,080
c) Sundry small equipment 1,082,096,714 1,118,169,115
d) Light constructions 3,900,841,527 4,649,857,922
e) Metal sheet pile and shuttering 1,466,651,804 1,973,612,160
Total tools, fittings, fixtures and other equipment 41,080,362,495 35,556,089,028
4) Other
a) Furniture, fittings and office machines 3,150,527,263 2,276,886,778
b) Electronic machines and office systems 2,147,163,971 2,544,204,989
Total Other 5,297,691,234 4,821,091,767
5) Tangible fixed assets under construction and payments on 1,217,571,364 319,136,380
Total II - Tangible fixed assets 186,363,510,209 148,392,636,452
III- Investments
1) Equity interests in:
a) Subsidiary companies 8,332,375,736 3,832,446,456
2

b) Associated companies 45,739,879,532 49,270,798,475
c) Other companies 4,654,304,127 3,484,369,897
2) Loans :
a) subsidiary companies 1,177,597,491 746,304,716
b) associated companies 4,301,273,233 10,168,694,075
c) other equity interests 735,428,392 651,452,392
d) other loans - - - 1,013,424,953
3) Other investments - - - - - -
4) Treasury stock 699,840,000 699,840,000
Total III - Investments 65,640,698,511 69,867,330,964
T o t a l F i x e d A s s e t s B) 340,464,119,824 304,801,593,821
C) Current assets :
I - Inventory
1) Raw materials and consumables 44,590,513,313 50,542,579,185
2) Work in progress and components 33,593,135,454 17,591,606,582
3) Contracts in progress 430,002,137,619 373,575,511,475
4) Finished products and goods for resale 44,174,322,670 53,481,682,615
5) Advances to suppliers 6,241,855,489 2,067,010,156
6) Assets and materials in transit 1,243,975,942 1,987,200,163
Total I - Inventory 559,845,940,487 499,245,590,176
II - Accounts receivable
1) Trade receivables
Within the next financial year 430,415,218,616 390,398,672,534
Beyond the next financial year 10,429,983,127 11,619,281,327
Total Trade receivables 440,845,201,743 402,017,953,861
3

2) Amounts owed by subsidiary companies 104,802,333,931 75,239,014,779
3) Amounts owed by associated companies 103,250,918,898 154,523,729,876
5) Other amounts receivable
a) Tax authorities
Within the next financial year 64,009,899,990 43,221,431,312
Beyond the next financial year 3,280,158,779 3,053,599,616
Total Amounts receivable from tax authorities 67,290,058,769 46,275,030,928
b) Personnel 2,300,388,422 1,514,029,369
c) Social security institutions 4,486,479,866 6,037,435,535
d) Caution money
Within the next financial year - - - - - -
Beyond the next financial year 1,521,160,432 3,506,675,724
Total caution money 1,521,160,432 3,506,675,724
e) Amounts owed by other equity interests 3,404,880,228 2,738,388,183
f) Sundry receivables 105,171,391,808 211,454,368,687
Total other receivables 184,174,359,525 271,525,928,426
Total II - Accounts receivable 833,072,814,097 903,306,626,942
III- Investments which are not permanent
6) Other investments 167,609,945,772 149,812,150,430
IV- Cash at bank and in hand
1) Bank and postal accounts 131,805,787,728 69,977,739,639
2) Checks to be deposited - - - - - -
3) Cash on hand 821,542,687 1,383,173,019
Total IV - Cash at bank and in hand 132,627,330,415 71,360,912,658
T o t a l C u r r e n t A s s e t s C) 1,693,156,030,771 1,623,725,280,206
4

B) Provisions for contingencies and charges
3) Other
a) for contractual liabilities 182,290,872,994 229,211,896,602
b) for equity interest liabilities 1,735,724,277 - - -
184,026,597,271 229,211,896,602
C) Employee severance indemnity 24,612,717,198 26,295,714,551
D) Debts and other amounts payable
1) Debenture loans
Within the next financial year - - - - - -
Beyond the next financial year 77,000,983,600 7,000,000,000
Total debenture loans 77,000,983,600 7,000,000,000
3) Amounts owed to banks
Within the next financial year 267,630,796,416 228,427,114,596
Beyond the next financial year 271,641,443,004 171,672,215,562
Total amounts owed to banks 539,272,239,420 400,099,330,158
4) Amounts owed to other financiers
Within the next financial year 31,870,579,938 42,731,853,143
Beyond the next financial year 35,829,249,351 - - -
Total amounts owed to other financiers 67,699,829,289 42,731,853,143
5) Advances received
Within the next financial year 117,292,848,243 143,896,600,893
Beyond the next financial year 70,694,520,055 97,689,899,064
Total advances received 187,987,368,298 241,586,499,957
6) Amounts owed to suppliers
Within the next financial year 287,694,727,160 261,524,199,610
6

Beyond the next financial year 7,553,921,221 8,030,681,438
Total amounts owed to suppliers 295,248,648,381 269,554,881,048
7) Debts represented by bills of exchange
Beyond the next financial year - - - 41,545,451
8) Amounts owed to subsidiary companies 127,244,327,774 123,586,089,587
9) Amounts owed to associated companies 144,832,090,814 179,435,768,523
10) Amounts owed to parent companies 269,381,996 4,664,992,305
11) Amounts owed to tax authorities
Within the next financial year 22,731,219,378 19,902,719,363
Beyond the next financial year - - - - - -
Total amounts owed to tax authorities 22,731,219,378 19,902,719,363
12) Amounts owed to social security institutions 9,387,074,372 9,142,236,464
13) Other amounts payable
a) Other equity interests 8,353,272,039 7,104,952,774
b) deposits and caution money
Beyond the next financial year 36,200,144 37,387,887
c) Personnel 11,707,151,946 9,057,448,118
d) Sundry 75,456,136,045 152,126,881,169
Total Other amounts payable 95,552,760,174 168,326,669,948
T o t a l A m o u n t s p a y a b l e D) 1,567,225,923,496 1,466,072,585,947
E) Accruals and deferred income 15,862,045,245 14,493,682,452
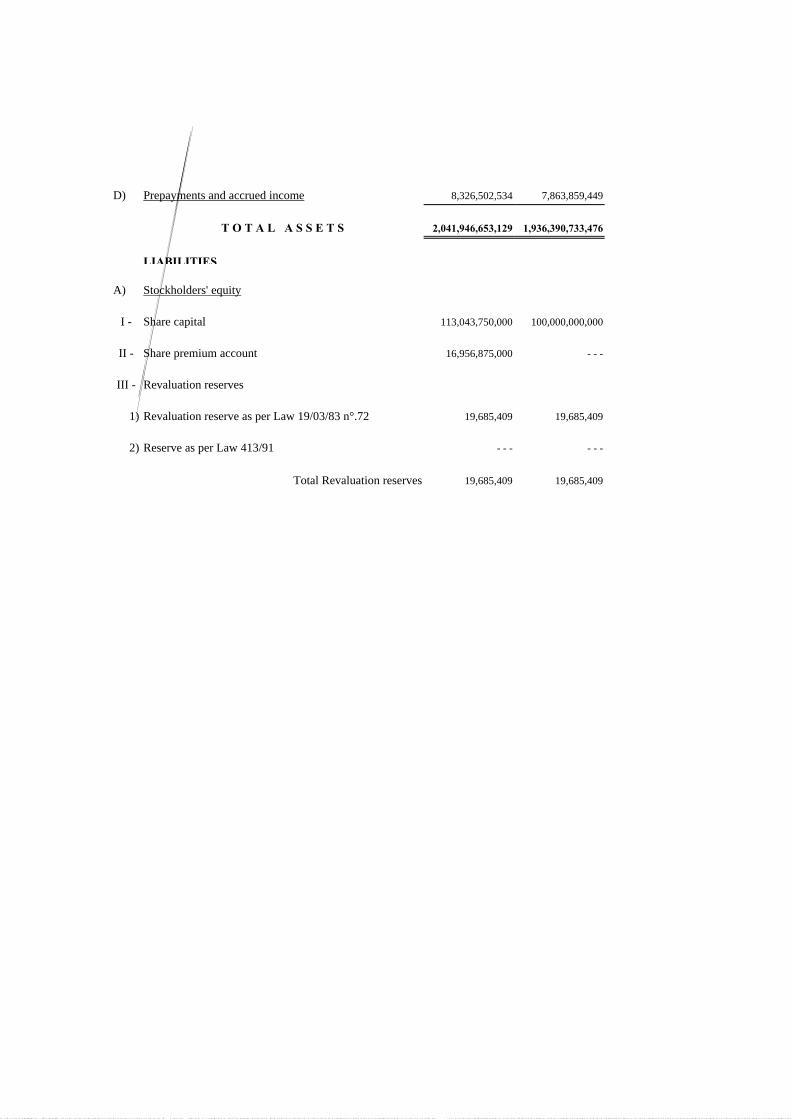
T O T A L L I A B I L I T I E S 2,041,946,653,129 1,936,390,733,476
MEMORANDUM ITEMS
A) Personal guarantees
1) Guarantees for credit lines
7

- For subsidiary companies 109,421,922,151 132,200,374,895
- For associated companies 205,907,533,371 222,717,745,564
- For third parties 7,461,500,000 5,152,000,000
Total guarantees for credit lines 322,790,955,522 360,070,120,459
2) Guarantees for works
- For subsidiary companies 375,348,906,681 217,729,797,243
- For associated companies 1,250,688,834,861 1,000,338,909,821
- For third parties 787,209,025,017 971,300,726,267
Total guarantees for works 2,413,246,766,559 2,189,369,433,331
3) Other guarantees 398,481,289,643 567,937,636,237
T o t a l A) 3,134,519,011,724 3,117,377,190,027
B) Other memorandum items
- Leased assets of others - - - 49,044,869,290
- Risk of recourse from factors 79,302,136,516 56,585,183,476
T o t a l B) 79,302,136,516 105,630,052,766
C) Collateral security 160,000,000,000 - - -
D) Third party guarantees in our favor 58,405,854,042 24,741,771,258
T O T A L M E M O R A N D U M I T E M S 3,432,227,002,282 3,247,749,014,051
INCOME STATEMENT
A) Value of production:
1) Revenues from services
- from tenders 1,326,777,597,797 1,442,171,619,959
2) Change in finished goods and work in progress inventory 16,001,528,872 14,454,854,891
3) Variation in contracts in progress 50,020,677,570 16,392,038,105
5) Other revenues and income 218,350,848,674 232,994,643,642
8

T o t a l A) 1,611,150,652,913 1,706,013,156,597
B) Cost of production
6) For raw materials and consumables 207,282,391,252 201,019,821,393
7) For services 892,356,529,458 965,494,359,453
8) For use of assets owned by others 25,846,868,670 53,904,013,017
9) For personnel
a) Wages and salaries 124,434,520,014 122,765,336,689
b) Social security costs 40,286,207,752 36,626,113,624
c) Provision for severance indemnity 8,021,259,238 8,983,057,331
e) Other personnel costs 17,493,644,551 17,562,951,076
Total personnel costs 190,235,631,555 185,937,458,720
10) Value adjustments
a) Amortization of intangible fixed assets 31,044,330,714 42,444,083,015
b) Depreciation of tangible fixed assets 37,034,852,022 32,474,513,151
d) Allowance for doubtful accounts receivable balances 5,817,496,828 2,115,774,858
Total cost of value adjustments 73,896,679,564 77,034,371,024
11) Change in raw materials, consumables and goods for sale 9,799,942,097 9,070,764,769
12) Amounts provided for contingencies 22,268,986,042 57,436,555,698
13) Other accruals 788,588,548 4,191,842,080
14) Other operating costs 71,764,688,437 72,918,348,670
T o t a l B) 1,494,240,305,623 1,627,007,534,824
Difference between value and cost of production (A-B) 116,910,347,290 79,005,621,773
C) Financial income and charges
15) Income from equity interests
a) from subsidiary companies - - - 2,147,968,902
9

b) from associated companies 10,954,154,752 352,879,154
c) from other equity interests 19,354,707 306,689,038
16) Other financial income
c) From other investments classified as current assets 7,114,627,041 19,217,123
d) Other income not included above
- from subsidiary companies 841,899,785 1,504,297,788
- from associated companies 4,883,417,331 996,689,627
- from others 10,491,745,904 30,155,029,820
17) Interest payable and similar charges
- to subsidiary companies - 150,890,272 - 13,198,512
- to associated companies - 319,980,561 - 31,430,424
- to others for charges on investments - 7,705,255,770 - 29,838,891,046
- to others for other financial charges - 62,188,807,271 - 55,170,893,293
Total (15+16-17) - 36,059,734,354 - 49,571,641,823
D) Value adjustments in respect of investments
18) Revaluations
a) Of equity interests - - - 154,596,828
19) Devaluations
a) Of equity interests - 33,876,906,117 - 1,691,424,086
Total value adjustments (18 + 19 ) - 33,876,906,117 - 1,536,827,258
E) Extraordinary income and charges
20) Income
a) sundry income 17,638,696,280 14,500,003,304
21) Charges
a) sundry charges - 21,170,660,521 - 7,845,467,380
10

b) extraordinary losses - 1,922,123 - 2,625,797
Total of the extraordinary items (20-21) - 3,533,886,364 6,651,910,127
Pre-tax profit (loss) (A-B+-C+-D+-E) 43,439,820,455 34,549,062,819
22) Taxation - 21,416,077,922 - 13,204,231,342
23) Profit (loss) for the year
a) consolidated 22,023,742,533 21,344,831,477
b) minority interest profit/loss for the year
- profit - 12,270,232
- loss 242,736,277 - - -
26) Group profit (loss) for the year 22,266,478,810 21,332,561,245
Notes to the Consolidated Financial Statements
Basis of Presentation
Astaldi S.p.A. has drafted the consolidated financial statements in accor-
dance with the principles established in Law 127/91, which applies EEC
Directive VII, even though it was not obliged to, in that the Group consoli-
dated financial statements are prepared by its parent company FIN.AST.
S.r.l.
The financial statements include the cash flow statement, the reconciliation
between the parent company financial statements and the consolidated fi-
nancial statements and the movements in the items of the consolidated
stockholders' equity.
We specify that the reference date of the consolidated financial statements
coincides with the financial year of Astaldi S.p.A. and most of the subsidi-
ary companies included in the consolidation. The financial statements of
the latter have been appropriately reclassified and adjusted so as to con-
11

form to the Group accounting policies and valuation criteria. In those cases
where the financial year of the consolidated companies does not coincide
with the calendar year, infra-year financial statements have been drafted by
the directors which reflect the normal operations of the Group.
In some cases, which are pointed out in the notes below, items and compo-
nents of the balance sheet and income statement have been reclassified to
clarify the presentation.
Consolidation policies
The main consolidation policies adopted are the following:
• the accounting value of the equity interests held by the parent company
and included in the consolidation area has been eliminated and substi-
tuted with the stockholders' equity of the consolidated companies, tak-
ing on their assets and liabilities. Any higher amount paid compared to
the book stockholders' equity of the company invested in at the date of
purchase is attributed to the individual items of the assets and liabilities
to which the higher amount refers. Any residual positive difference is
stated in the consolidation difference item; any residual negative differ-
ence is accounted for in the consolidation provision for future contin-
gencies and charges against estimated future losses or in the consolida-
tion reserve included in the stockholders' equity. The transfer of any
profit/loss is charged to the retained earnings item;
• the items of accounts payable, accounts receivable, costs and income,
dividends received and losses provided for and any other transactions
between companies included in the consolidation area have been elimi-
nated;
12

• also eliminated are the value adjustments and the provisions made ex-
clusively in the application of tax regulations;
• the portions of stockholders' equity and profit/loss for the year pertain-
ing to minority interests are stated in a specific item of the stockholders'
equity and the income statement. Moreover, in the event of losses sus-
tained by companies included in the consolidation area in which there
are third party stockholders, the portion of the loss attributed to the lat-
ter does not exceed the relative portion of their stockholders' equity ex-
cept in those cases where said minority stockholders have undertaken to
cover the losses pertaining to them.
Consolidation area
The consolidation area, other than the Parent Company Astaldi S.p.A.,
comprises:
a) companies or other legal entities in which the Parent Company directly
or indirectly holds more than 50% of the share capital or over which it
exercises effective control; these companies are consolidated with the
global integration method;
b) companies or other legal entities over which the Parent Company exer-
cises joint control with other stockholders; these companies are consoli-
dated with the proportional integration method.
The permanent equity interests in important associated companies over
which the Group exercises its own influence are valued with the equity
method.
Excluded from the consolidation area are the controlling equity interests in
consortia and consortium companies which, by re-charging costs and in-
13

come to the members, do not present their own profits/losses and the rela-
tive financial statements of which, after eliminating related party assets and
liabilities, have no significant assets.
Finally, the permanent equity interests in non-consolidated subsidiary
companies and in associated companies, the size of which is not relevant,
and the other equity interests are valued at cost.
Companies in liquidation are valued at cost, adjusted to take into account
the liquidation costs.
The financial statements approved by the annual general meetings of the
stockholders have been used for the consolidation or, in their absence, the
draft financial statements approved by the Boards of Directors.
The list of the consolidation area is attached hereto.
Accounting policies and valuation criteria
The accounting policies and valuation criteria adopted comply with the
provisions of Article 2426 of the Civil Code and reflect the policies estab-
lished by the Consigli Nazionali dei Dottori Commercialisti e dei Ragionieri (Ital-
ian Accountants Association) and are unchanged with respect to the previ-
ous year. Moreover, so as to better present the financial situation, we high-
light the following:
◊ leased assets are stated in compliance with I.A.S. 17, which envisages
stating the asset among the tangible fixed assets, along with deprecia-
tion, and the amount owed to the lessor, along with the relative fi-
nancial charges. In previous years, these assets were stated in accor-
dance with the then standard Italian practice of charging the leasing
installments to the income statement. The effects of this change in the
14

valuation criteria compared to the initial stockholders' equity are
stated under extraordinary income;
◊ the consolidation reserve, where the transfer of any profit/loss
flowed until last year, has been reclassified in the stockholders' equity
items retained earnings and revaluation reserves;
◊ accounts receivable sold with recourse have been removed from the
balance sheet and the amount of the recourse liability is stated in the
memorandum items. In previous years, these accounts receivable
were not removed and an amount owed to the factor was entered.
The balances of the previous years have consequently been reclassi-
fied on the basis of the principle stated above.
There have been no derogations as per Articles 2423 and 2423 bis of the
Civil Code. We also highlight that the items represented by Arabic num-
bers which have a zero balance in this and the previous year have not been
included in the financial statements; consequently, the numbering is not
consecutive.
The accounting policies and valuation criteria adopted are the following.
Intangible fixed assets.
The intangible fixed assets are costs and expenses with a useful life of more
than one year and are accounted for and stated on the basis of the cost ac-
tually incurred, including any directly chargeable accessory charges. Their
amount is stated in the financial statements net of direct accumulated am-
ortization, calculated on the residual outstanding useful life of the individ-
ual items; in particular:
• formation and start-up costs, which are the charges sustained by the
15

parent company and other equity interests for the incorporation and is-
sues of new shares and are amortized on a straightline basis over five
years;
• the costs relating to the purchase of rights to use patents of others and
licenses, trademarks or similar rights are charged to the income state-
ment on the basis of the estimated useful life;
• the value of the concession rights indicated in the financial statements
expresses the symbolic valuation of the concession right relating to car
spaces in the "Palazzo" multi-storey car park in Turin. Car spaces for
sale are charged to the income statement in the year of sale, while car
spaces rented in rotation are stated proportionally to the duration of the
concession;
• the goodwill item, fully amortized in 2000, represented the inherent
value of the companies of the former Gruppo Dipenta Costruzioni
S.p.A. (GDC) incorporated by GDC in 1990. The overall initial amount
was reduced by the accumulated amortization of the previous years and
the year in question, taking into account the resolution of the Board of
Directors on 6 December 1999;
• construction site installation costs show the costs incurred for planning
and organizing awarded contracts and are charged to the income
statement according to the progress of the contract;
• costs of preparing tenders, for participating in tenders, (awaiting the
formal awarding), have been stripped of the charges for which there is
no reasonable certainty regarding the awarding of the contract by charg-
ing them to the income statement;
16

• other intangible fixed assets are mainly ascribable to the value of the
contractual rights acquired for current projects both in Italy and abroad,
to expenses for studies and planning and to other sundry fixed assets.
As concerns the amortization criteria of the expenses included in this
item, we state below the different methods used:
- The value of the contractual rights is charged according to the pro-
gress of the relative contracts, in compliance with current regula-
tions;
- The expenses for studies and planning and the costs for improve-
ments and additional expenses on third party assets are amortized
on a straightline basis over the shorter period between the residual
duration of the contract and 5 years.
Tangible fixed assets
The valuation of the Tangible fixed assets, representing real property and
plant, machinery and equipment used for the business activity, has been
made on the basis of the purchase price and the construction cost, includ-
ing directly chargeable accessory charges. For some real property (land and
buildings), as well as plant, machinery and equipment, some appropriate
and permitted revaluations have been made on the basis of Laws n°. 72 of
19 March 1983 and n°. 413 of 30 December 1991.
Modernization and improvements costs which extend the economic life of
the assets are added to their value.
As stated above, from this year, the balance of the tangible fixed assets also
includes the leased assets.
Depreciation is calculated on a straightline basis over the residual useful
17

life, within the limits of the tax rates deemed representative of the esti-
mated useful life of the assets. The depreciation rates are reduced by 50%
for assets purchased during the year.
Equity interests
Equity interests are valued with the equity and cost methods on the basis of
the criteria indicated in the "Consolidation area" paragraph above. Those
equity interests valued according to the equity method are stated for an
amount equal to the corresponding fraction of the stockholders' equity of
the company invested in, after making the adjustments required by the
presentation policies of the consolidated financial statements.
Those equity interests valued according to the cost method, including di-
rectly chargeable accessory charges, may be adjusted to reflect any impair-
ment.
Dividends are stated on an accrual basis when the right to collection occurs,
pursuant to the resolution passed by the general meeting of the companies
in which an equity interest is held (or by the Board of Directors in the event
of subsidiary companies) to distribute the profit or any of the reserves. This
is on condition that the date of approving the financial statements of the
company in which an equity interest is held and the relative resolution to
distribute the profits be prior to the approval of the financial statements of
the beneficiary company.
Accounts receivable and accounts payable
Accounts receivable are stated at their estimated realizable value by appro-
priate allocations adjusting the nominal values. Accounts payable are
stated at their nominal value.
18

Foreign currency transactions
Accounts receivable and accounts payable in currencies other than Lire are
stated at the exchange rate applicable at the date of entry. At the end of the
financial year, the balances are reflected in the financial statements at the
year end exchange rate.
The balances of the foreign consolidated companies and of the foreign sta-
ble organizations (the accounts of the latter are kept using a multi-currency
accounting system) are converted into Italian Lire according to the follow-
ing criteria:
◊ assets and liabilities at the exchange rate in force at the year end;
◊ income statement items at the average exchange rate for the year;
◊ components of stockholders' equity at the exchange rates in force at
the relative time of formation.
Exchange rate differences arising from the conversion of the final stock-
holders' equity at the historical formation exchange rates compared to
those in force at the date of the financial statements, including the differ-
ence arising from the profit/loss expressed at average exchange rates, are
charged directly to the stockholders' equity under the conversion reserve or
loss item.
Raw materials and consumables inventory
Are valued at the average purchase cost which is however lower than cur-
rent market prices.
Work in progress and components
Work in progress is valued at construction cost, taking into account the re-
alizable values.
19

Contracts in progress
The valuation of contracts in progress - awarded by contracting parties for
works beyond one year - was made with specific reference to the physical
progress of works which were not audited at the year end, but identified
with reasonable certainty and by applying the consideration contractually
agreed. This valuation also took account of the auditors' fees. For contrac-
tual reserves, the valuation made focused on positive outcomes of the dis-
putes with the contracting bodies which can reasonably expected, on the
basis of certain technical and legal aspects.
Works beyond one year awarded by contracting parties were valued on the
basis of the execution costs actually sustained.
Finished products and goods for resale.
State the construction cost of the building projects awaiting to be billed.
Investments.
Investments are stated at the lower of purchase cost, including accessory
charges, and the market value assessed on the basis of the prices on regu-
lated markets or other financial market indicators.
Cash at bank and in hand
This item is the amount of available cash at the year and the balances of the
bank accounts.
Accruals and deferrals
These are calculated on an accrual basis.
Provision for contractual liabilities
The provision is established so as to cover probable losses, the size and tim-
ing of which is not known, relating to the carrying out of works beyond
20

one year. The provision is set up and modified in relation to each contract
according to the progress and final outcome of the works.
Provision for equity interest liabilities
The provision is established so as to cover those losses, ascribable to com-
panies invested in, of a known nature, of a probable or certain existence,
where the amount or crystallization date of which is unknown at the year
end.
Provision for employee severance indemnity
The provision for employee severance indemnity is allocated systematically
according to the years of service accrued and in compliance with the laws
and labor contracts currently in force in Italy. This provision states the
amount owed to the employees. Utilization of the provision occurs when
employment is terminated and upon the payment of advances as per Law
297/82.
Income statement
The positive and negative income components are stated on an accrual ba-
sis.
Taxation
Taxation is stated on the basis of the current tax laws in force in the coun-
tries in which the Group companies operate. Amounts owed for deferred
taxation and the amounts receivable for advance taxation, where evi-
denced, are charged to the provisions for contingencies and charges and in
the other amounts receivable in the current assets of the balance sheet, re-
spectively. Advance taxation is stated only if there is a reasonable chance of
recovery; deferred taxation is not stated if there are few chances that the
21

relative amount payable will crystallize.
The change in the inventory stated in the income statement does not coin-
cide with the difference between the final inventory for the year and that of
the previous year stated in the balance sheet, due to both the different ex-
change rates adopted (average exchange rate for the income statement,
year end rate for the balance sheet) as well as to the changes in the consoli-
dation area.
Indications as per Law 213/98
For the purposes of converting those currencies adhering to the Euro, in
1998 the values were adjusted by adopting the irrevocable parities fixed by
the EC on 31.12.98; the relative exchange rate differences were charged by
adopting the "synthetic model" established in Article 18 paragraph 6 of the
captioned Law. Therefore, one quarter of the total losses and profits were
charged to the year's income statement with the outstanding amounts to be
carried forward stated in the contingent assets and liabilities items.
COMMENTS ON THE MAIN ITEMS OF THE
BALANCE SHEET AND THE INCOME STATEMENT
B) Fixed assets: 340,464 million Lire
B.I) Intangible fixed assets: 88,460 million Lire
The changes in the intangible fixed assets are the following (million Lire):
Balance at Increase for Transfer to Amortization Change in co.'s Effect of Balance at
31.12.99 the year other catego- for the year consolidated Leasing 31.12.00
- formation and start-up 64 6,922 5 (1,408) - - 5,583
- patents 2,056 746 363 (731) - - 2,434
22
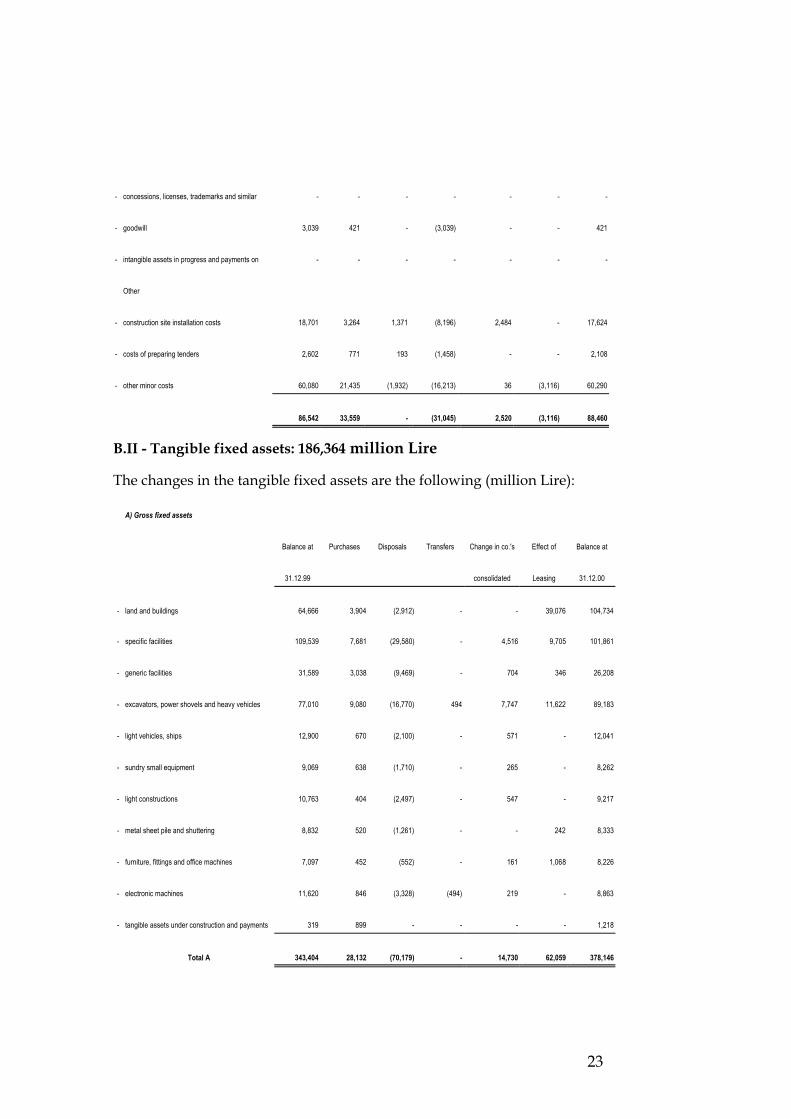
- concessions, licenses, trademarks and similar - - - - - - -
- goodwill 3,039 421 - (3,039) - - 421
- intangible assets in progress and payments on - - - - - - -
Other
- construction site installation costs 18,701 3,264 1,371 (8,196) 2,484 - 17,624
- costs of preparing tenders 2,602 771 193 (1,458) - - 2,108
- other minor costs 60,080 21,435 (1,932) (16,213) 36 (3,116) 60,290
86,542 33,559 - (31,045) 2,520 (3,116) 88,460
B.II - Tangible fixed assets: 186,364 million Lire
The changes in the tangible fixed assets are the following (million Lire):
A) Gross fixed assets
Balance at Purchases Disposals Transfers Change in co.'s Effect of Balance at
31.12.99 consolidated Leasing 31.12.00
- land and buildings 64,666 3,904 (2,912) - - 39,076 104,734
- specific facilities 109,539 7,681 (29,580) - 4,516 9,705 101,861
- generic facilities 31,589 3,038 (9,469) - 704 346 26,208
- excavators, power shovels and heavy vehicles 77,010 9,080 (16,770) 494 7,747 11,622 89,183
- light vehicles, ships 12,900 670 (2,100) - 571 - 12,041
- sundry small equipment 9,069 638 (1,710) - 265 - 8,262
- light constructions 10,763 404 (2,497) - 547 - 9,217
- metal sheet pile and shuttering 8,832 520 (1,261) - - 242 8,333
- furniture, fittings and office machines 7,097 452 (552) - 161 1,068 8,226
- electronic machines 11,620 846 (3,328) (494) 219 - 8,863
- tangible assets under construction and payments 319 899 - - - - 1,218
Total A 343,404 28,132 (70,179) - 14,730 62,059 378,146
23

B) Depreciation Accumulated
Balance at Depreciation Disposals Transfers Change in co.'s Effect of Balance at
31.12.99 consolidated Leasing 31.12.00
- land and buildings 13,528 2,840 (254) - - 642 16,756
- specific facilities 67,019 14,595 (21,383) - 873 2,304 63,408
- generic facilities 17,551 3,046 (6,797) - 19 52 13,871
- excavators, power shovels and heavy vehicles 53,667 10,914 (10,009) - (53) 3,894 58,413
- light vehicles, ships 8,428 1,466 (1,692) - (22) - 8,180
- sundry small equipment 7,950 790 (1,563) - 2 - 7,179
- light constructions 6,114 923 (1,727) - 7 - 5,317
- metal sheet pile and shuttering 6,858 757 (799) - 6 45 6,867
- furniture, fittings and office machines 4,820 632 (453) - 12 64 5,075
- electronic machines 9,076 1,072 (3,497) - 65 - 6,716
Total B 195,011 37,035 (48,174) - 909 7,001 191,782
Total net fixed assets (A-B) 148,393 186,364
First of all, it is pointed out that during the year the purchase values of the
leased fixed assets have been re-allocated to their respective asset catego-
ries, so as to improve the presentation.
The following other movements during the year are highlighted:
- the increases attributable to the normal process of renewal as well
as entry into the consolidation area of the net value of the fixed as-
sets of Consorzio Astaldi Columbus Nicaragua and Albapavstrade
Doo;
- the disposals essentially referring to projects abroad which
concluded during the year or are about to conclude, as well as
24

the substitution of obsolete machinery and equipment.
B) III - Investments: 65,641 million Lire
Details of the non-consolidated subsidiary and associated companies are
listed in an attachment hereto.
Amounts receivable from subsidiaries, associates, other companies and
third parties, stated in the financial statements for an overall amount of
6,214 million Lire, decreased by 6,365 million Lire overall; these items were
not affected by changes in the consolidation area.
These amounts receivable essentially express the Company's finan-
cial support of work in progress, particularly abroad, as well as loans
to companies in liquidation.
The treasury stock balance of about 700 million Lire did not change and re-
fers to 108,000 shares, nominal value 12,500 Lire each.
C) I - Inventory: 559,846 million Lire
The overall 60,600 million Lire increase in inventory, which includes a posi-
tive change of 3,881 million Lire in the consolidation area, comprises:
• a 5,952 million Lire decrease in raw materials and consumables;
• a 16,002 million Lire increase in work in progress;
• a 56,427 million Lire increase in contracts in progress;
• a 9,307 million Lire decrease in finished products and goods for resale;
• a 4,174 million Lire increase in advances to suppliers;
• a 743 million Lire decrease in goods and materials in transit;
the changes in the balance sheet inventory do not correspond to the income
statement due to both the different exchange rates used and the changes in
the consolidation area.
25
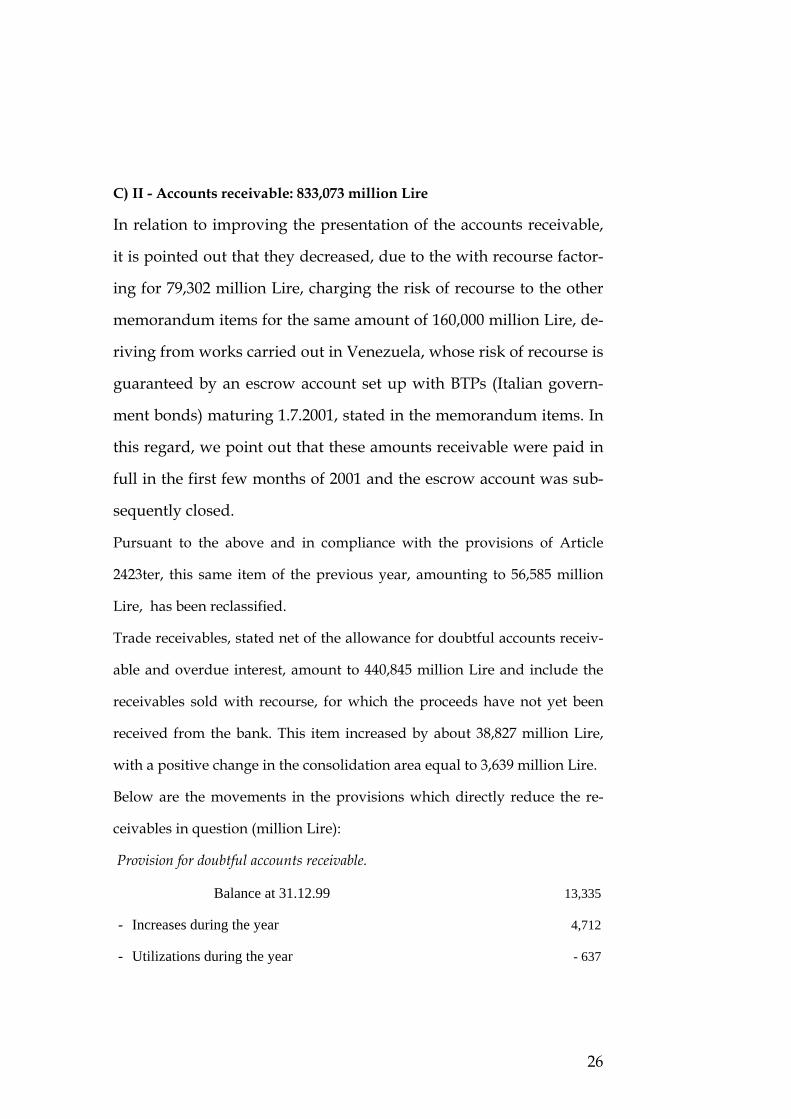
C) II - Accounts receivable: 833,073 million Lire
In relation to improving the presentation of the accounts receivable,
it is pointed out that they decreased, due to the with recourse factor-
ing for 79,302 million Lire, charging the risk of recourse to the other
memorandum items for the same amount of 160,000 million Lire, de-
riving from works carried out in Venezuela, whose risk of recourse is
guaranteed by an escrow account set up with BTPs (Italian govern-
ment bonds) maturing 1.7.2001, stated in the memorandum items. In
this regard, we point out that these amounts receivable were paid in
full in the first few months of 2001 and the escrow account was sub-
sequently closed.
Pursuant to the above and in compliance with the provisions of Article
2423ter, this same item of the previous year, amounting to 56,585 million
Lire, has been reclassified.
Trade receivables, stated net of the allowance for doubtful accounts receiv-
able and overdue interest, amount to 440,845 million Lire and include the
receivables sold with recourse, for which the proceeds have not yet been
received from the bank. This item increased by about 38,827 million Lire,
with a positive change in the consolidation area equal to 3,639 million Lire.
Below are the movements in the provisions which directly reduce the re-
ceivables in question (million Lire):
Provision for doubtful accounts receivable.
Balance at 31.12.99 13,335
- Increases during the year 4,712
- Utilizations during the year - 637
26

- Conversion difference - 13
Balance al 31.12.00 17,397
Provision for overdue interest.
Balance at 31.12.99 8,881
- Increases during the year 788
- Utilizations during the year - 2,916
Balance at 31.12.00 6,753
Amounts owed by subsidiary companies total 104,802 million Lire, an in-
crease of about 29,563 million Lire.
Amounts owed by associated companies, 103,251 million Lire, decreased
by about 51,273 million Lire; the change in the consolidation area influ-
ences positively for 1,157 million Lire.
Other receivables, as stated in the financial statements, comprise:
• 67,290 million Lire receivable from the tax authorities, an increase of
21,015 million Lire (change in the consolidation area equal to 904 million
Lire); the amount is stated net of a 382 million Lire provision for over-
due interest, unchanged for the year;
• 2,300 million Lire receivable from the staff, an increase of 786 million
Lire (change in the consolidation area equal to 91 million Lire);
• 4,486 million Lire receivable from social security institutions, a decrease
of 1,551 million Lire (change in the consolidation area equal to 17 million
Lire);
• 1,521 million Lire of caution money, a 1,986 million Lire decrease
(change in the consolidation area equal to 36 million Lire);
• 3,405 million Lire owed by other equity interests, an increase of 666 mil-
27

lion Lire (positive change in the consolidation area equal to 338 million
Lire);
• 105,171 million Lire of sundry receivables, a decrease of 106,283 million
Lire (positive change in the consolidation area equal to 798 million Lire).
The receivables are stated net of a 2,981 million Lire provision for over-
due interest. Listed below are some significant items:
◊ 1,990 million Lire receivable from the Ministry for Home Affairs for
interest claimed on installments paid late;
◊ 6,494 million Lire of trade receivables connected to some real estate
ventures;
◊ 17,209 million Lire receivable from subcontractors and suppliers for
advances on services and deliveries to be carried out;
C) III - Other investments: 167,610 million Lire
This item increased by 17,798 million Lire. The 160,002 million Lire of BTPs
maturing 1.7.2001 refers to a with recourse sale of Venezuelan receivables.
C) IV - Cash at bank and in hand: 132,627 million Lire
This item comprises 131,806 million Lire of bank accounts and 822 million
Lire of cash on hand, an increase of 61,828 million Lire and a decrease of
562 million Lire, respectively. The change in the consolidation area pro-
duces a positive change of 1,638 million Lire.
D) Prepayments and accrued income: 8,327 million Lire
This item, 463 million more than the previous year, comprises 4,341 million
Lire of accrued income, mainly relating to interest accrued on government
bonds (BTPs maturing 1.7.2001), 3,986 million Lire of prepayments relating
to insurance costs, guarantee fees, charges on loans and other components
28

of residual value. This last item also includes 175 million Lire of exchange
rate differences to be spread out, realized on currencies adhering to the
Euro and deferred to future years as per the provision of Article 18 para-
graph 9 of Law 213/98. The positive change in the consolidation area is
equal to 555 million Lire.
A) Stockholders' equity
In 2000, specifically at the extraordinary general meeting of 20 July, a new
issue of parent company shares was approved up to 113,043,750,000 Lire,
by issuing 1,043,500 new shares of nominal value 12,500 each at a price of
28,750 Lire per share, inclusive of a share premium of 16,250 Lire.
This new issue was subscribed and paid-up on 16 October 2000. Conse-
quently, the parent company share capital comprises 9,043,500 ordinary
shares with a nominal value of 12,500 Lire each.
In compliance with that which is stated in the accounting policies and
valuation criteria, the consolidation reserve, where, up to last year, the
transfer of any profit/loss flowed, was reclassified in the stockholders'
equity item D) VIII - Retained earnings. This item amounts to 24,471 mil-
lion Lire overall.
Consequently, in order to preserve the comparability of the financial state-
ments, the consolidation reserve at 31.12.1999, equal to 26,722 million Lire,
was reclassified as follows:
- 26,702 million Lire to retained earnings;
- 20 million Lire to the revaluation reserve.
The changes in the stockholders' equity are stated in the attached table.
The reconciliation between the Parent Company and the consolidated
29

stockholders' equity and profit/loss for the year is attached hereto.
B) Provisions for contingencies and charges: 184,027 million Lire
At 31 December 2000, the provisions for contingencies and charges
amounted to 184,027 million Lire, against 229,212 million Lire the previous
year. They comprise:
- the contractual liability provision against losses which are probable,
but of indefinite size and timing, relating to the carrying out of
works beyond one year;
- the provision for equity interest liabilities is established to cover
losses of a known nature, of a probable or certain existence, where
the amount or crystallization date of which is unknown at the year
end. It should be pointed out that, in compliance with Articles 2423
onwards of the Civil Code, until 1999, these risks were included in
the wider context of the contractual liability provision.
The changes to these items are stated in the table below (million Lire):
Balance at Increase during Decrease during Change in co.'s Balance at
31.12.99 the year the year consolidated 31.12.00
- provision for contractual liabilities 229,212 22,269 (77,182) 7,992 182,291
- provision for equity interest liabilities - 1,736 - - 1,736
Total 229,212 24,005 (77,182) 7,992 184,027
Within the decreases, the utilization for 24,599 million Lire to cover the bal-
ance sheet deficit relating to the equity interest in Alosa Immobiliare S.p.A.
in Liquidation must be pointed out, the income effect of which was already
provided for in previous years.
C - Employee severance indemnity: 24,613 million Lire
The changes during the year are the following:
30

Balance at Increase during Decrease during Change in co.'s Balance at
31.12.99 the year the year consolidated 31.12.00
- provision for employee severance 26,296 8,021 (10,636) 932 24,613
D) - Accounts payable: 1,567,226 million Lire
This item comprises the following:
• debenture loans amounting to 77,001 million Lire, as follows:
- Debenture loan of 7,000 million Lire issued by Gruppo
Dipenta Costruzioni S.p.A. by means of 700,000 deben-
tures, nominal value of 1,000 Lire each, with the following
characteristics:
duration 1.8.98-31.7.03;
coupon 5.5% per annum in arrears;
coupon date 31 July each year.
- Convertible debenture loan issued by the Company pursuant
to a resolution passed at the stockholders' meeting of 20
July 2000 for a maximum amount of 70,001 million Lire by
means of 2,117,200 convertible debentures, nominal value
of 33,603 Lire each, with the following characteristics:
duration 1.8.2000-31.8.2003;
coupon floating rate interest calculated semiannually
on 6-month Euribor plus 25 basis points, as calculated
by the average of the quotes by Banca di Roma S.p.A.,
Interbanca S.p.A. and Sofipa S.p.A. on the fifth working
day prior to the coupon date;
31

semiannual coupon date 31 January and 31 July each
year.
• 539,272 million Lire owed to banks, an increase of 139,173 million Lire
with a 4,273 million Lire increase in the consolidation area; the increase
is affected by the drawing of new loans by the Parent Company with
various financial institutions for an overall amount of 121,860 million
Lire.
• 67,700 million Lire owed to other financiers, an increase of 24,968 million
Lire, largely to be attributed to the different accounting policies regard-
ing leasing contracts;
• 187,987 million Lire of advances received, a decrease of 53,599 million
Lire; this includes a increase of 7,898 million Lire for the change in the
consolidation area.
• 295,249 million Lire owed to suppliers, an increase of 25,694 million Lire;
this includes an increase of 4,397 million Lire for the change in the con-
solidation area.
• 127,244 million Lire owed to subsidiary companies, an increase of 3,658
million Lire compared to the previous year;
• 144,832 million Lire owed to associated companies, a decrease of 34,624
million Lire compared to the previous year; there was a 823 million Lire
positive change in the consolidation area.
• 269 million Lire owed to parent companies, a decrease of 4,396 million
Lire.
• 22,732 million Lire owed to the tax authorities, an increase of 2,828 mil-
lion Lire, 2,343 million Lire of which attributable to the change in the
32

consolidation area;
• 9,387 million Lire owed to social security institutions, an increase of 245
million Lire with a 161 million Lire positive change in the consolidation
area.
• 95,553 million Lire of other payables, a 76,671 million Lire decrease com-
pared to the previous year, detailed as follows:
o 8,353 million Lire owed to other equity interests, an increase of
1,248 million Lire;
o 36 million Lire of deposits and caution money;
o 11,707 million Lire owed to the employees, a 2,650 million Lire in-
crease; the change in the consolidated area was 53 million Lire.
o 75,456 million Lire of sundry amounts payable, a 76,671 million de-
crease which includes a 1,176 million increase relating to the change
in the consolidation area.
E) - Accruals and deferred income: 15,862 million Lire
This item, which increased by 1,368 million Lire, comprises:
o 7,956 million Lire of accruals relating essentially to interest payable
on loans and the fourteenth month pay;
o 7,906 million Lire of deferred income, essentially referring to grants
received for plants, for the construction of car parks, in accordance
with the provisions of Law 122/89. This last item includes 249 mil-
lion Lire of exchange rate differences to be spread out, realized on
currencies adhering to the Euro and deferred to future years as per
the provision of Article 18 paragraph 9 of Law 213/98.
MEMORANDUM ITEMS
33

Personal guarantees
The overall amount stated in the financial statements is 3,134,519 billion
Lire and refers to:
1. Guarantees for credit lines opened for non-consolidated subsidiary
and associated

58,406 million Lire of guarantees issued by banks to insurance companies,
on behalf of suppliers and sub-contractors, both Italian and foreign, relat-
ing to contractual undertakings made to ourselves.
A) - Value of production: 1,611,151 million Lire
The distribution of the year's revenues by geographical area is the follow-
ing:
- Italy 842,736
- Europe 142,387
- Africa 108,642
- America 279,873
- Asia 19,162
Total revenues from works 1,392,800
- other income 218,351
Total 1,611,151
C) 15 - C) 16 - Financial income: 34,305 million Lire
Financial income for the year includes (million Lire):
income from equity interests:
- from non-consolidated associated companies 10,954
- from other non-consolidated equity interests 19
other financial income:
- from other investments classified as current assets 7,115
- interest owed by non-consolidated subsidiary companies 842
- interest owed by non-consolidated associated companies 4,883
- exchange rate gains 3,695
- interest receivable on bank accounts 2,478
35

- other interest owed by contracting parties and sundry receivables
4,319
C) - 17 - Interest payable and similar charges: 70,365 million Lire
This item includes (million Lire):
interest payable to non-consolidated subsidiary companies 151
interest payable to non-consolidated associated companies 320
charges on losses on disposal of investments
Venezuelan bonds paid in 1999 7,705
similar charges comprise:
- bank interest payable on short-term debt 17,319
- bank interest payable on medium- and long-term debt 19,371
- interest payable on other debt (1,042 million Lire of which on deben-
tures) 10,642
- discounts and other charges 11,909
- exchange rate losses 2,948
D) - 19 - Devaluation of equity interests: 33,877 million Lire
This item comprises:
Covering of losses. 25,394
- Subsidiary companies 583
- Associated companies 24,811
One of the most significant amounts is the 24,599 million Lire loss suf-
fered by the associate company Alosa S.p.A. in liquidation.
Devaluation of equity interests. 6,747
- Subsidiary companies 246
- Associated companies 6,238
36

- Other equity interests 263
This is the combined effect of the write-down of equity interests in
companies in liquidation as well as interventions on the share capital of
other equity interests.
Allocation to the provision for equity interest liabilities. 1,736
- Subsidiary companies 1,125
- Associated companies 611
This item refers to the allocation of the portion of the balance sheet deficit
relating in particular to companies in liquidation.
E) - Extraordinary income and charges: (3,534) million Lire
• The extraordinary income is the sum of insurance claims paid, contin-
gent and non-existent assets of an extraordinary nature for 17,639 mil-
lion Lire.
• The 21,173 million Lire of extraordinary charges comprises damages and
accidents, contingent and non-existent liabilities, amicable settlements,
contractual penalties and other charges of residual value.
22 - Taxation: 21,416 million Lire
The amount is the taxation for the year of the Parent Company and the
other Italian companies consolidated.
As concerns "advance and deferred taxation", the tax effects deriving from
the taxable timing differences (deferred taxation) and the deductible timing
differences (advance taxation) have been calculated. The taxation originat-
ing from these calculations are reported in the tables below, divided by the
years in which they arose.
Deferred taxation ('000 Lire)
37

ASTALDI S.p.A.
Type of taxable Prior to 2000 2000 Progr.31.12.00
differences
Deferred capital gains - 5,048,682 5,048,682 -
Integration of provisions - 10,897,964 - 1,196,585 - 12,094,549
- 15,946,646 3,852,097 - 12,094,549
ITALSTRADE S.p.A.
Type of taxable Prior to 2000 2000 Progr.31/12/00
differences
Deferred capital gains - - -
Integration of provisions - - -
- - -
R.I.C. S.p.A.
Type of taxable Prior to 2000 2000 Progr.31.12.00
differences
Deferred capital gains - - -
Integration of provisions - - -
- - -
Advance taxation ('000 Lire)
ASTALDI S.p.A.
Type of deductible Prior to 2000 2000 Progr.31.12.00
differences
Unpaid directors' emoluments 139,815 - 35,695 104,120
Costs pertaining to other years 89,070 9,007 98,077
Tax losses of previous years - - -
38

Taxed provisions - - -
228,885 - 26,688 202,197
ITALSTRADE S.p.A.
Type of deductible Prior to 2000 2000 Progr.31.12.00
differences
Unpaid directors' emoluments - - -
Costs pertaining to other years 351,659 - 16,785 334,874
Tax losses of previous years 33,029,091 - 10,358,451 22,670,640
Taxed provisions 35,853,869 - 1,585,515 34,268,354
69,234,619 - 11,960,751 57,273,868
R.I.C. S.p.A.
Type of deductible Prior to 2000 2000 Progr.31.12.00
differences
Unpaid directors' emoluments - - -
Costs pertaining to other years 752 - 404 348
Tax losses of previous years 8,595,213 - 5,439,654 3,155,559
Taxed provisions - - -
8,595,965 - 5,440,058 3,155,907
SUMMARY TOTAL
Type Prior to 2000 2000 Progr.31.12.00
Deferred taxation - 15,946,646 3,852,097 - 12,094,549
Advance taxation 78,059,469 - 17,427,497 60,631,972
62,112,823 - 13,575,400 48,537,423
Having calculated the advance and deferred taxation as above, their report-
39

ing in the financial statements required the following policies to be
adopted:
deferred taxation is stated for the full amount, on condition that
the payment thereof is not unlikely;
advance taxation is stated in accordance with the following cri-
teria:
the existence of taxable income in future years;
adoption of a maximum three year timescale, prudently tak-
ing into account the existence of income budgets corre-
sponding to those periods.
Considering the planned merger by incorporation of the consolidated com-
pany Italstrade S.p.A., amply covered in the Directors' Report, and given
the magnitude of the deductible timing differences of that company, the
conditions to state deferred taxation in the parent company's financial
statements were deemed not to exist, in compliance with the principles of
reasonable certainty of the crystallization of the liability; equally, the asset
side has not been stated on the basis of prudence.
Average number of employees
The average number of employees during the year, divided by category, is
the following:
- senior and middle management 125
- clerical 1,327
- manual 5,186
Directors' emoluments and Auditors' fees
The emoluments and fees of the parent company's Directors and Auditors
40

for carrying out their duties, also for other companies included in the con-
solidation, are the following:
Directors' emoluments: 1,120 million Lire;
Statutory Auditors' fees: 116 million Lire.
The Board of Directors
The Chairman
Prof. Ernesto Monti
41

EXCHANGE RATES USED FOR THE CONVERSION OF
BALANCES IN FOREIGN CURRENCY CURRENCY RATE AT
31.12.2000
AVERAGE
2000 RATE
RATE AT
31.12.1999
AVERAGE
1999 RATE
Bolivar - Venezuela 2.974 2.979 3.007
Boliviano - Bolivia 340.007 342.789 321.625 316.559
246.938 240.355 218.885 207.911
Cordoba oro - Nicaragua 167.754 170.554 156.586
Kroner - Denmark 259.623 259.769 260.240 260.408
Dollar - Caribbean 799.555 709.589 673.832
Dollar - Singapore 1,243.175 1,219.047 1,143.896 1,073.805
2158.794 2102.587 1.915.243 1.819.274
EURO - Europe 1.936.270 1.936.270 1.936.270
Fr.CFA - Comun.Fin.Africaine 2.951 2.951 2.952 2.952
Franc - Burundi 2.731 3.126 3.328
Congolese Franc – Dem. Rep. Of Congo 45.448 172.218 448.011 438.590
1.149 1.272 1.391 1.362
Franc - Rwanda 6.012 5.932 5.708
Franc - Switzerland 1,279.225 1,243.507
COUNTRY
3.051
Colon -El Salvador
155.106
778.848
Dollar - United States
1.936.270
3.048
Franc - Guinea CK
5.460
1,209.254 1,209.924
Djibouti Franc - Djibouti 12.147 11.830 10.777 10.236
Kwacha - Malawi 27.128 37.022 41.556 41.599
Kwanza - Angola 138.054 269.524 0.0003 0.001
Kuna - Croatia 255.425 254.158 253.056 256.679
Lempira - Honduras 142.630 141.405 131.216 127.612
Leu – Romania 0.084 0.098 0.106 0.120
42

CURRENCY
COUNTRY
RATE AT
31.12.2000
AVERAGE
2000 RATE
RATE AT
31.12.1999
AVERAGE
1999 RATE
Lira - Turkey 0.003 0.003 0.004 0.004
Metical - Mozambique 0.130 0.138 0.146 0.146
Peso - Chile 3.868 3.969 3.564 3.585
Peso - Colombia 1.015 1.036 1.017 1.048
Rand - South Africa 282.318 303.326 311.618 297.471
Rupia - Indonesia 0.229 0.252 0.269 0.236
43

Astaldi S.p.A. - Consolidated Financial Statements 31.12.2000
Attachment 1
Consolidation area % % Subsidiary companies Associated companies
5 1 R.I.C. - Railway International Construction S.p.A. 100.00% 30 Astaldi-Ferrocemento J.V. 50.00%5 2 A.S.T.A.C. S.r.l. 100.00% 31 Amsar Rwanda S.p.a.r.l. 50.00%5 3 EUROAST S.r.l. 100.00% 32 Satalgec Association Momentanée 35.00%5 4 Italstrade S.p.A. 100.00% 33 Columbus de Costrucciones de Honduras S.A. 25.00%5 5 Albapavstrade D.o.o. 100.00% 5 6 Astaldi International Limited 100.00% 5 7 I.T.S. S.p.A. 100.00% Other equity interests 5 8 Astaldi International Inc. - Liberia 100.00% 34 Comet J.V. 15.00%5 9 Seac S.p.a.r.l. 100.00% 35 Yellow River Contractors J.V. 14.00%5 10 Astaldi Burundi Association Momentanée 100.00% 5 11 Astaldi-Astaldi International J.V. Mozambique 100.00% 5 12 Astaldi Guinée Association en Participation 100.00% 5 13 Astaldi Malawi, Astaldi-Astaldi International J.V. 100.00% 5 14 Astaldi-Rwanda Association Momentanée 100.00% 5 15 Astaldi-Senegal Association en Participation. 100.00% 5 16 Ass. Mom. Astaldi -Astaldi International Ltd. Guinea 100.00% 5 17 Astaldi International Burundi Association Momentane 100.00% 5 18 Redo Association Momentanée 100.00% 5 19 Astaldi Thailand Joint Venture 100.00% 5 20 Astaldi de Venezuela C.A. 99.80% 5 21 Amsar Burundi S.p.a.r.l. 99.80% 5 22 Astaldi Construction Corporation - Florida 99.75% 5 23 Consorcio Astaldi-Columbus - Honduras 98.00% 5 24 Consorcio Astaldi-Columbus - Nicaragua 98.00% 5 25 Astur Construction and Trade A.S. 99.01% 5 26 Astaldi-Socofran Association Momentanée 60.00% 5 27 S.C. Italstrade-C.C.C.F. J.V. ROMIS S.r.l. 51.00% 5 28 Romstrade S.r.l. 51.00% 5 29 Astaldi Thailand Co. Ltd. 49.00%
NB: The companies marked 5 are aggregated with the integral method, the others with the proportional method
44

Attachment 2
Changes in the consolidation area 2000 Equity interests leaving the consolidation area Equity interests entering the consolidation area Equity interest Equity interest
1 Trafer Congo S.a.r.l. 98.85% 1 Astaldi Thailand Co. Ltd. 49.00%2 Groupement Astaldi Astaldi International Ltd. Djibouti 60.00% 2 Albapavstrade Doo 100.00%3 Astaldi Congo Association en Participation 96.80% 3 Astaldi International Limited 100.00% 4 I.T.S. S.p.A. 100.00%
5 Consorzio Astaldi - Columbus Nicaragua 98.00% 6 Astaldi-Socofran Association Momentanée 60.00%
45

Att
achm
ent 3
R
EC
ON
CIL
IAT
ION
BE
TW
EE
N T
HE
PA
RE
NT
CO
MPA
NY
FIN
AN
CIA
L S
TA
TE
ME
NT
S A
ND
TH
E
CO
NSO
LID
AT
ED
FIN
AN
CIA
L S
TA
TE
ME
NT
S
(in m
illio
n Li
re)
Cur
rent
yea
r
Prio
r yea
r S
tock
hold
ers'
Pro
fit/lo
ss
N
et
P
rofit
/loss
eq
uity
for t
he y
ear
eq
uity
for t
he y
ear
Stoc
khol
ders
' equ
ity a
nd p
rofit
/loss
for t
he y
ear a
s sta
ted
in th
e pa
rent
com
pany
's fin
anci
al st
atem
ents
158
,251
1
1,39
7
129
,480
13
,320
(n
et o
f the
con
vers
ion
rese
rve)
C
onve
rsio
n re
serv
e
49
,036
-
22,7
91
-
El
imin
atio
n of
the
carr
y va
lue
of th
e co
nsol
idat
ed
equi
ty in
tere
sts:
-
diff
eren
ce b
etw
een
carr
y va
lue
and
pro
rata
val
ue o
f the
stoc
khol
ders
' equ
ity
15,
748
-
28,
373
- -
pro
rata
pro
fit/lo
ss o
f the
com
pani
es in
vest
ed in
15
,779
15
,779
(26,
070)
(26,
070)
El
imin
atio
n of
the
effe
cts o
f tra
nsac
tions
bet
wee
n co
nsol
idat
ed c
ompa
nies
:
-
prof
its o
n re
late
d pa
rty d
ispo
sals
(1
,973
)
(1
,089
)
(
1,65
1)
-
- de
prec
iatio
n on
rela
ted
party
sale
s
(4
,740
)
(4
,740
)
767
767
-
prov
isio
n fo
r los
ses o
n co
nsol
idat
ed c
ompa
nies
29,
826
14,9
77
33,
316
33,3
16
- di
vide
nds f
rom
con
solid
ated
com
pani
es
(2
0,16
3)
(2
0,16
3)
- -
Le
asin
g bo
ok-k
eepi
ng u
sing
the
finan
cial
met
hod
6,
105
6,
105
- -
Stoc
khol
ders
' equ
ity a
nd p
rofit
/loss
for t
he y
ear p
erta
inin
g to
the
grou
p
247,
869
2
2,26
6
187
,006
21
,333
M
inor
ity in
tere
st st
ockh
olde
rs' e
quity
2
,350
(242
)
1
3,31
1
12
Stoc
khol
ders
' equ
ity a
nd p
rofit
/loss
for t
he y
ear a
s sta
ted
in th
e co
nsol
idat
ed fi
nanc
ial s
tate
men
ts
2
50,2
19
2
2,02
4
200
,317
21
,345
46

Att
achm
ent 4
VA
RIA
TIO
NS
IN T
HE
ITE
MS
OF
TH
E C
ON
SOL
IDA
TE
D S
TO
CK
HO
LD
ER
S' E
QU
ITY
(in
mill
ion
Lire
)
Sh
are
Sh
are
R
eval
uatio
n Le
gal
Res
erve
for
Con
vers
ion
Ext
raor
dina
ryR
eser
ve fo
r R
etai
ned
Prof
it (lo
ss)
Min
. int
eres
t To
tal
C
apita
l Pr
emiu
m
Res
erve
as p
erR
eser
ve
trea
sury
stoc
k re
serv
e
rese
rve
spec
ial
Ear
ning
sfo
r the
yea
r st
ockh
olde
rs'
stoc
khol
ders
'
re
serv
e
Law
72/
83
owne
d (lo
ss)
lia
bilit
ies
equi
ty
equi
ty
Bal
ance
at 3
1 D
ecem
ber
1999
10
0,00
0
--
--
- 30
,
--
--
- 26
,
-20
8,34
570
022
,791
5,56
91,
546
26,7
0221
,333
13,3
1120
0,31
7
Tran
sfer
of a
ny p
rofit
/loss
-
--
693
--
5,22
2-
2,79
1(8
,706
)-
-
Paym
ent o
f div
iden
ds
- -
--
--
--
-(1
2,62
7)-
(12,
627)
Issu
e of
new
shar
es
13,0
44
16,9
57
--
--
001
Con
vers
ion
chan
ges
- -
--
-26
,245
24
5
Oth
er c
hang
es-
--
--
--
-(5
,022
)-
(10,
718)
(15,
740)
Pr
ofit
(loss
) for
the
year
-
- -
--
- -
--
22,2
66(2
43)
22,0
23
Bal
ance
at 3
1 D
ecem
ber
2000
11
3,04
4
16
,957
209,
038
700
49,0
3610
,791
1,54
624
,471
22,2
662,
350
250,
219
47

Attachment 5
Non-consolidated companies A) Share Capital
B) Stockhold-ers'
equity
C) Profit (loss)for the year
D) % ownership
E) Book value
F) Share of net equity
G) Share of provision for
risks
E-F-G
A) Subsidiary companies
Astaldi-Caldart - AS.CAL. S.C.r.l. in liquidation - Via Giovanni Pacini, 12 - Palermo - Italy 90,000,000 63,853,018 (2,613,639) 60.000% 38,311,811 38,311,811 -
Bussentina S.C.r.l. - Via G.V. Bona, 65 - Rome - Italy 50,000,000 50,000,000 - 78.800% 549,109,500 39,400,000 509,709,500
CO.ME.NA. S.C.r.l. - Via Cappella Vecchia, 8 - Naples - Italy 40,000,000 40,000,000 - 70.432% 28,172,000 28,172,000 -
Cobas Uno S.C.r.l. in liquidazione - Via G.V. Bona, 65 - Rome - Italy 20,000,000 10,926,488 (5,978,481) 95.250% 10,407,480 10,407,480 -
Colli Albani S.C.r.l. - Via G.V. Bona, 65 - Rome - Italy 50,000,000 50,000,000 - 60.000% 30,000,000 30,000,000 -
Columbus Latinamericana de Construcciones S.A. 2,193,328,000 2,193,328,000 - 100.000% 2,209,090,000 2,193,328,000 15,762,000
Consorcio Astaldi Centroxa - Nicaragua 2,011,890 2,011,890 - 99.500% 327,316,346 2,001,831 325,314,515
Consorcio Astaldi-Columbus - San Salvador - El Salvador 19,446,967 19,446,966 (1) 70.000% 13,612,830 13,612,876 (46)
Consorzio A.R.Z. - Astaldi-R.I.C.- ZAIRE in liquidation - Via G.V. Bona, 65 - Rome - Italy 50,000,000 44,076,210 (5,923,790) 100.000% 49,940,762 44,076,210 5,864,552
Consorzio Astaldi-C.M.B. Due in liquidation - Via G.V. Bona, 65 - Rome - Italy 20,000,000 9,379,176 6,765,814 99.000% 9,379,176 9,285,384 93,792
Consorzio Astaldi-C.M.B. in liquidation - Via Po, 13/15 - Rome - Italy 20,000,000 35,657,761 (5,007,417) 99.000% 19,999,000 35,301,183 (15,302,183)
Consorzio Ferrofir - Via Ombrone, 2/G - Rome - Italy 60,000,000 646,832,896 (34,048,602) 66.667% 40,000,000 431,221,926 (391,221,926)
Consorzio Olbia Mare in liquidazione - Via Agrigento, 5 - Rome - Italy 30,000,000 (1,397,231,405) (1,724,281) 72.500% - (1,012,992,769) 1,012,992,769 -
Cospe S.C.r.l. - Via G.V. Bona, 65 - Rome - Italy 20,000,000 20,000,000 - 55.000% 11,000,000 11,000,000 -
Dalfer S.C.r.l. in liquidation - Via G.V. Bona, 65 - Rome - Italy 40,000,000 21,222,846 (3,549,995) 91.300% 19,376,458 19,376,458 -
Diga di Arcichiaro S.C.r.l. - Via G.V. Bona, 65 - Rome - Italy 70,000,000 70,000,000 - 100.000% 70,000,000 70,000,000 -
DIP.A. S.C.r.l. - Via G.V. Bona, 65 - Rome - Italy 20,000,000 20,000,000 - 100.000% 20,000,000 20,000,000 -
DP 2M S.C.r.l. in liquidation - Via G.V. Bona, 65 - Rome - Italy 20,000,000 (47,007,116) (28,118,167) 72.000% 14,400,000 (33,845,124) 48,245,124
Eco Po Quattro S.C.r.l. - Via G.V. Bona, 65 - Rome - Italy 50,000,000 50,000,000 - 80.000% 40,000,000 40,000,000 -
Fiorbis S.C.r.l. in liquidation - Viale Sarca, 336 - Milan - Italy 90,000,000 56,000,000 (34,000,000) 99.980% 51,565,383 55,988,800 (4,423,417)
Forum S.C.r.l. - Via G.V. Bona, 65 - Rome - Italy 100,000,000 100,000,000 - 59.990% 59,990,000 59,990,000 -
Geser Muh.Ins.Gen.Hiz.Ltd - Turkey - - - 99.000% 15,200,000 - 15,200,000
I.F.C. Due S.C.r.l. - Via del Ghisallo, 20 - Milan - Italy 90,000,000 90,000,000 - 99.333% 89,399,700 89,399,700 -
ITS CCCF J.V Bucuresti - Romania 116,600 116,600
Linea A S.C.r.l. - Via G.V. Bona, 65 - Rome - Italy 50,000,000 50,000,000 - 100.000% 50,000,000 50,000,000 -
Mormanno S.C.r.l. in liquidation - Via G.V. Bona, 65 - Rome - Italy 20,000,000 (99,324,260) (20,692,084) 74.990% - (99,314,328) 99,314,328 -
Montedil-Astaldi S.p.A. (MONTAST) in liquidation - Via G.V. Bona, 65 - Rome - Italy 800,000,000 5,235,824,725 57,219,370 45.000% 1,260,000,000 2,356,121,126 (1,096,121,126)
Palese Park S.r.l. - Via G.V. Bona, 65 - Rome - Italy 2,000,000,000 2,000,000,000 - 90.000% 1,800,000,000 1,800,000,000 -
Place Moulin S.p.A. - Via del Ghisallo, 20 - Milan - Italy 408,000,000 1,345,000,000 748,000,000 100.000% 408,000,000 1,345,000,000 (937,000,000)
Pont Ventoux S.C.r.l. - Via G.V. Bona, 65 - Rome - Italy 100,000,000 100,000,000 - 56.250% 45,000,000 56,250,000 (11,250,000)
Porrettana S.C.r.l. - in liquidation - Via G.V. Bona, 65 - Rome - Italy 50,000,000 25,469,664 (24,530,336) 99.890% 49,945,000 25,441,647 24,503,353
Portovesme S.C.r.l. - Via G.V. Bona, 65 - Rome -Italy 50,000,000 50,000,000 - 80.000% 40,000,000 40,000,000 -
Quattro Venti S.C.r.l. - Via G.V. Bona, 65 - Rome - Italy 100,000,000 100,000,000 - 60.000% 60,000,000 60,000,000 -
Romairport S.C.r.l. - Via del Ghisallo, 20 - Milan - Italy 20,000,000 20,000,000 - 63.890% 12,778,000 12,778,000 -
S. Filippo S.C.r.l. - Via G.V. Bona, 65 - Rome - Italy 20,000,000 20,000,000 - 80.000% 16,000,000 16,000,000 -
S. Leonardo S.C.r.l. - Via G.V. Bona, 65 - Rome - Italy 20,000,000 20,000,000 - 51.000% 10,200,000 10,200,000 -
Silva S.r.l. - Via Monte Santo, 1 - Rome - Italy 30,000,000 (12,798,002) - 99.000% - (12,670,022) 12,670,022 -
Susa Dora Quattro S.C.r.l. - Via G.V. Bona, 65 - Rome - Italy 100,000,000 100,000,000 - 90.000% 90,000,000 90,000,000 -
Sugct.Calarasi 111,436,920 111,436,920
TE.CRO. S.C.r.l. - Via G.V. Bona, 65 - Rome - Italy 20,000,000 20,000,000 - 100.000% 20,000,000 20,000,000 -
Todaro S.r.l. in liquidation - Palermo - Italy 458,000,000 375,115,572 251,196,062 88.285% 458,000,000 331,170,783 126,829,217
Tri.Ace. S.C.r.l. - Via del Ghisallo, 20 - Milan - Italy 90,000,000 90,000,000 - 80.000% 72,000,000 72,000,000 -
Varzo II S.C.r.l. - Via del Ghisallo, 20 - Milan - Italy 100,000,000 100,000,000 - 51.000% 51,000,000 51,000,000 -
Viadotti di Courmayeur S.C.r.l. - Via G.V. Bona, 65 - Rome - Italy 20,000,000 20,000,000 - 66.670% 7,200,000 13,334,000 (6,134,000)
Viadotto Fadalto S.C.r.l. in liquidation - Viale Sarca, 336 - Milan - Italy 99,000,000 75,000,000 (24,000,000) 80.000% 54,428,770 60,000,000 (5,571,230)
Total subsidiary companies 8,332,375,736 8,491,346,972 1,124,977,119 (1,283,948,355)
B) Associated companies
A.F.M. Astaldi-Ferrocemento-Mambrini S.C.r.l. - in liquidation - Via G.V. Bona, 65 - Rome - Italy 90,000,000 87,684,459 (2,315,541) 35.000% 30,689,561 30,689,561 -
Adduttore Ponte Barca S.C.r.l. - Via di Pietralata, 110 - Rome - Italy 90,000,000 90,000,000 - 24.330% 21,897,000 21,897,000 -
Almo S.C.r.l. - Via Privata D. Giustino, 3/a - Naples - Italy 90,000,000 90,000,000 - 35.000% 31,500,000 31,500,000 -
48


Attachment 6
CASH FLOW STATEMENT
OPERATING ACTIVITIES 2000 1999
Profit for the year 22,266 21,333
Depreciation/Amortization
of tangible fixed assets 37,035 32,474
of intangible fixed assets 31,044 42,444
Allocations
to provisions for contingencies and charges 23,058 57,436
to provisions for employee severance indemnity 8,021 8,983
Losses on disposals of fixed assets 4,572 1,799
Gains on disposals of fixed assets (11,351) (27,677)
Sub-total 114,645 136,792
Utilization of the provision for contingencies and charges (77,182) (26,982)
Employee severance indemnity paid (10,636) (10,840)
Decrease (increase) of accounts receivable 67,288 (84,370)
Decrease (increase) in inventory (60,600) (42,935)
Decrease (increase) in prepayments and accrued income (463) (1,965)
Decrease (increase) in amounts owed to suppliers 26,170 (12,360)
(Decrease) increase in other non-financial amounts payable (159,157) (46,085)
(Decrease) increase in accruals and deferred income 1,368 (2,287)
51

Net effect of the change in the consolidation area 9,871 (3,892)
Net cash outflow from operating activities a) (88,696) (94,924)
INVESTMENT ACTIVITIES
Purchase of tangible fixed assets (28,132) (34,061)
Increase in intangible fixed assets (33,559) (27,006)
Profits from the sale of tangible fixed assets 28,784 127,904
Decrease in intangible fixed assets -- --
Net change in investments 2,947 (16,459)
(Purchase) disposal of other investments (2,139) --
Effect of leasing book-keeping by the financial method (51,942) --
Net effect of the change in the consolidation area (16,341) (3,892)
Net cash inflow/(outflow) from investment activities b) (100,382) 46,486
FINANCING ACTIVITIES
Increase (decrease) in short-term debts 28,342 5,901
Net balance of loans obtained and repaid during the year 135,798 65,186
Payment of dividends (12,627) (1,184)
52

Increase (decrease) in loans 6,365 20,926
Convertible debenture loan 70,001 --
Issues of new shares 30,001 --
Net cash inflow from financing activities c) 257,880 90,829
Effect of the change in the consolidation area
Change in minority interest stockholders' equity (10,961) (1,819)
Other changes (5,022) 2,920
Change in the conversion reserve 26,245 17,046
Changes in the conversion and consolidation reserves d) 10,262 18,147
Increase/(decrease) in cash a) + b) + c) + d) 79,064 60,538
Net cash at 01.01.2000 221,173 156,743
Net cash at 31.12.2000 300,237 221,173
53