association of bay area governments
TRANSCRIPT

ASSOCIATION OF BAY AREA GOVERNMENTS
Representing City and County Governments of the San Francisco Bay Area
ABAG POWER Executive Committee Meeting No. 2017-04
June 21, 2017 (11:00 a.m. - 1:00 p.m.)
Association of Bay Area Governments
375 Beale Street, Conference Room 7102 – Tamalpais (7th Floor)
San Francisco, CA 94105
AGENDA*
Mailing Address: Associat ion of Bay Area Governments 375 Beale Street, Suite 700 San Francisco, California 94105
(415 ) 820 -7956 Fax: (415 ) 660 -3556 [email protected]
1. Welcome and Introductions
2. Public Comments
3. Approve Summary Minutes of Executive Committee Meeting Action:
ATTACHMENT 3A – SUMMARY MINUTES OF APRIL 19, 2017 ATTACHMENT 3B – SUMMARY MINUTES OF MAY 31, 2017
4. ABAG/MTC Staff Consolidation Information: Staff will provide an update on the ABAG-MTC staff consolidation, the associated Contract for Services, and potential impacts to ABAG POWER.
5. Report on Natural Gas Program
Information: Staff will review recent gas operations, including gas purchases; the program’s long-term hedge position; gas imbalances; and other miscellaneous program items.
ATTACHMENT 5A – MONTHLY SUMMARY OF OPERATIONS FY 2016-17 ATTACHMENT 5B – GAS HEDGE CHART ATTACHMENT 5C – MARKET PRICE CHART
6. Natural Gas Program Goals and Purchasing Policy & Strategy Information/Action: Staff will review the current purchasing policy, goals, and strategy for the program.
ATTACHMENT 6A – GAS PROGRAM GOALS AND PURCHASING STRATEGY
7. FY 2017-18 ABAG POWER Operating Budget Action: Staff will present the FY2017-18 budget for approval.
ATTACHMENT 7A1 – FY2017-18 OPERATING BUDGET ATTACHMENT 7A2 – FY2017-18 OPERATING BUDGET – LEVELIZED CHARGES
8. Energy Programs Update Information: Staff will provide members with an update of various ABAG energy programs and initiatives.
9. Other Business
10. Adjournment
*The Committee may take action on any item on this agenda

ASSOCIATION OF BAY AREA GOVERNMENTS
Representing City and County Governments of the San Francisco Ba y Area
Mailing Address: Associat ion of Bay Area Governments 375 Beale Street, Suite 700 San Francisco, California 94105
(415 ) 820 -7956 Fax: (415 ) 660 -3556 [email protected]
SUMMARY MINUTES ABAG POWER Executive Committee
Regular Meeting 2017-02
April 19, 2017
Conference Room 7102 - Tamalpais
375 Beale Street, San Francisco, CA 94105
WELCOME AND INTRODUCTIONS
Committee member Chris Schroeder opened the meeting with introductions at 11:13 AM.
Present Committee Representatives Jurisdiction/Agency
Angela Walton City of Richmond
Chris Schroeder City of Milpitas
Dave Brees City of Los Altos
Tonya Gilmore (Vice Chair) City of Orinda
Absent Committee Representatives
Julie Bueren (Chair) County of Contra Costa
Melissa Morton Vallejo Sanitation & Flood Control District
Mintze Cheng City of Union City
Guests Present
Misty Mersich City of Cupertino
Staff Present
Jerry Lahr ABAG POWER
Ryan Jacoby ABAG POWER
Courtney Ruby ABAG
Ken Moy ABAG
PUBLIC COMMENTS & ANNOUNCEMENTS
There were no public comments.
APPROVAL OF SUMMARY MINUTES OF DECEMBER 14, 2016.
Motion was made by Schroeder/S/Walton/C/4:0:0 to approve the Summary Minutes of the February
15, 2017 Executive Committee meeting.
The aye votes were: Brees, Gilmore, Schroeder, Walton.
The nay votes were: None.

ASSOCIATION OF BAY AREA GOVERNMENTS
Representing City and County Governments of the San Francisco Ba y Area
Mailing Address: Associat ion of Bay Area Governments 375 Beale Street, Suite 700 San Francisco, California 94105
(415 ) 820 -7956 Fax: (415 ) 660 -3556 [email protected]
Abstentions were: None.
Absentees were: Bueren, Morton, Cheng.
ABAG/MTC STAFF CONSOLIDATION
Memo from ABAG POWER Chair
Lahr provided a memorandum dated March 20 commenting on the March 15 draft of the Contract
for Services (CS) between ABAG and the Metropolitan Transportation Commission.
The memorandum expressed several comments and concerns regarding the current draft of the CS,
including 1) noting its inability to legally bind ABAG POWER to the provisions of the agreement
without ABAG POWER’s explicit agreement; 2) required timing and written notification of
changes in employee status or termination; 3) treasury functions; and 4) reiterating the program’s
cost-sensitive nature, given the currently unknown financial impacts of the consolidation.
Response Memo from ABAG Executive Management Team
On behalf of ABAG’s Executive Management Team, Moy presented a response to the above
referenced memorandum which proposed ABAG enter a memorandum of understanding (MOU)
with POWER to explicitly address the concerns of ABAG POWER. Moy stated his intent to draft
the MOU in the coming weeks, for presentation to, and review by the ABAG POWER Executive
Committee.
REPORT ON NATURAL GAS PROGRAM
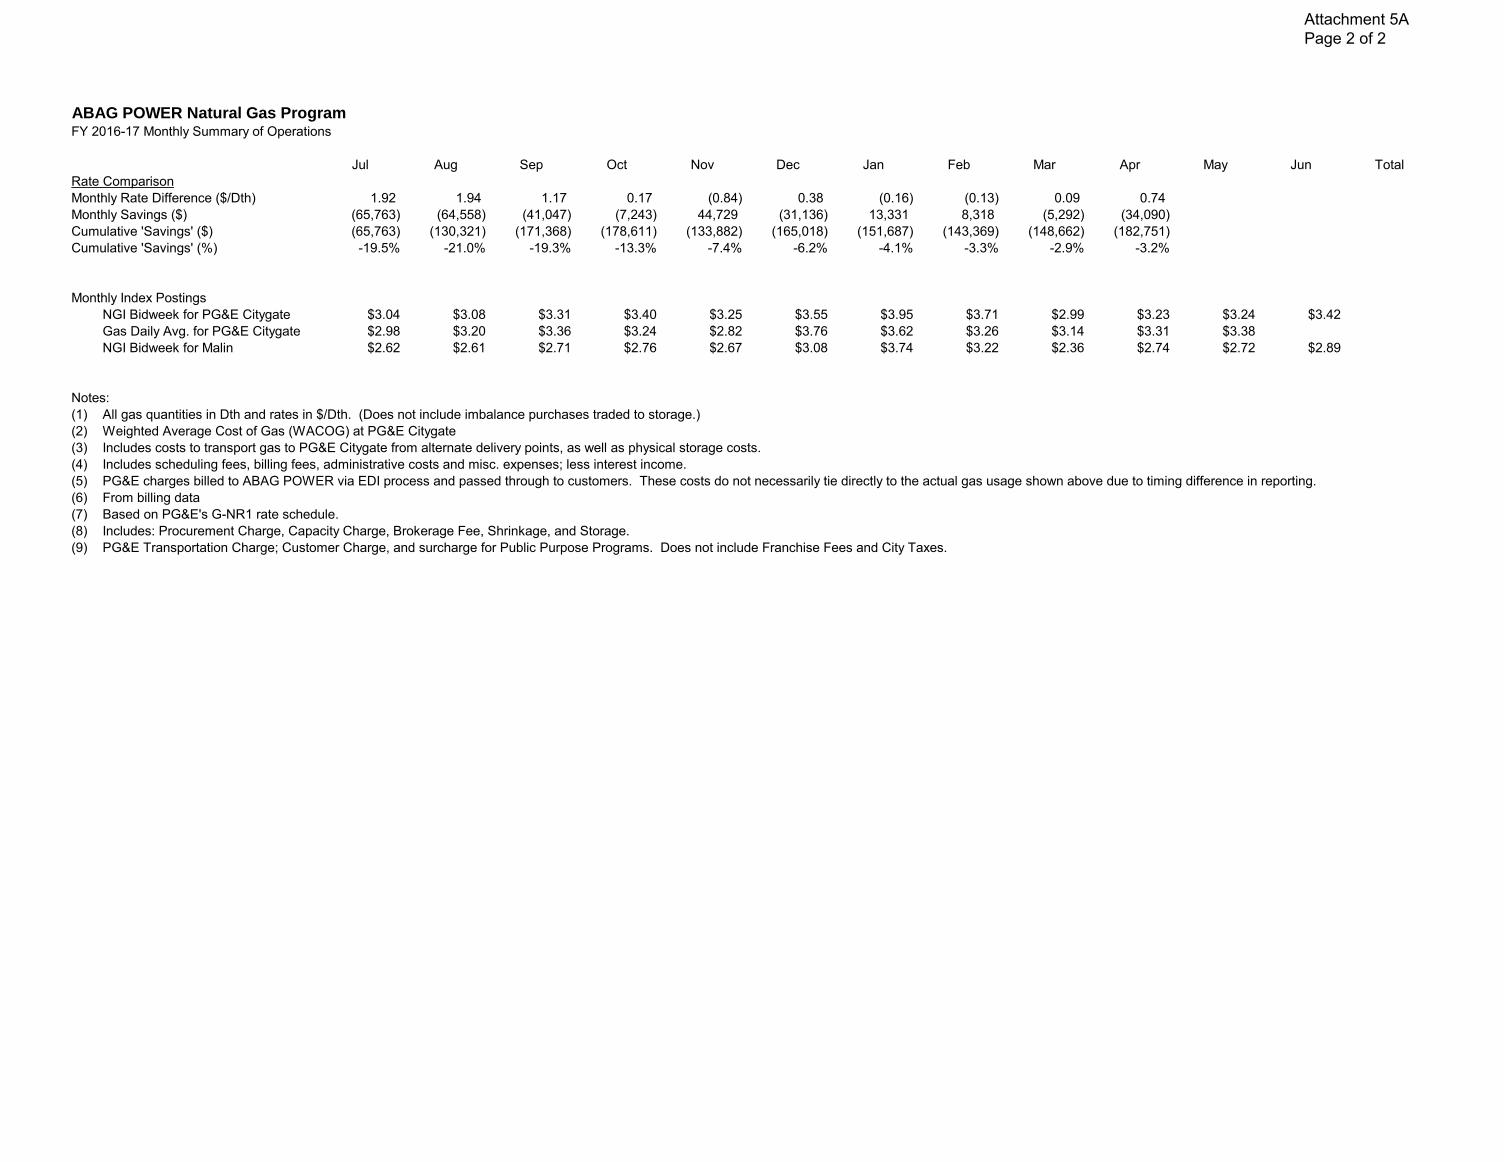
Monthly Summary of Operations FY 2016-17
Lahr provided members with the Monthly Summary of Operations reports for FY 2016-17;
members were updated on the percentage savings comparisons with PG&E. Lahr noted that
financial statements for February, 2017 indicated a cumulative savings figure of -3.3%.
Gas Hedge Chart
Lahr provided information on the various current long-term gas purchases (contracts which are
greater than one month in length). The group discussed potential pricing opportunities afforded by
current futures indices.
Market Price Chart
Lahr provided information on gas prices.
Preliminary 2017-18 Operating Budget
Lahr and Ruby presented a preliminary FY 2017-18 Operating Budget, indicating decreases in
program expenses and the program’s total core rate. Staff noted that although ABAG Fees are
generally expected to decrease as compared to FY 2016-17, the staff rate impacts of the MTC-
ABAG staff consolidation remain under discussion.

ASSOCIATION OF BAY AREA GOVERNMENTS
Representing City and County Governments of the San Francisco Ba y Area
Mailing Address: Associat ion of Bay Area Governments 375 Beale Street, Suite 700 San Francisco, California 94105
(415 ) 820 -7956 Fax: (415 ) 660 -3556 [email protected]
NATURAL GAS SCHEDULING AGENT RFP
Staff presented the results of the Request for Proposals (RFP) for Gas Scheduling Services and a
recommendation to negotiate a contract for scheduling services with DMJ Gas Marketing
Consultants, LLC for the period July 1, 2017 to June 30, 2019, with an option to extend the contract
for up to three years, exercisable at ABAG POWER’s discretion.
Motion was made by Brees/S/Schroeder/C/4:0:0 to approve the recommendation determined by
staff and the Proposal Review Committee to enter into negotiations with DMJ to enter a contract for
gas scheduling services in accordance with the terms of the RFP.
The aye votes were: Brees, Gilmore, Schroeder, Walton.
The nay votes were: None.
Abstentions were: None.
Absentees were: Bueren, Cheng, Morton.
CORE TRANSPORT AGENT (CTA) REGULATIONS
Lahr reminded the committee members of SB 656, which became effective on January 1, 2014 and
established a regulatory framework for CTAs by implementing various consumer protections
measures, resulting in the addition of Sections 980 to 989.5 to the state’s Public Utilities Code
(PUC). As a public agency, ABAG POWER is exempt from many, but not all of the statutory
requirements associated with this proceeding.
Lahr noted that a ‘Scoping Memo’ had recently been released to address a number of other
consumer protections safeguards imposed on CTAs by SB 656. He called attention to PUC § 985,
which states that certain minimum standards must be adopted by “the governing body of a public
agency offering gas services to core gas customers within its jurisdiction.” He recommended staff
review current program policies and draft a resolution adopting rules in compliance with the
minimum standards in PUC § 985.
ENERGY PROGRAMS UPDATE
Lahr summarized the recent accomplishments and goals of the Bay Area Regional Energy Network
(BayREN), BayREN Integrated Commercial Retrofits (BRICR), and the Berkeley Energy
Assurance Transformation (BEAT). Local Community Choice Aggregation efforts were also
discussed.
ADJOURNMENT
Vice Chair Tonya Gilmore adjourned the meeting at 12:42 PM.
_____________________________ *Example of a motion – [Member No. 1/S/Member No. 2/roll call vote/C/8:0:0] means Member No.1 motions, seconded by
Member No.2, after roll call vote, motion carries, 8 = “yes” votes, 0 = “no” votes and 0 = abstention.

ASSOCIATION OF BAY AREA GOVERNMENTS
Representing City and County Governments of the San Francisco Bay Area
Mailing Address: Associat ion of Bay Area Governments 375 Beale Street, Suite 700 San Francisco, California 94105
(415 ) 820 -7956 Fax: (415 ) 660 -3556 [email protected]
SUMMARY MINUTES ABAG POWER Executive Committee
Special Meeting 2017-03
May 31, 2017
Teleconference Meeting
375 Beale Street, San Francisco, CA 94105
WELCOME AND INTRODUCTIONS
Chair Julie Bueren opened the meeting with introductions at 2:05 P.M.
Present Committee Representatives Jurisdiction/Agency
Angela Walton City of Richmond
Chris Schroeder City of Milpitas
Dave Brees City of Los Altos
Julie Bueren (Chair) County of Contra Costa
Melissa Morton Vallejo Flood & Wastewater District
Mintze Cheng City of Union City
Tonya Gilmore (Vice Chair) City of Orinda
Staff Present
Jerry Lahr ABAG POWER
Ryan Jacoby ABAG POWER
Courtney Ruby ABAG
Ken Moy ABAG
PUBLIC COMMENTS & ANNOUNCEMENTS
There were no public comments.
ABAG/MTC STAFF CONSOLIDATION
ABAG-ABAG POWER Memorandum of Understanding Lahr and Moy informed members of the approval of the ABAG-MTC Contract for Services (CS) by
the agencies’ respective Boards, noting that none of the terms of the CS are binding on POWER but
that the inclusion of POWER in ABAG’s Budget & Work Plan obligates MTC to provide services
to POWER and obligates ABAG to pay for such services.
Moy presented the Committee with a Memorandum of Understanding (MOU) seeking to address
the concerns raised by the ABAG POWER memo dated March 20 regarding the draft Contract for
Services. The MOU specifically addressed, among other matters, requiring ABAG to consult with
POWER on various matters, including the process, timing, and criteria for selecting successors to
current POWER staff; retention of specialized legal services; and, acknowledgement of POWER’s
right to remove ABAG as the administering member for POWER. The MOU will also be presented

ASSOCIATION OF BAY AREA GOVERNMENTS
Representing City and County Governments of the San Francisco Bay Area
Mailing Address: Associat ion of Bay Area Governments 375 Beale Street, Suite 700 San Francisco, California 94105
(415 ) 820 -7956 Fax: (415 ) 660 -3556 [email protected]
to the ABAG Executive Board for approval. Moy requested committee approval of the MOU as to
form which allows minor non-substantive changes to the MOU, including the insertion of standard
‘boilerplate’ provisions.
Motion was made by Schroeder/S/Brees/C/7:0:0 to approve as to form the Memorandum of
Understanding between ABAG and ABAG POWER. Parties agreed that should the document
undergo sustentative changes during finalization, the Committee would be notified and re-approval
would be required before the agreement is considered effective.
The aye votes were: Brees, Bueren, Cheng, Gilmore, Morton, Schroeder, Walton.
The nay votes were: None.
Abstentions were: None.
Absentees were: None.
FY 2017-18 ABAG POWER OPERATING BUDGET – ABAG FEES
Preliminary 2017-18 Operating Budget
Lahr and Ruby presented a preliminary FY 2017-18 Operating Budget, indicating decreases in
program expenses and the program’s total core rate. Staff noted that although ABAG Fees are
generally expected to decrease as compared to FY 2016-17, the detailed impacts of staff overhead
remains under discussion.
ABAG Budget & Work Program [Excerpt]
Lahr provided members ABAG’s Proposed FY 2017-18 Budget & Work Program, noting on page
41 the inclusion of ABAG POWER’s “Purchasing Pool Fees” line item included in the Service
Programs budget.
ADJOURNMENT
Chair Julie Bueren adjourned the meeting at 2:55 PM.
_____________________________ *Example of a motion – [Member No. 1/S/Member No. 2/roll call vote/C/8:0:0] means Member No.1 motions, seconded by
Member No.2, after roll call vote, motion carries, 8 = “yes” votes, 0 = “no” votes and 0 = abstention.

ABAG POWER Natural Gas ProgramFY 2016-17 Monthly Summary of Operations
Jul Aug Sep Oct Nov Dec Jan Feb Mar Apr May Jun Total
days/mo. 31 31 30 31 30 31 31 28 31 30 31 30
Gas Purchases(1)
Purchase 1 Qty 15,446 15,339 14,930 15,500 15,000 15,500 15,500 14,000 15,500 15,000 15,500 15,000 182,215
Price $2.29 $2.29 $2.29 $2.71 $2.71 $2.71 $3.06 $3.06 $3.06 $3.06 $3.06 $3.06
Purchase 2 Qty 20,275 19,840 19,593 20,336 25,440 33,700 26,288 23,744 15,500 15,000 15,500 235,216
Price $2.63 $2.62 $2.72 $2.77 $2.28 $3.79 $3.31 $2.66 $2.37 $2.75 $2.73
Purchase 3 Qty 31,000 31,000 13,250 15,650 10,300 26,288 40,200 25,300 33,400 38,000 31,350 295,738
Price $3.00 $3.22 $3.37 $3.25 $2.88 $3.51 $3.64 $3.26 $3.15 $3.33 $3.40
Purchase 4 Qty 0
Price
Purchase 5 Qty 0
Price
Total Quantity Purchased 66,721 66,179 47,773 51,486 50,740 75,488 81,988 63,044 64,400 68,000 62,350 15,000 713,169
Total Purchase Cost $181,805 $186,797 $132,141 $149,250 $128,369 $262,101 $280,928 $188,536 $189,272 $213,859 $196,304 $45,900 $2,155,264
Backbone Shrinkage (Dths) (484) (499) (433) (437) (510) (527) (527) (476) (372) (360)
WACOG(2)
$2.74 $2.84 $2.79 $2.92 $2.56 $3.50 $3.45 $3.01 $2.96 $3.16 $3.15 $3.06 $3.02
Storage/Inventory
Total Injections/ (Withdrawals) 12,615 14,530 4,000 3,494 (8,450) (15,800) (15,500) (14,000) (6,105) 6,667 (18,549)
Total Inventory Quantity (Dths) 37,831 52,361 56,361 59,855 51,405 35,605 20,105 6,105 0 6,667
Total Inventory ($) $130,594 $171,471 $182,847 $192,599 $165,407 $114,562 $64,683 $19,631 $0 $21,081
Avg. Inventory Rate ($/Dth) $3.45 $3.27 $3.24 $3.22 $3.22 $3.22 $3.22 $3.22 #DIV/0! $3.16
Gas Program Monthly Expenses (from Financial Reports)
Cost of Energy Used(3)
167,169$ 172,683$ 148,381$ 166,766$ 190,189$ 343,325$ 365,214$ 269,288$ 234,243$ 219,261$ 2,276,520$
Program Operating Expenses(4)
20,848 34,208 29,210 32,472 22,478 21,671 23,203 24,069 25,991 28,970 263,120
Subtotal 188,017$ 206,891$ 177,591$ 199,239$ 212,667$ 364,996$ 388,417$ 293,357$ 260,235$ 248,231$ -$ -$ 2,539,640$
Rate ($/Dth) $4.50 $4.88 $3.97 $3.87 $3.58 $4.16 $4.21 $4.13 $3.95 $4.81 $4.17
PG&E Pass-through costs(5)
249,039 184,806 169,540 297,817 235,930 537,322 651,325 429,681 477,099 343,408 3,575,968
Total ABAG POWER Cost 437,056$ 391,696$ 347,131$ 497,055$ 448,597$ 902,318$ 1,039,742$ 723,038$ 737,334$ 591,640$ 6,115,607$
Actual (metered) Gas Usage
Core(6)
34,337 33,252 35,006 42,963 53,182 81,138 85,508 65,416 59,200 45,758 535,762
Non Core 7,471 9,159 9,760 8,561 6,160 6,514 6,779 5,579 6,748 5,887 72,617
Total Program Usage 41,808 42,410 44,766 51,524 59,342 87,652 92,287 70,996 65,947 51,645 0 0 608,379
ABAG POWER Total Core Rate 11.75$ 10.44$ 8.81$ 10.80$ 8.02$ 10.79$ 11.83$ 10.70$ 12.01$ 12.31$
PG&E Rate(7)
Procurement Charge(8)
2.58 2.94 2.79 3.70 4.42 3.78 4.36 4.26 3.86 4.06 3.82 3.75
Transportation/Other Charge(9)
7.25 5.56 4.84 6.93 4.44 6.62 7.62 6.57 8.06 7.50
Total PG&E Rate 9.83$ 8.49$ 7.64$ 10.63$ 8.86$ 10.40$ 11.98$ 10.83$ 11.92$ 11.57$ 3.82$ 3.75$
Attachment 5A
Page 1 of 2
ABAG POWER Natural Gas ProgramFY 2016-17 Monthly Summary of Operations
Jul Aug Sep Oct Nov Dec Jan Feb Mar Apr May Jun Total
Rate Comparison
Monthly Rate Difference ($/Dth) 1.92 1.94 1.17 0.17 (0.84) 0.38 (0.16) (0.13) 0.09 0.74
Monthly Savings ($) (65,763) (64,558) (41,047) (7,243) 44,729 (31,136) 13,331 8,318 (5,292) (34,090)
Cumulative 'Savings' ($) (65,763) (130,321) (171,368) (178,611) (133,882) (165,018) (151,687) (143,369) (148,662) (182,751)
Cumulative 'Savings' (%) -19.5% -21.0% -19.3% -13.3% -7.4% -6.2% -4.1% -3.3% -2.9% -3.2%
Monthly Index Postings
NGI Bidweek for PG&E Citygate $3.04 $3.08 $3.31 $3.40 $3.25 $3.55 $3.95 $3.71 $2.99 $3.23 $3.24 $3.42
Gas Daily Avg. for PG&E Citygate $2.98 $3.20 $3.36 $3.24 $2.82 $3.76 $3.62 $3.26 $3.14 $3.31 $3.38
NGI Bidweek for Malin $2.62 $2.61 $2.71 $2.76 $2.67 $3.08 $3.74 $3.22 $2.36 $2.74 $2.72 $2.89
Notes:
(1) All gas quantities in Dth and rates in $/Dth. (Does not include imbalance purchases traded to storage.)
(2) Weighted Average Cost of Gas (WACOG) at PG&E Citygate
(3) Includes costs to transport gas to PG&E Citygate from alternate delivery points, as well as physical storage costs.
(4) Includes scheduling fees, billing fees, administrative costs and misc. expenses; less interest income.
(5) PG&E charges billed to ABAG POWER via EDI process and passed through to customers. These costs do not necessarily tie directly to the actual gas usage shown above due to timing difference in reporting.
(6) From billing data
(7) Based on PG&E's G-NR1 rate schedule.
(8) Includes: Procurement Charge, Capacity Charge, Brokerage Fee, Shrinkage, and Storage.
(9) PG&E Transportation Charge; Customer Charge, and surcharge for Public Purpose Programs. Does not include Franchise Fees and City Taxes.
Attachment 5A
Page 2 of 2

Gas Hedge Chart
0
10,000
20,000
30,000
40,000
50,000
60,000
70,000
80,000
90,000
DT
h/M
o
ABAG POWER Long Term Gas Purchases (Fixed-Price Contracts > 1 month in length)
Unhedged/Swing
Pkg 2 - Malin: $2.945
Pkg 1 - Malin: $3.06
Attachment 5B
Page 1 of 1

Market Price Chart
0
1
2
3
4
5
6
7
8
$/D
th
5-Yr Historical/Future Market Price Indices @ PG&E Citygate
"Gas Daily"-Daily NGI-Monthly Budget (NYMEX Futures 6/5/13)
Budget (NYMEX Futures 6/10/14) Budget (NYMEX Futures 6/1/15) Budget (NYMEX Futures 6/7/16)
Budget (NYMEX Futures 6/12/17)
2/6/14: $23.16/Dth
Attachment 5C
Page 1 of 1

ASSOCIATION OF BAY AREA GOVERNMENTS
Representing City and County Governments of the San Francisco Bay Area
Mailing Address: Association of Bay Area Governments 375 Beale Street, Suite 700 San Francisco, California 94105
(415) 820 -7956 Fax: (415) 660 -3556 [email protected]
DATE: June 14, 2017
TO: ABAG POWER Executive Committee
FROM: Gerald L. Lahr, Manager, ABAG POWER
RE: Natural Gas Program Purchasing Policy, Goals and Strategy
Below represents the current purchasing policy, goals and strategy for the ABAG POWER natural gas
aggregation program.
Gas Purchasing Policy
The ABAG POWER Board and Executive Committee set policy on POWER’s natural gas purchasing strategy.
ABAG staff executes this strategy, including identifying suitable gas suppliers and signing master gas purchase
agreements. These master purchase agreements enable the parties to engage in transactions for the purchase
and sale of natural gas, but they do not by themselves authorize a transaction. These master purchase
agreements are reviewed by ABAG’s legal department and signed by the ABAG POWER President (i.e.,
ABAG Executive Director).
The ABAG POWER Program Manager has been delegated the authority to enter into actual gas purchase and
sales transactions. The delivery terms for these transactions can range from one day to three years, and over the
past 15 years prices have ranged from below $2.00/Dth to over $12.00/Dth. The pricing of the transactions
may be fixed-price or variable-priced (index-based). Individual gas transactions are recorded in a Gas Purchase
Log which is reviewed and acknowledged by the Finance Director. Absent specific direction from the
Executive Committee or Board, the Program Manager’s gas purchases are limited to a three year contract term,
but are not limited by price or total dollar commitment.
Program Goals
Since 2002 the ABAG POWER Natural Gas Program has operated with the dual, and often competing, goals of
Cost Savings and Price Stability.
Price Stability. It is desirable that the Program’s purchasing strategy and costs allocation
methods be such that will provide members a reasonable degree of certainty of the costs to be
shared within any given program year.
Cost Savings. Given the desire for price stability, the Program shall attempt to provide gas
procurement services for less than the equivalent services provided by the default provider (i.e.
PG&E).
Gas Purchasing Strategy
Historically, the program has strived to achieve these goals through implementing a gas purchasing strategy
that emphasizes multiple layers of long-term, fixed-price contracts for a majority of its gas load, while the
remaining portion of gas is purchased with short-term, indexed-based contracts. This strategy has generally
resulted in positive savings during times of rising markets, and negative savings during falling markets, while
maintaining price stability.
In late 2014, ABAG POWER’s Executive Committee voted to alter its gas purchasing strategy by shifting its
emphasis from long-term, fixed-price contracts to short-term, indexed-based contracts. The decision was based

ASSOCIATION OF BAY AREA GOVERNMENTS
Representing City and County Governments of the San Francisco Bay Area
Mailing Address: Association of Bay Area Governments 375 Beale Street, Suite 700 San Francisco, California 94105
(415) 820 -7956 Fax: (415) 660 -3556 [email protected]
on comparatively low market prices of natural gas and served as an effort to combat increased costs related to
the pipeline capacity issues.
The current gas purchasing strategy established by the Executive Committee is as follows:
The program will purchase the majority of its gas requirements based on a monthly or daily index that
will float with the market price of gas.
The program will attempt to have a maximum of 500 Dth/day in long-term, fixed-price contracts.
Staff will monitor the price volatility of the overall portfolio and recommend actions necessary to
ensure adequate cash flow, including changes to members’ monthly levelized payments.
No firm-quantity gas contract shall extend longer than three years.
Additional Considerations. In addition, the Executive Committee has been continuously reviewing the
viability of the program ever since Core Transportation Agents (CTAs) received an unfavorable ruling at the
CPUC regarding pipeline capacity costs (2015). This ruling confirmed that CTAs, including ABAG POWER,
are required to pay for a prorated share of the pipeline capacity contracted for by PG&E.
Due to the potential that the increased costs that may occur as a result of this CPUC decision may outweigh any
program benefits, for the past two years the Executive Committee has instructed the ABAG POWER Program
Manager to limit forward gas purchase and sale transactions to no longer than one year into the future. In
February 2017, the Executive Committee authorized forward gas purchase and sale transactions to June 2018.
During the past year ABAG POWER purchased approximately 24% of its gas in long term,1 fixed price
contracts.
Gas Transaction Authority
As noted above, the ABAG POWER Program Manager currently has broad authority to make gas purchase and
sales transactions. However, as part of the due diligence necessary with the ABAG –MTC staff consolidation,
and the resulting modifications to accounting procedures and oversight, it may be prudent for the ABAG
POWER Executive Committee to provide further guidance and/or limitations related to natural gas transactions.
Examples of potential gas purchase limitations:
The Program Manager is authorized to make forward gas purchase transactions extending to [date].
(e.g., extend to 6/30/19)
The Program Manager’s authority to approve gas purchase and sales transactions is limited to [$
amount] per transaction. (e.g., limit to $1,500,000)
The Program Manager’s authority to approve variable priced transactions is limited to a purchase term
of [time period]. (e.g., 6 months)
If the average year-to-date price of gas exceeds the rate approved in the annual budget by 20%, the
Program Manager will convene a meeting of the Executive Committee to discuss potential increases to
the budget.
(See attached examples of theoretical gas purchase transactions.)
1 Contracts longer than one month in length.

ABAG POWER
Operating BudgetFiscal Year Ending June 30, 2018
FY 2016-17 FY 2016-17 FY 2017-18
Approved (1) Projected (2) Proposed % Change
Revenues
Sale of Energy 7,908,190$ 7,972,140$ 7,438,552$ -5.9%
Interest Income - Banks/LAIF 12,000 20,566 12,000 0.0%
Total revenues 7,920,190 7,992,706 7,450,552 -5.9%
Cost of energy
Cost of Energy Used 2,963,332 2,731,824 2,739,186 -7.6%
PG&E Pass-Through Costs 4,520,926 4,291,162 4,355,605 -3.7%
Total cost of energy 7,484,259 7,022,985 7,094,790 -5.2%
Other Energy Costs
Meter fees - - -
Total Other Energy Costs - - -
Program Expenses
Billing Costs, external 900 (824) 900 0.0%
Scheduling agent fees 16,800 16,800 16,800 0.0%
ABAG fees 398,731 312,706 318,561 -20.1%
Interest Expense/Bank Charges 9,500 9,233 9,500 0.0%
Legal Expenses (outside) 10,000 - 10,000 0.0%
Other Expenses - - -
Total Program Expenses 435,931 337,915 355,761 -18.4%
Total expenses 7,920,190 7,360,900 7,450,552 -5.9%
True-up Adjustment - 631,806 -
Core Annual Usage (Dths): 637,316 646,153 616,539 -3.3%
Noncore Annual Usage (Dths): 69,364 88,976 80,993 16.8%
Core Gas Commodity (3) ($/Dth): $4.23 $3.74 $3.96 -6.2%
Noncore Gas Commodity (3) ($/Dth): $3.88 $3.54 $3.65 -5.9%
PG&E Pass-through ($/Dth): $7.09 $6.64 $7.06 -0.4%
Program Expenses (4) ($/Dth): $0.60 $0.43 $0.49 -17.8%
Core Total Rate ($/Dth): $11.92 $10.81 $11.52 -3.4%
Noncore Total Rate ($/Dth): $4.48 $3.97 $4.15 -7.5%
Notes:
(1) Approved budget June 2016
(2) Actual April 2017 financials projected through June
(3) Storage costs allocated to core accounts only
(4) Program expenses minus interest income
Natural Gas
Attachment 7A1
Page 1 of 1

CustomerEstimated
Annual Usage Gas CostDistribution Shrinkage
Storage Costs
PG&E Pass-through
Costs (1)Program
Expenses (2) Total Cost
FY2017-18 Monthly
Levelized Charge
FY2016-17 Monthly
Levelized Charge
$343,761rate ($/th): $0.365 2.7% $0.021 $0.727 $0.049
CoreAlameda, City
Alameda, City ALAACPC001 53,839 $19,653 $537 $1,146 $39,151 $2,653 $63,140 $5,270 $11,590Alameda Municipal Power ALAACPC002 892 $326 $9 $19 $649 $44 $1,046 $90 $130
Alameda Total 54,731 $19,978 $546 $1,165 $39,800 $2,697 $64,186 $5,360 $11,720Alameda City Housing Authority ALAACPC003 47,236 $17,243 $471 $1,005 $49,083 $2,328 $70,130 $5,850 $4,410Albany, City ALBACPC001 10,976 $4,007 $110 $234 $7,982 $541 $12,873 $1,080 $1,090Atherton, Town ATHACPT001 4,361 $1,592 $44 $93 $3,171 $215 $5,114 $430 $390Benicia, City BENACPC001 61,906 $22,597 $618 $1,317 $45,017 $3,051 $72,600 $6,060 $5,840Contra Costa County GSD CONACPN001 1,214,666 $443,389 $12,119 $25,845 $883,295 $59,862 $1,424,509 $118,710 $127,420Cupertino, City CUPACPC001 35,782 $13,062 $357 $761 $26,021 $1,763 $41,964 $3,500 $3,490Fremont, City FREACPC001 158,436 $57,834 $1,581 $3,371 $115,213 $7,808 $185,807 $15,490 $17,280Gonzales, City GONACPC001 8,543 $3,119 $85 $182 $6,213 $421 $10,019 $840 $490Golden Gate Bridge GOLACP0001 55,803 $20,370 $557 $1,187 $40,579 $2,750 $65,443 $5,460 $5,110Half Moon Bay, City HALACPC001 4,271 $1,559 $43 $91 $4,438 $210 $6,340 $530 $470Hercules, City HERACPC001 38,353 $14,000 $383 $816 $27,890 $1,890 $44,979 $3,750 $2,890Los Altos, City LOSACPC001 25,090 $9,159 $250 $534 $18,245 $1,237 $29,425 $2,460 $2,580Mill Valley, City MILACPC001 62,611 $22,855 $625 $1,332 $45,530 $3,086 $73,428 $6,120 $4,460Millbrae, City
Millbrae, City MILACPC003 30,449 $11,115 $304 $648 $22,142 $1,501 $35,709 $2,980 $4,220Millbrae WWTP MILACPC004 101,789 $37,156 $1,016 $2,166 $53,948 $5,016 $99,302 $8,280 $11,250
Millbrae Total 132,238 $48,271 $1,319 $2,814 $76,090 $6,517 $135,011 $11,260 $15,470Milpitas, City MILACPC002 143,982 $52,558 $1,437 $3,064 $104,702 $7,096 $168,856 $14,080 $14,900Monte-Sereno, City MONACPC001 825 $301 $8 $18 $600 $41 $968 $90 $70Moraga, Town MORACPT001 5,086 $1,857 $51 $108 $3,699 $251 $5,965 $500 $460Napa County
Napa County001 NAPACPN001 1,377 $503 $14 $29 $1,001 $68 $1,614 $140 $130Napa County002 NAPACPN002 14,647 $5,346 $146 $312 $10,651 $722 $17,177 $1,440 $1,830Napa County004 NAPACPN004 11,715 $4,276 $117 $249 $8,519 $577 $13,739 $1,150 $1,020Napa County005 NAPACPN005 82,502 $30,116 $823 $1,755 $59,995 $4,066 $96,755 $8,070 $7,230
Napa County Total 110,241 $40,241 $1,100 $2,346 $80,166 $5,433 $129,286 $10,800 $10,210Oakland, City
Oakland, City OAKCPC001 699,499 $255,338 $6,979 $14,883 $508,670 $34,473 $820,343 $68,370 $67,050Oakland Zoological OAKCPC002 13,756 $5,021 $137 $293 $10,003 $678 $16,132 $1,350 $1,200
Oakland, City Total 713,255 $260,359 $7,116 $15,176 $518,673 $35,151 $836,476 $69,720 $68,250

CustomerEstimated
Annual Usage Gas CostDistribution Shrinkage
Storage Costs
PG&E Pass-through
Costs (1)Program
Expenses (2) Total Cost
FY2017-18 Monthly
Levelized Charge
FY2016-17 Monthly
Levelized Charge
$343,761rate ($/th): $0.365 2.7% $0.021 $0.727 $0.049Orinda, City ORIACPC001 8,643 $3,155 $86 $184 $6,285 $426 $10,136 $850 $830Pacifica, City PACACPC001 29,711 $10,845 $296 $632 $21,605 $1,464 $34,843 $2,910 $2,470Petaluma, City PETACPC001 21,542 $7,863 $215 $458 $15,665 $1,062 $25,263 $2,110 $1,980Pleasanton, City PLEACPC001 165,267 $60,327 $1,649 $3,516 $120,181 $8,145 $193,818 $16,160 $16,070Regional Admin. Facility RAFACPC001 46,774 $17,074 $467 $995 $34,014 $2,305 $54,855 $4,580 $5,570Richmond, City RICACPC001 434,506 $158,607 $4,335 $9,245 $315,969 $21,414 $509,570 $42,470 $34,200Salinas, City SALACPC001 83,845 $30,606 $837 $1,784 $60,971 $4,132 $98,329 $8,200 $6,880San Carlos, City SANACPC003 41,586 $15,180 $415 $885 $30,241 $2,049 $48,770 $4,070 $5,000San Mateo County
San Mateo County006 SANACPC006 346,268 $126,398 $3,455 $7,368 $251,803 $17,065 $406,088 $33,850 $46,150San Mateo County007 SANACPC007 547,690 $199,923 $5,465 $11,653 $273,583 $26,992 $517,615 $43,140 $65,660San Mateo County008 SANACPC008 5,709 $2,084 $57 $121 $5,042 $281 $7,585 $640 $520San Mateo County009 SANACPC009 3,558 $1,299 $35 $76 $2,587 $175 $4,173 $350 $300San Mateo County011 SANACPC011 9,073 $3,312 $91 $193 $6,598 $447 $10,641 $890 $1,940San Mateo County013 SANACPC013 52,361 $19,113 $522 $1,114 $38,076 $2,580 $61,406 $5,120 $5,760San Mateo County015 SANACPC015 52,221 $19,062 $521 $1,111 $37,975 $2,574 $61,243 $5,110 $5,350San Mateo County016 SANACPC016 7,489 $2,734 $75 $159 $5,446 $369 $8,783 $740 $750
San Mateo County Total 1,024,369 $373,925 $10,221 $21,796 $621,109 $50,484 $1,077,534 $89,840 $126,430San Rafael, City SANACPC001 75,214 $27,455 $750 $1,600 $54,695 $3,707 $88,208 $7,360 $7,510Santa Clara County SANACPN001 797,049 $290,946 $7,953 $16,959 $579,607 $39,281 $934,745 $77,900 $76,930Santa Rosa, City SANACPC005 288,340 $105,252 $2,877 $6,135 $209,678 $14,210 $338,152 $28,180 $26,550Saratoga, City SARACPC001 11,942 $4,359 $119 $254 $8,684 $589 $14,005 $1,170 $1,030Union City UNIACPC001 9,002 $3,286 $90 $192 $6,546 $444 $10,558 $880 $760Vallejo, City VALACPC001 73,316 $26,762 $732 $1,560 $53,315 $3,613 $85,981 $7,170 $7,460Vallejo Sani.& Flood Control Dist VALACPD001 91,981 $33,576 $918 $1,957 $66,888 $4,533 $107,871 $8,990 $10,000Watsonville, City WATACPC001 71,079 $25,946 $709 $1,512 $51,688 $3,503 $83,359 $6,950 $6,440Winters, City WINACPC001 2,829 $1,033 $28 $60 $2,057 $139 $3,317 $280 $230

CustomerEstimated
Annual Usage Gas CostDistribution Shrinkage
Storage Costs
PG&E Pass-through
Costs (1)Program
Expenses (2) Total Cost
FY2017-18 Monthly
Levelized Charge
FY2016-17 Monthly
Levelized Charge
$343,761rate ($/th): $0.365 2.7% $0.021 $0.727 $0.049
TOTAL - Core 6,165,387 $2,250,547 $61,515 $131,181 $4,355,605 $303,846 $7,102,694 $592,160 $633,340Rate ($/th) $0.365 $0.010 $0.021 $0.706 $0.049 $1.152
Total ABAG POWER Commodity Cost - Core: $0.396Member Rate - Core: $0.446
Non-Core 0.1%Contra Costa, County 0 $0 $0 $0 $0 $0 $0San Mateo County 426,776 $155,786 $156 $21,033 $176,974 $14,750 $16,180Santa Rosa, City (Co-gen) 171,583 $62,633 $63 $8,456 $71,151 $5,930 $11,220Watsonville, City (Co-gen) 211,568 $77,229 $77 $10,427 $87,732 $7,320 $7,230
TOTAL - Non-core 809,927 $295,647 $296 $0 $0 $39,915 $335,858 $28,000 $34,630Rate ($/th) $0.365 $0.000 $0.000 $0.000 $0.049 $0.415
Total ABAG POWER Commodity Cost - Non-core: $0.365Member Rate - Non-core: $0.415
GRAND TOTAL (Core + Non-core) 6,975,314 $2,546,194 $61,811 $131,181 $4,355,605 $343,761 $7,438,552 $620,160 $667,970% Change: -7.2%
Working Capital Deposits: 2,000,785$ Months: 3.23
Notes:(1) Includes estimates for: Customer Charge, Transportation Charge, Public Purpose Programs surcharge, and franchise fee. (2) Program expenses less interest income.