assets under management rs. 48,736.57 crore (as on july 31
TRANSCRIPT

Assets Under Management Rs. 48,736.57 Crore (As on July 31, 2007)

3
O v e r v i e w
Nilesh ShahDeputy Managing DirectorChief Investment Officer
Fixed Income Market SnapshotImpact on Interest Rates
FACTORS Short Term Medium Term(1-3 Months) (3-6 Months)
Inflation POSITIVE NEUTRAL
WPI inflation since May 2007 has remained within RBI's comfort range of 4-4.5%.Inflation is expected to rise in the second half when credit picks up and the high baseeffect starts receding. Increasing global crude prices may also add inflationary pressuregoing forward.
Money Supply POSITIVE NEUTRAL
YTD M3 growth of 21.7% as on July 20, 2007 was far higher than the RBI's target range of17-17.5%. The excess M3 growth can be attributed to intervention by the RBI in the forexmarket to neutralize large forex flows. The overnight call money market rates are expected torise to reverse repo rate level as the RBI has removed the cap of Rs.30 billion on the reverse repoamount. The banking system is full of liquidity and is well geared to handle busy season creditdemand.
Credit Demand POSITIVE NEUTRAL
The credit growth has started moderating due to higher interest rates with YTDincremental C.D. ratio falling to 70% from over 100% a year back. The credit pick-upmay see strong upsurge in the next few months as festival season demand picks upand Indian corporates resort to local borrowing due to widening of credit spreads inthe offshore market.
Government Borrowings POSITIVE NEUTRAL
Supply of Gilts via MSS and scheduled auctions was robust but failed to meet strongregulatory demand from the participants. With the government borrowing skewedtowards the first half of the year demand for SLR is expected to run ahead of supplyunless the government resorts to unscheduled issuances. In such a scenario prices ofG-sec are biased upward subject to (a) the government maintaining status quo on itsissuance calendar and (b) RBI refraining from SLR cuts.
Foreign Exchange Market POSITIVE NEUTRAL
India's forex reserves increased to USD 225.35 billion as on July 27, 2007 on back of robustinflows. The RBI is trying to stop Rupee appreciation by active intervention in the forex market.We expect debt flows especially on the ECB side to slow down in view of widening ofspreads.
RBI Policy NEGATIVE NEUTRAL
The RBI is successfully accomplishing the difficult job of managing currency, maintaininginflation and ensuring growth momentum. The Q2FY08 credit policy raised CRR by0.50% to absorb liquidity and anchor inflationary expectation. The RBI has retained theright of preemptive action if any one of the variables disturbs the equilibrium. Webelieve the RBI will be influenced by global factors especially by the widening of creditspreads & Fed's reaction to the US sub-prime loan issues.
Market Sentiment POSITIVE NEUTRAL
The market sentiment was generally bullish due to ample liquidity and favorableinflation trend. Even the announcement of CRR hike in credit policy failed to dampenthe market sentiment. We expect sentiments to remain bullish and push the yields tofurther lower level over a period of time.
OUTLOOK
We expect the RBI to manage liquidity in a manner, which is conducive forgrowth as well as stable inflation. Market expects US Fed to cut rates due tosub-prime loan issues in the rest of CY07.
Widening of credit spreads in offshore market will make ECB more expensiveand may prompt corporates to borrow in local markets.
We expect short term yields to rise above reverse repo rate level as the cap ofRs.30 billion on the reverse repo amount is removed from August 6, 2007.
We expect the yield curve to rise in the short end and fall in the medium tolong end. The curve will become flater over a period of time. We expect 10year G-sec yields to move towards 7.50% level over the next few months onthe back of ample liquidity, likely rate cut by US Fed and stable inflation.
We recommend investors to look at long maturity gilt funds at current level ofyields with 6 to 12 months investment horizon.
Market Sentiments
July saw one of the largest FII inflows into the equity markets (USD 5.85 billion as againsta total net inflow of USD 10.20 billion for YTD 2007) taking Sensex to all time high of 15795.Metals and Capital Goods stocks saw the maximum positive movement for the month, whileHealthcare and Consumer Durables remained laggards.
On the back of better-than-expected corporate results, overall market sentiments had beenpositive during the month. Even the CRR hike of 50 basis points did not have a significanteffect on the performance of the banking sector as banks were already bearing the cost ofundeployed excessive liquidity. However, global weakness and risk aversion towards theend of the month led to re-allocation of liquidity from riskier assets including emergingmarket equities to risk free US treasury bonds.
Global Events
For equity market investors, this is a testing time. While long-term outlook continues to favorbulls, tight liquidity and demanding valuations color the short-term outlook. The concerns onUS sub prime loans and their potential effect on the US and in turn the rest of the world isseverely feared, as is evident by a large-scale volatility across the world over the last fewdays. In our view, the US sub-prime woes alone are insufficient to spell the end of the globalequities bull run. Rather, stretched short-term valuations and shrinking liquidity (for the firsttime since 2000), are fast becoming two great excuses for triggering the correction.
In the days to come, we expect global markets to remain volatile as concerns on the US subprime issue play out. Further market correction should also not be ruled out. We arehowever not unduly concerned as global growth is no longer driven by the US, but byemerging economies. As long as growth elsewhere remains robust, the fall out from the USsub prime segment should not derail global growth.
OUTLOOK
In the short-term, markets may correct if liquidity flows out and we may seeconsolidation between 14000-14500 levels. The market valuations have been stretchedfor some time and a correction is expected. We remain cautious in the short term.However, the long-term fundamentals of the Indian economy and the corporate sectorremain intact.
The Market
Investments by Institutions Jun-07 Jul-07in cash segment (Rs. Cr.)FIIs (Net Purchases / Sales) 7167 18469MFs (Net Purchases / Sales) 700 -900Avg Daily Open Interest(Rs. Cr.)
Index Futures 16411 17923
Stock Futures 32714 39917
Index Options 14506 17848
Stock Options 2880 3328
Total 66511 79016
Valuation Ratios Jun-07 Jul-07P/E ratio- Sensex 21.09 21.03P/E ratio- Nifty 20.6 20.49Price/Book Value Ratio-Sensex 4.78 5.07Price/Book Value Ratio-Nifty 5.4 5.31Dividend Yield-Sensex 1.13 1.04Dividend Yield-Nifty 1.11 1.07
Avg Daily Volumes (Rs. Cr.)
CASH SegmentBSE 4358 5422NSE 9208 12147Total 13566 17569Derivative SegmentNSE 38407 46139Avg Advance Decline RatioBSE 1.04 1.02NSE 1.01 0.93
Indices Movement % change % changeMay-June 07 June-July 07
Sensex 0.73 6.14Nifty 0.51 4.89BSE Healthcare -0.94 -2.31BSE Consumer Durables 1.33 -1.86Bankex 5.30 1.74BSE Teck Index 0.49 2.31BSE Mid Cap 4.90 2.93BSE Auto -5.43 4.09BSE Small Cap 4.28 4.41BSE PSU 0.92 5.26BSE Oil & Gas -2.17 6.61BSE FMCG -4.09 7.87BSE Capital Goods 10.27 8.32BSE Metals 1.91 9.67
Three cheers for Corporate India. Hip hip hurray....
Equity Market SnapshotFundamentals
Corporate results for the quarter ending June 07 were ahead of market expectations. A largepart of the gains were directly or indirectly attributable to currency gain on forex loans. EBITDAgrowth for most companies however was in-line with estimates. The operating profit andoperating margin both were up by 19.20% and 18.11% respectively. Profits have grown on anaverage 36% YoY for Q1FY08 for 447 companies of the BSE 500 companies.
Margin expansion has helped several sectors like telecommunications, steel, capital goods &engineering and construction perform well. While telecom sector benefited by the growingsubscriber base and economies of scale, steel and cement companies gained from higherrealisations. The capital goods, engineering and construction sectors continued to remainsupported and boosted by growing capex and infrastructure related investment in buildingroads, dams and power plants. Meanwhile oversupply (sugar sector), appreciating rupee (IT,textiles, aluminimum etc.) and higher interest rates (auto sector) affected the performance ofcertain key sectors. On the whole, despite these odds, the overall performance of India Inc hasbeen good. This may take the 2008-09 Sensex EPS to above 1000, as against a consensusestimate of 960.
The news flow on capacity expansion, acquisitions, further investments, huge orders etc.continues:
• Capacity expansion and investments: NTPC to invest RS10bn in Aravali Power; JindalSteel to invest $2.1bn in Latin America; RPG group to invest Rs 120 bn in power
• Acquisitions: Tata Motors and M&M bid for Jaguar and Land Rover; Wipro Consumeracquired Unza Holdings, a Singapore based FMCG Company for Rs.10.10 bn
• Strong order books: GMR Infrastructure has secured the tender for developing the SabihaGokcen International (SGA) airport in Istanbul, Turkey
Technicals
4
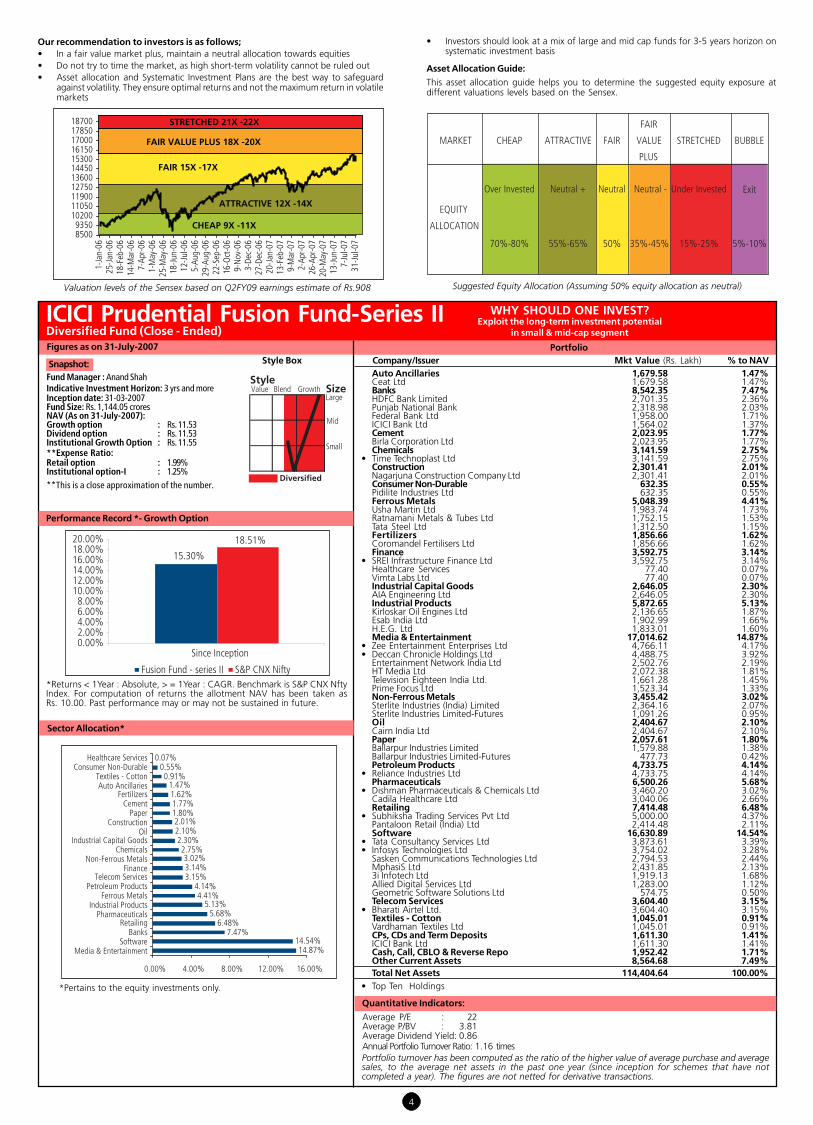
MARKET CHEAP ATTRACTIVE FAIR
FAIR
VALUE
PLUS
STRETCHED BUBBLE
Exit Neutral Neutral -
5%-10%
EQUITY
ALLOCATION
Under Invested
70%-80% 55%-65% 50% 35%-45% 15%-25%
Over Invested Neutral +
Suggested Equity Allocation (Assuming 50% equity allocation as neutral)
ICICI Prudential Fusion Fund-Series IIDiversified Fund (Close - Ended)
Snapshot:Fund Manager : Anand ShahIndicative Investment Horizon: 3 yrs and moreInception date: 31-03-2007Fund Size: Rs. 1,144.05 croresNAV (As on 31-July-2007):Growth option : Rs. 11.53Dividend option : Rs. 11.53Institutional Growth Option : Rs. 11.55**Expense Ratio:Retail option : 1.99%Institutional option-I : 1.25%**This is a close approximation of the number.
Style Box
Style Value Blend Growth Size
Large
Mid
Small
Figures as on 31-July-2007
WHY SHOULD ONE INVEST?Exploit the long-term investment potential
in small & mid-cap segment
PortfolioCompany/Issuer Mkt Value (Rs. Lakh) % to NAVAuto Ancillaries 1,679.58 1.47%Ceat Ltd 1,679.58 1.47%Banks 8,542.35 7.47%HDFC Bank Limited 2,701.35 2.36%Punjab National Bank 2,318.98 2.03%Federal Bank Ltd 1,958.00 1.71%ICICI Bank Ltd 1,564.02 1.37%Cement 2,023.95 1.77%Birla Corporation Ltd 2,023.95 1.77%Chemicals 3,141.59 2.75%
• Time Technoplast Ltd 3,141.59 2.75%Construction 2,301.41 2.01%Nagarjuna Construction Company Ltd 2,301.41 2.01%Consumer Non-Durable 632.35 0.55%Pidilite Industries Ltd 632.35 0.55%Ferrous Metals 5,048.39 4.41%Usha Martin Ltd 1,983.74 1.73%Ratnamani Metals & Tubes Ltd 1,752.15 1.53%Tata Steel Ltd 1,312.50 1.15%Fertilizers 1,856.66 1.62%Coromandel Fertilisers Ltd 1,856.66 1.62%Finance 3,592.75 3.14%
• SREI Infrastructure Finance Ltd 3,592.75 3.14%Healthcare Services 77.40 0.07%Vimta Labs Ltd 77.40 0.07%Industrial Capital Goods 2,646.05 2.30%AIA Engineering Ltd 2,646.05 2.30%Industrial Products 5,872.65 5.13%Kirloskar Oil Engines Ltd 2,136.65 1.87%Esab India Ltd 1,902.99 1.66%H.E.G. Ltd 1,833.01 1.60%Media & Entertainment 17,014.62 14.87%
• Zee Entertainment Enterprises Ltd 4,766.11 4.17%• Deccan Chronicle Holdings Ltd 4,488.75 3.92%
Entertainment Network India Ltd 2,502.76 2.19%HT Media Ltd 2,072.38 1.81%Television Eighteen India Ltd. 1,661.28 1.45%Prime Focus Ltd 1,523.34 1.33%Non-Ferrous Metals 3,455.42 3.02%Sterlite Industries (India) Limited 2,364.16 2.07%Sterlite Industries Limited-Futures 1,091.26 0.95%Oil 2,404.67 2.10%Cairn India Ltd 2,404.67 2.10%Paper 2,057.61 1.80%Ballarpur Industries Limited 1,579.88 1.38%Ballarpur Industries Limited-Futures 477.73 0.42%Petroleum Products 4,733.75 4.14%
• Reliance Industries Ltd 4,733.75 4.14%Pharmaceuticals 6,500.26 5.68%
• Dishman Pharmaceuticals & Chemicals Ltd 3,460.20 3.02%Cadila Healthcare Ltd 3,040.06 2.66%Retailing 7,414.48 6.48%
• Subhiksha Trading Services Pvt Ltd 5,000.00 4.37%Pantaloon Retail (India) Ltd 2,414.48 2.11%Software 16,630.89 14.54%
• Tata Consultancy Services Ltd 3,873.61 3.39%• Infosys Technologies Ltd 3,754.02 3.28%
Sasken Communications Technologies Ltd 2,794.53 2.44%MphasiS Ltd 2,431.85 2.13%3i Infotech Ltd 1,919.13 1.68%Allied Digital Services Ltd 1,283.00 1.12%Geometric Software Solutions Ltd 574.75 0.50%Telecom Services 3,604.40 3.15%
• Bharati Airtel Ltd. 3,604.40 3.15%Textiles - Cotton 1,045.01 0.91%Vardhaman Textiles Ltd 1,045.01 0.91%CPs, CDs and Term Deposits 1,611.30 1.41%ICICI Bank Ltd 1,611.30 1.41%Cash, Call, CBLO & Reverse Repo 1,952.42 1.71%Other Current Assets 8,564.68 7.49%Total Net Assets 114,404.64 100.00%
• Top Ten Holdings
Valuation levels of the Sensex based on Q2FY09 earnings estimate of Rs.908
Performance Record *- Growth Option
*Returns < 1Year : Absolute, > = 1Year : CAGR. Benchmark is S&P CNX NftyIndex. For computation of returns the allotment NAV has been taken asRs. 10.00. Past performance may or may not be sustained in future.
*Pertains to the equity investments only.
Sector Allocation*
15.30%
18.51%
0.00%2.00%4.00%6.00%8.00%
10.00%12.00%14.00%16.00%18.00%20.00%
Since Inception
Fusion Fund - series II S&P CNX Nifty
Quantitative Indicators:
Average P/E : 22Average P/BV : 3.81Average Dividend Yield: 0.86Annual Portfolio Turnover Ratio: 1.16 timesPortfolio turnover has been computed as the ratio of the higher value of average purchase and averagesales, to the average net assets in the past one year (since inception for schemes that have notcompleted a year). The figures are not netted for derivative transactions.
14.87%14.54%
7.47%6.48%
5.68%5.13%
4.41%4.14%
3.15%3.14%3.02%
2.75%2.30%
2.10%2.01%
1.80%1.77%1.62%1.47%
0.91%0.55%
0.07%
0.00% 4.00% 8.00% 12.00% 16.00%
Media & EntertainmentSoftware
BanksRetailing
PharmaceuticalsIndustrial Products
Ferrous MetalsPetroleum Products
Telecom ServicesFinance
Non-Ferrous MetalsChemicals
Industrial Capital GoodsOil
ConstructionPaper
CementFertilizers
Auto AncillariesTextiles - Cotton
Consumer Non-DurableHealthcare Services
85009350
1020011050119001275013600144501530016150170001785018700
1-Ja
n-06
25-J
an-0
618
-Feb
-06
14-M
ar-0
67-
Apr-0
61-
May
-06
25-M
ay-0
618
-Jun
-06
12-J
ul-0
65-
Aug-
0629
-Aug
-06
22-S
ep-0
616
-Oct
-06
9-N
ov-0
63-
Dec-
0627
-Dec
-06
20-J
an-0
713
-Feb
-07
9-M
ar-0
72-
Apr-0
726
-Apr
-07
20-M
ay-0
713
-Jun
-07
7-Ju
l-07
31-J
ul-0
7
CHEAP 9X -11X
ATTRACTIVE 12X -14X
FAIR 15X -17X
FAIR VALUE PLUS 18X -20X
STRETCHED 21X -22X
Our recommendation to investors is as follows;• In a fair value market plus, maintain a neutral allocation towards equities• Do not try to time the market, as high short-term volatility cannot be ruled out• Asset allocation and Systematic Investment Plans are the best way to safeguard
against volatility. They ensure optimal returns and not the maximum return in volatilemarkets
• Investors should look at a mix of large and mid cap funds for 3-5 years horizon onsystematic investment basis
Asset Allocation Guide:This asset allocation guide helps you to determine the suggested equity exposure atdifferent valuations levels based on the Sensex.

5
SIP Returns: As on 31-July-2007
Period SIP Start Date Total Amount Total No. Market Value SIPInvested of Units Returns
1 Year SIP 31-Aug-06 12,000.00 188.44 13,850.11 35.53%3 Year SIP 31-Aug-04 36,000.00 941.74 69,216.76 50.12%Since Inception 31-Oct-02 58,000.00 2,485.72 182,697.44 51.37%Past performance may or may not be sustained in future. Assume Rs. 1000 invested every month. Thehigh level of returns come from the sharp appreciation in market, in the year 2002, 2004 & 2006.
Quantitative Indicators:Average P/E : 19Average P/BV : 4.00Average Dividend Yield : 1.29Annual Portfolio Turnover Ratio : 2.49 times
PortfolioCompany/Issuer Mkt Value (Rs. Lakh) % to NAVSnapshot:
Fund Manager : Sankaran NarenIndicative Investment Horizon: 3 yrs & moreInception date: 31-10-2002Fund Size: Rs. 2,415.83 croresNAV (As on 31-July-2007):Growth option : Rs. 73.4988Dividend option : Rs. 22.9898Institutional Option-I : Rs. 11.1608**Expense Ratio:Retail option : 1.89%Institutional option-I : 1.00%
**This is a close approximation of the number.
WHY SHOULD ONE INVEST?Medium term investment of funds for capital appreciation
by managing cash and equity portfolio
Auto 11,088.48 4.59%• Mahindra & Mahindra Ltd 7,288.00 3.02%
Maruti Udyog Ltd 3,800.48 1.57%Auto Ancillaries 1,134.05 0.47%Sundaram Clayton Ltd 1,134.05 0.47%Banks 19,918.35 8.26%
• ICICI Bank Ltd 9,047.70 3.75%• Federal Bank Ltd 7,480.45 3.10%
Punjab National Bank 2,065.55 0.86%State Bank of India Ltd 811.93 0.34%Punjab National Bank-Futures 512.72 0.21%Cement 3,620.48 1.50%Orient Paper & Industries Ltd 3,167.73 1.31%Hyderabad Industries Ltd 452.75 0.19%Construction 2,388.80 0.99%Jaiprakash Associates Ltd 1,564.82 0.65%Patel Engineering Ltd 823.98 0.34%Consumer Non-Durable 18,114.47 7.50%
• ITC Limited 11,113.29 4.60%Tata Tea Ltd 4,186.18 1.73%Marico Industries Ltd 2,815.00 1.17%Ferrous Metals 7,739.59 3.20%Steel Authority of India Ltd 5,985.43 2.48%Mukand Ltd 1,265.25 0.52%Tata Steel Ltd 488.91 0.20%Fertilizers 2,155.00 0.89%Coromandel Fertilisers Ltd 2,155.00 0.89%Hotels 2,789.00 1.15%Indian Hotels Company Ltd 2,789.00 1.15%Industrial Capital Goods 4,073.18 1.69%Texmaco Ltd 4,073.18 1.69%Industrial Products 13,293.77 5.50%Jain Irrigation Systems Ltd 4,328.82 1.79%Greaves Cotton Limited 3,994.81 1.65%Sterlite Optical Technologies Ltd 2,198.00 0.91%AIA Engineering Ltd 1,881.42 0.78%Cummins India Ltd 890.72 0.37%Media & Entertainment 16,086.53 6.66%
• Deccan Chronicle Holdings Ltd 12,639.38 5.23%Zee Entertainment Enterprises Ltd 3,447.15 1.43%Non-Ferrous Metals 3,960.60 1.64%Sterlite Industries (India) Limited 3,960.60 1.64%Oil 9,844.56 4.08%Oil & Natural Gas Company Ltd 4,995.55 2.07%Oil & Natural Gas Company Ltd-Futures 4,849.01 2.01%Petroleum Products 20,828.50 8.62%
• Reliance Industries Ltd 20,828.50 8.62%Pharmaceuticals 18,775.45 7.77%Cadila Healthcare Ltd 4,026.61 1.67%Ranbaxy Laboratories Ltd 3,898.25 1.61%Dr. Reddy’s Laboratories Ltd 3,808.74 1.58%Alembic Ltd 3,119.80 1.29%Novartis India Ltd 2,055.30 0.85%Sun Pharmaceutical Industries Ltd 1,211.30 0.50%Aventis Pharma Ltd 655.45 0.27%Power 8,290.00 3.43%
• National Thermal Power Corporation Ltd 8,290.00 3.43%Software 30,691.12 12.70%
• Tata Consultancy Services Ltd 15,610.05 6.46%• Infosys Technologies Ltd 7,903.20 3.27%
HCL Technologies Limited 4,441.59 1.84%Subex Azure Ltd 2,736.28 1.13%Telecom Services 8,028.84 3.32%
• Bharati Airtel Ltd. 8,028.84 3.32%Textiles - Products 1,481.15 0.61%Aditya Birla Nuvo Ltd 1,481.15 0.61%Transportation 4,937.29 2.04%Containers Corporation of India Ltd 4,937.29 2.04%Nifty Futures 9,016.30 3.73%CPs, CDs and Term Deposits 28,288.70 11.71%ICICI Bank Ltd 22,063.70 9.13%Canara Bank Ltd 4,200.00 1.74%Allahabad Bank Ltd 2,025.00 0.84%Cash, Call, CBLO & Reverse Repo 9,226.62 3.82%Other Current Assets (14,187.35) -5.87%Total Net Assets 241,583.48 100.00%
• Top Ten Holdings
Performance Record *- Cumulative Option
Rs. 10000 invested at inception: Dynamic Plan Vs S&P CNX Nifty
CAGR – Dynamic Plan: 52.18%; Benchmark: 38.88%Past performance may or may not be sustained in future.
Sector Allocation*
Style Box
*Returns < 1Year : Absolute, > = 1Year : CAGR. Benchmark is S&P CNX Nifty.For computation of returns the allotment NAV has been taken asRs. 10.00. Past performance may or may not be sustained in future.31-Jul-04 was a non business day.
Figures as on 31-July-2007
*Pertains to the equity investments only.
Portfolio turnover has been computed as the ratio of the higher value of average purchase and averagesales, to the average net assets in the past one year (since inception for schemes that have notcompleted a year). The figures are not netted for derivative transactions.^ Risk-free rate based on the last 3 month T-Bill cut-off.
Std Dev : 6.52%Sharpe Ratio^ : 0.58Portfolio Beta : 1.01R squared : 0.74
ICICI Prudential Dynamic PlanDiversified Fund
8.40%
53.87%59.63%
52.18%
10.93%
44.08% 40.47% 38.88%
0.00%10.00%20.00%30.00%40.00%50.00%60.00%70.00%
Last6 Months
Last1 year
Last3 years
SinceInception
Dynamic Plan S&P CNX Nifty
Fund Manager's Comment
The fund maintained an average equity exposure at ~87% during the month, indicating a cautiousstance. Exposure to Mahindra & Mahindra (Auto) and ITC Ltd (Consumer Non-Durables) has beenincreased from previous levels. The fund has taken fresh exposure to PNB (Banks), Tata Tea Ltd & MaricoIndustries Ltd (Consumer Non-Durables), Sterlite Industries Ltd (Non-Ferrous Metals) and RanbaxyLaboratories Ltd (Pharmaceuticals). The fund has reduced exposure to Software & Banks and exited theTextile Products sector.
Rs 73498.80
Rs 47601.96
9,66519,665
29,66539,66549,66559,665
69,66579,665
Oct
-02
Jan-
03Ap
r-03
Jul-0
3O
ct-0
3Ja
n-04
Apr-0
4Ju
l-04
Oct
-04
Jan-
05Ap
r-05
Jul-0
5O
ct-0
5Ja
n-06
Apr-0
6Ju
l-06
Oct
-06
Jan-
07Ap
r-07
Jul-0
7
Dynamic Plan S&P CNX Nifty
12.70%
8.62%8.26%
7.77%7.50%
6.66%5.50%
4.59%
4.08%3.43%3.32%3.20%
2.04%1.69%1.64%
1.50%1.15%0.99%0.89%
0.61%0.47%
0.00% 4.00% 8.00% 12.00% 16.00%
SoftwarePetroleum Products
Banks
PharmaceuticalsConsumer Non-DurableMedia & Entertainment
Industrial Products
AutoOil
Power
Telecom ServicesFerrous MetalsTransportation
Industrial Capital
Non-Ferrous MetalsCement
Hotels
ConstructionFertilizers
Textiles - ProductsAuto Ancillaries

6
SIP Returns: As on 31-July-2007
Period SIP Start Date Total Amount Total No. Market Value SIPInvested of Units Returns
1 Year SIP 31-Aug-06 12,000.00 149.12 13,830.88 35.14%3 Year SIP 31-Aug-04 36,000.00 700.93 65,011.26 44.81%5 Year SIP 30-Aug-02 60,000.00 2,053.96 190,504.79 49.63%Since Inception 1-Oct-94 155,000.00 12,014.04 1,114,302.21 27.91%
Fund Manager's Comment
The fund maintained an average equity exposure of 89% during the monthindicating a cautious stance. The fund seeks to optimize risk-adjusted returnby building a portfolio of large and mid-cap stocks across companies in selectsectors. The fund has entered into sectors like Construction (Patel EngineeringLtd), Consumer Non-Durables (ITC Ltd) and Power (NTPC). The fund hasreduced exposure to Banks (exited SBI and Andhra Bank), Ferrous Metals,Industrial Capital Goods (exited Thermax Ltd), Oil (exited ONGC) and TextileProducts (exited Aditya Birla Nuvo Ltd).
ICICI Prudential PowerDiversified Fund
Snapshot:
Fund Manager : Anand ShahIndicative Investment Horizon: 5 yrs & moreInception date: 01-10-1994Fund Size: Rs. 1,514.19 croresNAV (As on 31-July-2007):Growth option : Rs. 92.75Dividend option : Rs. 22.63Institutional option-I : Rs. 24.84**Expense Ratio:Retail option : 2.02%Institutional option- I : 1.00%**This is a close approximation of the number.
WHY SHOULD ONE INVEST?Long term investment of funds for capital appreciation
in a concentrated multi sector portfolio
Performance Record* - Growth Option
Rs. 10000 invested at inception: Power Plan Vs S&P CNX Nifty
CAGR – Power:18.94%; Benchmark: 10.27%Past performance may or may not be sustained in future.
Sector Allocation*
*Returns < 1Year : Absolute, > = 1Year : CAGR. Benchmark is S&P CNXNifty. For computation of returns the allotment NAV has been taken asRs. 10.00. Past performance may or may not be sustained in future. 31-Jul-04 wasa non business day.
Quantitative Indicators:
Average P/E : 23Average P/BV : 4.91Average Dividend Yield : 0.88Annual Portfolio Turnover Ratio : 2.06 times
PortfolioCompany/Issuer Mkt Value (Rs. Lakh) % to NAVStyle Box
Figures as on 31-July-2007
*Pertains to the equity investments only.
Portfolio turnover has been computed as the ratio of the higher value of average purchase and averagesales, to the average net assets in the past one year (since inception for schemes that have notcompleted a year). The figures are not netted for derivative transactions.^ Risk-free rate based on the last 3 month T-Bill cut-off.
Auto 1,689.94 1.12%Maruti Udyog Ltd 1,689.94 1.12%Auto Ancillaries 427.25 0.28%Amtek Auto Ltd 427.25 0.28%Banks 13,880.09 9.17%
• ICICI Bank Ltd 6,737.44 4.45%HDFC Bank Limited 3,601.80 2.38%Punjab National Bank 3,540.85 2.34%Cement 6,196.50 4.09%Grasim Industries Ltd 2,957.05 1.95%Century Textiles & Industries Ltd 2,547.65 1.68%JK Cements Ltd 691.80 0.46%Construction 1,969.18 1.30%Patel Engineering Ltd 1,969.18 1.30%Consumer Non-Durable 4,788.00 3.16%
• ITC Limited 4,788.00 3.16%Ferrous Metals 5,386.15 3.56%Tata Steel Ltd 3,281.25 2.17%Steel Authority of India Ltd 2,104.90 1.39%Industrial Capital Goods 12,547.25 8.28%Larsen & Toubro Ltd 3,781.31 2.50%Bharat Heavy Electricals Ltd 3,212.35 2.12%Siemens India Limited 3,078.60 2.03%Bharat Electonics Ltd 2,474.99 1.63%Industrial Products 4,856.54 3.21%AIA Engineering Ltd 2,455.52 1.62%Jain Irrigation Systems Ltd 2,401.02 1.59%Media & Entertainment 16,708.63 11.03%
• Zee Entertainment Enterprises Ltd 5,909.40 3.90%• Deccan Chronicle Holdings Ltd 4,725.00 3.12%• HT Media Ltd 3,868.22 2.55%
Global Broadcast News Ltd 2,206.01 1.46%Petroleum Products 10,603.60 7.00%
• Reliance Industries Ltd 10,603.60 7.00%Pharmaceuticals 10,876.63 7.18%Sun Pharmaceutical Industries Ltd 3,333.88 2.20%Cadila Healthcare Ltd 2,724.52 1.80%Ipca Laboratories Ltd 2,449.82 1.62%Plethico Pharmaceuticals Ltd 2,368.41 1.56%Power 2,321.20 1.53%National Thermal Power Corporation Ltd 2,321.20 1.53%Software 22,831.00 15.07%
• Tata Consultancy Services Ltd 8,470.22 5.59%• Infosys Technologies Ltd 8,165.70 5.39%• HCL Technologies Limited 4,682.48 3.09%
Sasken Communications Technologies Ltd 1,512.60 1.00%Telecom Services 12,126.43 8.00%
• Bharati Airtel Ltd. 10,182.43 6.72%Idea Cellular Ltd 1,944.00 1.28%Textiles - Products 1,482.10 0.98%Gokaldas Exports Ltd 1,482.10 0.98%Transportation 3,529.72 2.33%Containers Corporation of India Ltd 3,529.72 2.33%Nifty Futures 2,930.30 1.94%CPs, CDs and Term Deposits 2,843.30 1.88%ICICI Bank Ltd 2,843.30 1.88%Cash, Call, CBLO & Reverse Repo 8,690.77 5.74%Other Current Assets 4,734.87 3.15%
Total Net Assets 151,419.45 100.00%• Top Ten Holdings
Std Dev : 6.01%Sharpe Ratio^ : 0.55Portfolio Beta : 0.97R squared : 0.80
Past performance may or may not be sustained in future. Assume Rs. 1000 invested every month.The high level of returns come from the sharp appreciation in market, in the year 2002, 2004 & 2006.
11.32%
48.09% 51.00% 51.70%
18.94%10.93%
44.08% 40.47% 36.39%
10.27%
0.00%
10.00%
20.00%30.00%
40.00%
50.00%
60.00%
Last 6Months
Last 1year
Last 3years
Last 5years
SinceInception
Power S&P CNX Nifty
Rs 92750.00
Rs 34429.97
6,05616,05626,05636,05646,05656,05666,05676,05686,05696,056
106,056
Oct
-94
Aug-
95
Jun-
96
Apr-9
7
Feb-
98
Dec-
98
Oct
-99
Aug-
00
Jun-
01
Apr-0
2
Feb-
03
Dec-
03
Oct
-04
Aug-
05
Jun-
06
Apr-0
7
Power S&P CNX Nifty
15.07%
11.03%
9.17%
8.28%
8.00%
7.18%
7.00%
4.09%
3.56%
3.21%
3.16%
2.33%
1.53%
1.30%
1.12%
0.98%
0.28%
0.00% 4.00% 8.00% 12.00% 16.00%
Software
Media & Entertainment
Banks
Industrial Capital
Telecom Services
Pharmaceuticals
Petroleum Products
Cement
Ferrous Metals
Industrial Products
Consumer Non-Durable
Transportation
Power
Construction
Auto
Textiles - Products
Auto Ancillaries

7
Fund Manager’s Comment
The fund maintained an average equity exposure of 91% during the month, indicating a cautious stance.The fund has taken fresh exposure to Rico Auto Ind. Ltd (Auto Ancillaries), Century Textiles & Ind. Ltd(Cement), Solectron Centum Electronics Ltd (Industrial Capital Goods) and Aditya Birla Nuvo Ltd (TextileProducts). Amtek Auto Ltd (Auto Ancillaries) and Andhra Bank (Banks) are out of the fund portfolio.
Sector Allocation*
*Pertains to the equity investments only.
Performance Record *- Growth Option
*Returns < 1Year : Absolute, > 1Year : CAGR. Benchmark is Nifty Junior. Forcomputation of returns the allotment NAV has been taken asRs. 10.00. Past performance may or may not be sustained in future.
SIP Returns: As on 31-July-2007
Period SIP Start Date Total Amount Total No. Market Value SIPInvested of Units Returns
1 Year SIP 31-Aug-06 12,000.00 432.40 14,360.00 45.97%Since Inception 28-Oct-04 35,000.00 1,947.74 64,684.45 48.54%
Quantitative Indicators:
Average P/E : 20Average P/BV : 3.49Average Dividend Yield : 0.81Annual Portfolio Turnover Ratio : 0.79 times
Portfolio turnover has been computed as the ratio of the higher value ofaverage purchase and average sales, to the average net assets in the pastone year (since inception for schemes that have not completed a year). Thefigures are not netted for derivative transactions.
^ Risk-free rate based on the last 3 month T-Bill cut-off.
Portfolio
WHY SHOULD ONE INVEST?Long term investment of funds for
capital appreciation on a mid-cap portfolio
Company/Issuer Mkt Value (Rs. Lakh) % to NAVStyle BoxFigures as on 31-July-2007
ICICI Prudential Emerging S.T.A.R. FundDiversified Fund
Auto Ancillaries 7,376.45 6.60%Phillips Carbon Black Ltd 2,433.24 2.18%Apollo Tyres Ltd 2,045.97 1.83%Bosch Chassis Systems India Ltd 1,724.24 1.54%Rico Auto Industries Ltd 1,173.00 1.05%Banks 2,913.57 2.61%Bank of Baroda Ltd 2,367.92 2.12%Union Bank of India Ltd 545.65 0.49%Cement 6,337.44 5.67%Birla Corporation Ltd 2,084.51 1.87%India Cements Ltd 1,703.91 1.52%Ramco Industries Ltd 1,335.96 1.20%Century Textiles & Industries Ltd 1,166.82 1.04%Orient Paper & Industries Ltd 46.24 0.04%Chemicals 1,801.74 1.62%Beck India Ltd 1,013.51 0.91%Vivimed Labs Ltd 788.23 0.71%Construction 4,669.65 4.18%
• Patel Engineering Ltd 3,428.90 3.07%Nagarjuna Construction Company Ltd 1,240.75 1.11%Consumer Durables 2,256.70 2.02%Mirza International Ltd 1,229.95 1.10%Lloyd Electric & Engineering Ltd 1,026.75 0.92%Ferrous Metals 6,348.18 5.68%
• Welspun Gujarat Stahl Roh Ltd 3,001.20 2.69%Mukand Ltd 1,720.91 1.54%Kalyani Steels Ltd 1,422.87 1.27%Kamdhenu Ispat Ltd 203.20 0.18%Finance 2,608.02 2.33%India Infoline Ltd 2,608.02 2.33%Industrial Capital Goods 10,162.81 9.10%
• TRF Ltd 2,768.86 2.48%Solectron Centum Electronics Ltd 2,277.61 2.04%Aban Lloyd Chiles Offshore Ltd 2,179.05 1.95%RPG Transmission Ltd 2,062.20 1.85%Stone India Ltd 875.09 0.78%Industrial Products 16,690.74 14.94%
• Sintex Industries Ltd 4,247.16 3.80%• AIA Engineering Ltd 2,950.55 2.64%• Sterlite Optical Technologies Ltd 2,883.78 2.58%
Finolex Cables Ltd 2,734.84 2.45%Graphite India Ltd 2,101.63 1.88%Cummins India Ltd 1,772.78 1.59%Media & Entertainment 12,652.77 11.32%
• Deccan Chronicle Holdings Ltd 8,619.56 7.71%Prime Focus Ltd 2,411.11 2.16%Jagran Prakashan Pvt Ltd 1,622.10 1.45%Pharmaceuticals 2,499.23 2.24%Dishman Pharmaceuticals & Chemicals Ltd 2,499.23 2.24%Power 1,702.58 1.52%Webel SL Energy Ltd 1,702.58 1.52%Software 16,861.26 15.10%
• Subex Azure Ltd 3,491.96 3.13%• Nucleus Software Exports Ltd 3,349.90 3.00%• Geodesic Information Systems Ltd 2,981.79 2.67%
3i Infotech Ltd 2,621.56 2.35%MphasiS Ltd 2,354.57 2.11%Megasoft Ltd 2,061.48 1.84%Textiles - Products 5,905.20 5.29%Provogue (India) Ltd 2,564.57 2.30%Gokaldas Exports Ltd 1,260.14 1.13%Aditya Birla Nuvo Ltd 1,147.89 1.03%Kewal Kiran Clothing Ltd 932.60 0.83%Transportation 1,119.93 1.00%All Cargo Global Logistics Ltd 1,119.93 1.00%CPs, CDs and Term Deposits 1,180.00 1.06%ICICI Bank Ltd 1,180.00 1.06%Cash, Call, CBLO & Reverse Repo 8,052.41 7.21%Other Current Assets 598.86 0.51%Total Net Assets 111,737.54 100.00%
• Top Ten Holdings
Snapshot:Fund Manager : Deven SangoiIndicative Investment Horizon: 3 years & moreInception date: 28-10-2004Fund Size: Rs. 1,117.38 croresNAV (As on 31-July-2007):Growth option : Rs. 33.21Dividend option : Rs. 21.73Institutional option-I : Rs. 13.07**Expense Ratio:Retail option : 2.07%Institutional option-I : 1.00%**This is a close approximation of the number.
Rs. 10000 invested at inception: Emerging S.T.A.R Fund Vs NIFTY Junior
CAGR – Emerging S.T.A.R. Fund : 54.57%; Benchmark : 40.19%Past performance may or may not be sustained in future.
Past performance may or may not be sustained in future. Assume Rs. 1000 invested every month.The high level of returns come from the sharp appreciation in market, in the year 2004 & 2006.
Std Dev : 7.42%Sharpe Ratio^ : 0.47Portfolio Beta : 0.93R squared : 0.74
11.00%
62.79%54.57%
21.76%
65.88%
40.19%
0.00%10.00%20.00%30.00%40.00%50.00%60.00%70.00%
Last 6 Months Last 1 year Since Inception
Emerging S.T.A.R. Fund NIFTY Junior Index
15.10%14.94%
11.32%9.10%
6.60%5.68%
5.67%
5.29%4.18%
2.61%2.33%
2.24%2.02%
1.62%1.52%
1.00%
0.00% 4.00% 8.00% 12.00% 16.00%
Software
Industrial ProductsMedia & Entertainment
Industrial Capital
Auto AncillariesFerrous Metals
CementTextiles - Products
ConstructionBanks
FinancePharmaceuticals
Consumer Durables
ChemicalsPower
Transportation
Rs 33210.00
Rs 25374.47
9,933
14,933
19,933
24,933
29,933
34,933
39,933
Oct
-04
Dec-
04
Feb-
05
Apr-0
5
Jun-
05
Aug-
05
Oct
-05
Dec-
05
Feb-
06
Apr-0
6
Jun-
06
Aug-
06
Oct
-06
Dec-
06
Feb-
07Ap
r-07
Jun-
07
Emerging S.T.A.R. Fund NIFTY Junior Index

8
Performance Record *- Growth Option
*Returns < 1Year : Absolute, > = 1Year : CAGR. Benchmark is ^Nifty JuniorIndex. For computation of returns the allotment NAV has been taken asRs. 10.00. Past performance may or may not be sustained in future.
ICICI Prudential Fusion FundDiversified Fund (Close - Ended)
Snapshot:
Fund Manager : Deven SangoiIndicative Investment Horizon: 5 yrs and moreInception date: 25-03-2006Fund Size: Rs. 749.52 croresNAV (As on 31-July-2007):Growth option : Rs. 14.60Dividend option : Rs. 14.60Institutional option-I : Rs. 14.82**Expense Ratio:Retail option : 2.12%Institutional option-I : 0.99%**This is a close approximation of the number.
Style Box
Style Value Blend Growth Size
Large
Mid
Small
Figures as on 31-July-2007
*Pertains to the equity investments only.
WHY SHOULD ONE INVEST?Exploit the long-term investment potential of equity
PortfolioCompany/Issuer Mkt Value (Rs. Lakh) % to NAV
Auto Ancillaries 3,382.61 4.52%• Amtek India Ltd 2,335.44 3.12%
Enkei Castalloy Ltd 672.50 0.90%Sundaram Clayton Ltd 374.67 0.50%Banks 2,145.45 2.86%ICICI Bank Ltd 1,424.55 1.90%Federal Bank Ltd 720.90 0.96%Cement 500.12 0.67%Ramco Industries Ltd 500.12 0.67%Construction 4,516.90 6.02%
• Orbit Corporation Ltd 3,412.22 4.55%Unity Infraprojects Ltd 1,104.68 1.47%Consumer Durables 991.32 1.32%K.G. Khosla Compressors Ltd 991.32 1.32%Consumer Non-Durable 386.30 0.52%Synergy Multibase Ltd 386.30 0.52%Ferrous Metals 2,447.14 3.26%
• Kalyani Steels Ltd 2,447.14 3.26%Industrial Capital Goods 7,540.82 10.08%Bharti Shipyard Ltd 1,976.23 2.64%Aban Lloyd Chiles Offshore Ltd 1,345.56 1.80%Gujarat Apollo Equipments Ltd 1,181.75 1.58%Jyoti Ltd 927.83 1.24%Gei Hamon Industries Ltd 836.00 1.12%Bharat Forge Utilities Ltd 831.20 1.11%Texmaco Ltd 442.25 0.59%Industrial Products 9,544.17 12.73%
• Jain Irrigation Systems Ltd 4,406.21 5.88%AIA Engineering Ltd 1,810.81 2.42%Esab India Ltd 1,343.54 1.79%Finolex Cables Ltd 1,119.23 1.49%Sterlite Optical Technologies Ltd 864.38 1.15%Media & Entertainment 8,114.67 10.83%
• Deccan Chronicle Holdings Ltd 5,985.09 7.99%Jagran Prakashan Pvt Ltd 2,129.58 2.84%Pesticides 2,275.33 3.03%United Phosphorus Ltd 1,480.20 1.97%Rallis India Ltd 795.13 1.06%Petroleum Products 2,834.61 3.78%
• Reliance Industries Ltd 2,834.61 3.78%Pharmaceuticals 7,060.79 9.42%
• Elder Pharmaceuticals Ltd 2,700.78 3.60%Dishman Pharmaceuticals & Chemicals Ltd 1,873.14 2.50%Cadila Healthcare Ltd 1,421.78 1.90%Torrent Pharmaceuticals Ltd 1,065.09 1.42%Retailing 2,500.00 3.34%
• Subhiksha Trading Services Pvt Ltd 2,500.00 3.34%Software 11,959.53 15.96%
• Zenith Infotech Ltd 3,739.36 4.99%• Subex Azure Ltd 3,262.41 4.35%
Geometric Software Solutions Ltd 1,537.26 2.05%Firstsource Solutions Ltd 1,181.24 1.58%Megasoft Ltd 1,168.71 1.56%MphasiS Ltd 1,070.55 1.43%Textiles - Products 4,337.02 5.79%Aditya Birla Nuvo Ltd 1,475.76 1.97%Kewal Kiran Clothing Ltd 1,345.01 1.79%Siyaram Silk Mills Ltd 799.95 1.07%Gokaldas Exports Ltd 716.30 0.96%CPs, CDs and Term Deposits 1,530.00 2.04%ICICI Bank Ltd 1,530.00 2.04%Cash, Call, CBLO & Reverse Repo 608.55 0.81%Other Current Assets 2,276.46 3.02%Total Net Assets 74,951.79 100.00%
• Top Ten Holdings
Sector Allocation*
Quantitative Indicators:
Average P/E : 24Average P/BV : 3.78Average Dividend Yield: 0.67Annual Portfolio Turnover Ratio: 0.62 times
Portfolio turnover has been computed as the ratio of the higher value of average purchase and averagesales, to the average net assets in the past one year (since inception for schemes that have notcompleted a year). The figures are not netted for derivative transactions.^ Risk-free rate based on the last 3 month T-Bill cut-off.
Std Dev : 7.00%Sharpe Ratio^ : 0.30Portfolio Beta : 0.92R squared : 0.77
Rs. 10000 invested at inception: Fusion Plan Vs NIFTY Junior
CAGR – Fusion Fund: 32.34%; Benchmark : 28.19%Past performance may or may not be sustained in future.
14.69%
63.31%
32.34%
21.76%
65.88%
28.19%
0.00%10.00%20.00%30.00%40.00%50.00%60.00%70.00%
Last 6 Months Last 1 year Since Inception
Fusion Fund NIFTY Junior Index
Rs 14600.00Rs 14651.53
7,4308,4309,430
10,43011,43012,43013,43014,43015,43016,430
Mar
-06
Apr-0
6
May
-06
Jun-
06Ju
l-06
Aug-
06
Sep-
06
Oct
-06
Nov
-06
Dec-
06
Jan-
07
Feb-
07M
ar-0
7
Apr-0
7
May
-07
Jun-
07Ju
l-07
Fusion Fund NIFTY Junior Index
15.96%12.73%
10.83%10.08%
9.42%6.02%5.79%
4.52%3.78%
3.34%3.26%3.03%2.86%
1.32%0.67%0.52%
0.00% 5.00% 10.00% 15.00% 20.00%
SoftwareIndustrial Products
Media & EntertainmentIndustrial CapitalPharmaceuticals
ConstructionTextiles - Products
Auto AncillariesPetroleum Products
RetailingFerrous Metals
PesticidesBanks
Consumer DurablesCement
Consumer Non-
9
Fund Manager's Comment
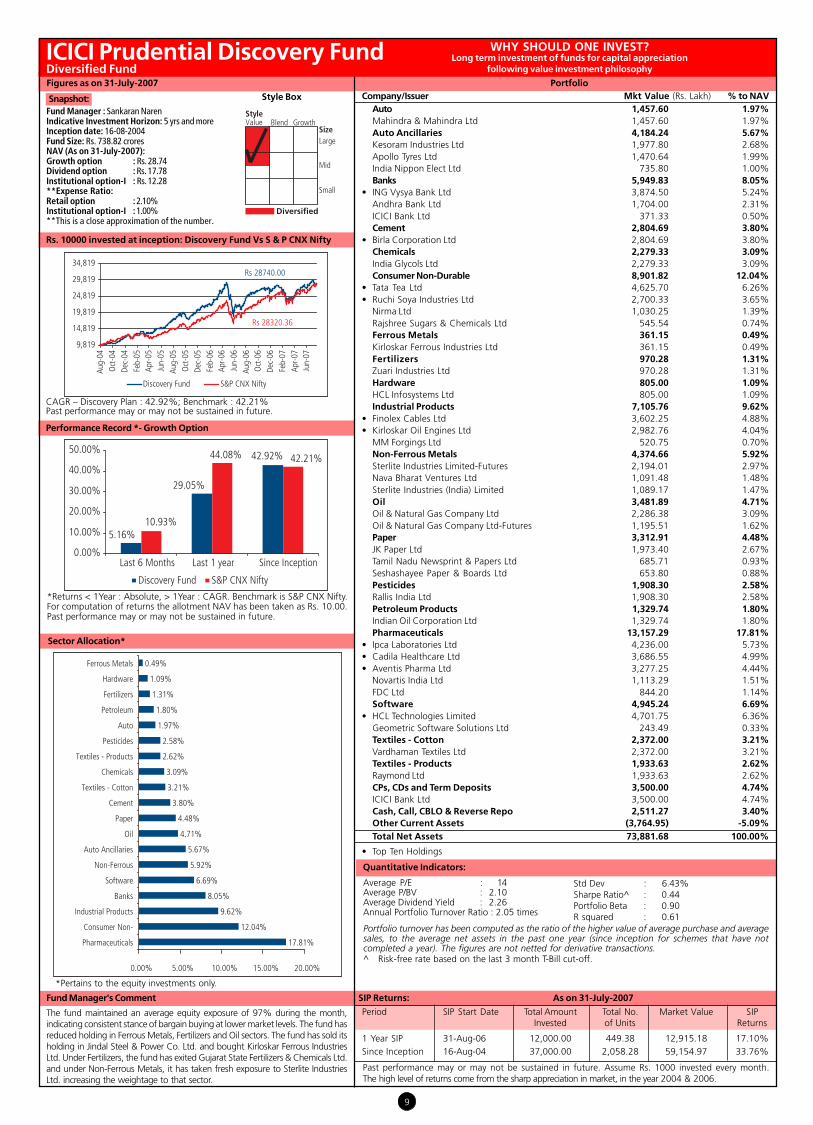
The fund maintained an average equity exposure of 97% during the month,indicating consistent stance of bargain buying at lower market levels. The fund hasreduced holding in Ferrous Metals, Fertilizers and Oil sectors. The fund has sold itsholding in Jindal Steel & Power Co. Ltd. and bought Kirloskar Ferrous IndustriesLtd. Under Fertilizers, the fund has exited Gujarat State Fertilizers & Chemicals Ltd.and under Non-Ferrous Metals, it has taken fresh exposure to Sterlite IndustriesLtd. increasing the weightage to that sector.
Rs. 10000 invested at inception: Discovery Fund Vs S & P CNX Nifty
SIP Returns: As on 31-July-2007
Period SIP Start Date Total Amount Total No. Market Value SIPInvested of Units Returns
1 Year SIP 31-Aug-06 12,000.00 449.38 12,915.18 17.10%Since Inception 16-Aug-04 37,000.00 2,058.28 59,154.97 33.76%
CAGR – Discovery Plan : 42.92%; Benchmark : 42.21%Past performance may or may not be sustained in future.
Quantitative Indicators:
Average P/E : 14Average P/BV : 2.10Average Dividend Yield : 2.26Annual Portfolio Turnover Ratio : 2.05 times
Portfolio
ICICI Prudential Discovery FundDiversified Fund
Snapshot:Fund Manager : Sankaran NarenIndicative Investment Horizon: 5 yrs and moreInception date: 16-08-2004Fund Size: Rs. 738.82 croresNAV (As on 31-July-2007):Growth option : Rs. 28.74Dividend option : Rs. 17.78Institutional option-I : Rs. 12.28**Expense Ratio:Retail option : 2.10%Institutional option-I : 1.00%**This is a close approximation of the number.
WHY SHOULD ONE INVEST?Long term investment of funds for capital appreciation
following value investment philosophy
Performance Record *- Growth Option
Sector Allocation*
Company/Issuer Mkt Value (Rs. Lakh) % to NAVStyle Box
*Returns < 1Year : Absolute, > 1Year : CAGR. Benchmark is S&P CNX Nifty.For computation of returns the allotment NAV has been taken as Rs. 10.00.Past performance may or may not be sustained in future.
Figures as on 31-July-2007
*Pertains to the equity investments only.
Auto 1,457.60 1.97%Mahindra & Mahindra Ltd 1,457.60 1.97%Auto Ancillaries 4,184.24 5.67%Kesoram Industries Ltd 1,977.80 2.68%Apollo Tyres Ltd 1,470.64 1.99%India Nippon Elect Ltd 735.80 1.00%Banks 5,949.83 8.05%
• ING Vysya Bank Ltd 3,874.50 5.24%Andhra Bank Ltd 1,704.00 2.31%ICICI Bank Ltd 371.33 0.50%Cement 2,804.69 3.80%
• Birla Corporation Ltd 2,804.69 3.80%Chemicals 2,279.33 3.09%India Glycols Ltd 2,279.33 3.09%Consumer Non-Durable 8,901.82 12.04%
• Tata Tea Ltd 4,625.70 6.26%• Ruchi Soya Industries Ltd 2,700.33 3.65%
Nirma Ltd 1,030.25 1.39%Rajshree Sugars & Chemicals Ltd 545.54 0.74%Ferrous Metals 361.15 0.49%Kirloskar Ferrous Industries Ltd 361.15 0.49%Fertilizers 970.28 1.31%Zuari Industries Ltd 970.28 1.31%Hardware 805.00 1.09%HCL Infosystems Ltd 805.00 1.09%Industrial Products 7,105.76 9.62%
• Finolex Cables Ltd 3,602.25 4.88%• Kirloskar Oil Engines Ltd 2,982.76 4.04%
MM Forgings Ltd 520.75 0.70%Non-Ferrous Metals 4,374.66 5.92%Sterlite Industries Limited-Futures 2,194.01 2.97%Nava Bharat Ventures Ltd 1,091.48 1.48%Sterlite Industries (India) Limited 1,089.17 1.47%Oil 3,481.89 4.71%Oil & Natural Gas Company Ltd 2,286.38 3.09%Oil & Natural Gas Company Ltd-Futures 1,195.51 1.62%Paper 3,312.91 4.48%JK Paper Ltd 1,973.40 2.67%Tamil Nadu Newsprint & Papers Ltd 685.71 0.93%Seshashayee Paper & Boards Ltd 653.80 0.88%Pesticides 1,908.30 2.58%Rallis India Ltd 1,908.30 2.58%Petroleum Products 1,329.74 1.80%Indian Oil Corporation Ltd 1,329.74 1.80%Pharmaceuticals 13,157.29 17.81%
• Ipca Laboratories Ltd 4,236.00 5.73%• Cadila Healthcare Ltd 3,686.55 4.99%• Aventis Pharma Ltd 3,277.25 4.44%
Novartis India Ltd 1,113.29 1.51%FDC Ltd 844.20 1.14%Software 4,945.24 6.69%
• HCL Technologies Limited 4,701.75 6.36%Geometric Software Solutions Ltd 243.49 0.33%Textiles - Cotton 2,372.00 3.21%Vardhaman Textiles Ltd 2,372.00 3.21%Textiles - Products 1,933.63 2.62%Raymond Ltd 1,933.63 2.62%CPs, CDs and Term Deposits 3,500.00 4.74%ICICI Bank Ltd 3,500.00 4.74%Cash, Call, CBLO & Reverse Repo 2,511.27 3.40%Other Current Assets (3,764.95) -5.09%Total Net Assets 73,881.68 100.00%
• Top Ten Holdings
Std Dev : 6.43%Sharpe Ratio^ : 0.44Portfolio Beta : 0.90R squared : 0.61
Portfolio turnover has been computed as the ratio of the higher value of average purchase and averagesales, to the average net assets in the past one year (since inception for schemes that have notcompleted a year). The figures are not netted for derivative transactions.^ Risk-free rate based on the last 3 month T-Bill cut-off.
Past performance may or may not be sustained in future. Assume Rs. 1000 invested every month.The high level of returns come from the sharp appreciation in market, in the year 2004 & 2006.
5.16%
29.05%
42.92%
10.93%
44.08% 42.21%
0.00%
10.00%
20.00%
30.00%
40.00%
50.00%
Last 6 Months Last 1 year Since Inception
Discovery Fund S&P CNX Nifty
Rs 28740.00
Rs 28320.36
9,819
14,819
19,819
24,819
29,819
34,819
Aug-
04O
ct-0
4De
c-04
Feb-
05Ap
r-05
Jun-
05Au
g-05
Oct
-05
Dec-
05Fe
b-06
Apr-0
6Ju
n-06
Aug-
06O
ct-0
6De
c-06
Feb-
07Ap
r-07
Jun-
07
Discovery Fund S&P CNX Nifty
17.81%
12.04%
9.62%
8.05%
6.69%
5.92%
5.67%
4.71%
4.48%
3.80%
3.21%
3.09%
2.62%
2.58%
1.97%
1.80%
1.31%
1.09%
0.49%
0.00% 5.00% 10.00% 15.00% 20.00%
Pharmaceuticals
Consumer Non-
Industrial Products
Banks
Software
Non-Ferrous
Auto Ancillaries
Oil
Paper
Cement
Textiles - Cotton
Chemicals
Textiles - Products
Pesticides
Auto
Petroleum
Fertilizers
Hardware
Ferrous Metals
10
Performance Record *- Growth Option
*Returns < 1Year : Absolute, > = 1Year : CAGR. Benchmark is S&P CNX Nifty.For computation of returns the allotment NAV has been taken asRs. 10.00. Past performance may or may not be sustained in future.31-Jul-04 was a non business day.
Sector Allocation*
*Pertains to the equity investments only.
ICICI Prudential Tax PlanDiversified Fund
Snapshot:Fund Manager : Sankaran NarenIndicative Investment Horizon: 3 yrs & moreInception date: 19-08-1999Fund Size: Rs. 735.05 croresNAV (As on 31-July-2007):
Growth option : Rs. 94.53Dividend option : Rs. 22.70
**Expense Ratio: 2.19%
**This is a close approximation of the number.
WHY SHOULD ONE INVEST?Medium term investment of funds with tax benefits for capital appreciation
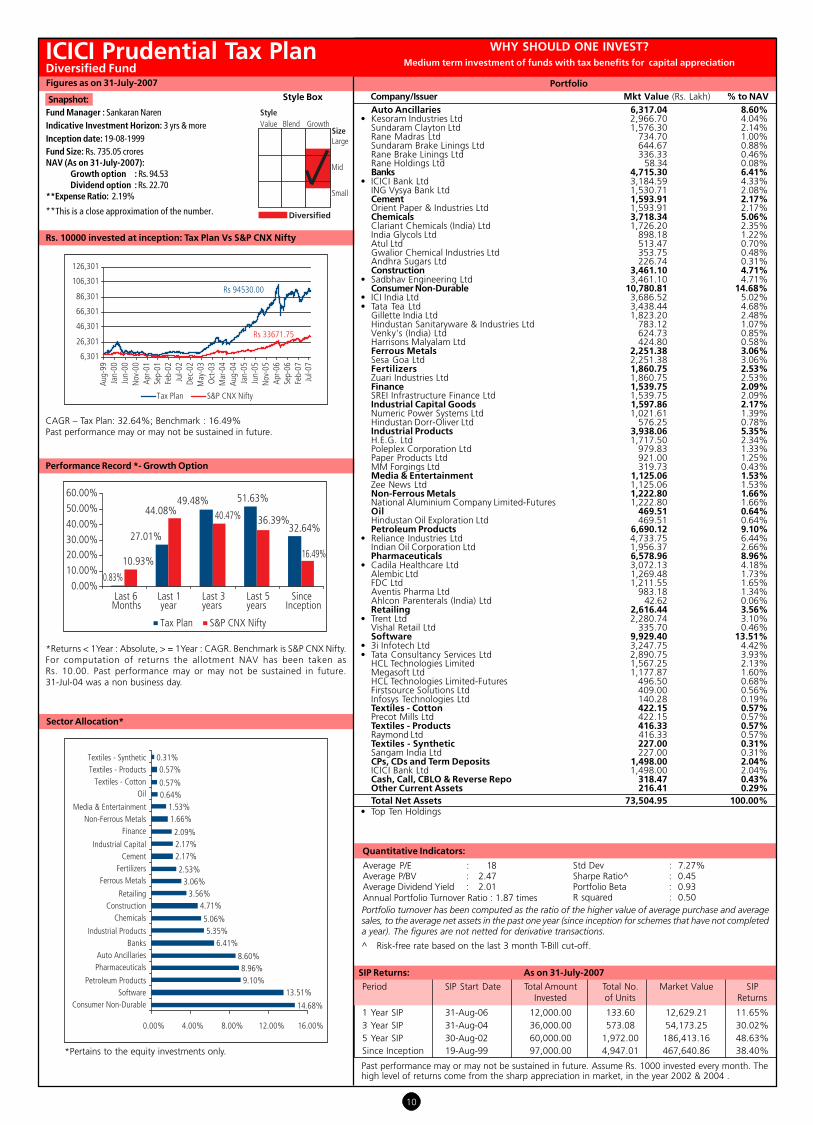
Auto Ancillaries 6,317.04 8.60%• Kesoram Industries Ltd 2,966.70 4.04%
Sundaram Clayton Ltd 1,576.30 2.14%Rane Madras Ltd 734.70 1.00%Sundaram Brake Linings Ltd 644.67 0.88%Rane Brake Linings Ltd 336.33 0.46%Rane Holdings Ltd 58.34 0.08%Banks 4,715.30 6.41%
• ICICI Bank Ltd 3,184.59 4.33%ING Vysya Bank Ltd 1,530.71 2.08%Cement 1,593.91 2.17%Orient Paper & Industries Ltd 1,593.91 2.17%Chemicals 3,718.34 5.06%Clariant Chemicals (India) Ltd 1,726.20 2.35%India Glycols Ltd 898.18 1.22%Atul Ltd 513.47 0.70%Gwalior Chemical Industries Ltd 353.75 0.48%Andhra Sugars Ltd 226.74 0.31%Construction 3,461.10 4.71%
• Sadbhav Engineering Ltd 3,461.10 4.71%Consumer Non-Durable 10,780.81 14.68%
• ICI India Ltd 3,686.52 5.02%• Tata Tea Ltd 3,438.44 4.68%
Gillette India Ltd 1,823.20 2.48%Hindustan Sanitaryware & Industries Ltd 783.12 1.07%Venky's (India) Ltd 624.73 0.85%Harrisons Malyalam Ltd 424.80 0.58%Ferrous Metals 2,251.38 3.06%Sesa Goa Ltd 2,251.38 3.06%Fertilizers 1,860.75 2.53%Zuari Industries Ltd 1,860.75 2.53%Finance 1,539.75 2.09%SREI Infrastructure Finance Ltd 1,539.75 2.09%Industrial Capital Goods 1,597.86 2.17%Numeric Power Systems Ltd 1,021.61 1.39%Hindustan Dorr-Oliver Ltd 576.25 0.78%Industrial Products 3,938.06 5.35%H.E.G. Ltd 1,717.50 2.34%Poleplex Corporation Ltd 979.83 1.33%Paper Products Ltd 921.00 1.25%MM Forgings Ltd 319.73 0.43%Media & Entertainment 1,125.06 1.53%Zee News Ltd 1,125.06 1.53%Non-Ferrous Metals 1,222.80 1.66%National Aluminium Company Limited-Futures 1,222.80 1.66%Oil 469.51 0.64%Hindustan Oil Exploration Ltd 469.51 0.64%Petroleum Products 6,690.12 9.10%
• Reliance Industries Ltd 4,733.75 6.44%Indian Oil Corporation Ltd 1,956.37 2.66%Pharmaceuticals 6,578.96 8.96%
• Cadila Healthcare Ltd 3,072.13 4.18%Alembic Ltd 1,269.48 1.73%FDC Ltd 1,211.55 1.65%Aventis Pharma Ltd 983.18 1.34%Ahlcon Parenterals (India) Ltd 42.62 0.06%Retailing 2,616.44 3.56%
• Trent Ltd 2,280.74 3.10%Vishal Retail Ltd 335.70 0.46%Software 9,929.40 13.51%
• 3i Infotech Ltd 3,247.75 4.42%• Tata Consultancy Services Ltd 2,890.75 3.93%
HCL Technologies Limited 1,567.25 2.13%Megasoft Ltd 1,177.87 1.60%HCL Technologies Limited-Futures 496.50 0.68%Firstsource Solutions Ltd 409.00 0.56%Infosys Technologies Ltd 140.28 0.19%Textiles - Cotton 422.15 0.57%Precot Mills Ltd 422.15 0.57%Textiles - Products 416.33 0.57%Raymond Ltd 416.33 0.57%Textiles - Synthetic 227.00 0.31%Sangam India Ltd 227.00 0.31%CPs, CDs and Term Deposits 1,498.00 2.04%ICICI Bank Ltd 1,498.00 2.04%Cash, Call, CBLO & Reverse Repo 318.47 0.43%Other Current Assets 216.41 0.29%Total Net Assets 73,504.95 100.00%
• Top Ten Holdings
SIP Returns: As on 31-July-2007
Period SIP Start Date Total Amount Total No. Market Value SIPInvested of Units Returns
1 Year SIP 31-Aug-06 12,000.00 133.60 12,629.21 11.65%3 Year SIP 31-Aug-04 36,000.00 573.08 54,173.25 30.02%5 Year SIP 30-Aug-02 60,000.00 1,972.00 186,413.16 48.63%Since Inception 19-Aug-99 97,000.00 4,947.01 467,640.86 38.40%
Quantitative Indicators:
Average P/E : 18Average P/BV : 2.47Average Dividend Yield : 2.01Annual Portfolio Turnover Ratio : 1.87 times
PortfolioCompany/Issuer Mkt Value (Rs. Lakh) % to NAVStyle Box
Figures as on 31-July-2007
Portfolio turnover has been computed as the ratio of the higher value of average purchase and averagesales, to the average net assets in the past one year (since inception for schemes that have not completeda year). The figures are not netted for derivative transactions.
^ Risk-free rate based on the last 3 month T-Bill cut-off.
CAGR – Tax Plan: 32.64%; Benchmark : 16.49%Past performance may or may not be sustained in future.
Rs. 10000 invested at inception: Tax Plan Vs S&P CNX Nifty
Past performance may or may not be sustained in future. Assume Rs. 1000 invested every month. Thehigh level of returns come from the sharp appreciation in market, in the year 2002 & 2004 .
Std Dev : 7.27%Sharpe Ratio^ : 0.45Portfolio Beta : 0.93R squared : 0.50
0.83%
27.01%
49.48% 51.63%
32.64%
10.93%
44.08% 40.47% 36.39%
16.49%
0.00%
10.00%
20.00%30.00%
40.00%
50.00%
60.00%
Last 6Months
Last 1year
Last 3years
Last 5years
SinceInception
Tax Plan S&P CNX Nifty
Rs 94530.00
Rs 33671.75
6,301
26,301
46,301
66,301
86,301
106,301
126,301
Aug-
99Ja
n-00
Jun-
00N
ov-0
0Ap
r-01
Sep-
01Fe
b-02
Jul-0
2De
c-02
May
-03
Oct
-03
Mar
-04
Aug-
04Ja
n-05
Jun-
05N
ov-0
5Ap
r-06
Sep-
06Fe
b-07
Jul-0
7
Tax Plan S&P CNX Nifty
14.68%
13.51%9.10%8.96%
8.60%
6.41%5.35%
5.06%
4.71%3.56%
3.06%2.53%
2.17%2.17%2.09%
1.66%1.53%
0.64%0.57%
0.57%0.31%
0.00% 4.00% 8.00% 12.00% 16.00%
Consumer Non-DurableSoftware
Petroleum Products
PharmaceuticalsAuto Ancillaries
BanksIndustrial Products
ChemicalsConstruction
Retailing
Ferrous MetalsFertilizers
CementIndustrial Capital
FinanceNon-Ferrous Metals
Media & Entertainment
OilTextiles - Cotton
Textiles - ProductsTextiles - Synthetic

11
Fund Manager's Comment
The fund maintained an average equity exposure of 90% during the month, including ~3% exposure toNifty Futures, indicating a cautious stance. The fund has exited Tata Motors Ltd (Auto). Exposure toConsumer Non-Durables, Industrial Products and Telecom Services has been increased while that inFerrous Metals, Industrial Capital Goods and Software is reduced. The portfolio is skewed towards largecap as the fund seeks to maximize the risk-return payoff.
SIP Returns: As on 31-July-2007
Period SIP Start Date Total Amount Total No. Market Value SIPInvested of Units Returns
1 Year SIP 31-Aug-06 12,000.00 130.30 13,659.35 31.69%
3 Year SIP 31-Aug-04 36,000.00 596.41 62,521.66 41.57%
5 Year SIP 30-Aug-02 60,000.00 1,585.04 166,159.74 43.40%
Since Inception 09-Jul-98 110,000.00 4,559.43 477,965.05 30.96%
Quantitative Indicators:
Average P/E : 22Average P/BV : 4.45Average Dividend Yield : 1.17Annual Portfolio Turnover Ratio : 1.83 times
Portfolio turnover has been computed as the ratio of the higher value of average purchase and averagesales, to the average net assets in the past one year (since inception for schemes that have notcompleted a year). The figures are not netted for derivative transactions.^ Risk-free rate based on the last 3 month T-Bill cut-off.
Past performance may or may not be sustained in future. Assume Rs. 1000 invested every month. Thehigh level of returns come from the sharp appreciation in market, in the year 2002, 2004 & 2006.
Std Dev : 5.86%Sharpe Ratio^ : 0.53Portfolio Beta : 0.99R squared : 0.89
PortfolioCompany/Issuer Mkt Value (Rs. Lakh) % to NAV
ICICI Prudential Growth PlanDiversified Fund
Snapshot:Fund Manager : Deven SangoiIndicative Investment Horizon: 5 years & moreInception date: 09-07-1998Fund Size: Rs. 481.17 croresNAV (As on 31-July-2007):Growth option : Rs. 104.83Dividend option : Rs. 23.50Institutional option-I : Rs. 13.99**Expense Ratio:Retail option : 2.28%Institutional option-I : 1.00%
**This is a close approximation of the number.
WHY SHOULD ONE INVEST?Long term investment of funds for capital appreciation
Performance Record *- Growth Option
Rs. 10000 invested at inception: Growth Plan Vs S & P CNX Nifty
CAGR – Growth Plan : 29.59%; Benchmark : 18.65%Past performance may or may not be sustained in future.
Sector Allocation*
*Returns < 1Year : Absolute, > 1Year : CAGR. Benchmark is S&P CNX Nifty.For computation of returns the allotment NAV has been taken as Rs. 10.00.Past performance may or may not be sustained in future. 31-Jul-04 was a nonbusiness day.
Style BoxFigures as on 31-July-2007
*Pertains to the equity investments only.
Auto 633.41 1.32%Maruti Udyog Ltd 633.41 1.32%Banks 6,442.90 13.38%
• ICICI Bank Ltd 2,094.25 4.35%• State Bank of India Ltd 1,724.20 3.58%• Punjab National Bank 1,522.76 3.16%
HDFC Bank Limited 1,059.00 2.20%HDFC Bank Limited-Futures 42.69 0.09%Cement 2,445.93 5.09%
• Grasim Industries Ltd 1,513.57 3.15%Gujarat Ambuja Cement Ltd 932.36 1.94%Consumer Non-Durable 1,582.57 3.29%
• ITC Limited 1,582.57 3.29%Ferrous Metals 1,693.42 3.52%Tata Steel Ltd 939.13 1.95%Steel Authority of India Ltd 754.29 1.57%Industrial Capital Goods 4,910.48 10.21%
• Bharat Heavy Electricals Ltd 1,920.36 3.99%• Larsen & Toubro Ltd 1,528.04 3.18%
Bharat Electonics Ltd 1,462.08 3.04%Industrial Products 1,050.89 2.18%Cummins India Ltd 1,050.89 2.18%Media & Entertainment 1,391.95 2.89%Zee Entertainment Enterprises Ltd 1,391.95 2.89%Non-Ferrous Metals 825.13 1.71%Sterlite Industries (India) Limited 825.13 1.71%Oil 2,361.84 4.91%
• Oil & Natural Gas Company Ltd 2,361.84 4.91%Pesticides 1,294.08 2.69%United Phosphorus Ltd 1,294.08 2.69%Petroleum Products 4,203.15 8.74%
• Reliance Industries Ltd 4,203.15 8.74%Pharmaceuticals 2,033.19 4.23%Sun Pharmaceutical Industries Ltd 1,081.59 2.25%Ranbaxy Laboratories Ltd 951.60 1.98%Software 4,938.11 10.27%Tata Consultancy Services Ltd 1,379.30 2.87%Infosys Technologies Ltd 1,378.63 2.87%HCL Technologies Limited 1,159.88 2.41%Wipro Ltd 1,020.30 2.12%Telecom Services 4,551.70 9.46%
• Bharati Airtel Ltd. 3,102.49 6.45%Reliance Communications Ventures Ltd 1,449.21 3.01%Transportation 1,328.48 2.76%Containers Corporation of India Ltd 1,328.48 2.76%Nifty Futures 1,577.85 3.28%CPs, CDs and Term Deposits 3,260.00 6.78%ICICI Bank Ltd 3,260.00 6.78%Cash, Call, CBLO & Reverse Repo 2,235.39 4.65%Other Current Assets (643.71) -1.36%Total Net Assets 48,116.76 100.00%
• Top Ten Holdings
10.41%
41.97%47.41%
43.04%
29.59%
10.93%
44.08%40.47%
36.39%
18.65%
0.00%5.00%
10.00%15.00%20.00%25.00%30.00%35.00%40.00%45.00%50.00%
Last 6Months
Last 1year
Last 3years
Last 5years
SinceInception
Growth Plan S&P CNX Nifty
Rs 104830.00
Rs 47123.98
8,365
28,365
48,365
68,365
88,365
108,365
128,365
Jul-9
8
Feb-
99
Sep-
99
Apr-0
0
Nov
-00
Jun-
01
Jan-
02
Aug-
02
Mar
-03
Oct
-03
May
-04
Dec-
04
Jul-0
5
Feb-
06
Sep-
06
Apr-0
7
Growth Plan S&P CNX Nifty
13.38%
10.27%
10.21%
9.46%
8.74%
5.09%
4.91%
4.23%
3.52%
3.29%
2.89%
2.76%
2.69%
2.18%
1.71%
1.32%
0.00% 4.00% 8.00% 12.00% 16.00%
Banks
Software
Industrial Capital Goods
Telecom Services
Petroleum Products
Cement
Oil
Pharmaceuticals
Ferrous Metals
Consumer Non-Durable
Media & Entertainment
Transportation
Pesticides
Industrial Products
Non-Ferrous Metals
Auto
12
SIP Returns: As on 31-July-2007
Period SIP Start Date Total Amount Total No. Market Value SIPInvested of Units Returns
1 Year SIP 31-Aug-06 12,000.00 654.44 14,934.32 58.05%Since Inception 31-Aug-05 24,000.00 1,636.24 37,339.00 53.61%
Past performance may or may not be sustained in future. Assume Rs. 1000 invested every month.The high level of returns come from the sharp appreciation in market, in the years 2005 & 2006.
Fund Manager's Comment
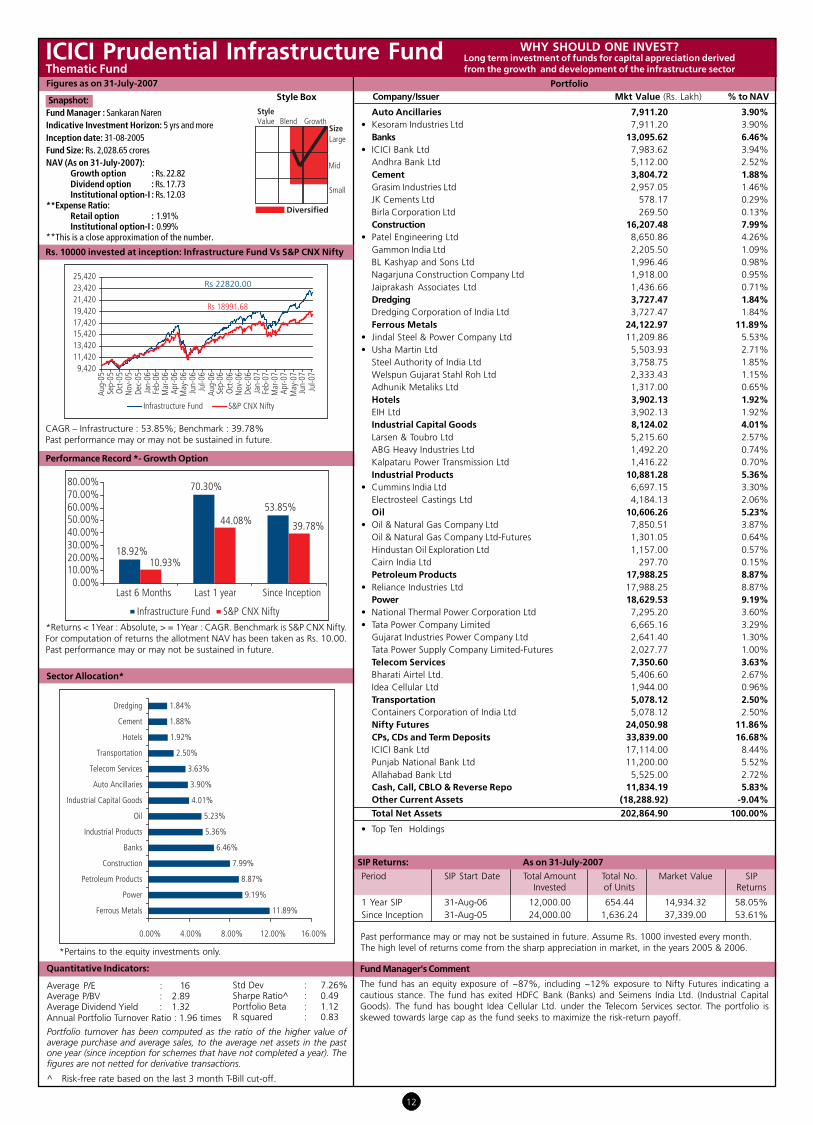
The fund has an equity exposure of ~87%, including ~12% exposure to Nifty Futures indicating acautious stance. The fund has exited HDFC Bank (Banks) and Seimens India Ltd. (Industrial CapitalGoods). The fund has bought Idea Cellular Ltd. under the Telecom Services sector. The portfolio isskewed towards large cap as the fund seeks to maximize the risk-return payoff.
Sector Allocation*
Performance Record *- Growth Option
*Returns < 1Year : Absolute, > = 1Year : CAGR. Benchmark is S&P CNX Nifty.For computation of returns the allotment NAV has been taken as Rs. 10.00.Past performance may or may not be sustained in future.
Quantitative Indicators:
Average P/E : 16Average P/BV : 2.89Average Dividend Yield : 1.32Annual Portfolio Turnover Ratio : 1.96 times
Portfolio turnover has been computed as the ratio of the higher value ofaverage purchase and average sales, to the average net assets in the pastone year (since inception for schemes that have not completed a year). Thefigures are not netted for derivative transactions.
ICICI Prudential Infrastructure FundThematic Fund
Snapshot:Fund Manager : Sankaran NarenIndicative Investment Horizon: 5 yrs and moreInception date: 31-08-2005Fund Size: Rs. 2,028.65 croresNAV (As on 31-July-2007):
Growth option : Rs. 22.82Dividend option : Rs. 17.73Institutional option-I : Rs. 12.03
**Expense Ratio:Retail option : 1.91%Institutional option-I : 0.99%
**This is a close approximation of the number.
Style BoxFigures as on 31-July-2007
*Pertains to the equity investments only.
WHY SHOULD ONE INVEST?Long term investment of funds for capital appreciation derivedfrom the growth and development of the infrastructure sector
Std Dev : 7.26%Sharpe Ratio^ : 0.49Portfolio Beta : 1.12R squared : 0.83
^ Risk-free rate based on the last 3 month T-Bill cut-off.
PortfolioCompany/Issuer Mkt Value (Rs. Lakh) % to NAV
Auto Ancillaries 7,911.20 3.90%• Kesoram Industries Ltd 7,911.20 3.90%
Banks 13,095.62 6.46%• ICICI Bank Ltd 7,983.62 3.94%
Andhra Bank Ltd 5,112.00 2.52%Cement 3,804.72 1.88%Grasim Industries Ltd 2,957.05 1.46%JK Cements Ltd 578.17 0.29%Birla Corporation Ltd 269.50 0.13%Construction 16,207.48 7.99%
• Patel Engineering Ltd 8,650.86 4.26%Gammon India Ltd 2,205.50 1.09%BL Kashyap and Sons Ltd 1,996.46 0.98%Nagarjuna Construction Company Ltd 1,918.00 0.95%Jaiprakash Associates Ltd 1,436.66 0.71%Dredging 3,727.47 1.84%Dredging Corporation of India Ltd 3,727.47 1.84%Ferrous Metals 24,122.97 11.89%
• Jindal Steel & Power Company Ltd 11,209.86 5.53%• Usha Martin Ltd 5,503.93 2.71%
Steel Authority of India Ltd 3,758.75 1.85%Welspun Gujarat Stahl Roh Ltd 2,333.43 1.15%Adhunik Metaliks Ltd 1,317.00 0.65%Hotels 3,902.13 1.92%EIH Ltd 3,902.13 1.92%Industrial Capital Goods 8,124.02 4.01%Larsen & Toubro Ltd 5,215.60 2.57%ABG Heavy Industries Ltd 1,492.20 0.74%Kalpataru Power Transmission Ltd 1,416.22 0.70%Industrial Products 10,881.28 5.36%
• Cummins India Ltd 6,697.15 3.30%Electrosteel Castings Ltd 4,184.13 2.06%Oil 10,606.26 5.23%
• Oil & Natural Gas Company Ltd 7,850.51 3.87%Oil & Natural Gas Company Ltd-Futures 1,301.05 0.64%Hindustan Oil Exploration Ltd 1,157.00 0.57%Cairn India Ltd 297.70 0.15%Petroleum Products 17,988.25 8.87%
• Reliance Industries Ltd 17,988.25 8.87%Power 18,629.53 9.19%
• National Thermal Power Corporation Ltd 7,295.20 3.60%• Tata Power Company Limited 6,665.16 3.29%
Gujarat Industries Power Company Ltd 2,641.40 1.30%Tata Power Supply Company Limited-Futures 2,027.77 1.00%Telecom Services 7,350.60 3.63%Bharati Airtel Ltd. 5,406.60 2.67%Idea Cellular Ltd 1,944.00 0.96%Transportation 5,078.12 2.50%Containers Corporation of India Ltd 5,078.12 2.50%Nifty Futures 24,050.98 11.86%CPs, CDs and Term Deposits 33,839.00 16.68%ICICI Bank Ltd 17,114.00 8.44%Punjab National Bank Ltd 11,200.00 5.52%Allahabad Bank Ltd 5,525.00 2.72%Cash, Call, CBLO & Reverse Repo 11,834.19 5.83%Other Current Assets (18,288.92) -9.04%Total Net Assets 202,864.90 100.00%
• Top Ten Holdings
Rs. 10000 invested at inception: Infrastructure Fund Vs S&P CNX Nifty
CAGR – Infrastructure : 53.85%; Benchmark : 39.78%Past performance may or may not be sustained in future.
18.92%
70.30%
53.85%
10.93%
44.08% 39.78%
0.00%10.00%20.00%30.00%40.00%50.00%60.00%70.00%80.00%
Last 6 Months Last 1 year Since Inception
Infrastructure Fund S&P CNX Nifty
Rs 22820.00
Rs 18991.68
9,42011,42013,42015,42017,42019,42021,42023,42025,420
Aug-
05Se
p-05
Oct
-05
Nov
-05
Dec-
05Ja
n-06
Feb-
06M
ar-0
6Ap
r-06
May
-06
Jun-
06Ju
l-06
Aug-
06Se
p-06
Oct
-06
Nov
-06
Dec-
06Ja
n-07
Feb-
07M
ar-0
7Ap
r-07
May
-07
Jun-
07Ju
l-07
Infrastructure Fund S&P CNX Nifty
11.89%
9.19%
8.87%
7.99%
6.46%
5.36%
5.23%
4.01%
3.90%
3.63%
2.50%
1.92%
1.88%
1.84%
0.00% 4.00% 8.00% 12.00% 16.00%
Ferrous Metals
Power
Petroleum Products
Construction
Banks
Industrial Products
Oil
Industrial Capital Goods
Auto Ancillaries
Telecom Services
Transportation
Hotels
Cement
Dredging

13
SIP Returns: As on 31-July-2007
Period SIP Start Date Total Amount Total No. Market Value SIPInvested of Units Returns
1 Year SIP 31-Aug-06 12,000.00 813.97 14,366.57 46.11%Since Inception 30-Nov-05 21,000.00 1,649.00 29,104.85 44.84%
Fund Manager's Comment
The fund maintained an average equity exposure of 86% during the month, indicating a cautious stance. Thefund has raised holding in Construction and Telecom Services sectors while exposure to Banks and Software isreduced. Fresh exposure is taken in Page Ind. Ltd. (Textile Products) and the fund has exited IDFC Ltd. (Finance).
Average P/E : 23Average P/BV : 4.06Average Dividend Yield : 0.84Annual Portfolio Turnover Ratio : 1.14 times
Portfolio turnover has been computed as the ratio of the higher value of average purchase and averagesales, to the average net assets in the past one year (since inception for schemes that have not completeda year). The figures are not netted for derivative transactions.^ Risk-free rate based on the last 3 month T-Bill cut-off.
Quantitative Indicators:
PortfolioCompany/Issuer Mkt Value (Rs. Lakh) % to NAVSnapshot:
Fund Manager : Deven SangoiIndicative Investment Horizon: 5 yrs. & moreInception date: 30-11-2005Fund Size: Rs. 673.69 croresNAV (As on 31-July-2007):
Growth option : Rs. 17.65Dividend option : Rs. 16.00
**Expense Ratio: 2.21%**This is a close approximation of the number.
WHY SHOULD ONE INVEST?Long term investment of funds for capital appreciation derived
from the growth potential of the service industries sector
Auto Ancillaries 2,265.39 3.35%Automobile Corporation of Goa Ltd 1,329.89 1.97%Sundaram Clayton Ltd 669.93 0.99%Shivam Autotech Ltd 265.57 0.39%Banks 7,889.64 11.71%
• ICICI Bank Ltd 2,938.91 4.36%• Punjab National Bank 2,060.38 3.06%
Andhra Bank Ltd 1,266.62 1.88%HDFC Bank Limited 1,211.97 1.80%Union Bank of India Ltd 389.75 0.58%Bank of Baroda Ltd 22.01 0.03%Construction 7,832.36 11.62%
• Patel Engineering Ltd 2,426.72 3.60%Jaiprakash Associates Ltd 1,754.37 2.60%Orbit Corporation Ltd 1,743.75 2.59%Nagarjuna Construction Company Ltd 1,171.83 1.74%BL Kashyap and Sons Ltd 735.69 1.09%Finance 1,336.40 1.98%India Infoline Ltd 1,336.40 1.98%Healthcare Services 777.10 1.15%Vimta Labs Ltd 777.10 1.15%Industrial Capital Goods 3,742.71 5.56%
• Bharti Shipyard Ltd 1,782.11 2.65%Bharat Electonics Ltd 1,317.05 1.95%Siemens India Limited-Futures 643.55 0.96%Industrial Products 2,113.62 3.14%
• Jain Irrigation Systems Ltd 2,113.62 3.14%Media & Entertainment 6,077.73 9.02%
• Jagran Prakashan Pvt Ltd 1,958.96 2.91%• Deccan Chronicle Holdings Ltd 1,771.88 2.63%
Zee Entertainment Enterprises Ltd 1,726.18 2.56%Television Eighteen India Ltd. 620.71 0.92%Pesticides 988.07 1.47%United Phosphorus Ltd 988.07 1.47%Pharmaceuticals 6,264.83 9.29%Dishman Pharmaceuticals & Chemicals Ltd 1,733.38 2.57%Dr. Reddy’s Laboratories Ltd 1,724.62 2.56%Lupin Ltd 811.50 1.20%Indoco Remedies Ltd 575.59 0.85%Sun Pharmaceutical Industries Ltd 547.47 0.81%Plethico Pharmaceuticals Ltd 450.48 0.67%Elder Pharmaceuticals Ltd 421.79 0.63%Power 1,355.40 2.01%PTC India Ltd 1,355.40 2.01%Software 6,460.35 9.59%
• Nucleus Software Exports Ltd 2,183.15 3.24%Infotech Enterprises Ltd 1,082.79 1.61%Tata Consultancy Services Ltd 955.38 1.42%3i Infotech Ltd 870.99 1.29%Financial Technologies Ltd 714.24 1.06%MphasiS Ltd 653.80 0.97%Telecom Services 6,338.39 9.40%
• Bharati Airtel Ltd. 3,216.93 4.78%Idea Cellular Ltd 1,296.00 1.92%Avaya Global Connect Ltd 1,175.37 1.74%Reliance Communications Ventures Ltd 650.09 0.96%Textiles - Products 3,534.69 5.24%
• Aditya Birla Nuvo Ltd 1,874.29 2.78%Gokaldas Exports Ltd 1,152.34 1.71%Page Industries Ltd 508.06 0.75%Transportation 1,232.85 1.83%Containers Corporation of India Ltd 1,232.85 1.83%CPs, CDs and Term Deposits 5,288.00 7.85%ICICI Bank Ltd 5,088.00 7.55%Allahabad Bank Ltd 200.00 0.30%Cash, Call, CBLO & Reverse Repo 2,810.47 4.17%Other Current Assets 1,060.77 1.62%Total Net Assets 67,368.77 100.00%
• Top Ten Holdings
Performance Record *- Growth Option
Sector Allocation*
*Returns >= 1 Year are CAGR, < 1 Year are Absolute. Benchmark is S&P CNXNifty. For computation of returns the allotment NAV has been taken asRs. 10.00. Past performance may or may not be sustained in future.
*Pertains to the equity investments only.
Figures as on 31-July-2007
ICICI Prudential Services Industries FundThematic Fund
Style Box
Std Dev : 5.93%Sharpe Ratio^ : 0.45Portfolio Beta : 0.77R squared : 0.47
Rs. 10000 invested at inception: Services Industries Fund Vs S&P CNX Nifty
CAGR – Service Industries : 40.65%; Benchmark : 37.88%Past performance may or may not be sustained in future.
Past performance may or may not be sustained in future. Assume Rs. 1000 invested every month.The high level of returns come from the sharp appreciation in market, in the year 2006.
10.73%
74.93%
40.65%
10.93%
44.08%37.88%
0.00%10.00%20.00%30.00%40.00%50.00%60.00%70.00%80.00%
Last 6 Months Last 1 year Since Inception
Services Industries Fund S&P CNX Nifty
Rs 17650.00
Rs 17075.50
8,8109,810
10,81011,81012,81013,81014,81015,81016,81017,81018,810
Nov
-05
Dec-
05Ja
n-06
Feb-
06M
ar-0
6Ap
r-06
May
-06
Jun-
06Ju
l-06
Aug-
06Se
p-06
Oct
-06
Nov
-06
Dec-
06Ja
n-07
Feb-
07M
ar-0
7Ap
r-07
May
-07
Jun-
07Ju
l-07
Services Industries Fund S&P CNX Nifty
11.71%
11.62%
9.59%
9.40%
9.29%
9.02%
5.56%
5.24%
3.35%
3.14%
2.01%
1.98%
1.83%
1.47%
1.15%
0.00% 4.00% 8.00% 12.00% 16.00%
Banks
Construction
Software
Telecom Services
Pharmaceuticals
Media & Entertainment
Industrial Capital Goods
Textiles - Products
Auto Ancillaries
Industrial Products
Power
Finance
Transportation
Pesticides
Healthcare Services

14
PortfolioCompany/Issuer Mkt Value (Rs. Lakh) % to NAV
ICICI Prudential FMCG FundThematic Fund
Snapshot:
Fund Manager : Prashant KothariIndicative Investment Horizon: 5 yrs & moreInception date: 31-03-1999Fund Size: Rs. 76.48 croresNAV (As on 31-July-2007):
Growth option : Rs. 44.05Dividend option : Rs. 33.04
**Expense Ratio: 2.50%
**This is a close approximation of the number.
WHY SHOULD ONE INVEST?Long term investment of funds for capital appreciation in FMCG sector
Performance Record* - Growth Option
Rs. 10000 invested at inception: FMCG Vs CNX FMCG Index
CAGR – FMCG : 19.46%; Benchmark : 6.37%Past performance may or may not be sustained in future.
*Returns < 1Year : Absolute, > = 1Year : CAGR. Benchmark is CNX FMCGIndex. For computation of returns the allotment NAV has been taken asRs. 10.00. Past performance may or may not be sustained in future.31-Jul-04 was a non business day.
SIP Returns: As on 31-July-2007
Period SIP Start Date Total Amount Total No. Market Value SIPInvested of Units Returns
1 Year SIP 31-Aug-06 12,000.00 298.51 13,149.37 21.63%
3 Year SIP 31-Aug-04 36,000.00 1,381.28 60,845.38 39.34%
5 Year SIP 30-Aug-02 60,000.00 3,932.82 173,240.72 45.29%
Since Inception 31-Mar-99 101,000.00 8,187.61 360,664.22 29.61%
Average P/E : 35Average P/BV : 4.95Average Dividend Yield : 2.27Annual Portfolio Turnover Ratio : 0.91 times
Consumer Non-Durable 5,569.53 72.81%• ICI India Ltd 1,371.55 17.93%• Marico Industries Ltd 926.29 12.11%• Gillette India Ltd 777.96 10.17%• Pidilite Industries Ltd 565.23 7.39%• Proctor & Gamble Hygiene and Healthcare Limited 479.54 6.27%• Asian Paints Ltd 452.59 5.92%• ITC Limited 311.86 4.08%
ITC Limited-Futures 265.63 3.47%Hindustan Lever Ltd 167.47 2.19%Radico Khaitan Ltd 161.63 2.11%Emami Ltd 89.78 1.17%Retailing 1,502.38 19.64%
• Pantaloon Retail (India) Ltd 809.98 10.59%• Trent Ltd 692.40 9.05%
Textiles - Products 417.40 5.46%• Page Industries Ltd 417.40 5.46%
CPs, CDs and Term Deposits 180.00 2.35%ICICI Bank Ltd 180.00 2.35%Cash, Call, CBLO & Reverse Repo 180.54 2.36%Other Current Assets (202.30) -2.62%Total Net Assets 7,647.55 100.00%
• Top Ten Holdings
Style Box
Figures as on 31-July-2007
*Pertains to the equity investments only.
Portfolio turnover has been computed as the ratio of the higher value of average purchase and averagesales, to the average net assets in the past one year (since inception for schemes that have not completeda year). The figures are not netted for derivative transactions.
^ Risk-free rate based on the last 3 month T-Bill cut-off.
Past performance may or may not be sustained in future. Assume Rs. 1000 invested every month. Thehigh level of returns come from the sharp appreciation in market, in the year 2002, 2004 & 2006.
Std Dev : 6.54%Sharpe Ratio^ : 0.55Portfolio Beta : 0.69R squared : 0.52
5.86%
33.12%
55.37%
40.04%
19.46%
3.74%7.11%
34.17%
20.43%
6.37%
0.00%
10.00%
20.00%30.00%
40.00%
50.00%
60.00%
Last 6Months
Last 1year
Last 3years
Last 5years
SinceInception
FMCG Fund CNX FMCG Index
Rs 44050.00
Rs 16730.67
5,85310,85315,85320,85325,85330,85335,85340,85345,85350,853
Mar
-99
Sep-
99
Mar
-00
Sep-
00
Mar
-01
Sep-
01
Mar
-02
Sep-
02
Mar
-03
Sep-
03
Mar
-04
Sep-
04
Mar
-05
Sep-
05
Mar
-06
Sep-
06
Mar
-07
FMCG Fund CNX FMCG Index
72.81%
19.64%
5.46%
0.00% 20.00% 40.00% 60.00% 80.00%
Consumer Non-
Durable
Retailing
Textiles - Products
Sector Allocation* Quantitative Indicators:
15
Quantitative Indicators:
PortfolioCompany/Issuer Mkt Value (Rs. Lakh) % to NAV
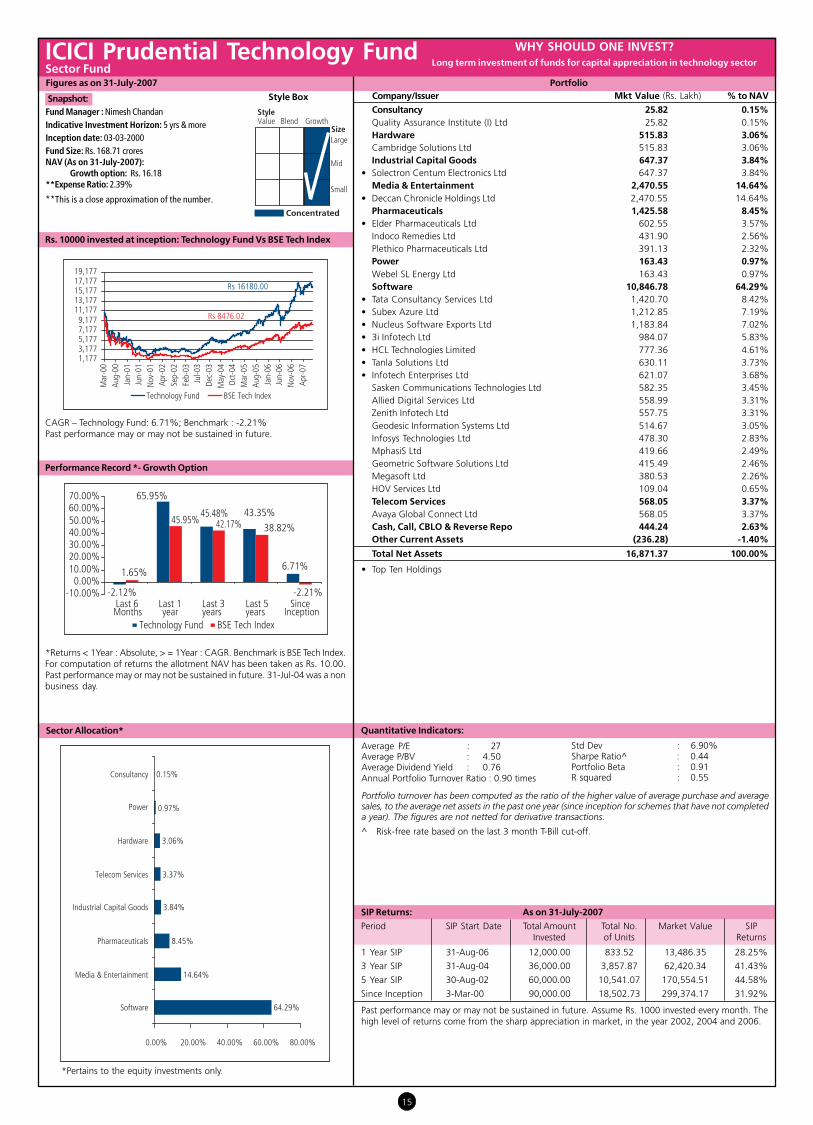
ICICI Prudential Technology FundSector Fund
Snapshot:Fund Manager : Nimesh ChandanIndicative Investment Horizon: 5 yrs & moreInception date: 03-03-2000Fund Size: Rs. 168.71 croresNAV (As on 31-July-2007):
Growth option: Rs. 16.18**Expense Ratio: 2.39%
**This is a close approximation of the number.
WHY SHOULD ONE INVEST?Long term investment of funds for capital appreciation in technology sector
Consultancy 25.82 0.15%Quality Assurance Institute (I) Ltd 25.82 0.15%Hardware 515.83 3.06%Cambridge Solutions Ltd 515.83 3.06%Industrial Capital Goods 647.37 3.84%
• Solectron Centum Electronics Ltd 647.37 3.84%Media & Entertainment 2,470.55 14.64%
• Deccan Chronicle Holdings Ltd 2,470.55 14.64%Pharmaceuticals 1,425.58 8.45%
• Elder Pharmaceuticals Ltd 602.55 3.57%Indoco Remedies Ltd 431.90 2.56%Plethico Pharmaceuticals Ltd 391.13 2.32%Power 163.43 0.97%Webel SL Energy Ltd 163.43 0.97%Software 10,846.78 64.29%
• Tata Consultancy Services Ltd 1,420.70 8.42%• Subex Azure Ltd 1,212.85 7.19%• Nucleus Software Exports Ltd 1,183.84 7.02%• 3i Infotech Ltd 984.07 5.83%• HCL Technologies Limited 777.36 4.61%• Tanla Solutions Ltd 630.11 3.73%• Infotech Enterprises Ltd 621.07 3.68%
Sasken Communications Technologies Ltd 582.35 3.45%Allied Digital Services Ltd 558.99 3.31%Zenith Infotech Ltd 557.75 3.31%Geodesic Information Systems Ltd 514.67 3.05%Infosys Technologies Ltd 478.30 2.83%MphasiS Ltd 419.66 2.49%Geometric Software Solutions Ltd 415.49 2.46%Megasoft Ltd 380.53 2.26%HOV Services Ltd 109.04 0.65%Telecom Services 568.05 3.37%Avaya Global Connect Ltd 568.05 3.37%Cash, Call, CBLO & Reverse Repo 444.24 2.63%Other Current Assets (236.28) -1.40%
Total Net Assets 16,871.37 100.00%
• Top Ten Holdings
Performance Record *- Growth Option
Rs. 10000 invested at inception: Technology Fund Vs BSE Tech Index
CAGR – Technology Fund: 6.71%; Benchmark : -2.21%Past performance may or may not be sustained in future.
Sector Allocation*
*Returns < 1Year : Absolute, > = 1Year : CAGR. Benchmark is BSE Tech Index.For computation of returns the allotment NAV has been taken as Rs. 10.00.Past performance may or may not be sustained in future. 31-Jul-04 was a nonbusiness day.
SIP Returns: As on 31-July-2007
Period SIP Start Date Total Amount Total No. Market Value SIPInvested of Units Returns
1 Year SIP 31-Aug-06 12,000.00 833.52 13,486.35 28.25%
3 Year SIP 31-Aug-04 36,000.00 3,857.87 62,420.34 41.43%
5 Year SIP 30-Aug-02 60,000.00 10,541.07 170,554.51 44.58%
Since Inception 3-Mar-00 90,000.00 18,502.73 299,374.17 31.92%
Average P/E : 27Average P/BV : 4.50Average Dividend Yield : 0.76Annual Portfolio Turnover Ratio : 0.90 times
Style Box
*Pertains to the equity investments only.
Portfolio turnover has been computed as the ratio of the higher value of average purchase and averagesales, to the average net assets in the past one year (since inception for schemes that have not completeda year). The figures are not netted for derivative transactions.
^ Risk-free rate based on the last 3 month T-Bill cut-off.
Figures as on 31-July-2007
Past performance may or may not be sustained in future. Assume Rs. 1000 invested every month. Thehigh level of returns come from the sharp appreciation in market, in the year 2002, 2004 and 2006.
Std Dev : 6.90%Sharpe Ratio^ : 0.44Portfolio Beta : 0.91R squared : 0.55
-2.12%
65.95%
45.48% 43.35%
6.71%1.65%
45.95% 42.17% 38.82%
-2.21%-10.00%0.00%
10.00%20.00%30.00%40.00%50.00%60.00%70.00%
Last 6Months
Last 1year
Last 3years
Last 5years
SinceInception
Technology Fund BSE Tech Index
Rs 16180.00
Rs 8476.02
1,1773,1775,1777,1779,177
11,17713,17715,17717,17719,177
Mar
-00
Aug-
00Ja
n-01
Jun-
01N
ov-0
1Ap
r-02
Sep-
02Fe
b-03
Jul-0
3De
c-03
May
-04
Oct
-04
Mar
-05
Aug-
05Ja
n-06
Jun-
06N
ov-0
6Ap
r-07
Technology Fund BSE Tech Index
64.29%
14.64%
8.45%
3.84%
3.37%
3.06%
0.97%
0.15%
0.00% 20.00% 40.00% 60.00% 80.00%
Software
Media & Entertainment
Pharmaceuticals
Industrial Capital Goods
Telecom Services
Hardware
Power
Consultancy

16
SIP Returns: As on 31-July-2007Period SIP Start Date Total Amount Total No. Market Value SIP
Invested of Units Returns1 Year SIP 31-Aug-06 12,000.00 342.44 13,866.05 35.85%3 Year SIP 31-Aug-04 36,000.00 1,532.44 62,051.41 40.95%5 Year SIP 30-Aug-02 60,000.00 3,763.08 152,374.26 39.51%Since Inception 26-Feb-02 67,000.00 4,529.02 183,388.62 37.61%
PortfolioCompany/Issuer Mkt Value (Rs. Lakh) % to NAV
ICICI Prudential Index FundIndex Fund
Snapshot:Fund Manager : Yogesh BhattIndicative Investment Horizon: 5 yrs & moreInception date: 26-02-2002Fund Size: Rs. 13.92 croresNAV (As on 31-July-2007): Rs. 40.4919**Expense Ratio: 1.25%
**This is a close approximation of the number.
WHY SHOULD ONE INVEST?Long term investment of funds for capital appreciation
by replicating S&P CNX Nifty index
Auto 60.64 4.35%Tata Motors Ltd 15.34 1.10%Maruti Udyog Ltd 13.89 1.00%Bajaj Auto Ltd 13.56 0.97%Mahindra & Mahindra Ltd 10.19 0.73%Hero Honda Ltd 7.66 0.55%Banks 135.72 9.74%
• ICICI Bank Ltd 56.03 4.02%• State Bank of India Ltd 48.67 3.50%
HDFC Bank Limited 21.78 1.56%Punjab National Bank 9.24 0.66%Cement 38.12 2.74%Grasim Industries Ltd 15.41 1.11%Gujarat Ambuja Cement Ltd 11.38 0.82%Associated Cement Companies Ltd 11.33 0.81%Chemicals 6.40 0.46%Indian Petrochemicals Corporation Ltd 6.40 0.46%Consumer Non-Durable 67.74 4.87%ITC Limited 36.62 2.63%Hindustan Lever Ltd 25.97 1.87%Dabur India Ltd 5.15 0.37%Ferrous Metals 58.10 4.17%Steel Authority of India Ltd 35.35 2.54%Tata Steel Ltd 22.75 1.63%Finance 28.93 2.08%HDFC Ltd 28.93 2.08%Gas 16.28 1.17%Gas Authority of India Ltd 16.28 1.17%Industrial Capital Goods 137.19 9.85%
• Bharat Heavy Electricals Ltd 48.12 3.46%• Larsen & Toubro Ltd 42.12 3.03%
Suzlon Energy Ltd 20.81 1.49%ABB Ltd 13.83 0.99%Siemens India Limited 12.31 0.88%Media & Entertainment 8.10 0.58%Zee Entertainment Enterprises Ltd 8.10 0.58%Non-Ferrous Metals 42.13 3.02%Sterlite Industries (India) Limited 20.67 1.48%Hindalco Industries Ltd 11.88 0.85%National Aluminium Company Limited 9.58 0.69%Oil 110.37 7.92%
• Oil & Natural Gas Company Ltd-Futures 71.04 5.10%Oil & Natural Gas Company Ltd 39.33 2.82%Petroleum Products 190.40 13.67%
• Reliance Industries Ltd 178.81 12.84%Bharat Petroleum Corporation Ltd 6.61 0.47%Hindustan Petroleum Corporation Ltd 4.98 0.36%Pharmaceuticals 38.77 2.79%Sun Pharmaceutical Industries Ltd 10.41 0.75%Cipla Ltd 8.45 0.61%Ranbaxy Laboratories Ltd 8.28 0.59%Dr. Reddy’s Laboratories Ltd 6.06 0.44%Glaxo Smithkline Pharma Ltd 5.57 0.40%Power 18.62 1.34%Reliance Energy Ltd 10.33 0.74%Tata Power Company Limited 8.29 0.60%Software 200.05 14.37%
• Tata Consultancy Services Ltd 64.43 4.63%• Infosys Technologies Ltd 64.21 4.61%
Wipro Ltd 41.31 2.97%Satyam Computer Services Ltd 18.26 1.31%HCL Technologies Limited 11.84 0.85%Telecom Services 175.17 12.58%
• Bharati Airtel Ltd. 97.30 6.99%• Reliance Communications Ventures Ltd 65.06 4.67%
Videsh Sanchar Nigam Ltd 7.41 0.53%Mahanagar Telephone Nigam Ltd 5.40 0.39%Nifty Futures 51.84 3.72%Cash, Call, CBLO & Reverse Repo 119.68 8.60%Other Current Assets (111.92) -8.02%Total Net Assets 1,392.33 100.00%
• Top Ten Holdings
Performance Record *- Cumulative Option
Rs. 10000 invested at inception: Index Fund Vs S&P CNX Nifty
CAGR – Index Fund : 29.39%; Benchmark : 27.93%Past performance may or may not be sustained in future.
Sector Allocation*
*Returns >= 1 Year are CAGR, < 1 Year are Absolute. Benchmark is S&P CNXNifty. For computation of returns the allotment NAV has been taken asRs. 10.00. Past performance may or may not be sustained in future.31-Jul-04 was a non business day.
Quantitative Indicators:
Average P/E : 25Average P/BV : 4.24Average Dividend Yield : 1.25Annual Portfolio Turnover Ratio : 2.93 times
*Pertains to the equity investments only.
Portfolio turnover has been computed as the ratio of the higher value of average purchase and averagesales, to the average net assets in the past one year (since inception for schemes that have not completeda year). The figures are not netted for derivative transactions.
^ Risk-free rate based on the last 3 month T-Bill cut-off.
Figures as on 31-July-2007
Past performance may or may not be sustained in future. Assume Rs. 1000 invested every month. Thehigh level of returns come from the sharp appreciation in market, in the year 2002, 2004 & 2006.
Std Dev : 5.62%Sharpe Ratio^ : 0.50Portfolio Beta : 1.01R squared : 1.00
11.95%
45.03%43.25% 37.64%
29.39%
10.93%
44.08%40.47% 36.39%
27.93%
0.00%5.00%
10.00%15.00%20.00%25.00%30.00%35.00%40.00%45.00%50.00%
Last 6Months
Last 1year
Last 3years
Last 5years
SinceInception
Index Fund S&P CNX Nifty
Rs 40491.90
Rs 38076.76
7,70812,70817,70822,70827,70832,70837,70842,70847,708
Feb-
02M
ay-0
2Au
g-02
Nov
-02
Feb-
03M
ay-0
3Au
g-03
Nov
-03
Feb-
04M
ay-0
4Au
g-04
Nov
-04
Feb-
05M
ay-0
5Au
g-05
Nov
-05
Feb-
06M
ay-0
6Au
g-06
Nov
-06
Feb-
07M
ay-0
7
Index Fund S&P CNX Nifty
14.37%
13.67%
12.58%
9.85%
9.74%
7.92%
4.87%
4.35%
4.17%
3.02%
2.79%
2.74%
2.08%
1.34%
1.17%
0.58%
0.46%
0.00% 4.00% 8.00% 12.00% 16.00%
Software
Petroleum Products
Telecom Services
Industrial Capital
Banks
Oil
Consumer Non-Durable
Auto
Ferrous Metals
Non-Ferrous Metals
Pharmaceuticals
Cement
Finance
Power
Gas
Media & Entertainment
Chemicals

17
Quantitative Indicators:
Average P/E : 22Average P/BV : 4.39Average Dividend Yield : 1.14Annual Portfolio Turnover Ratio : 0.53 times
Portfolio
SPIcE FundIndex Fund
Snapshot:Fund Manager : Yogesh BhattInvestment Horizon: 5 years & moreInception date: 10-01-2003Fund Size: Rs. 0.86 croresNAV (As on 31-July-2007): Rs. 159.7160**Expense Ratio: 0.80%
**This is a close approximation of the number.
WHY SHOULD ONE INVEST?Long term investment of funds for capital appreciation by replicating the BSE Sensitive Index
Auto 4.63 5.39%
Bajaj Auto Ltd 1.35 1.57%
Tata Motors Ltd 1.32 1.54%
Mahindra & Mahindra Ltd 1.17 1.36%
Maruti Udyog Ltd 0.79 0.92%
Banks 13.70 15.96%
• ICICI Bank Ltd 8.05 9.38%
• State Bank of India Ltd 3.14 3.66%
HDFC Bank Limited 2.51 2.92%
Cement 3.79 4.41%
Grasim Industries Ltd 1.66 1.93%
Gujarat Ambuja Cement Ltd 1.15 1.34%
Associated Cement Companies Ltd 0.98 1.14%
Consumer Non-Durable 5.54 6.46%
• ITC Limited 3.68 4.29%
Hindustan Lever Ltd 1.86 2.17%
Ferrous Metals 2.29 2.67%
Tata Steel Ltd 2.29 2.67%
Finance 3.75 4.37%
• HDFC Ltd 3.75 4.37%
Industrial Capital Goods 7.84 9.13%
• Larsen & Toubro Ltd 5.42 6.31%
Bharat Heavy Electricals Ltd 2.42 2.82%
Non-Ferrous Metals 1.29 1.50%
Hindalco Industries Ltd 1.29 1.50%
Oil 3.20 3.73%
• Oil & Natural Gas Company Ltd 3.20 3.73%
Petroleum Products 10.79 12.57%
• Reliance Industries Ltd 10.79 12.57%
Pharmaceuticals 2.27 2.65%
Ranbaxy Laboratories Ltd 0.83 0.97%
Cipla Ltd 0.79 0.92%
Dr. Reddy’s Laboratories Ltd 0.65 0.76%
Power 2.71 3.16%
National Thermal Power Corporation Ltd 1.68 1.96%
Reliance Energy Ltd 1.03 1.20%
Software 13.39 15.58%
• Infosys Technologies Ltd 7.85 9.14%
Satyam Computer Services Ltd 2.51 2.92%
Tata Consultancy Services Ltd 1.85 2.15%
Wipro Ltd 1.18 1.37%
Telecom Services 8.18 9.53%
• Bharati Airtel Ltd. 4.91 5.72%
• Reliance Communications Ventures Ltd 3.27 3.81%
Cash, Call, CBLO & Reverse Repo 6.09 7.09%
Other Current Assets (3.61) -4.20%
Total Net Assets 85.85 100.00%• Top Ten Holdings
Performance Record* - Growth Option
Rs. 10000 invested at inception: SPICE Vs BSE Sensitive Index
CAGR – SPIcE Fund : 40.81%; Benchmark : 39.98%Past performance may or may not be sustained in future.
Sector Allocation*
*Returns < 1Year : Absolute, > = 1Year : CAGR. Benchmark is BSE SENSEXIndex.For computation of returns the allotment NAV has been taken asRs. 10.00. Past performance may or may not be sustained in future.31-Jul-04 was a non business day.
Company/Issuer Mkt Value (Rs. Lakh) % to NAV
*Pertains to the equity investments only.
Portfolio turnover has been computed as the ratio of the higher value of average purchase and averagesales, to the average net assets in the past one year (since inception for schemes that have not completeda year). The figures are not netted for derivative transactions.
^ Risk-free rate based on the last 3 month T-Bill cut-off.
Figures as on 31-July-2007
Std Dev : 5.41%Sharpe Ratio^ : 0.54Portfolio Beta : 0.99R squared : 1.00
10.66%
44.86%44.70% 40.81%
10.36%
44.74% 44.30%39.98%
0.00%5.00%
10.00%15.00%20.00%25.00%30.00%35.00%40.00%45.00%50.00%
Last6 Months
Last1 year
Last3 years
SinceInception
SPIcE Fund BSE SENSEX
Rs 47548.68
Rs 46296.62
8,65513,65518,65523,65528,65533,65538,65543,65548,65553,655
Jan-
03Ap
r-03
Jul-0
3O
ct-0
3Ja
n-04
Apr-0
4Ju
l-04
Oct
-04
Jan-
05Ap
r-05
Jul-0
5O
ct-0
5Ja
n-06
Apr-0
6Ju
l-06
Oct
-06
Jan-
07Ap
r-07
Jul-0
7
SPIcE Fund BSE SENSEX
15.96%
15.59%
12.57%
9.53%
9.13%
6.46%
5.39%
4.41%
4.37%
3.73%
3.16%
2.67%
2.65%
1.50%
0.00% 5.00% 10.00% 15.00% 20.00%
Banks
Software
Petroleum Products
Telecom Services
Industrial Capital Goods
Consumer Non-Durable
Auto
Cement
Finance
Oil
Power
Ferrous Metals
Pharmaceuticals
Non-Ferrous Metals

18
Quantitative Indicators – Debt Component Quantitative Indicators – Equity Component
Average Maturity : 3.32 yearsModified Duration : 2.11 yearsYield To Maturity : 7.69%
Average P/E : 26Average P/BV : 4.21Average Dividend Yield : 1.23
SIP Returns: As on 31-July-2007
Period SIP Start Date Total Amount Total No. Market Value SIPInvested of Units Returns
1 Year SIP 31-Aug-06 12,000.00 634.59 12,559.61 10.34%3 Year SIP 31-Aug-04 36,000.00 2,117.69 41,912.69 10.69%5 Year SIP 30-Aug-02 60,000.00 3,899.41 77,175.95 10.32%Since Inception 10-Nov-00 82,000.00 5,883.73 116,449.02 10.33%
Past performance may or may not be sustained in future. Assume Rs. 1000 invested every month.
ICICI Prudential Monthly Income Plan
Snapshot:Fund Managers: Equity : Prashant Kothari
Debt : Chaitanya PandeIndicative Investment Horizon: 1 yr & aboveInception date: 10-11-2000Fund Size: Rs. 573.32 croresNAV (As on 31-July-2007): Cumulative option : Rs. 19.7917**Expense Ratio: 1.95%**This is a close approximation of the number.
WHY SHOULD ONE INVEST?Medium term investment in a portfolio of debtand equity (upto 15%) for capital appreciation.
Rs. 10000 invested at inception*: MIP Vs Crisil MIP Blended Index
Performance Record* - Cumulative Option
Rating Profile (as % of debt holding)
*Benchmark start date : 31-03-2002. CAGR – MIP: 10.22%; Benchmark :9.38%. Benchmark is Crisil MIP Blended Index. Past performance may or maynot be sustained in future.
*Returns >= 1 Year are CAGR, < 1 Year are Absolute. Benchmark is Crisil MIPBlended Index. Start date: 31/3/02. For computation of returns the allotment NAVhas been taken as Rs. 10.00. Past performance may or may not be sustained infuture. 31-Jul-04 was a non business day.
Equity Holdings 8,843.97 15.42%Bharati Airtel Ltd. Telecom Services 752.42 1.31%ICICI Bank Ltd Banks 723.02 1.26%Tata Consultancy Services Ltd Software 536.99 0.94%ICI India Ltd Consumer Non-Durable 498.33 0.87%Deccan Chronicle Holdings Ltd Media & Entertainment 463.05 0.81%Bharati Airtel Ltd. -Futures Telecom Services 459.87 0.80%3i Infotech Ltd Software 442.88 0.77%ITC Limited Consumer Non-Durable 412.41 0.72%Pantaloon Retail (India) Ltd Retailing 402.41 0.70%Larsen & Toubro Ltd Industrial Capital Goods 359.62 0.63%Trent Ltd Retailing 339.22 0.59%Patel Engineering Ltd Construction 314.93 0.55%Andhra Bank Ltd Banks 281.16 0.49%Cadila Healthcare Ltd Pharmaceuticals 280.88 0.49%Infosys Technologies Ltd Software 260.83 0.45%Dr. Reddy’s Laboratories Ltd Pharmaceuticals 253.62 0.44%H.E.G. Ltd Industrial Products 229.00 0.40%Firstsource Solutions Ltd Software 224.42 0.39%Proctor & Gamble Hygiene and Healthcare Ltd Consumer Non-Durable 199.95 0.35%Aventis Pharma Ltd Pharmaceuticals 194.50 0.34%IVRCL Infrastructure & Projects Ltd Construction 193.28 0.34%Solectron Centum Electronics Ltd Industrial Capital Goods 175.83 0.31%Siemens India Limited Industrial Capital Goods 166.76 0.29%Sadbhav Engineering Ltd Construction 160.69 0.28%Ahluwalia Contractors Ltd Construction 158.52 0.28%Aditya Birla Nuvo Ltd Textiles - Products 148.12 0.26%Gujarat Apollo Equipments Ltd Industrial Capital Goods 93.77 0.16%Exide Industries Ltd Auto Ancillaries 76.17 0.13%Everonn Systems India Ltd Software 24.01 0.04%Simplex Projects Ltd Construction 9.21 0.02%ABG Heavy Industries Ltd Industrial Capital Goods 8.10 0.01%Debt Holdings 36,950.56 64.45%PSU/PFI Bonds 9,993.54 17.43%
• Power Finance Corporation Ltd AAA 4,954.86 8.64%• Infrastructure Development Finance Corporation AAA 2,469.76 4.31%
Indian Railway Finance Corporation AAA 1,060.47 1.85%Export Import Bank of India Ltd AAA 987.21 1.72%Powergrid Corporation Ltd AAA 521.24 0.91%Private Corporate Securities 6,212.44 10.84%
• PTC RPS Tata Teleservices AAA(SO) 1,726.72 3.01%• PTC Hero Motors Ltd A1+(SO) 1,200.00 2.09%
UTI Bank Ltd AAA 927.03 1.62%Tata Sons Ltd AAA 750.19 1.31%Sundaram Finance Ltd AAA 700.00 1.22%PTC Citi Fleet Trust Citibank AAA(SO) 549.01 0.96%HDFC Ltd AAA 313.14 0.55%PTC RTL Trust Centurion Bank AAA(SO) 33.09 0.06%India Infrastructure Developers Ltd A1+(SO) 13.26 0.02%Government Securities 3,188.00 5.56%
• 7.49% GOI 2017 Sovereign 2,440.25 4.26%8.33% GOI 2036 Sovereign 747.75 1.30%CPs, CDs and Term Deposits 12,812.00 22.34%ICICI Bank Ltd P1+ 9,112.00 15.89%Punjab National Bank Ltd P1+ 3,700.00 6.45%Cash, Call, CBLO & Reverse Repo 4,744.58 8.28%Other Current Assets 11,537.05 20.13%
Total Net Assets 57,331.58 100.00%• Top Five Holdings
PortfolioCompany/Issuer Sector/Rating Mkt Value (Rs. Lakh) % to NAV
Maturity Profile (as % of debt holding)
(An open ended fund. Monthly income is not assured and is subject to the availability of distributable surplus.)
% Unlisted Bonds : 20.24%
Figures as on 31-July-2007
Style Box:
Debt Equity
3.88%
12.00%10.91%
10.36%10.69%
4.94%
11.66%
9.49% 10.01%
0.00%2.00%4.00%6.00%8.00%
10.00%12.00%14.00%
Last 6Months
Last 1year
Last 3years
Last 5years
SinceInception
Monthly Income Plan Crisil MIP Blended index
Rs 16797.97
Rs 16125.51
9,82310,82311,82312,82313,82314,82315,82316,82317,823
Apr-0
2Ju
l-02
Oct
-02
Jan-
03Ap
r-03
Jul-0
3O
ct-0
3Ja
n-04
Apr-0
4Ju
l-04
Oct
-04
Jan-
05Ap
r-05
Jul-0
5O
ct-0
5Ja
n-06
Apr-0
6Ju
l-06
Oct
-06
Jan-
07Ap
r-07
Jul-0
7
Monthly Income Plan Crisil MIP Blended index
38.84%
23.86%
17.37%
7.58%
7.54%
4.80%
0.00% 10.00% 20.00% 30.00% 40.00% 50.00%
<182 days
Other Current Assets
3-5 years
1-3 years
5-10 years
> 10 years
AAA and Equivalent59.79%
Sovereign Securities6.57%
Call,Current Assets and
Reverse Repos33.64%
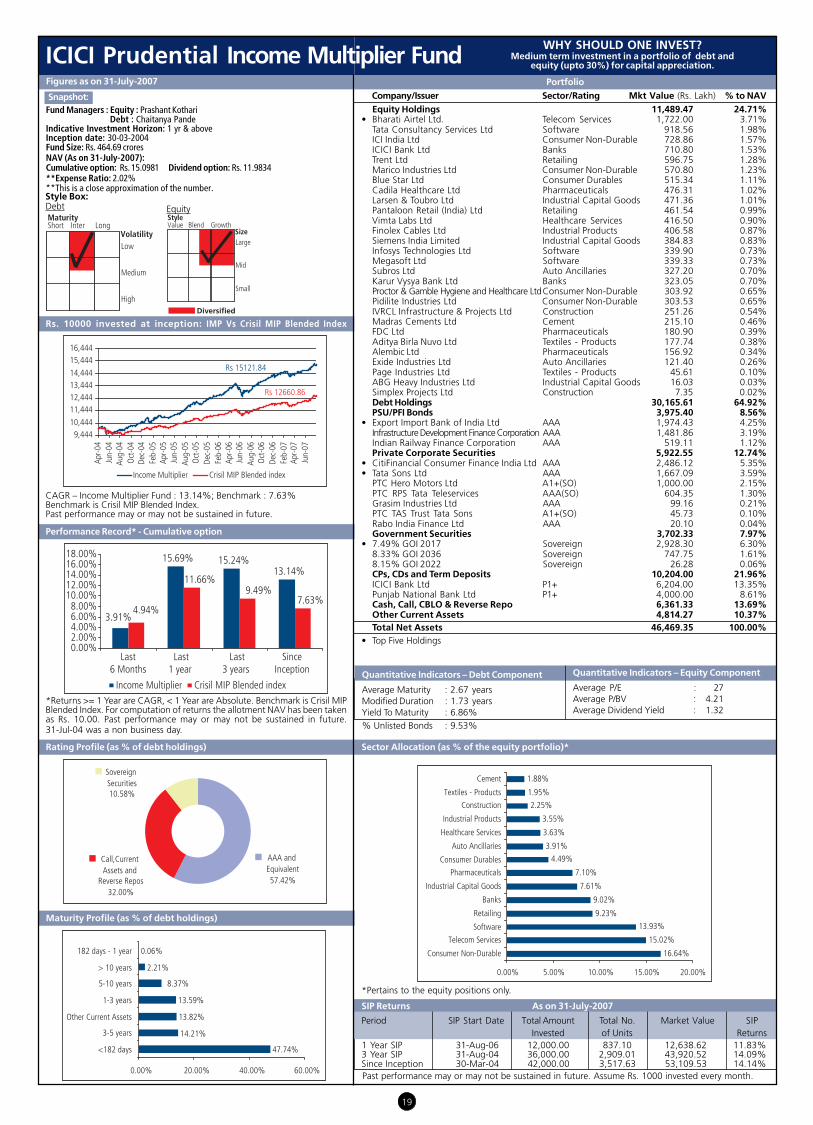
19
Performance Record* - Cumulative option
SIP Returns As on 31-July-2007
Period SIP Start Date Total Amount Total No. Market Value SIPInvested of Units Returns
1 Year SIP 31-Aug-06 12,000.00 837.10 12,638.62 11.83%3 Year SIP 31-Aug-04 36,000.00 2,909.01 43,920.52 14.09%Since Inception 30-Mar-04 42,000.00 3,517.63 53,109.53 14.14%
Sector Allocation (as % of the equity portfolio)*
Quantitative Indicators – Equity Component
Average P/E : 27Average P/BV : 4.21Average Dividend Yield : 1.32
Quantitative Indicators – Debt Component
Average Maturity : 2.67 yearsModified Duration : 1.73 yearsYield To Maturity : 6.86%% Unlisted Bonds : 9.53%
Rating Profile (as % of debt holdings)
ICICI Prudential Income Multiplier Fund
Snapshot:Fund Managers : Equity : Prashant Kothari
Debt : Chaitanya PandeIndicative Investment Horizon: 1 yr & aboveInception date: 30-03-2004Fund Size: Rs. 464.69 croresNAV (As on 31-July-2007):Cumulative option: Rs. 15.0981 Dividend option: Rs. 11.9834**Expense Ratio: 2.02%**This is a close approximation of the number.
WHY SHOULD ONE INVEST?Medium term investment in a portfolio of debt and
equity (upto 30%) for capital appreciation.
Rs. 10000 invested at inception: IMP Vs Crisil MIP Blended Index
CAGR – Income Multiplier Fund : 13.14%; Benchmark : 7.63%Benchmark is Crisil MIP Blended Index.Past performance may or may not be sustained in future.
*Returns >= 1 Year are CAGR, < 1 Year are Absolute. Benchmark is Crisil MIPBlended Index. For computation of returns the allotment NAV has been takenas Rs. 10.00. Past performance may or may not be sustained in future.31-Jul-04 was a non business day.
Equity Holdings 11,489.47 24.71%• Bharati Airtel Ltd. Telecom Services 1,722.00 3.71%
Tata Consultancy Services Ltd Software 918.56 1.98%ICI India Ltd Consumer Non-Durable 728.86 1.57%ICICI Bank Ltd Banks 710.80 1.53%Trent Ltd Retailing 596.75 1.28%Marico Industries Ltd Consumer Non-Durable 570.80 1.23%Blue Star Ltd Consumer Durables 515.34 1.11%Cadila Healthcare Ltd Pharmaceuticals 476.31 1.02%Larsen & Toubro Ltd Industrial Capital Goods 471.36 1.01%Pantaloon Retail (India) Ltd Retailing 461.54 0.99%Vimta Labs Ltd Healthcare Services 416.50 0.90%Finolex Cables Ltd Industrial Products 406.58 0.87%Siemens India Limited Industrial Capital Goods 384.83 0.83%Infosys Technologies Ltd Software 339.90 0.73%Megasoft Ltd Software 339.33 0.73%Subros Ltd Auto Ancillaries 327.20 0.70%Karur Vysya Bank Ltd Banks 323.05 0.70%Proctor & Gamble Hygiene and Healthcare LtdConsumer Non-Durable 303.92 0.65%Pidilite Industries Ltd Consumer Non-Durable 303.53 0.65%IVRCL Infrastructure & Projects Ltd Construction 251.26 0.54%Madras Cements Ltd Cement 215.10 0.46%FDC Ltd Pharmaceuticals 180.90 0.39%Aditya Birla Nuvo Ltd Textiles - Products 177.74 0.38%Alembic Ltd Pharmaceuticals 156.92 0.34%Exide Industries Ltd Auto Ancillaries 121.40 0.26%Page Industries Ltd Textiles - Products 45.61 0.10%ABG Heavy Industries Ltd Industrial Capital Goods 16.03 0.03%Simplex Projects Ltd Construction 7.35 0.02%Debt Holdings 30,165.61 64.92%PSU/PFI Bonds 3,975.40 8.56%
• Export Import Bank of India Ltd AAA 1,974.43 4.25%Infrastructure Development Finance Corporation AAA 1,481.86 3.19%Indian Railway Finance Corporation AAA 519.11 1.12%Private Corporate Securities 5,922.55 12.74%
• CitiFinancial Consumer Finance India Ltd AAA 2,486.12 5.35%• Tata Sons Ltd AAA 1,667.09 3.59%
PTC Hero Motors Ltd A1+(SO) 1,000.00 2.15%PTC RPS Tata Teleservices AAA(SO) 604.35 1.30%Grasim Industries Ltd AAA 99.16 0.21%PTC TAS Trust Tata Sons A1+(SO) 45.73 0.10%Rabo India Finance Ltd AAA 20.10 0.04%Government Securities 3,702.33 7.97%
• 7.49% GOI 2017 Sovereign 2,928.30 6.30%8.33% GOI 2036 Sovereign 747.75 1.61%8.15% GOI 2022 Sovereign 26.28 0.06%CPs, CDs and Term Deposits 10,204.00 21.96%ICICI Bank Ltd P1+ 6,204.00 13.35%Punjab National Bank Ltd P1+ 4,000.00 8.61%Cash, Call, CBLO & Reverse Repo 6,361.33 13.69%Other Current Assets 4,814.27 10.37%Total Net Assets 46,469.35 100.00%
• Top Five Holdings
PortfolioCompany/Issuer Sector/Rating Mkt Value (Rs. Lakh) % to NAV
Maturity Profile (as % of debt holdings)
Figures as on 31-July-2007
Style Box:
Past performance may or may not be sustained in future. Assume Rs. 1000 invested every month.
EquityDebt
*Pertains to the equity positions only.
3.91%
15.69% 15.24%13.14%
4.94%
11.66%9.49%
7.63%
0.00%2.00%4.00%6.00%8.00%
10.00%12.00%14.00%16.00%18.00%
Last6 Months
Last1 year
Last3 years
SinceInception
Income Multiplier Crisil MIP Blended index
Rs 15121.84
Rs 12660.86
9,44410,444
11,44412,44413,44414,444
15,44416,444
Apr-0
4Ju
n-04
Aug-
04O
ct-0
4De
c-04
Feb-
05Ap
r-05
Jun-
05Au
g-05
Oct
-05
Dec-
05Fe
b-06
Apr-0
6Ju
n-06
Aug-
06O
ct-0
6De
c-06
Feb-
07Ap
r-07
Jun-
07
Income Multiplier Crisil MIP Blended index
Call,Current Assets and
Reverse Repos32.00%
Sovereign Securities10.58%
AAA and Equivalent57.42%
47.74%
14.21%
13.82%
13.59%
2.21%
0.06%
8.37%
0.00% 20.00% 40.00% 60.00%
<182 days
3-5 years
Other Current Assets
1-3 years
5-10 years
> 10 years
182 days - 1 year 16.64%
15.02%
13.93%
9.23%
9.02%
7.61%
7.10%
4.49%
3.91%
3.63%
3.55%
2.25%
1.95%
1.88%
0.00% 5.00% 10.00% 15.00% 20.00%
Consumer Non-Durable
Telecom Services
Software
Retailing
Banks
Industrial Capital Goods
Pharmaceuticals
Consumer Durables
Auto Ancillaries
Healthcare Services
Industrial Products
Construction
Textiles - Products
Cement

20
Fund Manager's Comment
The ✓ extending beyond the red portion represents the marginal change in the style of the portfolio.Equity allocation to large cap stocks has been increased to protect capital at current valuations.
Sector Allocation* (as % of equity portfolio)
SIP Returns As on 31-July-2007
Period SIP Start Date Total Amount Total No. Market Value SIPInvested of Units Returns
1 Year SIP 31-Aug-06 12,000.00 300.61 13,515.43 28.82%3 Year SIP 31-Aug-04 36,000.00 1,197.70 53,848.59 29.55%5 Year SIP 30-Aug-02 60,000.00 2,922.09 131,377.17 32.95%Since Inception 31-Aug-01 72,000.00 4,064.50 182,739.92 31.88%
Figures as on 31st Aug, 2004Figures as on 31st Aug, 2004
ICICI Prudential Child Care Plan (Gift)WHY SHOULD ONE INVEST?
For your child between 1-13 years and seeking to saveover a long term horizon
Snapshot:Fund Managers: Equity : Munzal Shah
Debt : Pankaj KajiIndicative Investment Horizon: 6-17 yrsInception date: 31-08-2001Fund Size: Rs. 121.84 croresNAV (As on 31-July-2007) : Rs. 44.96**Expense Ratio: 2.00%**This is a close approximation of the number.
Equity Holdings 8,468.26 69.47%• Provogue (India) Ltd Textiles - Products 467.08 3.83%• Federal Bank Ltd Banks 425.04 3.49%• Sintex Industries Ltd Industrial Products 355.50 2.92%
Asian Paints Ltd Consumer Non-Durable 354.10 2.91%Megasoft Ltd Software 339.21 2.78%Karur Vysya Bank Ltd Banks 333.21 2.73%ICICI Bank Ltd Banks 331.28 2.72%Bharati Airtel Ltd. Telecom Services 315.39 2.59%Vimta Labs Ltd Healthcare Services 309.60 2.54%Gillette India Ltd Consumer Non-Durable 291.71 2.39%3i Infotech Ltd Software 280.49 2.30%Indoco Remedies Ltd Pharmaceuticals 279.28 2.29%Thermax Ltd Industrial Capital Goods 256.38 2.10%Containers Corporation of India Ltd Transportation 253.34 2.08%ICI India Ltd Consumer Non-Durable 245.37 2.01%Ahluwalia Contractors Ltd Construction 238.80 1.96%Orient Paper & Industries Ltd Cement 221.78 1.82%Finolex Cables Ltd Industrial Products 221.42 1.82%Forbes Gokak Ltd Textiles - Cotton 213.07 1.75%Tata Tea Ltd Consumer Non-Durable 192.74 1.58%Pantaloon Retail (India) Ltd Retailing 187.79 1.54%Geometric Software Solutions Ltd Software 177.65 1.46%ITC Limited Consumer Non-Durable 171.00 1.40%Exide Industries Ltd Auto Ancillaries 166.80 1.37%Kalyani Steels Ltd Ferrous Metals 162.30 1.33%Elecon Engneering Co Ltd Industrial Capital Goods 146.16 1.20%Sundaram Clayton Ltd Auto Ancillaries 143.34 1.18%Phillips Carbon Black Ltd Auto Ancillaries 127.91 1.05%Jaiprakash Associates Ltd Construction 125.66 1.03%Time Technoplast Ltd Chemicals 120.95 0.99%Mahindra & Mahindra Ltd Auto 119.61 0.98%Marico Industries Ltd Consumer Non-Durable 112.60 0.92%HOV Services Ltd Software 109.59 0.90%Solectron Centum Electronics Ltd Industrial Capital Goods 100.09 0.82%Page Industries Ltd Textiles - Products 94.39 0.77%Valecha Engineering Ltd Construction 88.67 0.73%Madras Cements Ltd Cement 85.44 0.70%Rico Auto Industries Ltd Auto Ancillaries 78.20 0.64%Gujarat Apollo Equipments Ltd Industrial Capital Goods 65.29 0.54%Dr. Reddy’s Laboratories Ltd Pharmaceuticals 63.41 0.52%Ceat Ltd Auto Ancillaries 54.18 0.44%Orbit Corporation Ltd Construction 40.50 0.33%Simplex Projects Ltd Construction 1.94 0.02%Debt Holdings 3,116.64 25.58%Private Corporate Securities 1,662.55 13.65%
• TGS Investment & Trade Pvt. Ltd. A1+ 500.00 4.10%• DSP Merill Lynch Capital Ltd AAA(SO) 471.33 3.87%
Tata Sons Ltd AAA 250.06 2.05%GE Money Financial Services Ltd AAA 198.69 1.63%Reliance Industries Ltd AAA 99.78 0.82%PTC IBL Trust IndusInd Bank AAA(SO) 81.94 0.67%CitiFinancial Consumer Finance India Ltd AAA 40.02 0.33%Titan Industries Ltd A 11.58 0.10%PTC TAS Trust Tata Sons A1+(SO) 9.15 0.08%CPs, CDs and Term Deposits 1,305.00 10.71%ICICI Bank Ltd P1+ 1,005.00 8.25%Allahabad Bank Ltd P1+ 300.00 2.46%Cash, Call, CBLO & Reverse Repo 149.09 1.22%Other Current Assets 599.32 4.95%Total Net Assets 12,184.22 100.00%
• Top Five Holdings
Rs. 10000 invested at inception*: CCP - Gift Vs Crisil Balanced Fund Index
*Benchmark start date - 31.03.2002. CAGR – CCP - Gift : 29.59%;Benchmark : 20.44%. Past performance may or may not be sustained in future.
Portfolio
Company/Issuer Sector/Rating Mkt Value (Rs. Lakh) % to NAV
Figures as on 31-July-2007
Style Box
Maturity Profile (as % of debt holding)
Rating Profile (as % of debt holding)
Performance Record *- Cumulative Option
*Returns >= 1 Year are CAGR, < 1 Year are Absolute. Benchmark is CrisilBalanced Fund Index and start date - 31.03.2002. For computation of returnsthe allotment NAV has been taken as Rs. 10.00. Past performance may ormay not be sustained in future. 31-Jul-04 was a non business day.
Past performance may or may not be sustained in future. Assume Rs. 1000 invested every month. Thehigh level of returns come from the sharp appreciation in market, in the year 2002, 2004 & 2006.
Debt Equity
*Pertains to the equity positions only.
Quantitative Indicators – Debt Component Quantitative Indicators – Equity Component
Average Maturity : 0.39 yearModified Duration : 0.35 yearYield To Maturity : 9.35%
Average P/E : 21Average P/BV : 3.27Average Dividend Yield : 1.31
% Unlisted Bonds : 9.70%
6.84%
41.34%32.97% 33.41%
28.92%
8.65%
28.64%25.10% 24.14%
0.00%5.00%
10.00%15.00%20.00%25.00%30.00%35.00%40.00%45.00%
Last 6Months
Last 1year
Last 3years
Last 5years
SinceInception
Child Care Gift Crisil Balanced Fund Index
Rs 39822.85
Rs 26958.17
8,986
13,98618,986
23,98628,986
33,98638,986
43,986
Apr-0
2Ju
l-02
Oct
-02
Jan-
03Ap
r-03
Jul-0
3O
ct-0
3Ja
n-04
Apr-0
4Ju
l-04
Oct
-04
Jan-
05Ap
r-05
Jul-0
5O
ct-0
5Ja
n-06
Apr-0
6Ju
l-06
Oct
-06
Jan-
07Ap
r-07
Jul-0
7
Child Care Gift Crisil Balanced Fund Index
60.86%
16.13%
14.89%
7.81%
0.31%
0.00% 20.00% 40.00% 60.00% 80.00%
<182 days
Other Current Assets
182 days - 1 year
1-3 years
3-5 years
AAA and Equivalent44.43%
Call,Current Assets and
Reverse Repos20.14%
A and Equivalent35.43%
16.15%12.86%
10.71%6.81%6.73%6.71%6.63%
5.85%4.05%
3.72%3.66%3.63%
2.99%2.52%
2.22%1.92%
1.43%1.41%
0.00% 5.00% 10.00% 15.00% 20.00%
Consumer Non-DurableBanks
SoftwareIndustrial Products
Auto AncillariesIndustrial Capital
Textiles - ProductsConstruction
PharmaceuticalsTelecom Services
Healthcare ServicesCement
TransportationTextiles - Cotton
RetailingFerrous Metals
ChemicalsAuto

21
Fund Manager's Comment
The ✓ extending beyond the red portion represents the marginal change in the style of the portfolio.Equity allocation to large cap stocks has been increased to protect capital at current valuations.
Past performance may or may not be sustained in future. Assume Rs. 1000 invested every month.
SIP Returns As on 31-July-2007Period SIP Start Date Total Amount Total No. Market Value SIP
Invested of Units Returns
1 Year SIP 31-Aug-06 12,000.00 611.72 12,846.98 15.79%3 Year SIP 31-Aug-04 36,000.00 2,107.30 44,256.25 14.65%5 Year SIP 30-Aug-02 60,000.00 4,020.88 84,444.11 14.07%Since Inception 31-Aug-01 72,000.00 5,162.49 108,419.52 13.86%
Quantitative Indicators – Equity Component
Average P/E : 26Average P/BV : 4.53Average Dividend Yield : 0.76
Quantitative Indicators – Debt Component
Average Maturity : 0.58 yearModified Duration : 0.53 yearYield To Maturity : 6.45%% Unlisted Bonds : 23.83%
Rating Profile (as % of debt holding)
ICICI Prudential Child Care Plan (Study)
Snapshot:Fund Managers: Equity : Munzal Shah
Debt : Pankaj KajiIndicative Investment Horizon: 3-5 yrsInception date: 31-08-2001Fund Size: Rs. 29.72 croresNAV (As on 31-July-2007) : Rs. 21.0014**Expense Ratio: 1.50%**This is a close approximation of the number.
WHY SHOULD ONE INVEST?For your child between 13-17 years and on the
threshold of higher studies
Performance Record *- Growth Option
*Returns >= 1 Year are CAGR, < 1 Year are Absolute. Benchmark is Crisil MIPBlended Index and start date - 31.03.2002. For computation of returns theallotment NAV has been taken as Rs. 10.00. Past performance may or may not besustained in future. 31-Jul-04 was a non business day.
Equity Holdings 698.51 23.51%
Bharati Airtel Ltd. Telecom Services 126.15 4.24%
Gillette India Ltd Consumer Non-Durable 47.68 1.60%
Containers Corporation of India Ltd Transportation 43.89 1.48%
Provogue (India) Ltd Textiles - Products 43.65 1.47%
AIA Engineering Ltd Industrial Products 38.95 1.31%
HOV Services Ltd Software 35.96 1.21%
Tanla Solutions Ltd Software 35.87 1.21%
Karur Vysya Bank Ltd Banks 35.76 1.20%
Firstsource Solutions Ltd Software 34.22 1.15%
Federal Bank Ltd Banks 34.20 1.15%
ING Vysya Bank Ltd Banks 33.58 1.13%
Blue Star Ltd Consumer Durables 32.45 1.09%
Marico Industries Ltd Consumer Non-Durable 30.97 1.04%
Asian Paints Ltd Consumer Non-Durable 28.88 0.97%
Exide Industries Ltd Auto Ancillaries 27.80 0.94%
Trent Ltd Retailing 25.44 0.86%
Automobile Corporation of Goa Ltd Auto Ancillaries 24.86 0.84%
3i Infotech Ltd Software 17.72 0.60%
Simplex Projects Ltd Construction 0.48 0.02%
Debt Holdings 2,175.58 73.18%
PSU/PFI Bonds 99.97 3.36%
Nabard AAA 99.97 3.36%
Private Corporate Securities 1,195.49 40.21%
• Rabo India Finance Ltd AAA 271.33 9.13%
• Tata Sons Ltd AAA 250.06 8.41%
• GE Money Financial Services Ltd AAA 199.88 6.72%
• DSP Merill Lynch Capital Ltd P1+ 198.64 6.68%
• Reliance Industries Ltd AAA 189.58 6.38%
PTC TVS Finance AAA(SO) 47.41 1.59%
Trent Ltd AA- 38.59 1.30%
CPs, CDs and Term Deposits 492.68 16.58%
UTI Bank Ltd P1+ 298.60 10.05%
Kotak Mahindra Bank Ltd P1+ 194.08 6.53%
Cash, Call, CBLO & Reverse Repo 387.44 13.03%
Other Current Assets 98.41 3.31%
Total Net Assets 2,972.50 100.00%
• Top Five Holdings
Portfolio
Company/Issuer Sector/Rating Mkt Value (Rs. Lakh) % to NAV
Figures as on 31-July-2007
Style Box:
Rs. 10000 invested at inception*: CCP - Study Vs Crisil MIP Blended Index
*Benchmark start date - 31.03.2002.CAGR – CCP - Study : 13.07%; Benchmark : 9.38%.Past performance may or may not be sustained in future.
Debt Equity
5.75%
18.60%
14.24% 14.09% 13.36%
4.94%
11.66%9.49% 10.01%
0.00%2.00%4.00%6.00%8.00%
10.00%12.00%14.00%16.00%18.00%20.00%
Last 6Months
Last 1year
Last 3years
Last 5years
SinceInception
Child Care Study Crisil MIP Blended index
Rs 19249.68
Rs 16125.51
9,721
11,721
13,721
15,721
17,721
19,721
21,721
Apr-0
2Ju
l-02
Oct
-02
Jan-
03Ap
r-03
Jul-0
3O
ct-0
3Ja
n-04
Apr-0
4Ju
l-04
Oct
-04
Jan-
05Ap
r-05
Jul-0
5O
ct-0
5Ja
n-06
Apr-0
6Ju
l-06
Oct
-06
Jan-
07Ap
r-07
Jul-0
7
Child Care Study Crisil MIP Blended index
62.26%
20.72%
12.69%
4.33%
0.00% 20.00% 40.00% 60.00% 80.00%
<182 days
182 days - 1 year
1-3 years
Other Current Assets
AA and Equivalent
1.70%
Call,Current Assets and
Reverse Repos21.37%
AAA and Equivalent76.93%
Maturity Profile (as % of debt holding)

22
Performance Record *- Retail Growth Option
Rating Profile (as % of total debt components)
Maturity Profile (as % of debt holding)
ICICI Prudential Equity & Derivatives FundIncome Optimiser Plan
WHY SHOULD ONE INVEST?Generate low volatility returns by investing in mix of cash equities, equity
derivatives and debt market instruments - relatively more conservative - 65%to 80% in Equity and Equity Derivatives (unhedged exposure limited to 5%)
Snapshot:Fund Managers: Equity : Yogesh Bhatt
Debt : Chaitanya PandeInception date: 30-12-2006Fund Size: Rs. 1,478.58 croresNAV (As on 31-July-2007):
Retail Growth option : Rs. 10.75Inst. Growth option : Rs. 10.77Retail Dividend option : Rs. 10.75
**Expense Ratio:Retail Option : 1.50%Inst. Option : 1.20%
**This is a close approximation of the number.
Figures as on 31-July-2007
Style Box
Debt Equity
*Returns >= 1 Year are CAGR, < 1 Year are Absolute. Benchmark is CrisilLiquid Fund Index. For computation of returns the allotment NAV has beentaken as Rs. 10.00. Past performance may or may not be sustained in future.
Equity Holdings 3,072.66 2.07%ICI India Ltd Consumer Non-Durable 1,094.97 0.74%Indian Petrochemicals Corporation Ltd Chemicals 930.57 0.63%BASF Ltd Chemicals 492.01 0.33%VST Tillers Tractors Ltd Auto 298.75 0.20%Atlas Copco (India) Ltd Consumer Durables 256.36 0.17%Equity & Derivative Holdings 103,380.63 69.93% (105,185.34)Reliance Industries Ltd Petroleum Products 14,555.61 9.84%Reliance Industries Ltd- Futures -15,590.74Reliance Capital Finance Ltd Finance 10,425.00 7.05%Reliance Capital Finance Ltd- Futures -10,507.35State Bank of India Ltd Banks 9,113.86 6.16%State Bank of India Ltd- Futures -9,201.69ICICI Bank Ltd Banks 8,962.09 6.06%ICICI Bank Ltd- Futures -8,676.89Punjab National Bank Banks 6,320.28 4.27%Punjab National Bank- Futures -6,354.63Reliance Energy Ltd Power 3,169.64 2.14%Reliance Energy Ltd- Futures -3,200.39Larsen & Toubro Ltd Industrial Capital Goods 2,540.00 1.72%Larsen & Toubro Ltd- Futures -2,545.84Housing Development and Infrastructure Ltd Construction 2,441.19 1.65%Housing Development and Infrastructure Ltd- Futures -2,464.84Punj Llyod Ltd Construction 2,384.76 1.61%Punj Llyod Ltd- Futures -2,394.84Century Textiles & Industries Ltd Cement 2,351.12 1.59%Century Textiles & Industries Ltd- Futures -2,371.95India Infoline Ltd Finance 2,345.25 1.59%India Infoline Ltd- Futures -2,364.22Divis Laboratories Ltd Pharmaceuticals 2,301.59 1.56%Divis Laboratories Ltd- Futures -2,312.98Industrial Development Bank of India Banks 2,096.87 1.42%Industrial Development Bank of India- Futures -2,113.67Kotak Mahindra Bank Ltd Banks 2,036.93 1.38%Kotak Mahindra Bank Ltd- Futures -2,048.20Hindalco Industries Ltd Non-Ferrous Metals 1,947.93 1.32%Hindalco Industries Ltd- Futures -2,467.62Bank of Baroda Ltd Banks 1,885.80 1.28%Bank of Baroda Ltd- Futures -1,898.69Reliance Communications Ventures Ltd Telecom Services 1,666.94 1.13%Reliance Communications Ventures Ltd- Futures -1,680.21National Thermal Power Corporation Ltd Power 1,665.05 1.13%National Thermal Power Corporation Ltd- Futures -1,675.09Financial Technologies Ltd Software 1,569.32 1.06%Financial Technologies Ltd- Futures -1,585.97Unitech Ltd Construction 1,564.08 1.06%Unitech Ltd- Futures -1,566.18Tata Steel Ltd Ferrous Metals 1,532.67 1.04%Tata Steel Ltd- Futures -1,533.96GMR Infrastructure Ltd Construction 1,518.50 1.03%GMR Infrastructure Ltd- Futures -1,532.98Praj Industries Ltd Industrial Capital Goods 1,492.92 1.01%Praj Industries Ltd- Futures -1,502.87Union Bank of India Ltd Banks 1,420.87 0.96%Union Bank of India Ltd- Futures -1,433.18Mahanagar Telephone Nigam Ltd Telecom Services 1,384.14 0.94%Mahanagar Telephone Nigam Ltd- Futures -1,396.56Alstom Projects India Ltd Industrial Capital Goods 1,203.73 0.81%Alstom Projects India Ltd- Futures -1,209.38Tata Tea Ltd Consumer Non-Durable 1,174.54 0.79%Tata Tea Ltd- Futures -1,186.43Voltas Ltd Consumer Durables 994.38 0.67%Voltas Ltd- Futures -1,002.81Parsvanath Developers Ltd Construction 944.50 0.64%Parsvanath Developers Ltd- Futures -953.47Titan Industries Ltd Consumer Non-Durable 926.12 0.63%Titan Industries Ltd- Futures -934.96Industrial Development Finance Corporation Ltd Finance 840.35 0.57%Industrial Development Finance Corporation Ltd- Futures -840.35ABB Ltd Industrial Capital Goods 699.88 0.47%ABB Ltd- Futures -699.03Power Finance Corporation Ltd Power 625.30 0.42%Power Finance Corporation Ltd- Futures -626.47MphasiS Ltd Software 623.98 0.42%MphasiS Ltd- Futures -624.53New Delhi Television Ltd Media & Entertainment 597.64 0.40%New Delhi Television Ltd- Futures -603.03Gujarat Ambuja Cement Ltd Cement 533.77 0.36%Gujarat Ambuja Cement Ltd- Futures -527.88Pantaloon Retail (India) Ltd Retailing 482.90 0.33%Pantaloon Retail (India) Ltd- Futures -487.31Nagarjuna Construction Company Ltd Construction 444.98 0.30%Nagarjuna Construction Company Ltd- Futures -448.34Gateway Distriparks Ltd Transportation 397.55 0.27%Gateway Distriparks Ltd- Futures -400.03CESC Ltd Power 391.60 0.26%CESC Ltd- Futures -395.72India Cements Ltd Cement 389.61 0.26%India Cements Ltd- Futures -387.73Zee Entertainment Enterprises Ltd Media & Entertainment 328.30 0.22%Zee Entertainment Enterprises Ltd- Futures -327.72Aurobindo Pharma Ltd Pharmaceuticals 325.73 0.22%Aurobindo Pharma Ltd- Futures -328.63Matrix Laboratories Ltd Pharmaceuticals 320.13 0.22%Matrix Laboratories Ltd- Futures -322.66DLF Ltd Construction 306.10 0.21%DLF Ltd- Futures -308.38Bombay Dyeing & Manufacturing Co. Ltd Textiles - Products 300.17 0.20%Bombay Dyeing & Manufacturing Co. Ltd- Futures -303.56Patni Computer Systems Ltd Software 236.11 0.16%Patni Computer Systems Ltd- Futures -238.61Lanco Infratech Ltd Industrial Capital Goods 209.73 0.14%Lanco Infratech Ltd- Futures -211.35Colgate Palmolive (India) Ltd Consumer Non-Durable 207.32 0.14%Colgate Palmolive (India) Ltd- Futures -209.11Bata India Ltd Consumer Non-Durable 185.01 0.13%Bata India Ltd- Futures -187.00Hindustan Lever Ltd Consumer Non-Durable 159.20 0.11%Hindustan Lever Ltd- Futures -157.04Sesa Goa Ltd Ferrous Metals 140.49 0.10%Sesa Goa Ltd- Futures -139.36Great Eastern Shipping Co. Ltd Transportation 126.95 0.09%Great Eastern Shipping Co. Ltd- Futures -127.74Bharat Electonics Ltd Industrial Capital Goods 126.40 0.09%Bharat Electonics Ltd- Futures -126.45Idea Cellular Ltd Telecom Services 90.98 0.06%Idea Cellular Ltd- Futures -91.47Polaris Software Lab Ltd Software 79.86 0.05%Polaris Software Lab Ltd- Futures -80.56I-Flex Solutions Ltd Software 79.52 0.05%I-Flex Solutions Ltd- Futures -80.07SRF Ltd Textiles - Synthetic 60.61 0.04%SRF Ltd- Futures -61.24Aban Lloyd Chiles Offshore Ltd Industrial Capital Goods 54.35 0.04%Aban Lloyd Chiles Offshore Ltd- Futures -54.60Lupin Ltd Pharmaceuticals 51.85 0.04%Lupin Ltd- Futures -51.93Bharat Forge Ltd Industrial Products 28.58 0.02%Bharat Forge Ltd- Futures -28.85Debt Holdings 37,665.51 25.48%PSU/PFI Bonds 3,354.73 2.27%Nabard AAA 3,354.73 2.27%Private Corporate Securities 4,508.62 3.06%Kotak Mahindra Primus Ltd P1+ 2,508.62 1.70%LIC Housing Finance Ltd AAA 1,000.00 0.68%Reliance Capital Finance Ltd A1+ 1,000.00 0.68%CPs, CDs and Term Deposits 21,744.70 14.70%ICICI Bank Ltd P1+ 20,244.70 13.69%Allahabad Bank Ltd P1+ 1,500.00 1.01%Cash, Call, CBLO & Reverse Repo 8,057.46 5.45%Other Current Assets 3,738.96 2.52%Total Net Assets 147,857.76 100.00%
PortfolioCompany/Issuer Sector/Rating Mkt Value % to NAV Mkt Value (Rs.
(Rs. Lakh) Lakh) - Futures
Quantitative Indicators – Debt Component
Average Maturity : 0.50 yearModified Duration : 0.46 yearYield To Maturity : 9.04%
% Unlisted Bonds : 0.00%
Income Optimiser Crisil Liquid Fund Index
6.23%7.50%
4.18%4.87%
0.00%1.00%2.00%3.00%4.00%5.00%6.00%7.00%8.00%
Last 6 Months Since Inception
56.69%
-0.39%
2.87%
40.82%
-20.00% 0.00% 20.00% 40.00% 60.00%
182 days - 1 year
<182 days
1-3 years
Other Current Assets
Call,Current Assets and
Reverse Repos28.49%
AAA and Equivalent71.51%
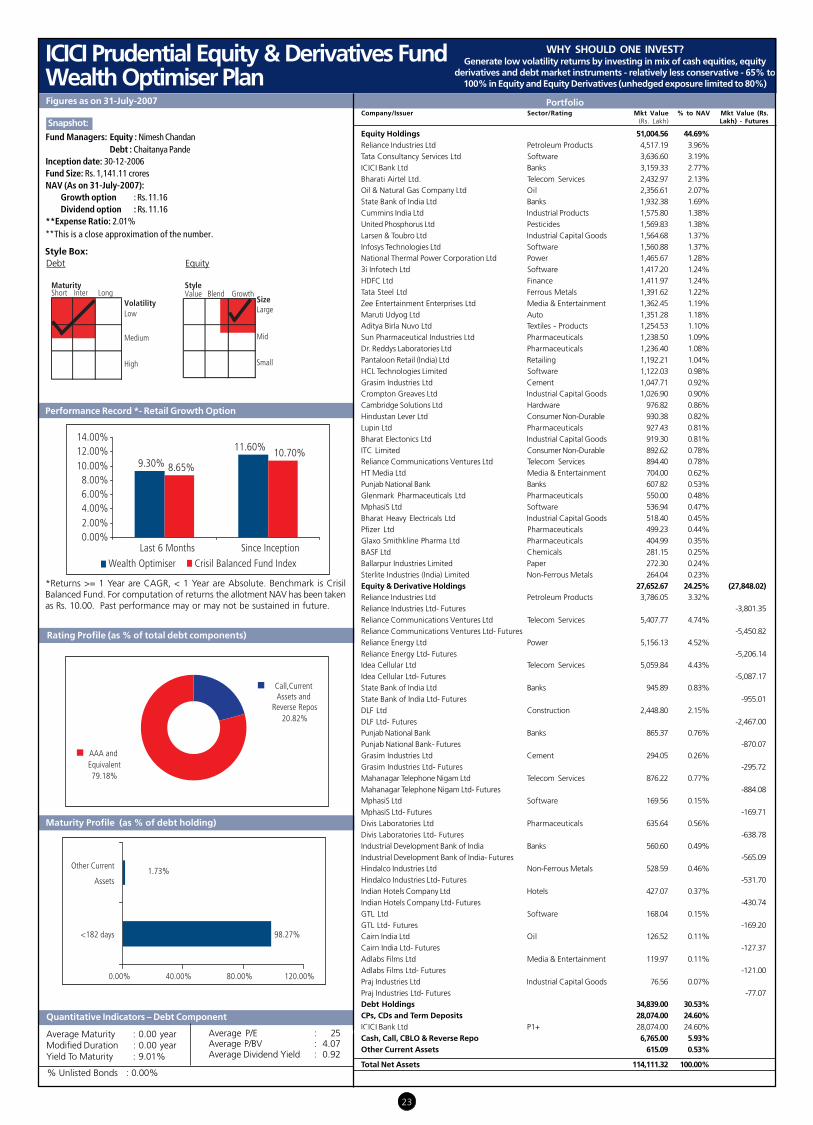
23
Performance Record *- Retail Growth Option
Quantitative Indicators – Debt Component
Average Maturity : 0.00 yearModified Duration : 0.00 yearYield To Maturity : 9.01%
% Unlisted Bonds : 0.00%
Maturity Profile (as % of debt holding)
Rating Profile (as % of total debt components)
ICICI Prudential Equity & Derivatives FundWealth Optimiser Plan
Snapshot:
Fund Managers: Equity : Nimesh ChandanDebt : Chaitanya Pande
Inception date: 30-12-2006Fund Size: Rs. 1,141.11 croresNAV (As on 31-July-2007):
Growth option : Rs. 11.16Dividend option : Rs. 11.16
**Expense Ratio: 2.01%**This is a close approximation of the number.
WHY SHOULD ONE INVEST?Generate low volatility returns by investing in mix of cash equities, equity
derivatives and debt market instruments - relatively less conservative - 65% to100% in Equity and Equity Derivatives (unhedged exposure limited to 80%)
Figures as on 31-July-2007
Style Box:Debt Equity
*Returns >= 1 Year are CAGR, < 1 Year are Absolute. Benchmark is CrisilBalanced Fund. For computation of returns the allotment NAV has been takenas Rs. 10.00. Past performance may or may not be sustained in future.
Equity Holdings 51,004.56 44.69%Reliance Industries Ltd Petroleum Products 4,517.19 3.96%Tata Consultancy Services Ltd Software 3,636.60 3.19%ICICI Bank Ltd Banks 3,159.33 2.77%Bharati Airtel Ltd. Telecom Services 2,432.97 2.13%Oil & Natural Gas Company Ltd Oil 2,356.61 2.07%State Bank of India Ltd Banks 1,932.38 1.69%Cummins India Ltd Industrial Products 1,575.80 1.38%United Phosphorus Ltd Pesticides 1,569.83 1.38%Larsen & Toubro Ltd Industrial Capital Goods 1,564.68 1.37%Infosys Technologies Ltd Software 1,560.88 1.37%National Thermal Power Corporation Ltd Power 1,465.67 1.28%3i Infotech Ltd Software 1,417.20 1.24%HDFC Ltd Finance 1,411.97 1.24%Tata Steel Ltd Ferrous Metals 1,391.62 1.22%Zee Entertainment Enterprises Ltd Media & Entertainment 1,362.45 1.19%Maruti Udyog Ltd Auto 1,351.28 1.18%Aditya Birla Nuvo Ltd Textiles - Products 1,254.53 1.10%Sun Pharmaceutical Industries Ltd Pharmaceuticals 1,238.50 1.09%Dr. Reddys Laboratories Ltd Pharmaceuticals 1,236.40 1.08%Pantaloon Retail (India) Ltd Retailing 1,192.21 1.04%HCL Technologies Limited Software 1,122.03 0.98%Grasim Industries Ltd Cement 1,047.71 0.92%Crompton Greaves Ltd Industrial Capital Goods 1,026.90 0.90%Cambridge Solutions Ltd Hardware 976.82 0.86%Hindustan Lever Ltd Consumer Non-Durable 930.38 0.82%Lupin Ltd Pharmaceuticals 927.43 0.81%Bharat Electonics Ltd Industrial Capital Goods 919.30 0.81%ITC Limited Consumer Non-Durable 892.62 0.78%Reliance Communications Ventures Ltd Telecom Services 894.40 0.78%HT Media Ltd Media & Entertainment 704.00 0.62%Punjab National Bank Banks 607.82 0.53%Glenmark Pharmaceuticals Ltd Pharmaceuticals 550.00 0.48%MphasiS Ltd Software 536.94 0.47%Bharat Heavy Electricals Ltd Industrial Capital Goods 518.40 0.45%Pfizer Ltd Pharmaceuticals 499.23 0.44%Glaxo Smithkline Pharma Ltd Pharmaceuticals 404.99 0.35%BASF Ltd Chemicals 281.15 0.25%Ballarpur Industries Limited Paper 272.30 0.24%Sterlite Industries (India) Limited Non-Ferrous Metals 264.04 0.23%Equity & Derivative Holdings 27,652.67 24.25% (27,848.02)Reliance Industries Ltd Petroleum Products 3,786.05 3.32%Reliance Industries Ltd- Futures -3,801.35Reliance Communications Ventures Ltd Telecom Services 5,407.77 4.74%Reliance Communications Ventures Ltd- Futures -5,450.82Reliance Energy Ltd Power 5,156.13 4.52%Reliance Energy Ltd- Futures -5,206.14Idea Cellular Ltd Telecom Services 5,059.84 4.43%Idea Cellular Ltd- Futures -5,087.17State Bank of India Ltd Banks 945.89 0.83%State Bank of India Ltd- Futures -955.01DLF Ltd Construction 2,448.80 2.15%DLF Ltd- Futures -2,467.00Punjab National Bank Banks 865.37 0.76%Punjab National Bank- Futures -870.07Grasim Industries Ltd Cement 294.05 0.26%Grasim Industries Ltd- Futures -295.72Mahanagar Telephone Nigam Ltd Telecom Services 876.22 0.77%Mahanagar Telephone Nigam Ltd- Futures -884.08MphasiS Ltd Software 169.56 0.15%MphasiS Ltd- Futures -169.71Divis Laboratories Ltd Pharmaceuticals 635.64 0.56%Divis Laboratories Ltd- Futures -638.78Industrial Development Bank of India Banks 560.60 0.49%Industrial Development Bank of India- Futures -565.09Hindalco Industries Ltd Non-Ferrous Metals 528.59 0.46%Hindalco Industries Ltd- Futures -531.70Indian Hotels Company Ltd Hotels 427.07 0.37%Indian Hotels Company Ltd- Futures -430.74GTL Ltd Software 168.04 0.15%GTL Ltd- Futures -169.20Cairn India Ltd Oil 126.52 0.11%Cairn India Ltd- Futures -127.37Adlabs Films Ltd Media & Entertainment 119.97 0.11%Adlabs Films Ltd- Futures -121.00Praj Industries Ltd Industrial Capital Goods 76.56 0.07%Praj Industries Ltd- Futures -77.07Debt Holdings 34,839.00 30.53%CPs, CDs and Term Deposits 28,074.00 24.60%ICICI Bank Ltd P1+ 28,074.00 24.60%Cash, Call, CBLO & Reverse Repo 6,765.00 5.93%Other Current Assets 615.09 0.53%
Total Net Assets 114,111.32 100.00%
PortfolioCompany/Issuer Sector/Rating Mkt Value % to NAV Mkt Value (Rs.
(Rs. Lakh) Lakh) - Futures
Quantitative Indicators – Equity ComponentAverage P/E : 25Average P/BV : 4.07Average Dividend Yield : 0.92
Wealth Optimiser Crisil Balanced Fund Index
9.30%
11.60%
8.65%10.70%
0.00%2.00%4.00%6.00%8.00%
10.00%12.00%14.00%
Last 6 Months Since Inception
AAA and Equivalent79.18%
Call,Current Assets and
Reverse Repos20.82%
98.27%
1.73%
0.00% 40.00% 80.00% 120.00%
<182 days
Other Current
Assets

24
Snapshot:Fund Managers :Equity : Yogesh Bhatt
Debt : Chaitanya PandeIndicative Investment Horizon: 6 months-1 yearInception date: 31-05-2005Fund Size: Rs. 568.13 croresNAV (As on 31-July-2007):
Growth option : Rs. 11.8808Dividend option : Rs. 10.7970
**Expense Ratio: 1.50%**This is a close approximation of the number.
ICICI Prudential Blended Plan A Portfolio
Company/Issuer Sector/Rating Mkt Value %NAV Mkt Value(Rs. Lakh) (Rs. Lakh)-Futures
Figures as on 31-July-2007
Equity Holdings 7.72 0.01%Simplex Projects Ltd Construction 7.72 0.01%Equity & Derivative Holdings 39,094.01 68.81% (39,350.12)
• Punjab National Bank Banks 4,574.09 8.05%Punjab National Bank- Futures -4,598.95
• Bank of Baroda Ltd Banks 3,255.00 5.73%Bank of Baroda Ltd- Futures -3,277.24
• ICICI Bank Ltd Banks 3,242.83 5.71%ICICI Bank Ltd- Futures -3,263.63
• Reliance Capital Finance Ltd Finance 2,401.19 4.23%Reliance Capital Finance Ltd- Futures -2,420.16
• Mahanagar Telephone Nigam Ltd Telecom Services 2,178.52 3.83%Mahanagar Telephone Nigam Ltd- Futures -2,198.06Cipla Ltd Pharmaceuticals 2,118.27 3.73%Cipla Ltd- Futures -2,109.95I-Flex Solutions Ltd Software 377.70 0.66%I-Flex Solutions Ltd- Futures -380.34Petronet LNG Ltd Gas 314.98 0.55%Petronet LNG Ltd- Futures -316.72Polaris Software Lab Ltd Software 305.54 0.54%Polaris Software Lab Ltd- Futures -308.25Orchid Chemicals Ltd Pharmaceuticals 276.41 0.49%Orchid Chemicals Ltd- Futures -277.95Ultratech Cement Company Ltd Cement 252.02 0.44%Ultratech Cement Company Ltd- Futures -251.82SRF Ltd Textiles - Synthetic 177.49 0.31%SRF Ltd- Futures -179.33Mangalore Refineries & Petrochemicals Ltd Petroleum Products 149.99 0.26%Mangalore Refineries & Petrochemicals Ltd- Futures -148.81Patni Computer Systems Ltd Software 137.99 0.24%Patni Computer Systems Ltd- Futures -139.45Chambal Fertilisers & Chemicals Ltd Fertilizers 130.41 0.23%Chambal Fertilisers & Chemicals Ltd- Futures -132.27Karnataka Bank Ltd Banks 88.09 0.16%Karnataka Bank Ltd- Futures -88.59IndusInd Bank Ltd Banks 74.83 0.13%IndusInd Bank Ltd- Futures -75.56Shipping Corporation of India Ltd Transportation 66.86 0.12%Shipping Corporation of India Ltd- Futures -67.58Reliance Energy Ltd Power 61.12 0.11%Reliance Energy Ltd- Futures -61.72Matrix Laboratories Ltd Pharmaceuticals 46.17 0.08%Matrix Laboratories Ltd- Futures -46.54Neyveli Lignite Corporation Ltd Power 19.28 0.03%Neyveli Lignite Corporation Ltd- Futures -19.19Cummins India Ltd Industrial Products 7.49 0.01%Cummins India Ltd- Futures -7.49Century Textiles & Industries Ltd Cement 1,611.75 2.84%Century Textiles & Industries Ltd- Futures -1,626.03Housing Development and Infrastructure Ltd Construction 1,574.74 2.77%Housing Development and Infrastructure Ltd- Futures -1,589.99Jindal Steel & Power Company Ltd Ferrous Metals 1,511.44 2.66%Jindal Steel & Power Company Ltd- Futures -1,517.09Union Bank of India Ltd Banks 1,502.72 2.65%Union Bank of India Ltd- Futures -1,515.73State Bank of India Ltd Banks 1,498.00 2.64%State Bank of India Ltd- Futures -1,512.44DLF Ltd Construction 1,175.42 2.07%DLF Ltd- Futures -1,184.16Industrial Development Bank of India Banks 1,088.86 1.92%Industrial Development Bank of India- Futures -1,097.59New Delhi Television Ltd Media & Entertainment 1,048.03 1.84%New Delhi Television Ltd- Futures -1,057.48Industrial Finance Corporation of India Ltd Finance 1,031.51 1.82%Industrial Finance Corporation of India Ltd- Futures -1,042.29Parsvanath Developers Ltd Construction 1,024.67 1.80%Parsvanath Developers Ltd- Futures -1,034.40GMR Infrastructure Ltd Construction 838.95 1.48%GMR Infrastructure Ltd- Futures -846.95India Infoline Ltd Finance 754.10 1.33%India Infoline Ltd- Futures -760.20LIC Housing Finance Ltd Finance 688.50 1.21%LIC Housing Finance Ltd- Futures -695.11Voltas Ltd Consumer Durables 581.33 1.02%Voltas Ltd- Futures -586.26Praj Industries Ltd Industrial Capital Goods 531.14 0.93%Praj Industries Ltd- Futures -534.68Jai Prakash Hydro Power Ltd Power 527.21 0.93%Jai Prakash Hydro Power Ltd- Futures -532.95Vijaya Bank Banks 504.87 0.89%Vijaya Bank- Futures -509.06Gujarat Narmada Valley Fertilisers Co. Ltd Fertilizers 494.93 0.87%Gujarat Narmada Valley Fertilisers Co. Ltd- Futures -483.86MphasiS Ltd Software 436.33 0.77%MphasiS Ltd- Futures -436.72Essar Oil Ltd Oil 413.24 0.73%Essar Oil Ltd- Futures -417.53Debt Holdings 18,342.10 32.29%PSU/PFI Bonds 987.91 1.74%Infrastructure Development Finance Corporation AAA 987.91 1.74%Private Corporate Securities 23.71 0.04%PTC TVS Finance AAA(SO) 23.71 0.04%CPs, CDs and Term Deposits 7,754.00 13.65%ICICI Bank Ltd P1+ 7,754.00 13.65%Cash, Call, CBLO & Reverse Repo 9,576.48 16.86%Other Current Assets (631.28) -1.11%Total Net Assets 56,812.55 100.00%
• Top Five Holdings
Performance Record* - Growth Option
* Returns >= 1 Year are CAGR, < 1 Year are Absolute. Benchmark is CrisilShort Term Bond Fund Index. For Computation of returns the allotment NAVhas been taken as Rs 10.00. Past performance may or may not be sustainedin future.
Rating Profile (as % of total debt components)
Maturity Profile: (as % of total debt components)
Asset Allocation: (as % of Net Assets)
Quantitative Indicators:
Average Maturity : 0.24 yearModified Duration : 0.18 yearYield To Maturity : 5.40%% Unlisted Bonds : 1.74%
WHY SHOULD ONE INVEST?Opportunity to enhance returns from a blend of equity & equity arbitrage (atleast 51%)
and low volatility returns from a minimum debt exposure of 25% for a short time horizon
4.72%
8.90%8.28%
4.58%
7.38%5.96%
0.00%1.00%2.00%3.00%4.00%5.00%6.00%7.00%8.00%9.00%
10.00%
Last 6 Months Last 1 year Since Inception
Blanded Plan A Crisil Short Term Bond Fund Index
Call,Current Assets and
Reverse Repos50.50%
AAA and Equivalent49.50%
97.99%
5.58%
0.01%
-3.58%
-40.00% 0.00% 40.00% 80.00% 120.00%
<182 days
3-5 years
1-3 years
Other Current Assets
Unhedged Equity
Holdings0.00%
Debt Holdings31.18%
Hedged Equity
Holdings68.82%

25
Performance Record* - Growth Option
* Returns >= 1 Year are CAGR, < 1 Year are Absolute. Benchmark is CrisilShort Term Bond Fund Index. For Computation of returns the allotment NAVhas been taken as Rs 10.00. Past performance may or may not be sustainedin future.
Quantitative Indicators:
Rating Profile (as % of total debt components)
Maturity Profile: (as % of total debt components)
Snapshot:Fund Managers: Debt : Chaitanya Pande
Equity : Yogesh BhattIndicative Investment Horizon: 6 months-1 yearInception date: 31-05-2005Fund Size: Rs. 40.01 croresNAV (As on 31-July-2007):
Growth option : Rs. 11.6836Dividend option : Rs. 10.9841
**Expense Ratio:Blended Plan B : 1.49%
**This is a close approximation of the number.
ICICI Prudential Blended Plan BPortfolio
Company/Issuer Sector/Rating Mkt Value %NAV Mkt Value(Rs. Lakh) (Rs. Lakh)-Futures
Equity Holdings 1,242.35 31.06% (1,251.70)
• Union Bank of India Ltd Banks 343.76 8.59%
Union Bank of India Ltd- Futures -346.74
• ICICI Bank Ltd Banks 334.35 8.36%
ICICI Bank Ltd- Futures -336.49
• Financial Technologies Ltd Software 190.45 4.76%
Financial Technologies Ltd- Futures -192.47
Pantaloon Retail (India) Ltd Retailing 147.55 3.69%
Pantaloon Retail (India) Ltd- Futures -148.9
Voltas Ltd Consumer Durables 127.49 3.19%
Voltas Ltd- Futures -128.57
Nicholas Piramal India Ltd Pharmaceuticals 98.75 2.47%
Nicholas Piramal India Ltd- Futures -98.53
Debt Holdings 2,453.27 61.32%
PSU/PFI Bonds 0.98 0.02%
Power Finance Corporation Ltd AAA 0.98 0.02%
Private Corporate Securities 1,693.55 42.33%
• Tata Sons Ltd AAA 833.55 20.84%
• PTC IBL Trust IndusInd Bank AAA(SO) 819.43 20.48%
PTC TVS Finance AAA(SO) 40.57 1.01%
CPs, CDs and Term Deposits 350.00 8.75%
ICICI Bank Ltd P1+ 350.00 8.75%
Cash, Call, CBLO & Reverse Repo 408.74 10.22%
Other Current Assets 304.95 7.62%
Total Net Assets 4,000.57 100.00%
• Top Five Holdings
Average Maturity : 0.98 yearModified Duration : 0.90 yearYield To Maturity : 7.84%% Unlisted Bonds : 0.00%
Figures as on 31-July-2007
WHY SHOULD ONE INVEST?Generate low volaility returns from debt (atleast 51%) along with
an opportunity to enhance returns from equity arbitrage (maximum 49%)
5.01%
8.50%7.44%
4.58%
7.38%
5.96%
0.00%1.00%2.00%3.00%4.00%5.00%6.00%7.00%8.00%9.00%
Last 6 Months Last 1 year Since Inception
Blanded Plan B Crisil Short Term Bond Fund Index
AAA and Equivalent74.12%
Call,Current Assets and
Reverse Repos25.88%
30.26%
29.71%
11.06%
28.98%
0.00% 20.00% 40.00%
1-3 years
182 days - 1 year
<182 days
Other Current Assets

26
SIP Return: As on 31-July-2007
Period SIP Start Date Total Amount Total No. Market Value SIPInvested of Units Returns
1 Year SIP 31-Aug-06 12,000.00 351.58 13,117.45 21.01%3 Year SIP 31-Aug-04 36,000.00 1,424.88 53,162.27 28.54%5 Year SIP 30-Aug-02 60,000.00 3,468.29 129,401.90 32.28%Since Inception 3-Nov-99 94,000.00 7,047.98 262,960.13 25.99%
Past performance may or may not be sustained in future. Assume Rs. 1000 invested every month. Thehigh level of returns come from the sharp appreciation in market, in the year 2002, 2004 & 2006.
Quantitative Indicators – Debt Component Quantitative Indicators – Equity Component
Average Maturity : 3.62 yearsModified Duration : 2.40 yearsYield To Maturity : 7.39%
Average P/E : 21Average P/BV : 3.88Average Dividend Yield : 1.03
% Unlisted Bonds : 9.22%
Maturity Profile (as % of debt holding)
Sector Allocation* (as % of equity portfolio)
Snapshot:Fund Managers: Equity : Deven Sangoi
Debt : Pankaj KajiIndicative Investment Horizon: 3 yrs & moreInception date: 03-11-1999Fund Size: Rs. 425.25 croresNAV (As on 31-July-2007):
Growth option : Rs. 37.31Dividend option : Rs. 18.31
**Expense Ratio: 2.20%**This is a close approximation of the number.
WHY SHOULD ONE INVEST?Medium term investment of funds in a portfolio of
equity (minimum) 65% and debt for capital appreciation.
Rs. 10000 invested at inception*: Balanced Fund Vs Crisil Balanced Fund Index
Performance Record *- Growth Option
*Benchmark start date - 31.03.2002. CAGR – Balanced Fund : 29.64%;Benchmark : 20.44%. Past performance may or may not be sustained infuture.
*Returns < 1 Year : Absolute, > = 1Year : CAGR. Benchmark - Crisil BalancedFund Index and start date - 31.03.2002. For computation of returns theallotment NAV has been taken as Rs. 10.00. Past performance may or may notbe sustained in future. 31-Jul-04 was a non business day.
Equity Holdings 31,619.34 74.34%• Reliance Industries Ltd Petroleum Products 3,739.44 8.79%• Bharati Airtel Ltd. Telecom Services 1,872.94 4.40%• AIA Engineering Ltd Industrial Products 1,665.86 3.92%• ICICI Bank Ltd Banks 1,664.65 3.91%
Jain Irrigation Systems Ltd Industrial Products 1,642.64 3.86%Bharat Electonics Ltd Industrial Capital Goods 1,576.37 3.71%Oil & Natural Gas Company Ltd-Futures Oil 1,333.53 3.14%Grasim Industries Ltd Cement 1,206.15 2.84%HCL Technologies Limited Software 1,199.23 2.82%Bharat Heavy Electricals Ltd Industrial Capital Goods 1,139.30 2.68%Punjab National Bank Banks 1,083.81 2.55%Tata Consultancy Services Ltd Software 991.77 2.33%Sterlite Optical Technologies Ltd Industrial Products 951.73 2.24%Reliance Communications Ventures Ltd Telecom Services 924.30 2.17%United Phosphorus Ltd Pesticides 913.52 2.15%CMC Ltd. Hardware 885.63 2.08%Dr. Reddy’s Laboratories Ltd Pharmaceuticals 854.02 2.01%Sun Pharmaceutical Industries Ltd Pharmaceuticals 853.26 2.01%Sterlite Industries (India) Limited Non-Ferrous Metals 826.50 1.94%HOV Services Ltd Software 804.30 1.89%Century Textiles & Industries Ltd Cement 727.90 1.71%IVRCL Infrastructure & Projects Ltd Construction 718.24 1.69%Bank of Baroda Ltd Banks 662.76 1.56%Time Technoplast Ltd Chemicals 550.32 1.29%Steel Authority of India Ltd Ferrous Metals 511.51 1.20%Cummins India Ltd Industrial Products 505.52 1.19%Sundaram Clayton Ltd Auto Ancillaries 502.68 1.18%Tata Steel Ltd Ferrous Metals 477.35 1.12%Andhra Bank Ltd Banks 435.30 1.02%Sadbhav Engineering Ltd Construction 321.38 0.76%Siemens India Limited Industrial Capital Goods 43.61 0.10%Oil & Natural Gas Company Ltd Oil 17.07 0.04%Asian Paints Ltd Consumer Non-Durable 9.74 0.02%Simplex Projects Ltd Construction 7.01 0.02%Debt Holdings 12,978.29 30.51%PSU/PFI Bonds 2,415.08 5.67%Infrastructure Development Finance Corp. AAA 1,481.86 3.48%Indian Railway Finance Corporation AAA 933.22 2.19%Private Corporate Securities 1,536.36 3.61%PTC RPS Tata Teleservices AAA(SO) 777.02 1.83%Tata Sons Ltd AAA 750.19 1.76%PTC TAS Trust Tata Sons A1+(SO) 9.15 0.02%Government Securities 2,440.25 5.74%
• 7.49% GOI 2017 Sovereign 2,440.25 5.74%CPs, CDs and Term Deposits 3,838.00 9.03%ICICI Bank Ltd P1+ 3,088.00 7.26%Allahabad Bank Ltd P1+ 450.00 1.06%Punjab National Bank Ltd P1+ 300.00 0.71%Cash, Call, CBLO & Reverse Repo 2,748.60 6.46%Other Current Assets (2,072.47) -4.85%Total Net Assets 42,525.16 100.00%
• Top Five Holdings
Portfolio
Company/Issuer Sector/Rating Mkt Value (Rs. Lakh) % to NAV
Figures as on 31-July-2007
*Pertains to the equity investments only.
Style Box:Debt Equity
ICICI Prudential Balanced Fund
4.72%
30.32%33.78% 33.02%
18.53%
8.65%
28.64%25.10% 24.14%
0.00%5.00%
10.00%15.00%20.00%25.00%30.00%35.00%40.00%
Last 6Months
Last 1year
Last 3years
Last 5years
SinceInception
Balanced Fund Crisil Balanced Fund Index
Rs 39903.74
Rs 26958.17
8,98613,986
18,98623,98628,98633,986
38,98643,986
Apr-0
2Ju
l-02
Oct
-02
Jan-
03Ap
r-03
Jul-0
3O
ct-0
3Ja
n-04
Apr-0
4Ju
l-04
Oct
-04
Jan-
05Ap
r-05
Jul-0
5O
ct-0
5Ja
n-06
Apr-0
6Ju
l-06
Oct
-06
Jan-
07Ap
r-07
Jul-0
7
Balanced Fund Crisil Balanced Fund Index
15.08%12.17%
11.83%9.47%
8.84%8.73%
6.11%5.40%
4.27%3.31%3.13%
2.89%2.80%2.61%
1.74%1.59%
0.03%
0.00% 4.00% 8.00% 12.00% 16.00%
Industrial ProductsBanks
Petroleum ProductsSoftware
Telecom ServicesIndustrial Capital
CementPharmaceuticals
OilConstruction
Ferrous MetalsPesticidesHardware
Non-Ferrous MetalsChemicals
Auto AncillariesConsumer Non-Durable
60.48%
22.38%
13.59%
-19.01%
8.56%
14.01%
-40.00% -20.00% 0.00% 20.00% 40.00% 60.00% 80.00%
<182 days
5-10 years
1-3 years
3-5 years
> 10 years
Other Current Assets
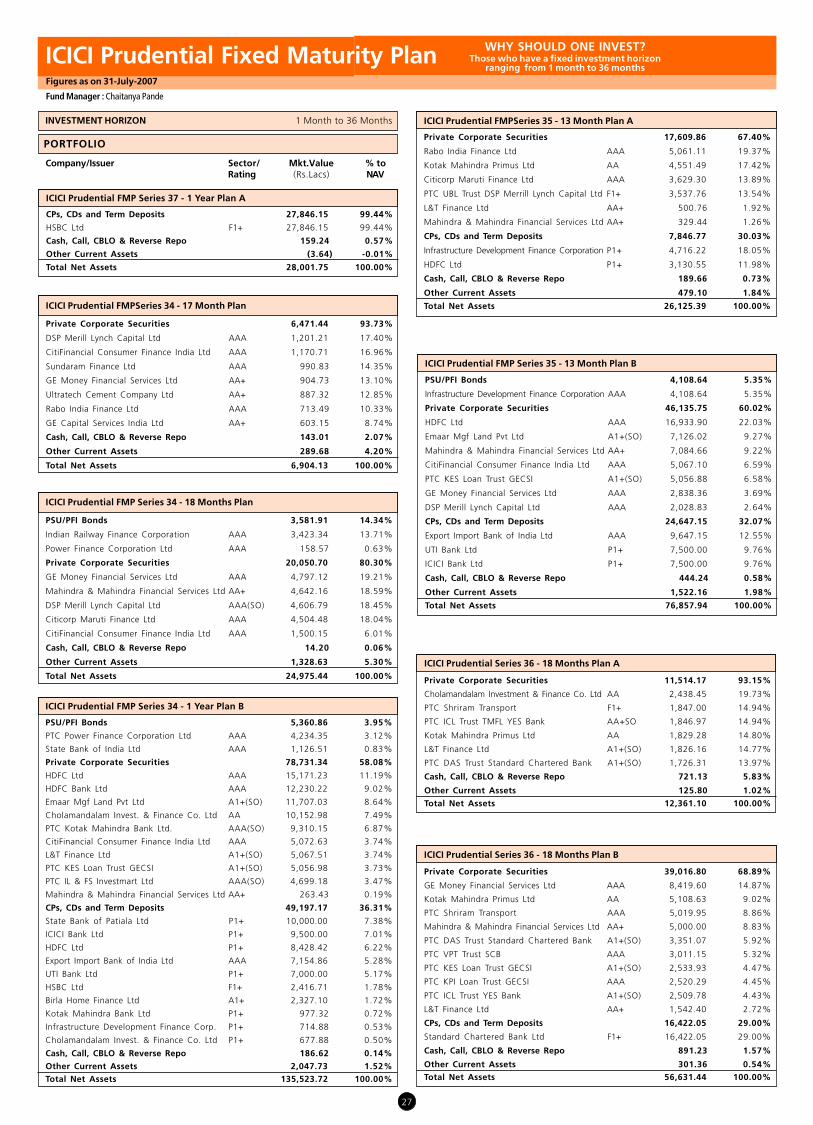
27
INVESTMENT HORIZON 1 Month to 36 Months
ICICI Prudential Fixed Maturity Plan WHY SHOULD ONE INVEST?Those who have a fixed investment horizon
ranging from 1 month to 36 monthsFigures as on 31-July-2007
Fund Manager : Chaitanya Pande
PORTFOLIO
Company/Issuer Sector/ Mkt.Value % toRating (Rs.Lacs) NAV
ICICI Prudential FMPSeries 34 - 17 Month Plan
Private Corporate Securities 6,471.44 93.73%
DSP Merill Lynch Capital Ltd AAA 1,201.21 17.40%
CitiFinancial Consumer Finance India Ltd AAA 1,170.71 16.96%
Sundaram Finance Ltd AAA 990.83 14.35%
GE Money Financial Services Ltd AA+ 904.73 13.10%
Ultratech Cement Company Ltd AA+ 887.32 12.85%
Rabo India Finance Ltd AAA 713.49 10.33%
GE Capital Services India Ltd AA+ 603.15 8.74%
Cash, Call, CBLO & Reverse Repo 143.01 2.07%
Other Current Assets 289.68 4.20%
Total Net Assets 6,904.13 100.00%
ICICI Prudential FMP Series 37 - 1 Year Plan A
CPs, CDs and Term Deposits 27,846.15 99.44%
HSBC Ltd F1+ 27,846.15 99.44%
Cash, Call, CBLO & Reverse Repo 159.24 0.57%
Other Current Assets (3.64) -0.01%
Total Net Assets 28,001.75 100.00%
ICICI Prudential FMP Series 34 - 18 Months Plan
PSU/PFI Bonds 3,581.91 14.34%
Indian Railway Finance Corporation AAA 3,423.34 13.71%
Power Finance Corporation Ltd AAA 158.57 0.63%
Private Corporate Securities 20,050.70 80.30%
GE Money Financial Services Ltd AAA 4,797.12 19.21%
Mahindra & Mahindra Financial Services Ltd AA+ 4,642.16 18.59%
DSP Merill Lynch Capital Ltd AAA(SO) 4,606.79 18.45%
Citicorp Maruti Finance Ltd AAA 4,504.48 18.04%
CitiFinancial Consumer Finance India Ltd AAA 1,500.15 6.01%
Cash, Call, CBLO & Reverse Repo 14.20 0.06%
Other Current Assets 1,328.63 5.30%
Total Net Assets 24,975.44 100.00%
ICICI Prudential FMP Series 34 - 1 Year Plan B
PSU/PFI Bonds 5,360.86 3.95%
PTC Power Finance Corporation Ltd AAA 4,234.35 3.12%
State Bank of India Ltd AAA 1,126.51 0.83%
Private Corporate Securities 78,731.34 58.08%
HDFC Ltd AAA 15,171.23 11.19%
HDFC Bank Ltd AAA 12,230.22 9.02%
Emaar Mgf Land Pvt Ltd A1+(SO) 11,707.03 8.64%
Cholamandalam Invest. & Finance Co. Ltd AA 10,152.98 7.49%
PTC Kotak Mahindra Bank Ltd. AAA(SO) 9,310.15 6.87%
CitiFinancial Consumer Finance India Ltd AAA 5,072.63 3.74%
L&T Finance Ltd A1+(SO) 5,067.51 3.74%
PTC KES Loan Trust GECSI A1+(SO) 5,056.98 3.73%
PTC IL & FS Investmart Ltd AAA(SO) 4,699.18 3.47%
Mahindra & Mahindra Financial Services Ltd AA+ 263.43 0.19%
CPs, CDs and Term Deposits 49,197.17 36.31%
State Bank of Patiala Ltd P1+ 10,000.00 7.38%
ICICI Bank Ltd P1+ 9,500.00 7.01%
HDFC Ltd P1+ 8,428.42 6.22%
Export Import Bank of India Ltd AAA 7,154.86 5.28%
UTI Bank Ltd P1+ 7,000.00 5.17%
HSBC Ltd F1+ 2,416.71 1.78%
Birla Home Finance Ltd A1+ 2,327.10 1.72%
Kotak Mahindra Bank Ltd P1+ 977.32 0.72%
Infrastructure Development Finance Corp. P1+ 714.88 0.53%
Cholamandalam Invest. & Finance Co. Ltd P1+ 677.88 0.50%
Cash, Call, CBLO & Reverse Repo 186.62 0.14%
Other Current Assets 2,047.73 1.52%Total Net Assets 135,523.72 100.00%
ICICI Prudential Series 36 - 18 Months Plan A
Private Corporate Securities 11,514.17 93.15%
Cholamandalam Investment & Finance Co. Ltd AA 2,438.45 19.73%
PTC Shriram Transport F1+ 1,847.00 14.94%
PTC ICL Trust TMFL YES Bank AA+SO 1,846.97 14.94%
Kotak Mahindra Primus Ltd AA 1,829.28 14.80%
L&T Finance Ltd A1+(SO) 1,826.16 14.77%
PTC DAS Trust Standard Chartered Bank A1+(SO) 1,726.31 13.97%
Cash, Call, CBLO & Reverse Repo 721.13 5.83%
Other Current Assets 125.80 1.02%
Total Net Assets 12,361.10 100.00%
ICICI Prudential FMPSeries 35 - 13 Month Plan A
Private Corporate Securities 17,609.86 67.40%
Rabo India Finance Ltd AAA 5,061.11 19.37%
Kotak Mahindra Primus Ltd AA 4,551.49 17.42%
Citicorp Maruti Finance Ltd AAA 3,629.30 13.89%
PTC UBL Trust DSP Merrill Lynch Capital Ltd F1+ 3,537.76 13.54%
L&T Finance Ltd AA+ 500.76 1.92%
Mahindra & Mahindra Financial Services Ltd AA+ 329.44 1.26%
CPs, CDs and Term Deposits 7,846.77 30.03%
Infrastructure Development Finance Corporation P1+ 4,716.22 18.05%
HDFC Ltd P1+ 3,130.55 11.98%
Cash, Call, CBLO & Reverse Repo 189.66 0.73%
Other Current Assets 479.10 1.84%
Total Net Assets 26,125.39 100.00%
ICICI Prudential FMP Series 35 - 13 Month Plan B
PSU/PFI Bonds 4,108.64 5.35%
Infrastructure Development Finance Corporation AAA 4,108.64 5.35%
Private Corporate Securities 46,135.75 60.02%
HDFC Ltd AAA 16,933.90 22.03%
Emaar Mgf Land Pvt Ltd A1+(SO) 7,126.02 9.27%
Mahindra & Mahindra Financial Services Ltd AA+ 7,084.66 9.22%
CitiFinancial Consumer Finance India Ltd AAA 5,067.10 6.59%
PTC KES Loan Trust GECSI A1+(SO) 5,056.88 6.58%
GE Money Financial Services Ltd AAA 2,838.36 3.69%
DSP Merill Lynch Capital Ltd AAA 2,028.83 2.64%
CPs, CDs and Term Deposits 24,647.15 32.07%
Export Import Bank of India Ltd AAA 9,647.15 12.55%
UTI Bank Ltd P1+ 7,500.00 9.76%
ICICI Bank Ltd P1+ 7,500.00 9.76%
Cash, Call, CBLO & Reverse Repo 444.24 0.58%
Other Current Assets 1,522.16 1.98%
Total Net Assets 76,857.94 100.00%
ICICI Prudential Series 36 - 18 Months Plan B
Private Corporate Securities 39,016.80 68.89%
GE Money Financial Services Ltd AAA 8,419.60 14.87%
Kotak Mahindra Primus Ltd AA 5,108.63 9.02%
PTC Shriram Transport AAA 5,019.95 8.86%
Mahindra & Mahindra Financial Services Ltd AA+ 5,000.00 8.83%
PTC DAS Trust Standard Chartered Bank A1+(SO) 3,351.07 5.92%
PTC VPT Trust SCB AAA 3,011.15 5.32%
PTC KES Loan Trust GECSI A1+(SO) 2,533.93 4.47%
PTC KPI Loan Trust GECSI AAA 2,520.29 4.45%
PTC ICL Trust YES Bank A1+(SO) 2,509.78 4.43%
L&T Finance Ltd AA+ 1,542.40 2.72%
CPs, CDs and Term Deposits 16,422.05 29.00%
Standard Chartered Bank Ltd F1+ 16,422.05 29.00%
Cash, Call, CBLO & Reverse Repo 891.23 1.57%
Other Current Assets 301.36 0.54%Total Net Assets 56,631.44 100.00%

28
ICICI Prudential Fixed Maturity Plan WHY SHOULD ONE INVEST?Those who have a fixed investment horizon
ranging from 1 month to 36 monthsFigures as on 31-July-2007
Fund Manager : Chaitanya Pande
ICICI Prudential FMP Series 34 - 16 months plan
PSU/PFI Bonds 3,014.65 10.18%
Infrastructure Development Finance Corporation AAA 3,014.65 10.18%
Private Corporate Securities 20,670.66 69.78%
CitiFinancial Consumer Finance India Ltd AAA 5,113.83 17.27%
DSP Merill Lynch Capital Ltd AAA(SO) 3,717.82 12.55%
Rabo India Finance Ltd AAA 3,027.23 10.22%
L&T Finance Ltd AA+ 3,004.54 10.14%
Citicorp Finance (India) Ltd AAA 2,493.53 8.42%
GE Capital Services India Ltd AA+ 1,407.35 4.75%
GE Money Financial Services Ltd AA+ 1,105.78 3.73%
PTC DAS Trust Standard Chartered Bank A1+(SO) 800.58 2.70%
CPs, CDs and Term Deposits 4,254.07 14.36%
Standard Chartered Bank Ltd F1+ 3,483.47 11.76%
HDFC Ltd P1+ 770.60 2.60%
Cash, Call, CBLO & Reverse Repo 530.92 1.79%
Other Current Assets 1,149.25 3.89%
Total Net Assets 29,619.55 100.00%
ICICI Prudential FMPseries 34 - 15 months plan
PSU/PFI Bonds 3,938.82 9.15%
Infrastructure Development Finance Corporation AAA 3,938.82 9.15%
Private Corporate Securities 32,139.63 74.67%
Kotak Mahindra Primus Ltd AA 6,063.96 14.09%
CitiFinancial Consumer Finance India Ltd AAA 5,266.42 12.24%
GE Capital Services India Ltd AAA 5,070.05 11.78%
Citicorp Finance (India) Ltd AAA 5,065.76 11.77%
GE Money Financial Services Ltd AAA 3,033.82 7.05%
PTC DAS Trust Standard Chartered Bank A1+(SO) 3,025.52 7.03%
Rabo India Finance Ltd AAA 2,018.15 4.69%
Sundaram Finance Ltd AAA 1,486.25 3.45%
Ultratech Cement Company Ltd AA+ 591.55 1.37%
Citicorp Maruti Finance Ltd AAA 298.30 0.69%
DSP Merill Lynch Capital Ltd AAA(SO) 219.85 0.51%
CPs, CDs and Term Deposits 2,119.14 4.92%
HDFC Ltd P1+ 2,119.14 4.92%
Cash, Call, CBLO & Reverse Repo 3,565.19 8.29%
Other Current Assets 1,266.95 2.97%
Total Net Assets 43,029.73 100.00%
ICICI Prudential Series 37 - 3 Months Plus Plan B
Private Corporate Securities 16,000.00 28.82%
Rabo India Finance Ltd P1+ 8,000.00 14.41%
GE Money Financial Services Ltd P1+ 8,000.00 14.41%
CPs, CDs and Term Deposits 39,074.99 70.39%
HDFC Bank Ltd P1+ 13,297.79 23.95%
IDBI Bank Ltd P1+ 11,517.64 20.75%
State Bank of Patiala Ltd P1+ 6,182.24 11.14%
Allahabad Bank Ltd P1+ 5,390.00 9.71%
Kotak Mahindra Bank Ltd P1+ 2,687.32 4.84%
Cash, Call, CBLO & Reverse Repo 6.09 0.01%
Other Current Assets 436.44 0.78%
Total Net Assets 55,517.52 100.00%
ICICI Prudential FMP Series 37 - 14 Months Plan
PSU/PFI Bonds 3,250.23 14.67%
Infrastructure Development Finance Corporation AAA 3,250.23 14.67%
Private Corporate Securities 14,341.19 64.75%
HDFC Ltd AAA 4,376.63 19.76%
DSP Merill Lynch Capital Ltd AAA 4,057.67 18.32%
Mahindra & Mahindra Financial Services Ltd AA+ 2,776.10 12.53%
GE Money Financial Services Ltd AAA 2,230.14 10.07%
PTC DAS Trust Standard Chartered Bank A1+(SO) 900.65 4.07%
CPs, CDs and Term Deposits 4,000.00 18.06%
UTI Bank Ltd P1+ 2,000.00 9.03%
ICICI Bank Ltd P1+ 2,000.00 9.03%
Cash, Call, CBLO & Reverse Repo 29.41 0.13%
Other Current Assets 530.11 2.39%
Total Net Assets 22,150.94 100.00%
ICICI Prudential FMP Series 34 - 6 Months Plan
PSU/PFI Bonds 0.98 0.01%Power Finance Corporation Ltd AAA 0.98 0.01%Private Corporate Securities 2,500.00 13.87%Emaar Mgf Land Pvt Ltd A1+(SO) 2,500.00 13.87%CPs, CDs and Term Deposits 14,819.89 82.24%Standard Chartered Bank Ltd F1+ 4,976.38 27.62%Jammu & Kashmir Bank Ltd AAA 3,625.51 20.12%IDBI Bank Ltd P1+ 3,218.00 17.86%UTI Bank Ltd P1+ 1,500.00 8.32%ICICI Bank Ltd P1+ 1,500.00 8.32%Cash, Call, CBLO & Reverse Repo 540.96 3.00%Other Current Assets 158.53 0.88%Total Net Assets 18,020.36 100.00%
ICICI Prudential FMP Series 38 - 1 Year Plan A
Private Corporate Securities 8,091.15 34.42%
PTC Electrosteel Castings Ltd GTL Trust A1+(SO) 3,534.75 15.04%
Sundaram Finance Ltd A1+ 2,527.35 10.75%
Kotak Mahindra Primus Ltd AA 2,029.05 8.63%
CPs, CDs and Term Deposits 15,263.87 64.96%
Industrial Development Bank of India A1+ 9,239.42 39.32%
Allahabad Bank Ltd A1+ 3,785.54 16.11%
IDBI Bank Ltd P1+ 2,238.91 9.53%
Cash, Call, CBLO & Reverse Repo 42.60 0.18%
Other Current Assets 103.25 0.44%
Total Net Assets 23,500.87 100.00%
ICICI Prudential Series 35 - 1 Year Plan
Private Corporate Securities 4,261.22 17.84%
CitiFinancial Consumer Finance India Ltd AAA(SO) 2,538.86 10.63%
HDFC Ltd AAA 1,652.53 6.92%
Citicorp Maruti Finance Ltd AAA 49.72 0.21%
Citicorp Finance (India) Ltd AAA 20.11 0.08%
CPs, CDs and Term Deposits 19,504.45 81.67%
Kotak Mahindra Bank Ltd P1+ 5,197.54 21.76%
American Express Bank Ltd P1+ 5,108.90 21.39%
HSBC Ltd F1+ 5,019.32 21.02%
Cholamandalam Investment & Finance Co. Ltd P1+ 4,178.69 17.50%
Cash, Call, CBLO & Reverse Repo 45.64 0.19%
Other Current Assets 73.02 0.30%
Total Net Assets 23,884.33 100.00%
ICICI Prudential Series 38 - 3 Months Plan B
Private Corporate Securities 1,981.89 2.74%
Kotak Mahindra Primus Ltd P1+ 1,981.89 2.74%
CPs, CDs and Term Deposits 70,147.64 96.94%
Industrial Development Bank of India P1+ 5,137.17 7.10%
Indiabulls Financial Services Ltd P1+ 4,986.90 6.89%
Allahabad Bank Ltd P1+ 4,508.18 6.23%
Indian Bank Ltd A1+ 9,889.31 13.67%
GE Capital Services India Ltd P1+ 9,884.42 13.66%
Union Bank of India Ltd P1+ 9,881.46 13.66%
HDFC Bank Ltd P1+ 9,864.83 13.63%
Standard Chartered Bank Ltd P1+ 9,856.81 13.62%
State Bank of Patiala Ltd P1+ 6,138.56 8.48%
Cash, Call, CBLO & Reverse Repo 140.98 0.19%
Other Current Assets 88.04 0.13%
Total Net Assets 72,358.55 100.00%
ICICI Prudential FMP Series 38 - 1 Year Plan B
PSU/PFI Bonds 994.63 24.27%
Nabard AAA 498.63 12.17%
Indian Railway Finance Corporation AAA 496.00 12.10%
Private Corporate Securities 1,000.52 24.41%
Mahindra & Mahindra Financial Services Ltd AA+ 500.37 12.21%
Sundaram Finance Ltd AA+ 500.15 12.20%
CPs, CDs and Term Deposits 925.11 22.57%
L&T Finance Ltd P1+ 925.11 22.57%
Cash, Call, CBLO & Reverse Repo 1,058.87 25.84%
Other Current Assets 119.43 2.91%
Total Net Assets 4,098.56 100.00%

29
ICICI Prudential Fixed Maturity Plan WHY SHOULD ONE INVEST?Those who have a fixed investment horizon
ranging from 1 month to 36 monthsFigures as on 31-July-2007
Fund Manager : Chaitanya Pande
ICICI Prudential FMP 34_1 Year Plan A
PSU/PFI Bonds 0.98 0.01%Power Finance Corporation Ltd AAA 0.98 0.01%Private Corporate Securities 8,553.64 52.56%GE Money Financial Services Ltd AAA 2,284.98 14.04%DSP Merill Lynch Capital Ltd P1+ 2,284.36 14.04%HDFC Ltd AAA 2,001.94 12.30%Hindalco Industries Ltd AAA 1,982.36 12.18%CPs, CDs and Term Deposits 5,238.86 32.20%Bajaj Auto Ltd P1+ 2,238.86 13.76%UTI Bank Ltd P1+ 1,500.00 9.22%Punjab National Bank Ltd P1+ 1,500.00 9.22%Cash, Call, CBLO & Reverse Repo 1,900.69 11.68%Other Current Assets 576.97 3.55%Total Net Assets 16,271.14 100.00%
ICICI Prudential Series 38 - 3 Months Plan D
Private Corporate Securities 2,400.00 26.54%JM Financial & Investment ConsultancyServices Pvt. Ltd P1+ 1,200.00 13.27%Cholamandalam Investment & Finance Co. Ltd P1+ 1,200.00 13.27%CPs, CDs and Term Deposits 6,591.42 72.88%HSBC Ltd F1+ 4,845.42 53.57%National Housing Bank Ltd P1+ 1,746.00 19.31%Cash, Call, CBLO & Reverse Repo 33.47 0.37%Other Current Assets 19.30 0.21%Total Net Assets 9,044.19 100.00%
ICICI Prudential Series 38 - 3 Months Plan C
PSU/PFI Bonds 1,500.00 12.02%
CanBank Factors Ltd P1+ 1,500.00 12.02%
Private Corporate Securities 1,500.00 12.02%
Birla Global Finance Ltd A1+ 1,500.00 12.02%
CPs, CDs and Term Deposits 9,402.65 75.32%
Infrastructure Development Finance Corporation P1+ 4,497.78 36.03%
State Bank of India Ltd P1+ 4,468.37 35.79%
National Housing Bank Ltd P1+ 436.50 3.50%
Cash, Call, CBLO & Reverse Repo 35.50 0.28%
Other Current Assets 45.92 0.36%
Total Net Assets 12,484.07 100.00%
PERFORMANCEPerformance Records for FMP- Retail Growth Plan
Scheme Name Date Period NAV *NAV as on Returns25-July-07
ICICI Prudential Hybrid FMP13 Months Plan 30-Aug-06 Since inception 10.0000 10.6595 6.60%
ICICI Prudential FMP Series34 - 1 Year Plan A 11-Nov-06 Since inception 10.0000 10.5123 5.12%
ICICI Prudential FMP Series34 - 18 Months Plan 25-Nov-06 Since inception 10.0000 10.5491 5.49%
ICICI Prudential FMP Series34 - 17 Months Plan 23-Dec-06 Since inception 10.0000 10.5273 5.27%
ICICI Prudential FMP Series34 - 16 Months Plan 22-Jan-07 Since inception 10.0000 10.4953 4.95%
ICICI Prudential FMP Series34 - 15 Months Plan 27-Feb-07 Since inception 10.0000 10.5139 5.14%
ICICI Prudential FMP Series35 - 13 Months Plan A 9-Mar-07 Since inception 10.0000 10.4655 4.66%
ICICI Prudential FMP Series34 - 6 Months Plan 9-Mar-07 Since inception 10.0000 10.3812 3.81%
ICICI Prudential FMP Series35 - 13 Months Plan B 16-Mar-07 Since inception 10.0000 10.4680 4.68%
ICICI Prudential FMPSeries37 - 14 Months Plan 23-Mar-07 Since inception 10.0000 10.4651 4.65%
ICICI Prudential FMP Series34 - 1 Year Plan B 29-Mar-07 Since inception 10.0000 10.4506 4.51%
ICICI Prudential FMP Series37 - 1 Year Plan A 30-Mar-07 Since inception 10.0000 10.3290 3.29%
ICICI Prudential FMP Series35 - 1 Year Plan 19-Apr-07 Since inception 10.0000 10.3062 3.06%
ICICI Prudential FMPSeries37 - 3 Months Plus Plan B 27-Apr-07 Since inception 10.0000 10.2552 2.55%
ICICI Prudential FMP Series38 - 3 Months Plan B 11-May-07 Since inception 10.0000 10.2055 2.06%
ICICI Prudential FMP Series38 - 1 Year Plan A 18-May-07 Since inception 10.0000 10.2438 2.44%
ICICI Prudential FMP Series38 - 3 Months Plan C 30-May-07 Since inception 10.0000 10.1338 1.34%
ICICI Prudential FMP Series36 - 18 Months Plan A 31-May-07 Since inception 10.0000 10.2703 2.70%
ICICI Prudential FMP Series38 - 3 Months Plan D 29-Jun-07 Since inception 10.0000 10.0578 0.58%
ICICI Prudential FMP Series36 - 18 Months Plan B 13-Jul-07 Since inception 10.0000 10.0278 0.28%
* NAV is declared on a weekly basis.
Returns >= 1 Year are CAGR, < 1 Year are Absolute. Note: For computation of returns theallotment NAV has been taken as Rs 10.00. Past performance may or may not be sustainedin the future.
PS: The units under ICICI Prudential FMP Series 38 - 1 Year Plan B were alloted on26-Jul-07 and the NAV for the same would be declared on 01-Aug-07.
Fund Size Rs. 7,816.72 Crores
ICICI Prudential Hybrid FMP - 13 Months
PSU/PFI Bonds 9,952.55 11.80%Infrastructure Development Finance Corporation AAA 9,952.55 11.80%Private Corporate Securities 28,882.63 34.26%HDFC Ltd AAA 13,928.21 16.52%Reliance Capital Finance Ltd A1+ 5,000.00 5.93%PTC GE Capital Services India Ltd AAA 9,954.42 11.81%CPs, CDs and Term Deposits 38,852.16 46.07%Punjab National Bank Ltd F1+ 12,116.48 14.37%American Express Bank Ltd P1+ 9,789.37 11.61%Industrial Development Bank of India P1+ 8,400.00 9.96%Allahabad Bank Ltd P1+ 8,400.00 9.96%Kotak Mahindra Bank Ltd P1+ 146.31 0.17%Cash, Call, CBLO & Reverse Repo 2,779.03 3.30%Other Current Assets 3,845.14 4.57%Total Net Assets 84,311.51 100.00%

30
ICICI Prudential Interval Fund WHY SHOULD ONE INVEST?Risk averse investors seeking returns on a held
to maturity basis.Figures as on 31-July-2007
Fund Manager : Chaitanya Pande
INVESTMENT HORIZON 1 Month to 15 Months
PORTFOLIO
Company/Issuer Sector/ Mkt.Value % toRating (Rs.Lacs) NAV
ICICI Prudential Interval Fund-Qtrly Int Plan III
CPs, CDs and Term Deposits 194.68 45.42%
Bajaj Auto Ltd P1+ 194.68 45.42%
Cash, Call, CBLO & Reverse Repo 233.28 54.42%
Other Current Assets 0.70 0.16%
Total Net Assets 428.66 100.00%
ICICI Prudential Interval Fund-Qtrly Int Plan II
Private Corporate Securities 2,500.00 11.13%
Blue Star Ltd P1+ 1,500.00 6.68%
Birla Global Finance Ltd A1+ 1,000.00 4.45%
CPs, CDs and Term Deposits 19,066.71 84.90%
Standard Chartered Investment & Loan (India) Ltd P1+ 5,763.17 25.66%
UCO Bank AAA 6,921.79 30.82%
Citibank P1+ 4,933.49 21.97%
Bajaj Auto Ltd P1+ 1,448.26 6.45%
Cash, Call, CBLO & Reverse Repo 867.18 3.86%
Other Current Assets 21.87 0.11%
Total Net Assets 22,455.76 100.00%
PERFORMANCEPerformance Records for Interval Fund - Retail Growth Plan
Scheme Name Date Period NAV NAV as On Returns31-July-07
ICICI Prudential Interval Fund-Monthly Interval Plan I 12-May-07 Since inception 10.0000 10.1801 1.80%
ICICI Prudential Interval Fund-Quarterly Interval Plan I 15-May-07 Since inception 10.0000 10.2101 2.10%
ICICI Prudential Interval Fund-Monthly Interval Plan II 26-May-07 Since inception 10.0000 10.1590 1.59%
ICICI Prudential Interval Fund-Quarterly Interval Plan II 15-Jun-07 Since inception 10.0000 10.1064 1.06%
ICICI Prudential Interval Fund-Quarterly Interval Plan III 20-Jul-07 Since inception 10.0000 10.0052 0.05%
Returns >= 1 Year are CAGR, < 1 Year are Absolute. Note: For computation of returns theallotment NAV has been taken as Rs 10.00. Past performance may or may not be sustainedin the future.
Fund Size Rs. 575.57 Crores
ICICI Prudential Interval Fund-Mntly Int Plan II
CPs, CDs and Term Deposits 621.80 99.42%
UCO Bank P1+ 473.95 75.78%
Essel Propack Ltd A1+ 147.85 23.64%
Cash, Call, CBLO & Reverse Repo 4.06 0.65%
Other Current Assets (0.40) -0.07%
Total Net Assets 625.46 100.00%
ICICI Prudential Interval Fund-Qtrly Int Plan I
Private Corporate Securities 4,800.00 14.45%
GE Money Financial Services Ltd AAA 4,800.00 14.45%
CPs, CDs and Term Deposits 28,314.52 85.25%
Allahabad Bank Ltd P1+ 8,131.08 24.48%
State Bank of Mysore Ltd P1+ 5,419.88 16.32%
Edelweiss Securities Pvt Ltd P1+ 4,981.09 15.00%
State Bank of India Ltd P1+ 4,935.78 14.86%
UCO Bank P1+ 2,438.85 7.34%
HSBC Ltd F1+ 2,407.84 7.25%
Cash, Call, CBLO & Reverse Repo 4.06 0.01%
Other Current Assets 94.91 0.29%
Total Net Assets 33,213.49 100.00%
ICICI Prudential Interval Fund-Mntly Int Plan I
CPs, CDs and Term Deposits 841.04 100.85%
Kotak Mahindra Bank Ltd P1+ 472.77 56.69%
UTI Bank Ltd P1+ 368.27 44.16%
Cash, Call, CBLO & Reverse Repo 3.04 0.36%
Other Current Assets (10.18) -1.21%
Total Net Assets 833.90 100.00%

31
Quantitative Indicators:
Average Maturity : 0.25 yearModified Duration : 0.23 yearYield To Maturity : 9.08%% Unlisted Bonds : 5.10%
Maturity profile:Performance Record *- Cumulative Option
Rs. 10000 invested at inception: Flexible Vs Crisil Composite Bond Fund Index
Rating Profile
PSU/PFI Bonds 19,435.13 5.10%• Industrial Development Bank of India AA+ 9,440.57 2.48%
Nabard AAA 5,688.56 1.49%Export Import Bank of India Ltd AAA 2,998.65 0.79%Union Bank of India Ltd AA 1,000.00 0.26%Power Finance Corporation Ltd AAA 307.35 0.08%Private Corporate Securities 64,535.36 16.94%
• PTC Credit Asset Trust Series HSBC F1+SO 15,126.20 3.97%• PTC Shriram Transport F1+ 9,399.83 2.47%• Reliance Capital Finance Ltd A1+ 9,000.00 2.36%
TGS Investment & Trade Pvt. Ltd. A1+ 4,500.00 1.18%PTC IBL Trust IndusInd Bank AAA(SO) 4,261.05 1.12%GE Capital Services India Ltd P1+ 4,000.00 1.05%PTC Auto Sec Trust Mixpool Jun07 TMFL AAA(SO) 2,547.41 0.67%GE Countrywide Finacial Services Ltd AAA 2,500.00 0.66%Sundaram Finance Ltd AA+ 2,500.00 0.66%PTC ICL Trust Birla Home Finance P1+SO 2,004.33 0.53%Hindalco Industries Ltd AAA 1,989.70 0.52%PTC Citi Fleet Trust Citibank AAA(SO) 1,768.37 0.46%DSP Merill Lynch Capital Ltd P1+ 1,220.00 0.32%Mahindra & Mahindra Financial Services Ltd AA+ 1,019.97 0.27%Oscar Investments Ltd Unrated 700.00 0.18%PTC BHPC Tata Motors AAA(SO) 512.98 0.13%Reliance Industries Ltd AAA 508.88 0.13%Grasim Industries Ltd AAA 495.18 0.13%PTC DAS Trust Standard Chartered Bank A1+(SO) 481.46 0.13%Treasury Bills 6,651.64 1.74%
• 182 Day T Bill (MD 12/12/2007) Sovereign 6,651.64 1.74%CPs, CDs and Term Deposits 243,742.21 63.95%Essel Propack Ltd A1+ 29,421.89 7.72%Syndicate Bank Ltd P1+ 25,000.00 6.56%HDFC Bank Ltd P1+ 23,935.75 6.28%State Bank of Patiala Ltd P1+ 21,371.29 5.61%Punjab National Bank Ltd P1+ 20,000.00 5.25%ING Vysya Bank Ltd P1+ 19,819.67 5.20%Union Bank of India Ltd P1+ 15,231.85 3.99%HDFC Ltd P1+ 14,448.71 3.79%Allahabad Bank Ltd AAA 9,573.50 2.51%UTI Bank Ltd P1+ 9,114.29 2.39%UCO Bank P1+ 8,695.07 2.28%Kotak Mahindra Bank Ltd P1+ 7,314.06 1.92%ABN Amro Bank Ltd A1+ 7,200.88 1.89%Jammu & Kashmir Bank Ltd AAA 6,239.83 1.64%IDBI Bank Ltd P1+ 4,953.82 1.30%GE Capital Transportation Financial Services Ltd P1+ 4,660.53 1.22%YES Bank F1+ 4,324.99 1.13%American Express Bank Ltd P1+ 4,180.01 1.10%Cholamandalam Investment & Finance Co. Ltd P1+ 2,572.22 0.67%GE Money Financial Services Ltd P1+ 2,469.27 0.65%State Bank of Mysore Ltd P1+ 2,391.75 0.63%State Bank of Indore Ltd P1+ 414.46 0.11%UTI Securities Ltd P1+ 408.37 0.11%Cash, Call, CBLO & Reverse Repo 19,978.32 5.24%Other Current Assets 26,931.85 7.03%Total Net Assets 381,274.51 100.00%
• Top Five Holdings
Snapshot:
Fund Manager : Rahul GoswamiIndicative Investment Horizon: 1 year & aboveInception date: 27-09-2002Fund Size: Rs. 3,812.75 croresNAV (As on 31-July-2007):Cumulative option : Rs. 14.1265**Expense Ratio : 0.40%
**This is a close approximation of the number.
WHY SHOULD ONE INVEST?Medium term investment for returns generated
from managing interest rate volatility
*Returns >= 1 Year are CAGR, < 1 Year are Absolute. Benchmark is CrisilComposite Bond Fund Index. For computation of returns the allotment NAVhas been taken as Rs. 10.00. Past performance may or may not be sustainedin future. 31-Jul-04 was a non business day.
ICICI Prudential Flexible Income Plan
CAGR – Flexible Income Plan : 7.39%; Benchmark : 5.24%Past performance may or may not be sustained in future.
PortfolioCompany/Issuer Rating Mkt Value (Rs. Lakh) % to NAVStyle Box
Figures as on 31-July-2007
4.30%
8.14%
6.10%7.39%
3.73%
6.45%
4.56% 5.24%
0.00%1.00%2.00%3.00%4.00%5.00%6.00%7.00%8.00%9.00%
Last6 Months
Last1 year
Last3 years
SinceInception
Flexible Income Plan Crisil Composite Bond Fund Index
Rs 14126.50
Rs 12808.70
9,95010,45010,95011,45011,95012,45012,95013,45013,95014,450
Sep-
02De
c-02
Mar
-03
Jun-
03Se
p-03
Dec-
03M
ar-0
4Ju
n-04
Sep-
04De
c-04
Mar
-05
Jun-
05Se
p-05
Dec-
05M
ar-0
6Ju
n-06
Sep-
06De
c-06
Mar
-07
Jun-
07
Flexible Income Plan Crisil Composite Bond Fund Index
7.06%
6.17%
5.46%
0.26%
81.05%
-20.00% 10.00% 40.00% 70.00% 100.00%
<182 days
Other CurrentAssets
182 days - 1 year
1-3 years
3-5 years
Unrated0.18%
AAA and Equivalent82.12%
Call,Current Assets and
Reverse Repos12.30%
AA and Equivalent
3.66%
Sovereign Securities1.74%

32
Quantitative Indicators: Treasury Plan
Average Maturity : 0.50 YearModified Duration : 0.46 YearYield To Maturity : 9.63%% Unlisted Bonds : 0.00%
Quantitative Indicators: Investment PlanAverage Maturity : 17.86 YearsModified Duration : 8.22 YearsYield To Maturity : 8.14%% Unlisted Bonds : 16.95%
Maturity Profile:Maturity Profile:
Performance Record* - Growth Option (Treasury Plan)
Rs. 10000 invested at inception*: Gilt -Treasury Vs I Sec Si Bex
WHY SHOULD ONE INVEST?Treasury Plan: Short term deployment of funds in a portfolio of G-Secs with low volatility
Investment Plan: Medium term investment in a portfolio of G-Secs for steady returns with market volatility
*Returns >= 1 Year are CAGR, < 1 Year are Absolute. Benchmark is I Sec Si Bex. Benchmarkstart date : 31-03-2002. For computation of returns the allotment NAV has been taken asRs. 10.00. Past performance may or may not be sustained in future. 31-Jul-04 was a nonbusiness day.
ICICI Prudential Gilt Fund
*Benchmark start date : 31-03-2002. CAGR – Gilt - Treasury : 6.05%; Benchmark : 6.42%Past performance may or may not be sustained in future.
Style Box Snapshot: Investment PlanFund Manager : Rahul GoswamiIndicative Investment Horizon: 1 year & aboveInception date: 19-08-1999Fund Size: Rs. 109.44 croresNAV (As on 31-July-2007): Growth option: Rs. 23.3243
Dividend option: Rs. 10.9306
**Expense Ratio: 1.15%
**This is a close approximation of the number.
Snapshot: Treasury Plan
Fund Manager : Rahul GoswamiIndicative Investment Horizon: 3-6 monthsInception date: 19-08-1999Fund Size: Rs. 48.92 croresNAV (As on 31-July-2007): Growth option : Rs. 18.5111
Dividend option: Rs. 10.6353
**Expense Ratio: 1.10%
**This is a close approximation of the number.
Rs. 10000 invested at inception: Gilt - Investment Vs I-Sec I Bex
CAGR – Gilt - Investment: 11.24%; Benchmark : 11.41%. Past performance may or maynot be sustained in future.
Performance Record* - Growth Option (Investment Plan)
*Returns >= 1 Year are CAGR, < 1 Year are Absolute. Benchmark is I Bex. For computationof returns the allotment NAV has been taken as Rs. 10.00. Past performance may or maynot be sustained in future. 31-Jul-04 was a non business day.
Style BoxFigures as on 31-July-2007
Portfolio - Treasury Plan
Company/Issuer Rating Mkt Value % to NAV(Rs. Lakh)
CPs, CDs and Term Deposits 4,575.81 93.55%Kotak Mahindra Bank Ltd P1+ 1,634.26 33.41%State Bank of Travancore Ltd P1+ 615.28 12.58%State Bank of Mysore Ltd P1+ 482.86 9.87%Industrial Development Bank of India P1+ 477.69 9.77%Canara Bank Ltd P1+ 471.43 9.64%Allahabad Bank Ltd A1+ 470.59 9.62%IDBI Bank Ltd P1+ 423.70 8.66%Cash, Call, CBLO & Reverse Repo 322.53 6.59%Other Current Assets (6.81) -0.14%Total Net Assets 4,891.53 100.00%
• Top Five Holdings
Portfolio - Investment Plan
Company/Issuer Rating Mkt Value % to NAV(Rs. Lakh)
Government Securities 9,163.15 83.73%• 8.33% GOI 2036 Sovereign 4,187.40 38.26%• 7.99% GOI 2017 Sovereign 3,027.00 27.66%• 7.49% GOI 2017 Sovereign 1,854.59 16.95%• 6.65% GOI 2009 Sovereign 94.16 0.86%
CPs, CDs and Term Deposits 318.12 2.91%IDBI Bank Ltd P1+ 183.60 1.68%Allahabad Bank Ltd P1+ 134.52 1.23%Cash, Call, CBLO & Reverse Repo 4.06 0.04%Other Current Assets 1,458.98 13.32%
Total Net Assets 10,944.31 100.00%
• Top Five Holdings
3.49%
6.37%5.37%
6.14%
8.05%
4.67%
7.96%5.90%
6.29%
0.00%1.00%2.00%3.00%4.00%5.00%6.00%7.00%8.00%9.00%
Last 6Months
Last1 year
Last3 years
Last5 years
SinceInception
Gilt Treasury I Sec Si Bex
4.49%
11.20%
5.96% 7.43%
11.24%
4.60%
11.29%
5.44%
7.80%
11.41%
0.00%
2.00%4.00%
6.00%
8.00%10.00%
12.00%
Last 6Months
Last 1year
Last 3years
Last 5years
SinceInception
Gilt Investment I Sec I-Bex
Rs 13678.59
Rs 13931.38
9,78010,28010,78011,28011,78012,28012,78013,28013,78014,280
Apr-0
2Ju
l-02
Oct
-02
Jan-
03Ap
r-03
Jul-0
3O
ct-0
3Ja
n-04
Apr-0
4Ju
l-04
Oct
-04
Jan-
05Ap
r-05
Jul-0
5O
ct-0
5Ja
n-06
Apr-0
6Ju
l-06
Oct
-06
Jan-
07Ap
r-07
Jul-0
7
Gilt Treasury I Sec Si Bex
Rs 23324.30
Rs 23622.47
9,93111,93113,93115,93117,93119,93121,93123,93125,931
Aug-
99Ja
n-00
Jun-
00N
ov-0
0Ap
r-01
Sep-
01Fe
b-02
Jul-0
2De
c-02
May
-03
Oct
-03
Mar
-04
Aug-
04Ja
n-05
Jun-
05N
ov-0
5Ap
r-06
Sep-
06Fe
b-07
Jul-0
7
Gilt Investment I Sec I-Bex
73.91%
26.23%
-0.14%
-20.00% 0.00% 20.00% 40.00% 60.00% 80.00%
182 days - 1
year
<182 days
Other Current
Assets
44.60%
38.26%
13.33%
0.86%
1.27%
1.68%
0.00% 10.00% 20.00% 30.00% 40.00% 50.00%
5-10 years
> 10 years
Other Current Assets
182 days - 1 year
<182 days
1-3 years

33
Maturity profile:
Performance Record - Growth option
Quantitative Indicators: Investment PF Plan
Average Maturity : 18.74 yearsModified Duration : 8.34 yearsYield To Maturity : 8.22%%Unlisted : 35.37%
Rs. 10000 invested at inception: Gilt -Investement PF Vs I Sec Li BexRs. 10000 invested at inception: Gilt -Treasury PF Vs I Sec Si Bex
Maturity Profile:
Quantitative Indicators: Treasury PF Plan
Average Maturity : 0.50 YearModified Duration : 0.46 YearYield To Maturity : 9.04%% Unlisted : 0.00%
Performance Record - Growth option
Snapshot: Treasury Plan PF optionFund Manager : Rahul GoswamiIndicative Investment Horizon: 3-6 monthsInception date: 11-Feb-04Fund Size: Rs. 34.37 croresNAV (As on 31-July-2007): Growth option: Rs. 11.7715**Expense Ratio: 1.50%
**This is a close approximation of the number.
WHY SHOULD ONE INVEST?Treasury: Short term deployment of funds in portfolio of G-Secs with low volatility
Investment: Medium term investment for steady returns with market volatility
Returns >= 1 Year are CAGR, < Year are Absolute. Benchmark is I-Sec Si Bex Index.For computation of returns the allotment NAV has been taken as Rs. 10.00. Past performancemay or may not be sustained in future. 31-Jul-04 was a non business day.
ICICI Prudential Gilt Fund PF Option
Portfolio - Treasury PF
Company/Issuer Rating Mkt Value % to NAV(Rs. Lakh)
Government Securities 98.80 2.87%• 6.65% GOI 2009 Sovereign 98.80 2.87%
CPs, CDs and Term Deposits 3,005.32 87.45%Industrial Development Bank of India P1+ 1,047.06 30.47%IDBI Bank Ltd P1+ 675.09 19.64%Canara Bank Ltd P1+ 471.43 13.72%Allahabad Bank Ltd A1+ 470.59 13.69%State Bank of Travancore Ltd P1+ 331.30 9.64%State Bank of Mysore Ltd P1+ 9.85 0.29%Cash, Call, CBLO & Reverse Repo 345.86 10.06%Other Current Assets (13.30) -0.38%Total Net Assets 3,436.68 100.00%
• Top Five Holdings
Style Box
Absolute – Gilt Treasury PF option : 4.81%; Benchmark : 5.69%. Past performance may ormay not be sustained in future.
Portfolio - Investment PF
Company/Issuer Rating Mkt Value % to NAV(Rs. Lakh)
Government Securities 5,738.72 73.87%
• 8.33% GOI 2036 Sovereign 2,991.00 38.50%
• 7.49% GOI 2017 Sovereign 2,747.72 35.37%
CPs, CDs and Term Deposits 304.12 3.91%
IDBI Bank Ltd P1+ 304.12 3.91%
Other Current Assets 1,725.46 22.22%
Total Net Assets 7,768.30 100.00%
• Top Five Holdings
Snapshot: Investment Plan PF optionFund Manager : Rahul GoswamiIndicative Investment Horizon: 1 year & aboveInception date: 19-Nov-03Fund Size: Rs. 77.68 croresNAV (As on 31-July-2007): Growth option: Rs. 12.2454**Expense Ratio: 1.10%
**This is a close approximation of the number.
Style Box
Absolute – Gilt Investment PF option : 5.63%; Benchmark : 4.03%. Past performancemay or may not be sustained in future.
Returns >= 1 Year are CAGR, < Year are Absolute. Benchmark is I-Sec Li Bex Index.For computation of returns the allotment NAV has been taken as Rs. 10.00. Past performancemay or may not be sustained in future. 31-Jul-04 was a non business day.
Figures as on 31-July-2007
3.38%
6.34%
4.81% 4.81%4.67%
7.96%
5.90% 5.69%
0.00%1.00%2.00%3.00%4.00%5.00%6.00%7.00%8.00%9.00%
Last6 Months
Last1 year
Last3 years
SinceInception
Gilt Treasury-PF I Sec Si Bex
4.44%
11.35%
6.77% 5.63%4.39%
13.29%
6.09%
4.03%
0.00%2.00%4.00%6.00%8.00%
10.00%12.00%14.00%
Last6 Months
Last1 year
Last3 years
SinceInception
Gilt Fund-PF I Sec Li-Bex
Rs 11771.50
Rs 12117.27
9,950
10,450
10,950
11,450
11,950
12,450
Feb-
04Ap
r-04
Jun-
04Au
g-04
Oct
-04
Dec-
04Fe
b-05
Apr-0
5Ju
n-05
Aug-
05O
ct-0
5De
c-05
Feb-
06Ap
r-06
Jun-
06Au
g-06
Oct
-06
Dec-
06Fe
b-07
Apr-0
7Ju
n-07
Gilt Treasury-PF I Sec Si Bex
Rs 12245.40
Rs 11574.26
9,235
9,735
10,235
10,735
11,235
11,735
12,235
12,735
Nov
-03
Jan-
04M
ar-0
4M
ay-0
4Ju
l-04
Sep-
04N
ov-0
4Ja
n-05
Mar
-05
May
-05
Jul-0
5Se
p-05
Nov
-05
Jan-
06M
ar-0
6M
ay-0
6Ju
l-06
Sep-
06N
ov-0
6Ja
n-07
Mar
-07
May
-07
Jul-0
7
Gilt Fund-PF I Sec Li-Bex
56.69%
40.82%
2.87%
-0.39%
-20.00% 0.00% 20.00% 40.00% 60.00%
182 days - 1 year
<182 days
1-3 years
Other Current Assets
38.50%
35.37%
22.21%
3.91%
0.00% 20.00% 40.00% 60.00%
> 10 years
5-10 years
Other Current Assets
182 days - 1 year

34
Maturity Profile Quantitative Indicators
Average Maturity : 11.40 Years
Modified Duration : 5.91 Years
Yield to Maturity : 8.51%
% Unlisted Bonds : 1.67%
Performance Record* - Growth Option
Rs. 10000 invested at inception*: Income Plan Vs Crisil Composite Bond Fund Index
Rating Profile
PSU/PFI Bonds 10,361.13 33.61%
• Indian Railway Finance Corporation AAA 2,590.02 8.40%
• Power Finance Corporation Ltd AAA 2,259.42 7.33%
Infrastructure Development Finance Corporation AAA 1,975.81 6.41%
Export Import Bank of India Ltd AAA 1,974.43 6.40%
Powergrid Corporation Ltd AAA 1,035.19 3.36%
Indian Oil Corporation Ltd AAA 480.81 1.56%
State Bank of India Ltd AAA 45.45 0.15%
Private Corporate Securities 4,171.57 13.53%
Tata Sons Ltd AAA 2,083.86 6.76%
UTI Bank Ltd AAA 2,060.07 6.68%
HDFC Bank Ltd AAA 18.56 0.06%
HDFC Ltd AAA 9.08 0.03%
Government Securities 15,037.84 48.76%
• 8.33% GOI 2036 Sovereign 6,779.60 21.98%
• 7.99% GOI 2017 Sovereign 5,045.00 16.36%
• 7.49% GOI 2017 Sovereign 3,206.49 10.40%
8.13% GOI 2021 Sovereign 6.75 0.02%
CPs, CDs and Term Deposits 713.72 2.32%
Union Bank of India Ltd P1+ 699.62 2.27%
IDBI Bank Ltd P1+ 9.42 0.03%
Kotak Mahindra Bank Ltd P1+ 4.68 0.02%
Cash, Call, CBLO & Reverse Repo 211.98 0.69%
Other Current Assets 348.29 1.09%
Total Net Assets 30,844.53 100.00%
• Top Five Holdings
Snapshot:Fund Manager : Pankaj KajiIndicative Investment Horizon: 1 year & aboveInception date: 09-07-1998Fund Size: Rs. 308.45 croresNAV (As on 31-July-2007):
Retail Growth option : Rs. 22.5338Institutional Growth option : Rs. 23.1786
**Expense Ratio:Income Plan: 2.12%Income Inst. Plan: 1.50%
**This is a close approximation of the number.
WHY SHOULD ONE INVEST?Medium term investment for steady returns with market volatility
*Returns < 1 : Absolute, > = 1Year : CAGR. Benchmark - Crisil CompositeBond Fund Index. Start date - 31.03.2002. For computation of returns theallotment NAV has been taken as Rs. 10.00. Past performance may or maynot be sustained in future. 31-Jul-04 was a non business day.
ICICI Prudential Income Plan
*Benchmark start date : 31-03-2002.CAGR – Income Plan: 6.31%; Benchmark : 5.70%Past performance may or may not be sustained in future.
PortfolioCompany/Issuer Rating Mkt Value (Rs. Lakh) % to NAV
Figures as on 31-July-2007
Style Box
4.58%
9.27%
5.36%6.20%
9.38%
3.73%
6.45%
4.56%5.45%
0.00%1.00%2.00%3.00%4.00%5.00%6.00%7.00%8.00%9.00%
10.00%
Last 6Months
Last 1year
Last 3years
Last 5years
SinceInception
Income Plan Crisil Composite Bond Fund Index
Rs 13858.43
Rs 13441.89
9,79010,29010,79011,29011,79012,29012,79013,29013,79014,290
Apr-0
2Ju
l-02
Oct
-02
Jan-
03Ap
r-03
Jul-0
3O
ct-0
3Ja
n-04
Apr-0
4Ju
l-04
Oct
-04
Jan-
05Ap
r-05
Jul-0
5O
ct-0
5Ja
n-06
Apr-0
6Ju
l-06
Oct
-06
Jan-
07Ap
r-07
Jul-0
7
Income Plan Crisil Composite Bond Fund Index
35.26%
30.20%
22.00%
8.34%
0.69%
1.13%
2.37%
-10.00% 10.00% 30.00% 50.00%
5-10 years
3-5 years
> 10 years
1-3 years
182 days - 1 year
Other Current Assets
<182 days
AAA and Equivalent49.43%
Sovereign Securities48.75%
Call,Current Assets and
Reverse Repos1.82%
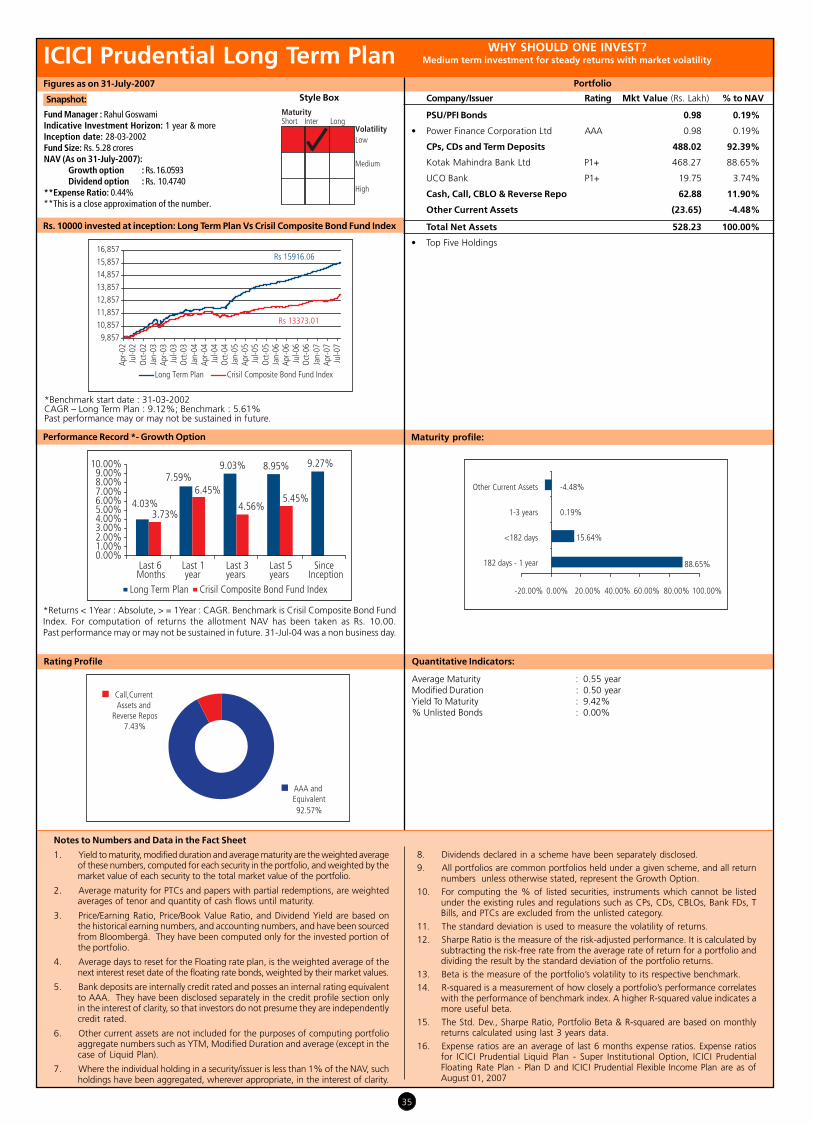
35
Maturity profile:
Quantitative Indicators:
Average Maturity : 0.55 yearModified Duration : 0.50 yearYield To Maturity : 9.42%% Unlisted Bonds : 0.00%
Rating Profile
Portfolio
Snapshot:
Fund Manager : Rahul GoswamiIndicative Investment Horizon: 1 year & moreInception date: 28-03-2002Fund Size: Rs. 5.28 croresNAV (As on 31-July-2007):
Growth option : Rs. 16.0593Dividend option : Rs. 10.4740
**Expense Ratio: 0.44%**This is a close approximation of the number.
WHY SHOULD ONE INVEST?Medium term investment for steady returns with market volatility
Company/Issuer Rating Mkt Value (Rs. Lakh) % to NAV
ICICI Prudential Long Term Plan
PSU/PFI Bonds 0.98 0.19%
• Power Finance Corporation Ltd AAA 0.98 0.19%
CPs, CDs and Term Deposits 488.02 92.39%
Kotak Mahindra Bank Ltd P1+ 468.27 88.65%
UCO Bank P1+ 19.75 3.74%
Cash, Call, CBLO & Reverse Repo 62.88 11.90%
Other Current Assets (23.65) -4.48%
Total Net Assets 528.23 100.00%
• Top Five Holdings
Rs. 10000 invested at inception: Long Term Plan Vs Crisil Composite Bond Fund Index
*Benchmark start date : 31-03-2002CAGR – Long Term Plan : 9.12%; Benchmark : 5.61%Past performance may or may not be sustained in future.
Figures as on 31-July-2007
Performance Record *- Growth Option
*Returns < 1Year : Absolute, > = 1Year : CAGR. Benchmark is Crisil Composite Bond FundIndex. For computation of returns the allotment NAV has been taken as Rs. 10.00.Past performance may or may not be sustained in future. 31-Jul-04 was a non business day.
Style Box
Notes to Numbers and Data in the Fact Sheet
1. Yield to maturity, modified duration and average maturity are the weighted averageof these numbers, computed for each security in the portfolio, and weighted by themarket value of each security to the total market value of the portfolio.
2. Average maturity for PTCs and papers with partial redemptions, are weightedaverages of tenor and quantity of cash flows until maturity.
3. Price/Earning Ratio, Price/Book Value Ratio, and Dividend Yield are based onthe historical earning numbers, and accounting numbers, and have been sourcedfrom Bloombergâ. They have been computed only for the invested portion ofthe portfolio.
4. Average days to reset for the Floating rate plan, is the weighted average of thenext interest reset date of the floating rate bonds, weighted by their market values.
5. Bank deposits are internally credit rated and posses an internal rating equivalentto AAA. They have been disclosed separately in the credit profile section onlyin the interest of clarity, so that investors do not presume they are independentlycredit rated.
6. Other current assets are not included for the purposes of computing portfolioaggregate numbers such as YTM, Modified Duration and average (except in thecase of Liquid Plan).
7. Where the individual holding in a security/issuer is less than 1% of the NAV, suchholdings have been aggregated, wherever appropriate, in the interest of clarity.
8. Dividends declared in a scheme have been separately disclosed.9. All portfolios are common portfolios held under a given scheme, and all return
numbers unless otherwise stated, represent the Growth Option.10. For computing the % of listed securities, instruments which cannot be listed
under the existing rules and regulations such as CPs, CDs, CBLOs, Bank FDs, TBills, and PTCs are excluded from the unlisted category.
11. The standard deviation is used to measure the volatility of returns.12. Sharpe Ratio is the measure of the risk-adjusted performance. It is calculated by
subtracting the risk-free rate from the average rate of return for a portfolio anddividing the result by the standard deviation of the portfolio returns.
13. Beta is the measure of the portfolio’s volatility to its respective benchmark.14. R-squared is a measurement of how closely a portfolio’s performance correlates
with the performance of benchmark index. A higher R-squared value indicates amore useful beta.
15. The Std. Dev., Sharpe Ratio, Portfolio Beta & R-squared are based on monthlyreturns calculated using last 3 years data.
16. Expense ratios are an average of last 6 months expense ratios. Expense ratiosfor ICICI Prudential Liquid Plan - Super Institutional Option, ICICI PrudentialFloating Rate Plan - Plan D and ICICI Prudential Flexible Income Plan are as ofAugust 01, 2007
4.03%
7.59%9.03% 8.95% 9.27%
3.73%
6.45%
4.56%5.45%
0.00%1.00%2.00%3.00%4.00%5.00%6.00%7.00%8.00%9.00%
10.00%
Last 6Months
Last 1year
Last 3years
Last 5years
SinceInception
Long Term Plan Crisil Composite Bond Fund Index
Rs 15916.06
Rs 13373.01
9,857
10,857
11,857
12,857
13,857
14,857
15,857
16,857
Apr-0
2Ju
l-02
Oct
-02
Jan-
03Ap
r-03
Jul-0
3O
ct-0
3Ja
n-04
Apr-0
4Ju
l-04
Oct
-04
Jan-
05Ap
r-05
Jul-0
5O
ct-0
5Ja
n-06
Apr-0
6Ju
l-06
Oct
-06
Jan-
07Ap
r-07
Jul-0
7
Long Term Plan Crisil Composite Bond Fund Index
88.65%
15.64%
-4.48%
0.19%
-20.00% 0.00% 20.00% 40.00% 60.00% 80.00% 100.00%
182 days - 1 year
<182 days
1-3 years
Other Current Assets
AAA and Equivalent92.57%
Call,Current Assets and
Reverse Repos7.43%

36
Rating Profile
Maturity Profile:
Quantitative Indicators:
Average Maturity : 110.29 DaysModified Duration : 97.81 DaysYield To Maturity : 7.24%% Floating Rate Assets : 15.93%Average days to reset : 60.38 DaysAverage maturity of fixed rate component : 59.96 DaysWeighted average maturity : 60.02 Days% Unlisted Bonds : 5.81%
Performance Record *- Growth Option – Institutional Plus Plan
Rs. 10000 invested at inception*: Liquid Plan Inst. Plus Vs Crisil LiquidFund Index
PSU/PFI Bonds 47,274.19 2.69%• Nabard AAA 36,782.53 2.09%
Industrial Development Bank of India AA+ 4,500.00 0.26%Power Finance Corporation Ltd AAA 2,503.45 0.14%Infrastructure Development Finance Corporation AAA 1,991.54 0.11%Export Import Bank of India Ltd AAA 996.67 0.06%CanBank Factors Ltd P1+ 500.00 0.03%Private Corporate Securities 350,233.32 19.88%
• Tata Sons Ltd AAA 37,500.00 2.13%• Reliance Capital Finance Ltd A1+ 35,000.00 1.99%• DSP Merill Lynch Capital Ltd AAA 44,280.00 2.52%• PTC UBL Trust DSP Merrill Lynch Capital Ltd A1+(SO) 19,997.83 1.14%
TGS Investment & Trade Pvt. Ltd. A1+ 17,000.00 0.97%PTC Credit Asset Trust Series HSBC F1+ 15,300.91 0.87%PTC Collateralised Debt Trust UTI Bank P1+SO 10,012.03 0.57%GE Capital Services India Ltd AAA 10,002.28 0.57%Shriram Transport Finance Company Ltd AA 10,000.00 0.57%PTC Light Trust SCB AA+SO 9,988.43 0.57%PTC Auto Sec Trust MixpoolB TMFL AAA(SO) 9,553.83 0.54%Oscar Investments Ltd Unrated 9,300.00 0.53%Hindalco Industries Ltd AAA 9,482.36 0.54%Raymond Ltd P1+ 7,400.00 0.42%PTC VPT Trust SCB AAA 7,026.01 0.40%GE Money Financial Services Ltd AAA 12,202.15 0.69%Ranbaxy Holding Company Ltd Unrated 6,700.00 0.38%PTC Birla Home Finance GECSI AA(SO) 5,000.00 0.28%CitiFinancial Consumer Finance India Ltd P1+ 5,000.00 0.28%Kotak Mahindra Primus Ltd AA+ 5,000.00 0.28%PTC Shriram Transport F1+ 4,972.98 0.28%Emaar Mgf Land Pvt Ltd A1+(SO) 4,000.00 0.23%Cholamandalam Investment & Finance Co. Ltd P1+ 3,800.00 0.22%Reliance Industries Ltd AAA 3,691.90 0.21%Nirma Ltd P1+ 3,000.00 0.17%PTC DAS Trust Standard Chartered Bank A1+(SO) 2,800.10 0.16%JM Financial & Investment Consultancy Services Pvt. Ltd P1+ 2,800.00 0.16%Kotak Mahindra Primus Ltd P1+ 2,503.57 0.14%Sundaram Finance Ltd AAA 2,500.00 0.14%Gujarat Glass Ltd Unrated 2,500.00 0.14%Hero Honda Finlease Ltd P1+ 2,500.00 0.14%Balrampur Chini Mills Ltd A1+ 2,500.00 0.14%First India Credit Corporation Ltd A1+ 2,500.00 0.14%Kotak Securities Ltd P1+ 2,500.00 0.14%Mahindra & Mahindra Financial Services Ltd AA+ 2,500.00 0.14%Berger Paints India Ltd P1+ 2,300.00 0.13%PTC ICL Trust Birla Home Finance P1+SO 2,004.33 0.11%Birla Global Finance Ltd A1+ 2,000.00 0.11%Rabo India Finance Ltd P1+ 2,000.00 0.11%Grasim Industries Ltd AAA 1,883.69 0.11%HDFC Ltd AAA 1,783.92 0.10%Blue Star Ltd P1+ 1,500.00 0.09%LIC Housing Finance Ltd AAA 998.76 0.06%CitiFinancial Consumer Finance India Ltd AAA 998.06 0.06%PTC Kotak Mahindra Bank Ltd. AAA(SO) 951.98 0.05%PTC Citi Fleet Trust Citibank AAA(SO) 707.41 0.04%PTC UBL Trust IndusInd Bank AAA(SO) 675.18 0.04%PTC Hero Motors Ltd A1+(SO) 550.00 0.03%PTC TAS Trust Tata Sons A1+(SO) 429.90 0.02%PTC IL & FS Investmart Ltd AAA(SO) 427.53 0.02%PTC TVS Finance AAA(SO) 208.18 0.01%Treasury Bills 44,742.99 2.54%364 Day T Bill (MD 28/03/2008) Sovereign 17,605.73 1.00%182 Day T Bill (MD 12/12/2007) Sovereign 14,692.17 0.84%364 Day T Bill (MD 14/07/2007) Sovereign 7,464.02 0.42%182 Day T Bill (MD 07/09/2007) Sovereign 4,981.07 0.28%CPs, CDs and Term Deposits 918,924.92 52.23%Punjab National Bank Ltd P1+ 96,000.00 5.46%ICICI Bank Ltd P1+ 88,800.00 5.05%ABN Amro Bank Ltd AAA 81,990.27 4.66%HDFC Bank Ltd P1+ 79,667.25 4.53%ING Vysya Bank Ltd P1+ 62,274.58 3.54%Allahabad Bank Ltd AAA / P1+ 48,072.27 2.73%UTI Bank Ltd P1+ 39,179.16 2.23%Kotak Mahindra Bank Ltd P1+ 36,919.02 2.10%Industrial Development Bank of India P1+ 31,009.17 1.77%UCO Bank P1+ 31,154.31 1.77%State Bank of Bikaner & Jaipur Ltd P1+ 30,000.00 1.71%State Bank of Hyderabad Ltd P1+ 30,000.00 1.71%State Bank of Saurashtra Ltd A1+ 28,838.72 1.64%Union Bank of India Ltd P1+ 27,442.57 1.56%YES Bank F1+ 24,514.71 1.39%State Bank of Indore Ltd P1+ 20,121.87 1.14%Standard Chartered Bank Ltd AAA 18,871.86 1.07%Jammu & Kashmir Bank Ltd A1+ 14,831.49 0.84%GE Money Financial Services Ltd P1+ 12,338.50 0.70%IDBI Bank Ltd P1+ 12,058.70 0.69%Tata Power Company Ltd P1+ 9,956.12 0.57%Indian Bank Ltd A1+ 9,889.31 0.56%State Bank of India Ltd P1+ 9,611.92 0.55%HDFC Ltd P1+ 9,381.00 0.53%UTI Securities Ltd P1+ 9,200.25 0.52%Standard Chartered Investment & Loan (India) LtdP1+ 8,294.14 0.47%State Bank of Patiala Ltd P1+ 6,113.14 0.35%Edelweiss Securities Pvt Ltd P1+ 5,939.14 0.34%CitiFinancial Consumer Finance India Ltd P1+ 4,926.49 0.28%HSBC Ltd F1+ 4,986.48 0.28%Rabo India Finance Ltd P1+ 4,965.02 0.28%DSP Merill Lynch Capital Ltd P1+ 4,629.45 0.26%Canara Bank Ltd P1+ 4,241.73 0.24%TML Financial Services Ltd P1+ 3,282.75 0.19%Citicorp Finance (India) Ltd P1+ 2,408.69 0.14%GE Capital Transportation Financial Services Ltd P1+ 2,340.40 0.13%Redington India Ltd P1+ 1,988.29 0.11%State Bank of Mysore Ltd P1+ 1,478.15 0.08%Bajaj Auto Ltd P1+ 965.50 0.05%National Housing Bank Ltd P1+ 242.50 0.01%Cash, Call, CBLO & Reverse Repo 32,867.49 1.87%Other Current Assets 364,080.51 20.79%Total Net Assets 1,758,123.42 100.00%
• Top Five Holdings
Snapshot:Fund Manager : Chaitanya PandeIndicative Investment Horizon: Upto 1monthInception date:
Growth Option: 24-06-1998Institutional Option: 03-04-2003Institutional Plus Option: 28-09-2003Super Institutional Option: 17-11-2005
Fund Size: Rs. 17,581.23 croresNAV (As on 31-July-2007):
Growth option : Rs. 18.8424Institutional Growth option : Rs. 19.0580Institutional Plus Growth option : Rs. 19.1258Super Institutional Growth option : Rs. 11.2862Institutional option-I-Growth option: Rs. 11.0517
**Expense Ratio:Growth option : 1.13% Inst. option : 0.93%Inst. Plus option : 0.86% Super Inst. option : 0.40%Inst. - I option : 0.68%
** This is a close approximation of the number.
WHY SHOULD ONE INVEST?Temporary parking of funds with high liquidity
Style Box
ICICI Prudential Liquid Plan
*Benchmark start date : 31-03-2002CAGR – Liquid Plan : 6.03%; Benchmark : 5.34%Past performance may or may not be sustained in future.
PortfolioCompany/Issuer Rating Mkt Value (Rs. Lakh) % to NAV
*Returns >= 1 Year are CAGR, < 1 Year are Simple Annualised. Benchmark is CrisilLiquid Fund Index. For computation of returns the allotment NAV has been takenas Rs. 10.00. Past performance may or may not be sustained in future.
Figures as on 31-July-2007
6.02%6.78%
8.32% 7.87%
6.03%
0.94%
6.28%
8.43%7.35%
5.34%
0.00%1.00%2.00%3.00%4.00%5.00%6.00%7.00%8.00%9.00%
Last 15days
Last 30days
Last 6Months
Last 1year
SinceInception
Institutional Plus Plan Crisil Liquid Fund Index
Rs 12520.74
Rs 12211.54
9,950
10,450
10,950
11,450
11,950
12,450
12,950
Sep-
03N
ov-0
3Ja
n-04
Mar
-04
May
-04
Jul-0
4Se
p-04
Nov
-04
Jan-
05M
ar-0
5M
ay-0
5Ju
l-05
Sep-
05N
ov-0
5Ja
n-06
Mar
-06
May
-06
Jul-0
6Se
p-06
Nov
-06
Jan-
07M
ar-0
7M
ay-0
7Ju
l-07
Institutional Plus Plan Crisil Liquid Fund Index
80.66%
19.34%
0.00% 20.00% 40.00% 60.00% 80.00% 100.00%
<182 days
>182 days
Unrated1.05%
AAA and Equivalent71.73%
Call,Current Assets and
Reverse Repos22.58%
AA and Equivalent
2.10%Sovereign Securities2.54%

37
Average Maturity : 93.75 DaysModified Duration : 86.22 DaysYield To Maturity : 8.01%% Floating Rate Assets : 28.48%Average days to reset : 65.76 DaysAverage maturity of fixed rate component : 60.45 DaysWeighted average maturity : 61.96 Days% Unlisted Bonds : 7.60%
Quantitative Indicators:Maturity Profile
Performance Record *- Cumulative Option – Plan B
Rs. 10000 invested at inception: Floating Rate Plan B Vs Crisil Liquid Fund Index
Rating Profile
Snapshot:Fund Manager : Chaitanya PandeIndicative Investment Horizon: 1 - 3 monthsInception date: 28-03-2003Fund Size: Rs. 986.69 croresNAV (As on 31-July-2007):
Plan A - Cumulative: Rs. 11.9437Plan B - Cumulative: Rs. 12.8299Plan C - Cumulative: Rs. 12.0691Plan D - Cumulative: Rs. 11.2965
**Expense Ratio:Plan A - 1.17%, Plan B - 0.91%, Plan C - 0.81%, Plan D - 0.40%
**This is a close approximation of the number.
WHY SHOULD ONE INVEST?Short term deployment of funds
*Returns >= 1 Year are CAGR, < 1 Year are Simple Annualised. Benchmark is CrisilLiquid Fund Index. For computation of returns the allotment NAV has been takenas Rs.10.00. Past performance may or may not be sustained in future.
ICICI Prudential Floating Rate Plan
CAGR – Floating Rate Plan - Plan B : 5.90%; Benchmark : 5.27%Past performance may or may not be sustained in future.
PSU/PFI Bonds 3,000.00 3.04%
• Industrial Development Bank of India AA+ 3,000.00 3.04%
Private Corporate Securities 20,164.33 20.44%
• Oscar Investments Ltd Unrated 5,000.00 5.07%
• GE Capital Services India Ltd P1+ 3,500.00 3.55%
• Citicorp Finance (India) Ltd AAA 2,500.00 2.53%
• Mahindra & Mahindra Financial Services Ltd AA+ 2,000.00 2.03%
Hindalco Industries Ltd AAA 1,994.85 2.02%
Sundaram Finance Ltd AAA 1,800.00 1.82%
PTC Auto Sec Trust Mixpool Jun07 TMFL AAA(SO) 1,528.45 1.55%
PTC Citi Fleet Trust Citibank AAA(SO) 891.03 0.90%
TGS Investment & Trade Pvt. Ltd. A1+ 500.00 0.51%
PTC Hero Motors Ltd A1+(SO) 450.00 0.46%
CPs, CDs and Term Deposits 58,134.65 58.90%
HDFC Ltd P1+ 14,448.71 14.64%
ING Vysya Bank Ltd P1+ 10,000.00 10.13%
State Bank of Patiala Ltd P1+ 10,000.00 10.13%
HDFC Bank Ltd P1+ 9,631.75 9.76%
State Bank of Saurashtra Ltd A1+ 9,612.91 9.74%
UTI Bank Ltd P1+ 3,000.00 3.04%
Allahabad Bank Ltd P1+ 1,441.28 1.46%
Cash, Call, CBLO & Reverse Repo 8,961.32 9.08%
Other Current Assets 8,408.73 8.54%
Total Net Assets 98,669.03 100.00%
• Top Five Holdings
PortfolioCompany/Issuer Rating Mkt Value (Rs. Lakh) % to NAVStyle Box
Figures as on 31-July-2007
6.01%7.15%
8.38% 7.86%
5.90%
0.94%
6.28%
8.43%7.35%
5.27%
0.00%1.00%2.00%3.00%4.00%5.00%6.00%7.00%8.00%9.00%
Last 15days
Last 30days
Last 6Months
Last 1year
SinceInception
Floating Rate Plan Crisil Liquid Fund Index
Rs 12829.90
Rs 12498.47
9,950
10,450
10,95011,450
11,95012,450
12,950
13,450
Mar
-03
May
-03
Jul-0
3Se
p-03
Nov
-03
Jan-
04M
ar-0
4M
ay-0
4Ju
l-04
Sep-
04N
ov-0
4Ja
n-05
Mar
-05
May
-05
Jul-0
5Se
p-05
Nov
-05
Jan-
06M
ar-0
6M
ay-0
6Ju
l-06
Sep-
06N
ov-0
6Ja
n-07
Mar
-07
May
-07
Jul-0
7
Floating Rate Plan Crisil Liquid Fund Index
94.95%
5.05%
0.00% 20.00% 40.00% 60.00% 80.00% 100.00%
<182 days
>182 days
Unrated5.07%
AA and Equivalent
5.07%
Call,Current Assets and
Reverse Repos17.60%
AAA and Equivalent72.26%

38
Maturity Profile Quantitative Indicators:
Average Maturity : 0.92 Year
Modified Duration : 0.81 Year
Yield To Maturity : 9.03%
% Floating Rate Assets : 14.23%
Average days to reset : 0.89 Year
Average maturity of fixed rate component : 0.88 Year
Weighted average maturity : 0.88 Year
% Unlisted : 7.00%
Rs. 10000 invested at inception*: STP Vs Crisil Short Term Bond Fund Index
Rating Profile
PSU/PFI Bonds 622.30 1.39%
Nabard AAA 608.60 1.36%
Power Finance Corporation Ltd AAA 13.70 0.03%
Private Corporate Securities 27,260.75 61.03%
• PTC Auto Sec Trust Mixpool Jun07 TMFL AAA(SO) 6,113.79 13.69%
• PTC ICL Trust TMFL Yes Bank AA+SO 3,283.51 7.35%
• PTC GE Capital Services India Ltd A1+(SO) 3,136.37 7.02%
• Ranbaxy Holding Company Ltd Unrated 2,500.00 5.60%
• PTC ICL Trust TMFL Yes Bank P1+SO 2,018.97 4.52%
PTC Electrosteel Castings Ltd GTL Trust A1+(SO) 1,605.14 3.59%
GE Money Financial Services Ltd AAA 1,603.73 3.59%
TML Financial Services Ltd P1+ 1,023.58 2.29%
PTC ICL Trust Birla Home Finance P1+SO 1,002.16 2.24%
PTC Shriram Transport F1+ 942.25 2.11%
Tata Sons Ltd AAA 750.19 1.68%
Kotak Mahindra Primus Ltd AA 711.37 1.59%
L&T Finance Ltd A1+(SO) 710.17 1.59%
Mahindra & Mahindra Financial Services Ltd AA+ 500.00 1.12%
Grasim Industries Ltd AAA 495.18 1.11%
PTC UBL Trust IndusInd Bank AAA(SO) 240.94 0.54%
HDFC Ltd AAA 198.48 0.44%
PTC IBL Trust IndusInd Bank AAA(SO) 163.89 0.37%
PTC Citi Fleet Trust Citibank AAA(SO) 159.43 0.36%
Cholamandalam Investment & Finance Co. Ltd AA 101.60 0.23%
Government Securities 311.78 0.70%
7.99% GOI 2017 Sovereign 311.78 0.70%
CPs, CDs and Term Deposits 13,109.44 29.36%
Export Import Bank of India Ltd AAA 6,534.12 14.63%
Punjab National Bank Ltd P1+ 3,500.00 7.84%
UTI Bank Ltd P1+ 3,000.00 6.72%
IDBI Bank Ltd P1+ 75.32 0.17%
Cash, Call, CBLO & Reverse Repo 3,171.54 7.10%
Other Current Assets 191.36 0.42%
Total Net Assets 44,667.17 100.00%
• Top Five Holdings
WHY SHOULD ONE INVEST?Short term deployment of funds with low volatilityICICI Prudential Short Term Plan
*Benchmark start date : 31-03-2002CAGR – Short Term Plan: 6.80%; Benchmark : 5.69%Past performance may or may not be sustained in future.
PortfolioCompany/Issuer Rating Mkt Value (Rs. Lakh) % to NAVStyle Box
Performance Record* - Cumulative Option
*Returns >= 1 Year are CAGR, < 1 Year are Absolute. Benchmark is Crisil ShortTerm Bond Fund Index. Start date: 31-03-2002. For computation of returns theallotment NAV has been taken as Rs. 10.00. Past performance may or maynot be sustained in future. 31-Jul-04 was a non business day.
Figures as on 31-July-2007
Snapshot:Fund Manager : Chaitanya PandeIndicative Investment Horizon: 3 - 6 monthsInception Cumulative Option: 25-10-2001date Institutional Option : 03-04-2003Fund Size: Rs. 446.67 croresNAV (As on 31-July-2007):
Cumulative Option : Rs. 14.7691Institutional Option : Rs. 14.9315
**Expense Ratio:Short Term Plan : 1.10%Inst. Plan : 0.80%
** This is a close approximation of the number.
}
4.90%
8.62%6.92% 6.64% 7.00%
4.58%
7.38%
5.50% 5.39%
0.00%1.00%2.00%3.00%4.00%5.00%6.00%7.00%8.00%9.00%
10.00%
Last 6Months
Last 1year
Last 3years
Last 5years
SinceInception
Short Term Plan Crisil Short Term Bond Fund Index
Rs 14203.11
Rs 13434.87
9,95010,45010,95011,45011,95012,45012,95013,45013,95014,450
Apr-0
2Ju
l-02
Oct
-02
Jan-
03Ap
r-03
Jul-0
3O
ct-0
3Ja
n-04
Apr-0
4Ju
l-04
Oct
-04
Jan-
05Ap
r-05
Jul-0
5O
ct-0
5Ja
n-06
Apr-0
6Ju
l-06
Oct
-06
Jan-
07Ap
r-07
Jul-0
7
Short Term Plan Crisil Short Term Bond Fund Index
41.24%
34.80%
22.83%
0.70%
0.43%
0.00% 20.00% 40.00% 60.00%
1-3 years
<182 days
182 days - 1 year
5-10 years
Other Current Assets
Unrated5.60%
Sovereign Securities0.70%
AA and Equivalent10.29%
Call,Current Assets and
Reverse Repos7.53%
AAA and Equivalent75.88%

39
Rs. 10000 invested at inception: Long Term Floating Rate Plan-B Vs Crisil Liquid Fund Index
CAGR – Long Term Floating Rate Plan: 6.47%; Benchmark : 5.81%Past performance may or may not be sustained in future.
Rating Profile
Maturity Profile
Performance Record *- Cumulative Option
Snapshot:Fund Manager : Chaitanya PandeIndicative Investment Horizon: 6-12 monthsInception date: 15-Sep-04Fund Size: Rs. 113.20 croresNAV (As on 31-July-2007):
Plan A - Cumulative: Rs. 11.8315Plan B - Cumulative: Rs. 11.9742
**Expense Ratio:Plan A - 1.25%Plan B - 0.85%
**This is a close approximation of the number.
*Returns >= 1 Year are CAGR, < 1 Year are Absolute. Benchmark is CrisilLiquid Fund Index. For computation of returns the allotment NAV has beentaken as Rs. 10.00. Past performance may or may not be sustained in future.
ICICI Prudential Long Term Floating Rate Plan
Average Maturity : 0.27 YearModified Duration : 0.25 YearYield To Maturity : 6.61%% Floating Rate Assets : 36.30%Average days to reset : 0.16 YearAverage maturity of fixed rate component : 0.14 YearWeighted average maturity : 0.15 Year% Unlisted Bonds : 7.07%
Quantitative Indicators:
PSU/PFI Bonds 550.43 4.86%
• Industrial Development Bank of India AA+ 549.45 4.85%
Power Finance Corporation Ltd AAA 0.98 0.01%
Private Corporate Securities 2,065.14 18.24%
• Ranbaxy Holding Company Ltd Unrated 800.00 7.07%
• PTC Shriram Transport F1+ 523.47 4.62%
• ICICI Bank Ltd AAA 500.73 4.42%
• PTC UBL Trust IndusInd Bank AAA(SO) 240.94 2.13%
CPs, CDs and Term Deposits 6,424.70 56.76%
UTI Bank Ltd P1+ 4,481.33 39.59%
Allahabad Bank Ltd P1+ 960.85 8.49%
Punjab National Bank Ltd P1+ 500.00 4.42%
Industrial Development Bank of India P1+ 482.52 4.26%
Cash, Call, CBLO & Reverse Repo 2,246.55 19.85%
Other Current Assets 33.19 0.29%
Total Net Assets 11,320.01 100.00%
• Top Five Holdings
PortfolioCompany/Issuer Rating Mkt Value (Rs. Lakh) % to NAVStyle Box
WHY SHOULD ONE INVEST?Generate market rate of returns with low volatility
Figures as on 31-July-2007
4.07%
7.78%
6.47%
4.18%
7.35%
5.81%
0.00%1.00%2.00%3.00%4.00%5.00%6.00%7.00%8.00%9.00%
Last 6 Months Last 1 year Since Inception
Long Term Floating Rate Plan Crisil Liquid Fund Index
Rs 11974.20
Rs 11763.69
9,950
10,450
10,950
11,450
11,950
12,450
Sep-
04
Nov
-04
Jan-
05M
ar-0
5
May
-05
Jul-0
5
Sep-
05
Nov
-05
Jan-
06M
ar-0
6
May
-06
Jul-0
6
Sep-
06N
ov-0
6
Jan-
07M
ar-0
7M
ay-0
7
Jul-0
7
Long Term Floating Rate Plan Crisil Liquid Fund Index
90.22%
9.49%
0.29%
0.00% 20.00% 40.00% 60.00% 80.00% 100.00%
<182 days
1-3 years
Other CurrentAssets
Unrated7.07%
AA and Equivalent
4.85%
Call,Current Assets and
Reverse Repos20.14%
AAA and Equivalent67.94%

40
91.72%
8.28%
0.00% 40.00% 80.00% 120.00%
<182 days
182 days - 1 year
Rating Profile
Maturity Profile:
Quantitative Indicators:
Average Maturity : 65.89 DaysModified Duration : 60.80 DaysYield To Maturity : 5.78%% Floating Rate Assets : 51.72%Average days to reset : 65.37 DaysAverage maturity of fixed rate component : 65.37 DaysWeighted average maturity : 65.37 Days% Unlisted Bonds : 0.00%
Performance* Record - Cash Option - Growth
CPs, CDs and Term Deposits 4,427.48 62.69%
Industrial Development Bank of India P1+ 965.04 13.66%
Allahabad Bank Ltd P1+ 960.85 13.61%
UCO Bank P1+ 916.83 12.98%
UTI Bank Ltd P1+ 500.00 7.08%
Punjab National Bank Ltd P1+ 500.00 7.08%
ABN Amro Bank Ltd A1+ 467.07 6.61%
IDBI Bank Ltd P1+ 117.69 1.67%
Cash, Call, CBLO & Reverse Repo 3,652.24 51.72%
Other Current Assets (1,017.51) -14.41%
Total Net Assets 7,062.21 100.00%• Top Five Holdings
Snapshot:Fund Manager : Chaitanya PandeIndicative Investment Horizon: One day to one weekInception date:
Growth Option: 06-03-2002Growth Cash Option: 09-03-2006
Fund Size: Rs. 70.62 croresNAV (As on 31-July-2007):
Growth option : Rs. 13.0537Cash Option Growth: Rs. 11.0599
**Expense Ratio:Growth option: 1.00%Cash Option Growth: 0.66%
** This is a close approximation of the number.
WHY SHOULD ONE INVEST?Temporary parking of funds with high liquidity
Style Box
ICICI Prudential Sweep PlanPortfolio
Company/Issuer Rating Mkt Value (Rs. Lakh) % to NAV
*Returns >= 1 Year are CAGR, < 1 Year are Simple Annualised. Benchmark is CrisilLiquid Fund Index. For computation of returns the allotment NAV has been takenas Rs. 10.00. Past performance may or may not be sustained in future.
Figures as on 31-July-2007
4.08%5.36%
8.04% 7.76% 7.49%
0.94%
6.28%
8.43%7.35% 7.11%
0.00%1.00%2.00%3.00%4.00%5.00%6.00%7.00%8.00%9.00%
Last 15days
Last 30days
Last 6Months
Last 1year
SinceInception
Sweep Crisil Liquid Fund Index
Call,Current Assets and
Reverse Repos37.31%
AAA and Equivalent62.69%
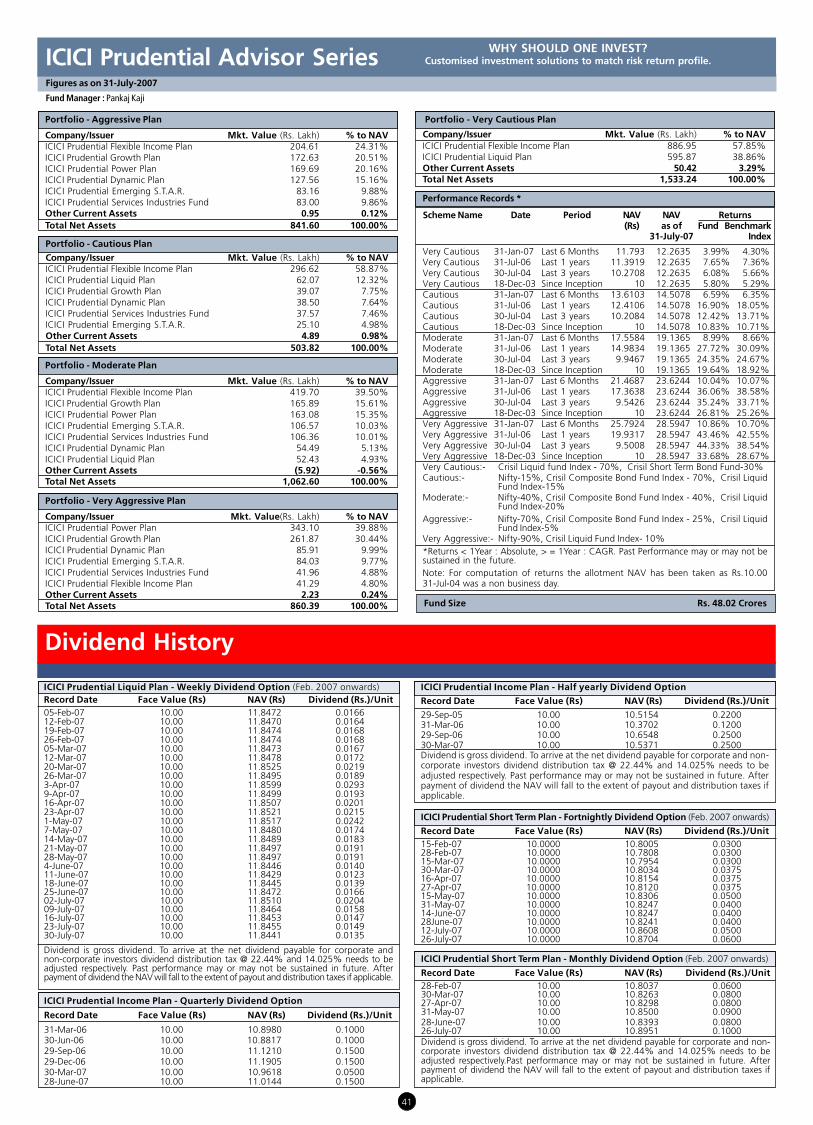
41
ICICI Prudential Income Plan - Quarterly Dividend Option
Record Date Face Value (Rs) NAV (Rs) Dividend (Rs.)/Unit
31-Mar-06 10.00 10.8980 0.100030-Jun-06 10.00 10.8817 0.100029-Sep-06 10.00 11.1210 0.150029-Dec-06 10.00 11.1905 0.150030-Mar-07 10.00 10.9618 0.050028-June-07 10.00 11.0144 0.1500
ICICI Prudential Short Term Plan - Monthly Dividend Option (Feb. 2007 onwards)
Record Date Face Value (Rs) NAV (Rs) Dividend (Rs.)/Unit28-Feb-07 10.00 10.8037 0.060030-Mar-07 10.00 10.8263 0.080027-Apr-07 10.00 10.8298 0.080031-May-07 10.00 10.8500 0.090028-June-07 10.00 10.8393 0.080026-July-07 10.00 10.8951 0.1000Dividend is gross dividend. To arrive at the net dividend payable for corporate and non-corporate investors dividend distribution tax @ 22.44% and 14.025% needs to beadjusted respectively.Past performance may or may not be sustained in future. Afterpayment of dividend the NAV will fall to the extent of payout and distribution taxes ifapplicable.
ICICI Prudential Short Term Plan - Fortnightly Dividend Option (Feb. 2007 onwards)
Record Date Face Value (Rs) NAV (Rs) Dividend (Rs.)/Unit15-Feb-07 10.0000 10.8005 0.030028-Feb-07 10.0000 10.7808 0.030015-Mar-07 10.0000 10.7954 0.030030-Mar-07 10.0000 10.8034 0.037516-Apr-07 10.0000 10.8154 0.037527-Apr-07 10.0000 10.8120 0.037515-May-07 10.0000 10.8306 0.050031-May-07 10.0000 10.8247 0.040014-June-07 10.0000 10.8247 0.040028June-07 10.0000 10.8241 0.040012-July-07 10.0000 10.8608 0.050026-July-07 10.0000 10.8704 0.0600
ICICI Prudential Liquid Plan - Weekly Dividend Option (Feb. 2007 onwards)Record Date Face Value (Rs) NAV (Rs) Dividend (Rs.)/Unit05-Feb-07 10.00 11.8472 0.016612-Feb-07 10.00 11.8470 0.016419-Feb-07 10.00 11.8474 0.016826-Feb-07 10.00 11.8474 0.016805-Mar-07 10.00 11.8473 0.016712-Mar-07 10.00 11.8478 0.017220-Mar-07 10.00 11.8525 0.021926-Mar-07 10.00 11.8495 0.01893-Apr-07 10.00 11.8599 0.02939-Apr-07 10.00 11.8499 0.019316-Apr-07 10.00 11.8507 0.020123-Apr-07 10.00 11.8521 0.02151-May-07 10.00 11.8517 0.02427-May-07 10.00 11.8480 0.017414-May-07 10.00 11.8489 0.018321-May-07 10.00 11.8497 0.019128-May-07 10.00 11.8497 0.01914-June-07 10.00 11.8446 0.014011-June-07 10.00 11.8429 0.012318-June-07 10.00 11.8445 0.013925-June-07 10.00 11.8472 0.016602-July-07 10.00 11.8510 0.020409-July-07 10.00 11.8464 0.015816-July-07 10.00 11.8453 0.014723-July-07 10.00 11.8455 0.014930-July-07 10.00 11.8441 0.0135
Dividend is gross dividend. To arrive at the net dividend payable for corporate andnon-corporate investors dividend distribution tax @ 22.44% and 14.025% needs to beadjusted respectively. Past performance may or may not be sustained in future. Afterpayment of dividend the NAV will fall to the extent of payout and distribution taxes if applicable.
WHY SHOULD ONE INVEST?Customised investment solutions to match risk return profile.ICICI Prudential Advisor Series
Figures as on 31-July-2007
Fund Manager : Pankaj Kaji
Performance Records *
Scheme Name Date Period NAV NAV Returns(Rs) as of Fund Benchmark
31-July-07 Index
Very Cautious 31-Jan-07 Last 6 Months 11.793 12.2635 3.99% 4.30%Very Cautious 31-Jul-06 Last 1 years 11.3919 12.2635 7.65% 7.36%Very Cautious 30-Jul-04 Last 3 years 10.2708 12.2635 6.08% 5.66%Very Cautious 18-Dec-03 Since Inception 10 12.2635 5.80% 5.29%Cautious 31-Jan-07 Last 6 Months 13.6103 14.5078 6.59% 6.35%Cautious 31-Jul-06 Last 1 years 12.4106 14.5078 16.90% 18.05%Cautious 30-Jul-04 Last 3 years 10.2084 14.5078 12.42% 13.71%Cautious 18-Dec-03 Since Inception 10 14.5078 10.83% 10.71%Moderate 31-Jan-07 Last 6 Months 17.5584 19.1365 8.99% 8.66%Moderate 31-Jul-06 Last 1 years 14.9834 19.1365 27.72% 30.09%Moderate 30-Jul-04 Last 3 years 9.9467 19.1365 24.35% 24.67%Moderate 18-Dec-03 Since Inception 10 19.1365 19.64% 18.92%Aggressive 31-Jan-07 Last 6 Months 21.4687 23.6244 10.04% 10.07%Aggressive 31-Jul-06 Last 1 years 17.3638 23.6244 36.06% 38.58%Aggressive 30-Jul-04 Last 3 years 9.5426 23.6244 35.24% 33.71%Aggressive 18-Dec-03 Since Inception 10 23.6244 26.81% 25.26%Very Aggressive 31-Jan-07 Last 6 Months 25.7924 28.5947 10.86% 10.70%Very Aggressive 31-Jul-06 Last 1 years 19.9317 28.5947 43.46% 42.55%Very Aggressive 30-Jul-04 Last 3 years 9.5008 28.5947 44.33% 38.54%Very Aggressive 18-Dec-03 Since Inception 10 28.5947 33.68% 28.67%Very Cautious:- Crisil Liquid fund Index - 70%, Crisil Short Term Bond Fund-30%Cautious:- Nifty-15%, Crisil Composite Bond Fund Index - 70%, Crisil Liquid
Fund Index-15%Moderate:- Nifty-40%, Crisil Composite Bond Fund Index - 40%, Crisil Liquid
Fund Index-20%Aggressive:- Nifty-70%, Crisil Composite Bond Fund Index - 25%, Crisil Liquid
Fund Index-5%Very Aggressive:- Nifty-90%, Crisil Liquid Fund Index- 10%*Returns < 1Year : Absolute, > = 1Year : CAGR. Past Performance may or may not besustained in the future.Note: For computation of returns the allotment NAV has been taken as Rs.10.0031-Jul-04 was a non business day.
Portfolio - Very Cautious Plan
Company/Issuer Mkt. Value (Rs. Lakh) % to NAVICICI Prudential Flexible Income Plan 886.95 57.85%ICICI Prudential Liquid Plan 595.87 38.86%Other Current Assets 50.42 3.29%Total Net Assets 1,533.24 100.00%
Portfolio - Very Aggressive Plan
Company/Issuer Mkt. Value(Rs. Lakh) % to NAVICICI Prudential Power Plan 343.10 39.88%ICICI Prudential Growth Plan 261.87 30.44%ICICI Prudential Dynamic Plan 85.91 9.99%ICICI Prudential Emerging S.T.A.R. 84.03 9.77%ICICI Prudential Services Industries Fund 41.96 4.88%ICICI Prudential Flexible Income Plan 41.29 4.80%Other Current Assets 2.23 0.24%Total Net Assets 860.39 100.00%
Portfolio - Aggressive Plan
Company/Issuer Mkt. Value (Rs. Lakh) % to NAVICICI Prudential Flexible Income Plan 204.61 24.31%ICICI Prudential Growth Plan 172.63 20.51%ICICI Prudential Power Plan 169.69 20.16%ICICI Prudential Dynamic Plan 127.56 15.16%ICICI Prudential Emerging S.T.A.R. 83.16 9.88%ICICI Prudential Services Industries Fund 83.00 9.86%Other Current Assets 0.95 0.12%Total Net Assets 841.60 100.00%
Portfolio - Moderate Plan
Company/Issuer Mkt. Value (Rs. Lakh) % to NAVICICI Prudential Flexible Income Plan 419.70 39.50%ICICI Prudential Growth Plan 165.89 15.61%ICICI Prudential Power Plan 163.08 15.35%ICICI Prudential Emerging S.T.A.R. 106.57 10.03%ICICI Prudential Services Industries Fund 106.36 10.01%ICICI Prudential Dynamic Plan 54.49 5.13%ICICI Prudential Liquid Plan 52.43 4.93%Other Current Assets (5.92) -0.56%Total Net Assets 1,062.60 100.00%
Portfolio - Cautious Plan
Company/Issuer Mkt. Value (Rs. Lakh) % to NAVICICI Prudential Flexible Income Plan 296.62 58.87%ICICI Prudential Liquid Plan 62.07 12.32%ICICI Prudential Growth Plan 39.07 7.75%ICICI Prudential Dynamic Plan 38.50 7.64%ICICI Prudential Services Industries Fund 37.57 7.46%ICICI Prudential Emerging S.T.A.R. 25.10 4.98%Other Current Assets 4.89 0.98%Total Net Assets 503.82 100.00%
Fund Size Rs. 48.02 Crores
Dividend History
ICICI Prudential Income Plan - Half yearly Dividend Option
Record Date Face Value (Rs) NAV (Rs) Dividend (Rs.)/Unit
29-Sep-05 10.00 10.5154 0.220031-Mar-06 10.00 10.3702 0.120029-Sep-06 10.00 10.6548 0.250030-Mar-07 10.00 10.5371 0.2500Dividend is gross dividend. To arrive at the net dividend payable for corporate and non-corporate investors dividend distribution tax @ 22.44% and 14.025% needs to beadjusted respectively. Past performance may or may not be sustained in future. Afterpayment of dividend the NAV will fall to the extent of payout and distribution taxes ifapplicable.

42
ICICI Prudential Monthly Income Plan** - Quarterly Dividend Option (Feb.2006 onwards)
Record Date Face Value (Rs.) NAV (Rs) Dividend (Rs.)/Unit
28-Feb-07 10.0000 11.8645 0.250031-May-07 10.0000 11.8857 0.2500
ICICI Prudential Long Term Floating Rate Plan - Dividend A Monthly Option
Record Date Face Value (Rs.) NAV (Rs) Dividend (Rs.)/Unit31-Jan-07 10.00 10.1624 0.052028-Feb-07 10.00 10.1580 0.052030-Mar-07 10.00 10.1697 0.063027-Apr-07 10.00 10.1702 0.063031-May-07 10.00 10.1945 0.070028-June-07 10.00 10.1752 0.070026-July-07 10.00 10.1697 0.0650
ICICI Prudential Long Term Floating Rate Plan - Dividend B Monthly Option
Record Date Face Value (Rs.) NAV (Rs) Dividend (Rs.)/Unit31-Jan-07 10.00 10.1850 0.054028-Feb-07 10.00 10.1818 0.054030-Mar-07 10.00 10.1949 0.066527-Apr-07 10.00 10.1953 0.066531-May-07 10.00 10.2201 0.073528-June-07 10.00 10.2006 0.073526-July-07 10.00 10.1949 0.0685
ICICI Prudential Gilt Fund - Treasury Plan - Quarterly Dividend Option (May 2007 onwards)
Record Date Face Value (Rs.) NAV (Rs) Dividend (Rs.)/Unit31-May-07 10.0000 10.6186 0.1500
ICICI Prudential Gilt Fund - Treasury Plan - Half Yearly Dividend Option (May 2006 onwards)
Record Date Face Value (Rs.) NAV (Rs) Dividend (Rs.)/Unit31-May-07 10.0000 10.3050 0.2000Dividend is gross dividend. To arrive at the net dividend payable for corporate and non-corporateinvestors dividend distribution tax @ 22.44% and 14.025% needs to be adjusted respectively.Past performance may or may not be sustained in future. After payment of dividend theNAV will fall to the extent of payout.
ICICI Prudential Sweep Plan - Cash - Monthly Option
Record Date Face Value (Rs) NAV (Rs) Dividend (Rs.)/Unit26-July-07 10.00 10.0441 0.0441Dividend is gross dividend. To arrive at the net dividend payable for corporate and non-corporate investors dividend distribution tax @ 22.44% and 14.025% needs to be adjustedrespectively. Past performance may or may not be sustained in future. After payment ofdividend the NAV will fall to the extent of payout and distribution taxes if applicable.
ICICI Prudential Gilt Fund - Investment Plan - Half Yearly Dividend Option (Nov 2006 onwards)
Record Date Face Value (Rs.) NAV (Rs) Dividend (Rs.)/Unit30-Nov-06 10.0000 11.0558 0.400031-May-07 10.0000 10.7314 0.1000
ICICI Prudential Monthly Income Plan** - Monthly Dividend Option (Mar. 2007 onwards)
Record Date Face Value (Rs.) NAV (Rs) Dividend (Rs.)/Unit
30-Mar-07 10.0000 11.4461 0.060027-Apr-07 10.0000 11.5230 0.080031-May-07 10.0000 11.5527 0.070028-June-07 10.0000 11.5658 0.070026-July-07 10.0000 11.7353 0.0900
ICICI Prudential Blended Plan A - Dividend Option
Record Date Face Value (Rs.) NAV (Rs) Dividend (Rs.)/Unit26-Oct-05 10.00 10.2945 0.25001-June-06 10.00 10.5643 0.250020-Apr-07 10.00 11.0246 0.5000
Dividend is gross dividend. To arrive at the net dividend payable for corporate and non-corporate investors dividend distribution tax @ 22.44% and 14.025% needs to be adjustedrespectively. Past performance may or may not be sustained in future. After payment ofdividend the NAV will fall to the extent of payout and distribution taxes if applicable.
ICICI Prudential Long Term Floating Rate Plan - Dividend C Monthly Option
Record Date Face Value (Rs.) NAV (Rs) Dividend (Rs.)/Unit28-Apr-06 10.00 10.0743 0.0440
ICICI Prudential Sweep Plan - Cash Option - Weekly Dividend
Record Date Face Value (Rs) NAV (Rs) Dividend (Rs.)/Unit02-July-07 10.00 10.0178 0.017809-July-07 10.00 10.0118 0.011816-July-07 10.00 10.0103 0.010323-July-07 10.00 10.0078 0.007830-July-07 10.00 10.0077 0.0077
Dividend History
ICICI Prudential FMP Series 34 - 17 Mths Plan-Retail Dividend
Record Date Face Value (Rs.) NAV (Rs) Dividend (Rs.)/Unit29-Mar-07 10.00 10.0540 0.0540
ICICI Prudential FMP Series 34 - 17 Mths Plan-Institutional Dividend
Record Date Face Value (Rs.) NAV (Rs) Dividend (Rs.)/Unit29-Mar-07 10.00 10.0646 0.0646
ICICI Prudential FMP Series 34 - 1 Year Plan A-Retail DividendRecord Date Face Value (Rs.) NAV (Rs) Dividend (Rs.)/Unit28-June-07 10.00 10.2279 0.2279
ICICI Prudential FMP Series 34 - 16 Mths Plan-Retail DividendRecord Date Face Value (Rs.) NAV (Rs) Dividend (Rs.)/Unit29-Mar-07 10.00 10.0625 0.0625
ICICI Prudential Hybrid FMP 13 Mths Plan - Institutional Quarterly Dividend
Record Date Face Value (Rs.) NAV (Rs) Dividend (Rs.)/Unit28-June-07 10.00 10.2249 0.2249
ICICI Prudential Hybrid FMP 13 Mths Plan - Retail Quarterly Dividend
Record Date Face Value (Rs.) NAV (Rs) Dividend (Rs.)/Unit28-June-07 10.00 10.2134 0.2134
ICICI Prudential Blended Plan B - Dividend Option
Record Date Face Value (Rs.) NAV (Rs) Dividend (Rs.)/Unit
26-Oct-05 10.00 10.2600 0.230001-Jun-06 10.00 10.4485 0.4000Dividend is gross dividend. To arrive at the net dividend payable for corporate and non-corporate investors dividend distribution tax @ 22.44% and 14.025% needs to be adjustedrespectively. Past performance may or may not be sustained in future. After payment ofdividend the NAV will fall to the extent of payout and distribution taxes if applicable.
ICICI Prudential FMP Series 34 - 1 Year Plan B-Retail DividendRecord Date Face Value (Rs.) NAV (Rs) Dividend (Rs.)/Unit28-June-07 10.00 10.2892 0.1815
ICICI Prudential FMP Series 34 - 1 Year Plan B-Institutional Dividend
Record Date Face Value (Rs.) NAV (Rs) Dividend (Rs.)/Unit28-June-07 10.00 10.2970 0.1893
ICICI Prudential FMP Series 36 - 18 Mths Plan A - Retail Dividend Option
Record Date Face Value (Rs.) NAV (Rs) Dividend (Rs.)/Unit31-July-07 10.00 10.2276 0.0618Dividend is gross dividend. To arrive at the net dividend payable for corporate and non-corporate investors dividend distribution tax @ 22.44% and 14.025% needs to beadjusted respectively. Past performance may or may not be sustained in future. Afterpayment of dividend the NAV will fall to the extent of payout and distribution taxes ifapplicable.
ICICI Prudential FMP Series 37 - 3 Mths Plus Plan A - Retail Dividend Option
Record Date Face Value (Rs.) NAV (Rs) Dividend (Rs.)/Unit12-July-07 10.00 10.3449 0.3449
ICICI Prudential Hybrid FMP 13 Mths Plan - Retail Annual Dividend
Record Date Face Value (Rs.) NAV (Rs) Dividend (Rs.)/Unit23-July-07 10.00 10.2427 0.2427
ICICI Prudential FMP Series 34 - 1 Year Plan A-Institutional Dividend
Record Date Face Value (Rs.) NAV (Rs) Dividend (Rs.)/Unit28-June-07 10.00 10.2355 0.2355
ICICI Prudential FMP Series 38 - 3 Mths Plan A - Retail Dividend Option
Record Date Face Value (Rs.) NAV (Rs) Dividend (Rs.)/Unit19-July-07 10.00 10.06001 0.0601
ICICI Prudential FMP Series 36 - 18 Mths Plan B - Retail Dividend Option
Record Date Face Value (Rs.) NAV (Rs) Dividend (Rs.)/Unit31-July-07 10.00 10.0386 0.0262
ICICI Prudential Monthly Interval Plan I - Retail Dividend Option
Record Date Face Value (Rs.) NAV (Rs) Dividend (Rs.)/Unit12-July-07 10.00 10.1427 0.0663
ICICI Prudential Monthly Interval Plan II - Retail Dividend Option
Record Date Face Value (Rs.) NAV (Rs) Dividend (Rs.)/Unit25-July-07 10.00 10.1446 0.0729Dividend is gross dividend. To arrive at the net dividend payable for corporate and non-corporate investors dividend distribution tax @ 22.44% and 14.025% needs to beadjusted respectively. Past performance may or may not be sustained in future. Afterpayment of dividend the NAV will fall to the extent of payout and distribution taxes ifapplicable.
ICICI Prudential FMP Series 30 - 13 Mths Plan - Retail Dividend Option
Record Date Face Value (Rs.) NAV (Rs) Dividend (Rs.)/Unit23-July-07 10.00 10.2427 0.2427

43
Dividend History
ICICI Prudential Monthly Income Plan** - Half Yearly Dividend Option (Aug. 2006 onwards)
Record Date Face Value (Rs.) NAV (Rs) Dividend (Rs.)/Unit31-Aug-06 10.0000 11.8638 0.450028-Feb-07 10.0000 11.8944 0.5000
Dividend is gross dividend. To arrive at the net dividend payable for corporate and non-corporateinvestors dividend distribution tax @ 22.44% and 14.025% needs to be adjusted respectively.Past performance may or may not be sustained in future. After payment of dividend the NAV willfall to the extent of payout and distribution taxes if applicable. **An open-ended fund. Monthlyincome is not assured and is subject to the availability of distributable surplus.
ICICI Prudential Flexible Income Plan - Weekly Dividend OptionRecord Date Face Value (Rs.) NAV (Rs) Dividend (Rs.)/Unit03-July-07 10.00 10.5618 0.022409-July-07 10.00 10.5505 0.011116-July-07 10.00 10.5556 0.016223-July-07 10.00 10.5540 0.014630-July-07 10.00 10.5525 0.0131Dividend is gross dividend. To arrive at the net dividend payable for corporate and non-corporate investors dividend distribution tax @ 22.44% and 14.025% needs to be adjustedrespectively. Past performance may or may not be sustained in future. After payment ofdividend the NAV will fall to the extent of payout and distribution taxes if applicable.
ICICI Prudential Floating Rate Plan - Plan C - Fortnightly Dividend Option (Feb. 2007 onwards)
Record Date Face Value (Rs.) NAV (Rs) Dividend (Rs.)/Unit14-Feb-07 10.00 10.0348 0.032627-Feb-07 10.00 10.0278 0.025515-Mar-07 10.00 10.0358 0.033529-Mar-07 10.00 10.0438 0.041516-Apr-07 10.00 10.0581 0.055826-Apr-07 10.00 10.0295 0.027215-May-07 10.00 10.0500 0.047730-May-07 10.00 10.0380 0.035714-June-07 10.00 10.0283 0.025228-June-07 10.00 10.0280 0.024112-July-07 10.00 10.0379 0.033226-July-07 10.00 10.0283 0.0221
ICICI Prudential Long Term Plan - Weekly Dividend OptionRecord Date Face Value (Rs.) NAV (Rs) Dividend (Rs.)/Unit04-July-07 10.00 10.4876 0.015010-July-07 10.00 10.4728 0.014017-July-07 10.00 10.4607 0.010024-July-07 10.00 10.4700 0.015031-July-07 10.00 10.4740 0.0150Dividend is gross dividend. To arrive at the net dividend payable for corporate and non-corporate investors dividend distribution tax @ 22.44% and 14.025% needs to be adjustedrespectively. Past performance may or may not be sustained in future. After payment ofdividend the NAV will fall to the extent of payout and distribution taxes if applicable.
ICICI Prudential Balanced Fund - Dividend OptionRecord Date Face Value (Rs.) NAV (Rs) Dividend (Rs.)/Unit30-Oct-03 10.00 12.93 2.0024-Mar-05 10.00 15.36 3.5026-Dec-05 10.00 15.76 1.2029-Sep-06 10.00 17.66 1.2016-Mar-07 10.00 16.93 1.00Past performance may or may not be sustained in future. After payment of dividend theNAV will fall to the extent of dividend payout and statutory levy, if any
ICICI Prudential Floating Rate Plan - Plan D - Fortnightly Dividend Option (June 2007 onwards)
Record Date Face Value (Rs.) NAV (Rs) Dividend (Rs.)/Unit14-June-07 10.00 10.0287 0.025828-June-07 10.00 10.0275 0.023812-July-07 10.00 10.0382 0.033726-July-07 10.00 10.0266 0.0221Dividend is gross dividend. To arrive at the net dividend payable for corporate and non-corporateinvestors dividend distribution tax @ 22.44% and 14.025% needs to be adjusted respectively. Pastperformance may or may not be sustained in future. After payment of dividend the NAV willfall to the extent of payout and distribution taxes if applicable.
ICICI Prudential Income Multiplier Fund - Dividend Option (May 2007 onwards)Record Date Face Value (Rs.) NAV (Rs) Dividend (Rs.)/Unit31-May-07 10.00 11.9275 0.0828-June-07 10.00 11.9597 0.0826-July-07 10.00 12.1445 0.12Dividend is gross dividend. To arrive at the net dividend payable for corporate and non-corporate investors dividend distribution tax @ 22.44% and 14.025% needs to be adjustedrespectively. Past performance may or may not be sustained in future. After payment ofdividend the NAV will fall to the extent of payout and distribution taxes if applicable.
ICICI Prudential Infrastructure fund - DividendRecord Date Face Value (Rs.) NAV (Rs) Dividend (Rs.)/Unit20-Mar-06 10.00 14.37 1.0015-Sep-06 10.00 14.68 1.0016-Mar-07 10.00 14.46 1.50Past performance may or may not be sustained in future. After payment of dividend theNAV will fall to the extent of dividend payout and statutory levy, if any
ICICI Prudential Floating Rate Plan - Plan B - Fortnightly Dividend Option (Feb. 2007 onwards)
Record Date Face Value (Rs.) NAV (Rs) Dividend (Rs.)/Unit14-Feb-07 10.00 10.0713 0.032327-Feb-07 10.00 10.0644 0.025315-Mar-07 10.00 10.0721 0.033029-Mar-07 10.00 10.0804 0.041316-Apr-07 10.00 10.0948 0.055726-Apr-07 10.00 10.0663 0.027215-May-07 10.00 10.0864 0.047330-May-07 10.00 10.0745 0.035414-June-07 10.00 10.0649 0.025028-June-07 10.00 10.0645 0.023812-July-07 10.00 10.0744 0.032926-July-07 10.00 10.0649 0.0219
ICICI Prudential Floating Rate Plan - Plan A - Fortnightly Dividend Option (Feb. 2007 onwards)
Record Date Face Value (Rs.) NAV (Rs) Dividend (Rs.)/Unit
14-Feb-07 10.00 10.0335 0.031027-Feb-07 10.00 10.0269 0.024315-Mar-07 10.00 10.0345 0.031929-Mar-07 10.00 10.0427 0.040116-Apr-07 10.00 10.0566 0.054026-Apr-07 10.00 10.0288 0.026215-May-07 10.00 10.0485 0.045930-May-07 10.00 10.0369 0.034314-June-07 10.00 10.0268 0.023428-June-07 10.00 10.0266 0.022412-July-07 10.00 10.0368 0.031826-July-07 10.00 10.0279 0.0214
ICICI Prudential Emerging S.T.A.R. Fund - Dividend Option
Record Date Face Value (Rs.) NAV (Rs) Dividend (Rs.)/Unit19-Jul-05 10.00 15.21 1.0018-May-06 10.00 23.93 3.0012-Jan-07 10.00 24.23 2.5020-July-07 10.00 24.54 2.50Past performance may or may not be sustained in future. After payment of dividend theNAV will fall to the extent of dividend payout and statutory levy, if any
ICICI Prudential Dynamic Fund - Dividend Option
Record Date Face Value (Rs.) NAV (Rs) Dividend (Rs.)/Unit21-Sep-05 10.00 16.5757 2.0027-Apr-06 10.00 21.6998 2.0009-Feb-07 10.00 23.3124 2.00Past performance may or may not be sustained in future. After payment of dividend theNAV will fall to the extent of dividend payout and statutory levy, if any
ICICI Prudential FMCG Fund - Dividend Option
Record Date Face Value (Rs.) NAV (Rs) Dividend (Rs.)/Unit
16-Mar-00 10.00 11.45 1.0023-Mar-06 10.00 34.47 3.0012-Jan-07 10.00 35.25 1.8020-July-07 10.00 34.88 2.00Past performance may or may not be sustained in future. After payment of dividend theNAV will fall to the extent of dividend payout and statutory levy, if any
ICICI Prudential Tax Plan - Dividend Option
Record Date Face Value (Rs.) NAV (Rs) Dividend (Rs.)/Unit16-Mar-00 10.00 22.06 6.0024-Jul-03 10.00 12.38 1.2025-Mar-04 10.00 16.09 4.5028-Dec-04 10.00 20.61 2.5023-Aug-05 10.00 26.98 2.5020-Mar-06 10.00 31.51 5.0010-Nov-06 10.00 29.77 2.5009-Feb-07 10.00 27.15 5.00Past performance may or may not be sustained in future. After payment of dividend theNAV will fall to the extent of dividend payout and statutory levy, if any
ICICI Prudential Power - Dividend OptionRecord Date Face Value (Rs.) NAV (Rs) Dividend (Rs.)/Unit24-Jul-03 10.00 14.07 2.0023-Oct-03 10.00 18.62 3.0024-Dec-03 10.00 16.22 3.0025-Mar-04 10.00 12.68 1.5024-Mar-05 10.00 14.72 2.5026-Dec-05 10.00 17.77 2.008-Aug-06 10.00 19.33 2.0016-Mar-07 10.00 20.16 2.00Past performance may or may not be sustained in future. After payment of dividend theNAV will fall to the extent of dividend payout and statutory levy, if any
ICICI Prudential Growth Plan - Dividend OptionRecord Date Face Value (Rs.) NAV (Rs) Dividend (Rs.)/Unit
01-Mar-01 10.00 12.54 1.2015-Mar-02 10.00 10.83 0.8024-Jul-03 10.00 11.09 0.8006-Nov-03 10.00 14.76 2.5025-Mar-04 10.00 13.15 2.0017-Mar-05 10.00 14.68 1.0023-Mar-06 10.00 23.03 2.0015-Dec-06 10.00 25.03 2.5015-June-07 10.00 23.70 2.00Past performance may or may not be sustained in future. After payment of dividend theNAV will fall to the extent of dividend payout and statutory levy, if any
ICICI Prudential Discovery Fund - Dividend OptionRecord Date Face Value (Rs.) NAV (Rs) Dividend (Rs.)/Unit05-Apr-05 10.00 13.71 1.0011-Oct-05 10.00 17.99 1.5023-Mar-06 10.00 20.30 2.0024-Nov-06 10.00 20.68 2.0015-June-07 10.00 19.05 2.00Past performance may or may not be sustained in future. After payment of dividend theNAV will fall to the extent of dividend payout and statutory levy, if any
ICICI Prudential Services Industries Fund - DividendRecord Date Face Value (Rs.) NAV (Rs) Dividend (Rs.)/Unit11-May-07 10.00 15.99 1.50Past performance may or may not be sustained in future. After payment of dividend theNAV will fall to the extent of dividend payout and statutory levy, if any

44
Key Features
Type
Investment Pattern(Under normalcircumstances)
Options
Default Option
Application Amount ###
Min. Addl. Investment ###
Entry Load*
Exit Load*$$$
Redemption ChequesIssued ##
Min. Redemption Amt.
Cut off time:Purchase/Switch inRedemption/Switch out $
Systematic InvestmentPlan (SIP)
Systematic WithdrawalPlan (SWP)
Systematic Transfer Plan(STP) $$
Recurring Expenses**Investment Mangmt. Exp.Other recurring expensesTotal
Funds at a glanceLiquid Plan
Open-ended Liquid Income Fund
Money Market upto 80% & DebtInstruments upto 20%
1. Growth Option2. Dividend Option
a) Dividend PayoutQuarterly & Half Yearly
b) Div. Reinvestmenti) Daily, Weekly & Monthlyii) Quarterly & Half Yearly
Dividend Reinvestment withweekly frequency.
a) Growth option : Rs.15,000b) Institutional option: Rs. 1 crc) Institutional Plus option: Rs. 3 crsd) Super Institutional Growth
option: Rs. 5 crs(plus in multiples of Re.1)
a) Growth option : Rs.5,000b) Institutional option: Rs. 1 lacc) Institutional Plus option: Rs. 1 lacd) Super Institutional Growth
option: Rs. 1 lac(plus in multiples of Re.1)
Nil
Nil
Generally within 1 Business Dayfor specified RBI locations andadditional 3 Business Days forNon-RBI locations. Same DayRedemption Facility (refer toKey Information Memorandum)
Rs. 5,000
12.00 noon3.00 p.m.
N.A.
N.A.
Available
0.70%0.30%1.00%
Income Plan
Open-ended Debt Fund
Debt Securities upto 75% & MoneyMarket & Cash upto 25%
1. Growth2. Growth-AEP (Appreciation &
Regular)3. Dividend^ (Quarterly & Half
Yearly)
Dividend Reinvestment withHalf Yearly frequency.
Rs. 5,000 (plus in multiples of Re. 1)Rs.25,000 for AEP
Rs. 500 & in multiples thereof
Nil
For investment of less than or uptoRs.10 lacs : 0.5% if investment heldfor less than or equal to a period of6 months For investment of aboveRs.10 lacs: Nil
Generally within 1 Business Day forspecified RBI locations andadditional 3 Business Days for Non-RBI locations
Rs. 500
3.00 p.m.3.00 p.m.
Monthly: Minimum Rs. 1,000 + 5post-dated cheques for a minimumof Rs. 1,000 each.
*****
Minimum of Rs. 500 and in multiplesof Re. 1/-
Available
1.25%0.75%
2.00%
Short Term Plan
Open-ended Income Fund
Debt Securities upto 100% & MoneyMarket & Cash upto 50%
1. Cumulative2. Dividend Reinvestment
(Fortnightly & Monthly)
Dividend Reinvestment withFortnightly frequency.
Rs.5,000 (plus in multiples of Re. 1)Rs.25,000 for Institutional option(plus in multiples of Re.1)
Rs. 500 & in multiples thereof
Nil
Nil
Generally within 1 Business Day forspecified RBI locations andadditional 3 Business Days for Non-RBI locations
Rs. 500
3.00 p.m.3.00 p.m.
Not Available
Not Available
Available
1.25%1.00%
2.25%
Floating Rate Plan
Open-ended Income Fund
65-100% = Floating Rate DebtInstruments. 0-35% = Fixed ratedebt instruments.
1. Cumulative2. Div. Reinvestment
(Fortnightly & Dailyfrequencies)
Option: Plan ASub option: Cumulative
a) Plan-A: Rs 10,000/-b) Plan-B: Rs.10 lacsc) Plan-C: Rs.3 croresd) Plan-D: Rs.5 crores(plus in multiples of Re.1)
Plans A & B: Rs.1000 plus in multiplesof Re.1Plan C: The minimum additionalinvestment amount can be anyamount provided the minimumbalance in the investors account atthe time of additional subscriptionincluding the amount proposed to beinvested, is not below Rs. 5Crore****.Plan D: Rs.1 lac.¥
Plan-A, B, C & D: Nil
Plan-A, B, C & D: For allinvestments made on or after April24, 2007, an exit load of 0.25% ofthe applicable NAV if theredumption/switch-out is madewithin 10 days from the date ofinvestment.
Generally Within 1 business dayfor Specified RBI locations andadditional 3 Business Days forNon-RBI locations.
Rs. 500/- and multiples thereof
3.00 p.m.3.00 p.m.
Not Available
Not Available
Available
Plan A Plan B Plan C
1.00% 0.75% 0.65%
Long Term FloatingRate Plan
Open-ended Income Fund
65-100% = Floating Rate DebtInstruments. 0-35% = Fixed ratedebt instruments
1. Cumulative2. Div. Reinvestment
(Quarterly)
Option: Plan ASub option: CumulativeDividend: Automatic
Reinvestment
a) Plan-A: Rs 25,000/-b) Plan-B: Rs.1 crorec) Plan-C: Rs.5 crores(plus in multiples of Re.1)
Plans A & B: Rs.1000 (plus inmultiples of Re1)Plan C: The minimum additionalinvestment amount can be anyamount provided the minimumbalance in the investors account atthe time of additional subscriptionincluding the amount proposed to beinvested, is not below Rs. 5Crore****.
Plan-A, B & C : Nil
Plan-A: 0.50% for investments ofless than or equal to Rs. 1 Croreand redemption is made on orbefore the completion of sixmonths from the date of allotmentof units.Plan B & Plan C: Nil
Generally Within 1 business day forSpecified RBI locations andadditional 3 Business Days for Non-RBI locations.
Rs. 5,000/- and in multiples thereof;provided that minimum balanceunder a particular folio should notfall below the minumumapplication amount. This will notbe applicable for closing theaccount.
3.00 p.m.3.00 p.m.
Not Available
Not Available
Available
Plan A Plan B Plan C0.75% 0.60% 0.50%0.50% 0.30% 0.25%
1.25% 0.90% 0.75%
* The Trustees reserves the right to change/modify the load structure at a later date for the Schemes. ** Investors are requested to read the section on “Fees and Annual Recurringexpenses” in the Offer Documents of the respective schemes. The recurring expenses indicated above may change subject to ceilings under the Regulations. *** Entry load of 2.25% ofthe applicable NAV will be charged on the SIP/STP investment under this Scheme. Exit Load on the SIP/STP Invesment under this Scheme is Nil. *****For SIP/STP investment under this

45
Key Features
Type
Investment Pattern(Under normalcircumstances)
Options
Default Option
Application Amount ###
Min. Addl. Investment ###
Entry Load*
Exit Load*$$$
Redemption ChequesIssued ##
Min. Redemption Amt.
Cut off time:Purchase/Switch inRedemption/Switch out $
Systematic InvestmentPlan (SIP)
Systematic WithdrawalPlan (SWP)
Systematic Transfer Plan(STP) $$
Recurring Expenses**Investment Mangmt. Exp.Other recurring expensesTotal
Funds at a glance
Scheme: Entry Load – Nil, Exit Load – Nil.Exceptions: With effect from June 4, 2007, all new applications through the SIP & STP facility under Discovery Fund, Dynamic Plan, Emerging STAR Fund, Growth Plan, Power, ServicesIndustries Fund and Infrastructure Fund, an exit load at the rate of 0.25% of the applicable NAV will be charged if the redemption/switch-out from the Schemes is made within 6 monthsfrom the date of allotment of units.With effect from June 18, 2007: For all investments below Rs. 5 crores made under Power and Services Industries Fund (excluding investments made through SIP and STP facility),from June 18, 2007, an exit load at the rate of 0.50% of the applicable NAV will be charged if redemption/switch-out of the investment is made within 6 months from the date of allotmentof units.^ Under the Dividend Option, the Unit-holder may choose between Dividend Payout and Reinvestment Option. If not chosen, Default Option would be Dividend Payout. $ For all web-basedtransactions under the schemes of ICICI Prudential Mutual Fund, entered through the website of the fund viz. www.icicipruamc.com there would be a cooling off period of 30 minutesbefore the respective cut-off times of the relevant schemes. ### In case of all purchase transactions including additional purchase requests under all schemes except ICICI Prudential LiquidPlan, the AMC reserves the right to reject/reverse the transaction, if an amount of Rs. 1 Lakh and above is received by way of MICR cheques at the centers where high value clearing isavailable. In case of ICICI Prudential Index Fund, all the transaction for Fresh/Additional purchases for a consideration of Rs.One lakh and above will be accepted only through High ValueCheques/Demand Drafts received before the cut-off time of 10.00 a.m. for clearing of High Value Instruments or through Transfer Cheques received before 1.00 p.m. Æ For dividend of Rs.500or less the Dividend will be Automatic Compulsory Reinvestment (irrespective of the option selected by the Unitholder) & for Dividend of more than Rs.500 will either be paid out or reinvestedas opted by the Unitholders, If not selected the default option would be dividend reinvestment. Investors on or after July 24, 2006 will only have dividend reinvestment option. Dividend Payoutfacility will be available only where the amount of dividend is exceeding Rs. 1 Lakh and dividend frequency is weekly. Default option is dividend reinvestment facility. ## As per the Regulations,the Fund shall dispatch redemption proceeds within 10 Business days of receiving the redemption request. Investors are advised to refer to the sections titled “Suspension of sale andredemption of units” and “Right to limit Redemption”. The default option for payment of redemption/dividend proceeds would be Direct Credit into their bank account (in case the investorhas provided his bank mandate as one of the banks participating in direct credit arrangement and if he fails to specify the mode of payment). **** Minimum additional application amountshall be applicable for investments by an investor by itself or for investments along with any of its group companies. Later on even if the net asset value under the folio falls below Rs. 5crores, the investment can continue under the Option C. ¥ The minimum additional application amount shall be applicable for investments by an investor by itself or for investments alongwith any of its group companies. Later on even if the net asset value under the folio below Rs. 5 cores, the investment can continue under the ICICI Prudential Floating Rate Plan-Plan D.
Flexible Income Plan
Open-ended Income Fund
10 to 100% - Money market andDebentures with residual maturityof less than 1 year. 0 to 90% -Debt instruments with maturitymore than 1 year
1. Cumulative2. Dividend Reinvestment/
Dividend PayoutÆ (Daily &Weekly Frequencies)
Dividend Reinvestment withdaily frequency.
Rs.5,000 (plus in multiples of Re. 1)
Rs. 500 & in multiples thereof
Nil
Investments made: (a) before July24, 06 - Nil (b) on or after July 24,2006 - 0.50% of the applicable NAV,if the redemption is made within onemonth from the date of investment.Investment made on or after March28, 2007 - 0.25% of the applicableNAV, if the redemption/switch-outis made within 10 days from the dateof investment.
Generally within 1 Business Day forspecified RBI locations andadditional 3 Business Days for Non-RBI locations
Rs. 500
3.00 p.m.3.00 p.m.
Monthly: Minimum Rs. 1,000 + 5post-dated cheques for a minimumof Rs. 1,000 each
*****
Minimum of Rs. 500 and multiplesof Re. 1/-
Available
1.00%0.50%
1.50%
Gilt - Treasury
Open-ended short-term Gilt Fund
Gilt Securities (incl. Treasury Bills).Average Maturity normally not toexceed 3 years.
1. Growth2. Growth-AEP3. Dividend (Quarterly & Half
Yearly)
Dividend Reinvestment withQuarterly frequency.
Rs.25,000 (plus in multiples of Re. 1)
Rs. 5,000 & in multiples thereof
Nil
Nil
Generally within 1 Business Day forspecified RBI locations andadditional 3 Business Days for Non-RBI locations
Rs. 5,000
3.00 p.m.3.00 p.m.
Not Available
Not Available
Available
0.75%0.35%
1.10%
Gilt - Investment
Open-ended medium-term Gilt Fund
Gilt Securities (incl. Treasury Bills).Average Maturity normally not toexceed 8 years.
1. Growth2. Growth-AEP3. DividendÆ (Half Yearly)
Dividend Reinvestment withHalf Yearly frequency.
Rs.25,000 (plus in multiples of Re. 1)
Rs. 5,000 & in multiples thereof
Nil
Nil
Generally within 1 Business Day forspecified RBI locations andadditional 3 Business Days for Non-RBI locations
Rs. 5,000
3.00 p.m.3.00 p.m.
Not Available
Not Available
Available
0.75%0.40%
1.15%
Gilt - TreasuryPF Option
Open-ended Gilt Fund
Gilt Securities (incl. Treasury Bills).Average Maturity normally not toexceed 3 years.
1. Growth2. Growth-AEP (Monthly,
Quarterly, Half Yearly & Yearly)
Cumulative option
Rs.25,000 (plus in multiples of Re. 1)
Rs. 5,000 & in multiples thereof
Nil
0.80% of applicable NAV in case theamount sought to be redeemed is notbeing invested under the Plan for aminimum period of 365 days. ExitLoad is NIL if the amount is investedfor more than 365 days.
Generally within 1 Business Day forspecified RBI locations andadditional 3 Business Days for Non-RBI locations
Rs. 5,000
3.00 p.m.3.00 p.m.
Not Available
Not Available
Not Available
2.25%
Gilt - InvestmentPF Option
Open-ended Gilt Fund
Gilt Securities (incl. Treasury Bills).Average Maturity normally not toexceed 8 years.
1. Growth2. Growth-AEP (Monthly,
Quarterly, Half Yearly & Yearly)
Cumulative option
Rs.25,000 (plus in multiples of Re. 1)
Rs. 5,000 & in multiples thereof
Nil
0.60% of applicable NAV in case theamount sought to be redeemed is notbeing invested under the Plan for aminimum period of 365 days.
Generally within 1 Business Day forspecified RBI locations andadditional 3 Business Days for Non-RBI locations
Rs. 5,000
3.00 p.m.3.00 p.m.
Not Available
Not Available
Not Available
1.10%

46
Key Features
Type
Investment Pattern(Under normal circumstances)
Options
Default OptionApplication Amount ###
Min. Addl. Investment ###
Entry Load*
Exit Load*$$$
Redemption Cheques Issued ##
Min. Redemption Amt.
Cut off time:Purchase/Switch inRedemption/Switch out $
Systematic Investment Plan(SIP)
Systematic Withdrawal Plan (SWP)Systematic Transfer Plan (STP)Recurring Expenses**Investment Mangmt. Exp.Other recurring expensesTotal
Long Term Plan
Open-ended Income Fund
Debt Instruments - 0% to 100% & MoneyMarket instruments - 0% to 10%
1. Cumulative2. Dividend (Weekly)
Dividend ReinvestmentRs. 5,000 (plus in multiples of Re.1)
Rs. 500/- & in multilples thereof
Nil
Nil
Generally within 1 Business Day forspecified RBI locations and additional 3Business Days for Non-RBI locations.Rs. 500/- provided that minimum balanceunder a particular folio should not fall be-low Rs. 5,000
3.00 p.m.3.00 p.m.Monthly: Minimum Rs. 1,000 + 5 post-datedcheques for a minimum of Rs. 1,000 each.
*****Minimum of Rs. 500 and in multiples of Re. 1/-Not Available
2.00%
Income Multiplier Fund –Regular Plan
An open-ended debt fund which investsupto 30% in equity.
Equity & Equity Related Securities0-30%, Debt instruments 65-100%, Cash &money market instruments 0-5%.
1. Cumulative2. Dividend (Monthly)
Dividend ReinvestmentRs.5,000 (plus in multiples of Re.1)
Rs.500 & in multiples thereof
Nil
(i) 1% - For investments of less than Rs. 5crores and if the investments are held forless than a period of 12 months; (ii) No ExitLoad for investments of Rs. 5 crores andabove.
Generally within 1 Business Day forspecified RBI locations and additional 3Business Days for Non-RBI locationsRs.500
3.00 p.m.3.00 p.m.Monthly: Minimum Rs. 1,000 + 5 post-datedcheques for a minimum of Rs. 1,000 each.
*****Minimum of Rs.500 and multiples of Re. 1/-Available $$
1.00%1.25%
2.25%
Monthly Income Plan
An open-ended fund. Monthly income isnot assured and is subject to the availabilityof distributable surplus.Debt securities, money market instru-ments, securitised debt & Cash upto 85%,Equity & Equity related securities upto 15%
1. Cumulative2. AEP (Appreciation & Regular)3. Dividend (Monthly, Quarterly & Half
Yearly)Dividend Reinvestment (Monthly)a) Cumulative : Rs.5,000b) Dividend & AEP : Rs. 25,000(plus multiples of Re 1)Rs.500 & in multiples thereof under eachoptionNil
For investment of less than or upto Rs.10lakhs: 0.5% if investment held for less thanor equal to a period of 6 months Forinvestment of above Rs.10 lakhs: Nil
Generally within 1 Business Day forspecified RBI locations and additional 3Business Days for Non-RBI locationsRs.500
3.00 p.m.3.00 p.m.Dividend & AEP Option – Monthly andCumulative (without AEP) Option –Monthly: Min. Rs. 1,000 + 5 post-dtd.cheques for a minimum of Rs. 1,000 each.
*****Minimum of Rs.500 and multiples of Re. 1/-Available $$
1.25%1.00%
2.25%
Child Care Plan - Study
Open-ended fund (Study Plan)
Equity and Equity related securities 0-15%,Debt Securities, Money MarketInstruments, Securitised Debt and Cash85-100%Cumulative Option
Cumulative OptionRs. 5,000/-, additional in multiples of Re.1
Rs. 1,000/- & in multiples thereof
1.50%
1.00% if investment is redeemed within 3years.Nil if investment is redeemed after 3years but before the Beneficiary Childattains the age of 18.
Normally Within 3 business days
Rs. 1,000
3.00 p.m.3.00 p.m.Monthy : Minimum Rs 1000 + 5 post datedcheques for a min of Rs. 1,000/- each.Entry Load: 1.50% of applicable NAVExit Load: 1.00% of applicale NAV ifinvestment is redeemed within 3 years fromthe date of allotment, Nil thereafter.Minimum of Rs.500 and multiples of Re. 1/-Available (from Study Plan to Gift Plan)
1.25%1.00%
2.25%
Funds at a glance
Key FeaturesType
Investment Pattern(Under normal circumstances)
OptionsDefault Option
Application Amount ###Min. Addl. Investment ###Max. Amount Investment per applicationEntry Load*
Exit Load*$$$
Redemption Cheques Issued ##
Min. Redemption Amt.Cut off time:
Purchase/Switch inRedemption/Switch out $
Systematic Investment Plan (SIP)
Systematic Withdrawal Plan (SWP)Systematic Transfer Plan (STP) $$
Recurring Expenses**Investment Mangmt. Exp.Other recurring expensesTotal
Child Care Plan - GiftOpen-ended fund (Gift Plan)
Equity & Equity related securities65% to 80%, Debt Securities, MoneyMarket Instruments, Securitised Debt &Cash - 20% to 35%.
Cumulative OptionCumulative Option
Rs. 5,000/-, additional in multiples of Re.1Rs.1,000/-Not Available1.50%
1.00% if investment is redeemed within 3years.Nil if investment is redeemed after 3years but before the Beneficiary Childattains the age of 18.
Normally Within 3 business days
Rs.1,000
3.00 p.m.3.00 p.m.Monthy : Minimum Rs 1000 + 5 post datedcheques for a min of Rs. 1,000/- each.Entry Load: 1.50% of applicable NAVExit Load: 1.00% of applicale NAV ifinvestment is redeemed within 3 years fromthe date of allotment, Nil thereafter.Minimum of Rs.500 and multiples of Re. 1/-
Not available
1.25%1.25%
2.50%
Balanced FundOpen-ended Balanced Fund
Equity and Equity related instruments –65% to 80% & Debt, Money Market andCash – 20% to 35%.
Growth & DividendDividend Reinvestment
Rs. 5,000 (plus in multiples of Re. 1)Rs. 500 & in multiples thereofNot Available(i) For investment of less than Rs.5Crores: 2.25% of applicable NAV;(ii) For investment of Rs.5 Crores &above: NILNil
Generally within 3 Business Days forspecified RBI locations and an additionalof 3 Business Days for Non RBI locationsRs. 500
3.00 p.m.3.00 p.m.Monthly: Minimum Rs. 1,000 + 5 post-datedcheques for a minimum of Rs. 1000 each
***
Minimum of Rs.500 and multiples of Re. 1/-
Available
1.25%1.25%
2.50%
Blended Plan - A @@Open ended fund investing in a blend ofequity, derivatives, debt and money marketinstruments.Equity and Equity Related securities – 65%-80%; Derivative including Index Futures,Stock Futures, Index Options and StockOptions etc. – 0%-80%; Money Market,Debt instruments, securitised debt –20%-35%.Growth & DividendOption - GrowthSub-option - ReinvestmentRs. 5,000 (plus in multiples of Re. 1)Rs. 1,000 & in multiples of Re.1/-Rs. 10 Crores per applicationNil
0.50%, if the investment is redeemedwithin a period of 30 days from the date ofallotment. Nil, if the investment is redeemedafter 30 days from the date of allotment.
Generally within 3 Business Days forspecified RBI locations and an additionalof 3 Business Days for Non RBI locationsRs. 500 and in multiples of Re.1/-
3.00 p.m.3.00 p.m.Not available
Not available
Not available
1.25%1.25%
2.50%
Blended Plan - B @@Open ended fund investing in a blend ofequity, derivatives, debt and money marketinstruments.Equity and Equity Related securities – 0%-49%; Derivative including Index Futures,Stock Futures, Index Options and StockOptions etc. – 0%-49%; Money Market,Debt instruments, securitised debt– 51%-100%.Growth & DividendOption - GrowthSub-option - ReinvestmentRs. 5,000 (plus in multiples of Re. 1)Rs. 1,000 & in multiples of Re.1/-Not AvailableNil
0.50%, if the investment is redeemed withina period of 30 days from the date ofallotment. Nil, if the investment is redeemedafter 30 days from the date of allotment.
Generally within 1 Business Day forspecified RBI locations and an additional of3 Business Days for Non RBI locationsRs. 500 and in multiples of Re.1/-
3.00 p.m.3.00 p.m.Not available
Not available
Not available
1.00%1.25%
2.25%
$$$ Where as a result of a redemption / switch arising out of excess holding by an investor beyond 25% of the net assets of the scheme in the manner envisaged under specified SEBIcirculars, such redemption / switch will not be subject to exit load. $$ The minimum amount that can be transferred from one scheme to another is Rs. 1000/- for a minimum of 6installments. The unitholder can avail the STP facility for a maximum period of 10 years.@@ Default option for ICICI Prudential Blended Plan is Plan B.Exit Load for fresh and additional purchases (including SIPs and STPs) made in the schemes given hereinbelow during September 15, 2006 to October 16, 2006, the following willbe applicable: • ICICI Prudential Power, ICICI Prudential Dynamic Plan, ICICI Prudential Discovery Plan, ICICI Prudential Balanced Fund – (i) 0.50% of the applicable NAV if the investment

47
Funds at a glanceKey Features
Type
Investment Pattern(Under normalcircumstances)
Options
Default Option
Application Amount ###
Min. Addl. Investment ###
Entry Load*
Exit Load* $$$
Redemption ChequesIssued ##
Min. Redemption Amt.
Cut off time:Purchase/Switch inRedemption/Switchout $
Systematic Invest-ment Plan (SIP)
Systematic With-drawal Plan (SWP)
Systematic TransferPlan (STP) $$
Recurring Expenses**Investment Mangmt. Exp.Other recurring expensesTotal
FMCG Fund
Open-ended FMCG Sectoral Fund
Equity and Equity relatedinstruments in FMCGCompanies upto 90% in &Debt, Money Market and Cashupto 10%
Growth & Dividend
Dividend Reinvestment
Rs. 5,000 (plus in multiples ofRe.1)
Rs. 500 & in multiples thereof
(i) For investment of lessthan Rs.5 Crores : 2.25% ofapplicable NAV;(ii) For investment of Rs.5Crores & above: NIL
Nil
Generally within 3 BusinessDays for specified RBIlocations and an additional of3 Business Days for Non RBIlocations
Rs. 500
3.00 p.m.3.00 p.m.
Monthly: Minimum Rs. 1,000+ 5 post-dated cheques for aminimum of Rs. 1000 each
***
Minimum of Rs.500 andmultiples of Re. 1/-
Available
1.25%1.25%
2.50%
Technology Fund
Open-ended Equity Fund
Equity and Equity relatedinstruments 90 to 95% &Debt, Money Market andCash 5 to 10%
Growth & Dividend
Dividend Reinvestment
Rs. 5,000 (plus in multiples ofRe.1)
Rs. 500 & in multiples thereof
(i) For investment of lessthan Rs.5 Crores : 2.25% ofapplicable NAV;(ii) For investment of Rs.5Crores & above: NIL
Nil
Generally within 3 BusinessDays for specified RBIlocations and an additionalof 3 Business Days for NonRBI locations
Rs. 500
3.00 p.m.3.00 p.m.
Monthly: Minimum Rs. 1,000+ 5 post-dated cheques for aminimum of Rs. 1000 each
***
Minimum of Rs.500 andmultiples of Re. 1/-
Available
1.25%1.25%
2.50%
Dynamic Plan
Open-ended Equity Fund
Equity and Equity relatedinstruments 0 to 100% &Debt, Money Market andCash 0 to 100%
Cumulative & Dividend
Dividend Reinvestment
Rs. 5,000 (plus in multiples ofRe.1)
Rs. 500 & in multiples thereof
(i) For investment of lessthan Rs.5 Crores: 2.25% ofapplicable NAV;(ii) For investment of Rs.5Crores & above: NIL
Nil
Generally within 3 BusinessDays for specified RBIlocations and an additionalof 3 Business Days for NonRBI locations
Rs. 500 and in multiplesthereof
3.00 p.m.3.00 p.m.
Monthly: Minimum Rs. 1,000+ 5 post-dated cheques for aminimum of Rs. 1000 each
***
Minimum of Rs.500 andmultiples of Re. 1/-
Available
1.00%1.50%
2.50%
Power
Open-ended Growth Fund
Equity and Equity relatedsecurities including nonconvertible portion ofconvertible debentures -Upto 95% and at least 5% inDebt and Money Marketsecurities.
Cumulative & Dividend
Dividend Reinvestment
Rs. 5,000 (plus in multiples ofRe.1)
Rs. 500 & in multiples thereof
(i) For investment of lessthan Rs.5 Crores: 2.25% ofapplicable NAV;(ii) For investment of Rs.5Crores & above: NIL
Nil
Generally within 3 BusinessDays for specified RBIlocations and an additionalof 3 Business Days for NonRBI locations
Rs. 500 and in multiplesthereof
3.00 p.m.3.00 p.m.
Monthly: Minimum Rs. 1,000+ 5 post-dated cheques for aminimum of Rs. 1000 each
***
Minimum of Rs.500 andmultiples of Re. 1/-
Available
1.25%1.25%
2.50%
Growth Plan
Open-ended Equity Fund
Equity and Equity relatedinstruments upto 95% & Debt,Money Market and Cash upto5%
Growth & Dividend
Dividend Reinvestment
Rs. 5,000 (plus in multiples ofRe.1)
Rs. 500 & in multiples thereof
(i) For investment of lessthan Rs.5 Crores: 2.25% ofapplicable NAV;(ii) For investment of Rs.5Crores & above: NIL
Nil
Generally within 3 BusinessDays for specified RBIlocations and an additional of3 Business Days for Non RBIlocations
Rs. 500
3.00 p.m.3.00 p.m.
Monthly: Minimum Rs. 1,000+ 5 post-dated cheques for aminimum of Rs. 1000 each
***
Minimum of Rs.500 andmultiples of Re. 1/-
Available
1.25%1.25%
2.50%
Tax Plan
Open-ended EquityLinked Saving Scheme
Equity and Equity relatedinstruments upto 90% & Debt,Money Market and Cash upto10%
Growth & Dividend
Dividend Reinvestment
Rs. 500 (plus in multiples ofRe. 1)
Rs. 500 & in multiples thereof
(i) For investment of lessthan Rs.5 Crores : 2.25% ofapplicable NAV;(ii) For investment of Rs.5Crores & above: NIL
Nil
Generally within 3 BusinessDays for specified RBIlocations and an additional of3 Business Days for Non RBIlocations after lock-in periodof 3 yrs.
Rs. 500
3.00 p.m.3.00 p.m.
Monthly: Minimum of Rs. 500or multiples thereof & 5 post-dated cheques for a minimum ofRs. 500 for a block of 5 months inadvance.
***
Not available
Available
1.25%1.25%
2.50%
is made for an amount of less than Rs. 5 crores and is invested for a period of six months or less than six months from the date of allotment. (ii) Nil for investment of Rs. 5 crores andabove. • ICICI Prudential Income Multiplier Plan – (i) 1.25% of the applicable NAV if the investment is made for an amount of less than Rs. 5 crores and is invested for a period of lessthan twelve months from the date of allotment. (ii) Nil for investment of Rs. 5 crores and above. • ICICI Prudential Monthly Income Plan – (i) 0.75% of the applicable NAV if the investmentis made for an amount of less than or equal to Rs. 10 Lakhs and is invested for a period of six months or less than six months from the date of allotment. (ii) Nil for investment of aboveRs. 10 Lakhs. • ICICI Prudential Child Care Plan Gift and Study Option – 1.25% of the applicable NAV if invested for a period of three years or less than three years from the date ofallotment.

48
Key Features
Type
Investment Pattern(Under normalcircumstances)
Options
Default Option
Application Amount ###
Min. Addl. Investment ###
Entry Load*
Exit Load* $$$
Redemption ChequesIssued ##
Min. Redemption Amt.
Cut off time:Purchase/Switch inRedemption/Switch out $
Systematic InvestmentPlan (SIP)
Systematic WithdrawalPlan (SWP)
Systematic TransferPlan (STP) $$
Recurring Expenses**Investment Mangmt. Exp.Other recurring expensesTotal
SPIcE
An open-ended,exchange listed, indexlinked growth scheme
Securities comprisingthe SENSEX upto 100%& Upto 10% in Moneymarket instruments,convertible bonds &other securitiesincluding cash
–
–
One Unit (One unit =SENSEX/100)
One Unit (One unit =SENSEX/100)
Nil
NIL (In case there areno quotes on the BSE/DSE for five tradingdays consecutively, aninvestor can selldirectly to the fund atan exit load of 2.5% ofNAV)
Within 3 buisness days
One Unit (One unit =SENSEX/100)
3.00 p.m. during StockExchange WorkingHours
Not Available
Not Available
Not Available
1.00%
Index Fund
Open-ended Index LinkedGrowth Scheme
Equity stocks drawn from thecomponents of the S&P CNXNifty and the exchangetraded derivatives on the S&PCNX Nifty – upto 100%.Money Market instruments– upto 10%
Cumualtive
–
Rs.5,000 (plus multiples of Rs1000)
Rs.1000/-
1.00% of applicable NAV
Nil
Within 3 Business Days
Rs.1000
3.00 p.m.3.00 p.m.
Monthly/Quarterly: Mini-mum Rs.1,000/- + 5 post-datedcheques of Rs. 1,000/- each.Entry Load: Nil; Exit Load:0.5% of the applicable NAV,if the investment is redeemedwithin 1 year from the dateof allotment, Nil thereafter.
Minimum of Rs.1000 andmultiples of Re. 1/-
Available
0.70%0.55%
1.25%
Discovery Fund
Open-ended Equity Fund
Equity and Equity relatedsecurities - 80% to 100%and Cash & Money Mar-ket instruments - 0% to20%
Growth & Dividend
DividendReinvestment
Rs. 5,000 (plus inmultiples of Re.1)
Rs. 500 & in multiplesthereof
(1) For investment ofless than Rs. 5 Crores:Entry load at 2.25% ofapplicable Net Asset Value(NAV);(2) For investment ofRs.5 Crores and above:Entry load is Nil.
Nil
Within 3 Business Daysfor specified RBI loca-tions and an additional of3 Business Days for Non-RBI locations.
Rs.500
3.00 p.m.3.00 p.m.
Monthly: MinimumRs.1,000 + 5 post-datedcheques of Rs. 1,000each
***
Minimum of Rs.500 andmultiples of Re. 1/-
Available
1.25%1.25%
2.50%
Emerging S.T.A.R. (StocksTargeted At Returns)
Fund
Open-ended Equity Fund
Equity and Equity Linked Instruments -90% to 100% and Debt Securities, Cash& Money Market instruments - 0% to10%
Growth & Dividend
Dividend Reinvestment
Rs. 5,000 (plus in multiples of Re.1)
Rs. 500 & in multiples thereof
(1) For investment of less than Rs. 5Crores: Entry load at 2.25% of applicableNet Asset Value (NAV);(2) For investment of Rs.5 Crores andabove: Entry load is Nil.
The exit load structure for fresh andadditional purchases for amounts lessthan Rs. 5 crores (including switch-insfrom open ended debt schemes) madeby unitholders during the period May 1,2006 to May 31, 2006 will be – (i) 0.5%of the applicable NAV, if the amountsought to be redeemed or switched outis invested for a period of six months orless than six months from the date ofallotment; (ii) Nil, if the amount soughtto be redeemed or switched out isinvested for a period of more than sixmonths from the date of allotment. Thisload structure will be applicable onlyfor the purchases (including switch-insfrom open ended debt schemes) madeduring the period May 1, 2006 to May31, 2006. For all other purchases madeeither before May 1, 2006 or after May31, 2006 no exit load will be charged onthe redemptions or switch-outs made.
Within 3 Business Days from the dateof acceptance of Redemption requestat any of the Customer ServiceCentres.
Rs.500
3.00 p.m.3.00 p.m.
Monthly: Minimum Rs. 1,000 + 5 post-dated cheques of Rs. 1,000 each
***
Minimum of Rs.500 and multiples ofRe. 1/-
Available
2.50%
Infrastructure Fund
Open-ended Equity Fund
Equity and Equity relatedinstruments in Infrastructuresector 70% to 100% & debt,money market instrument -0% to 30%
Growth & Dividend
Dividend Reinvestment
Rs. 5,000 (plus in multiples ofRe.1)
Rs. 500 & in multiples thereof
(i) For all purchases of lessthan Rs. 5 Crore perTransaction: 2.25% ofapplicable NAV;(ii) For purchases of Rs.5Crore & above perTransaction : NIL
1) For investment madebefore 28-Nov-05:A) 1% of applicable NAV
if i) Amount originallyinvested per transactionis less than Rs.5 croresand Redemption madebefore completion of 6months from the date ofallotment of units.
B) Nil – if i) Originalinvestment is 5 crores ormore per transaction.Or ii) RedemptionRequest made on/after 6months from date ofallotment irrespective oforiginal investment.
2) Nil for investments madeon or after 28-Nov-05.
Generally within 3 Business Daysfor specified RBI locations andan additional of 3 Business Daysfor Non-RBI locations
Rs. 500
3.00 p.m.3.00 p.m.
Monthly: Minimum Rs. 1,000 +5 post-dated cheques for aminimum of Rs. 1000 each
***
Minimum of Rs.500 and multiplesof Re. 1/-
Available
1.25%1.25%2.50%
Services IndustriesFund
Open-ended Equity Fund
Equity and equity relatedinstruments in services sector70% to 100% & debt, moneymarket instruments - 0% to 30%
Growth & Dividend payout& Dividend Reinvestment
Dividend Reinvestment
Rs. 5000 per application and inmultiples of Re.1 thereafter
Rs. 500 per application and inmultiples of Re.1 thereafter
(i) For all purchases of lessthan Rs. 5 crore pertransaction:2.25% ofapplicable NAV;(ii) For all purchases of morethan Rs. 5 crore & above pertransaction:NIL
For investment made duringNew Fund Offer (NFO) Period:(i) 1% of applicable NAV ifamount originally invested pertransaction is less than Rs. 5crores and redemption madebefore completion of 6 monthsfrom the date of allotment.(ii) Nil if (a) Original investmentis 5 crores or more pertransaction and the redemptionrequest is made within 6 monthsor beyond; or (b) RedemptionRequest is made on/after 6months from the date ofallotment irrespective of anyamount invested.For investment made afterNFO Period: Nil
Generally within 3 business daysfor specified RBI locations andan additional 3 Business days forNon-RBI locations
Rs 500 and in multiples thereof
3.00 p.m.3.00 p.m.
Monthly:Minimum Rs. 1000 + 5Installment for a minimum of Rs.1000 each and in multiples of Re.1 thereafter
***
Available
Available
1.25%1.25%
2.50%
Funds at a glance
The exit load structure will also be applicable for switch-ins to any of the above schemes from the following open-ended debt schemes alone: (a) ICICI Prudential Liquid Plan (b) ICICIPrudential Floating Rate Plan (c) ICICI Prudential Sweep Plan - Cash Option. There will be no change in the exit load structure for all purchases, SIPs, STPs, Switch-ins madeeither before September 15, 2006 or after October 16, 2006.

49
Funds at a glanceKey Features
Type
Investment Pattern(Under normal circumstances)
Options
Default Option
Sub-Options
Default Sub-Options
Min. Application Amount ###
Min. Addl. Investment ###
Entry Load*
Exit Load* $$$
Redemption Cheques Issued ##
Min. Redemption Amt.
Cut off time:Purchase/Switch inRedemption/Switch out $
Systematic InvestmentPlan (SIP)
Systematic Withdrawal Plan (SWP)
Systematic Transfer Plan (STP) $$
Recurring Expenses**Investment Mangmt. Exp.Other recurring expensesTotal
Equity & Derivatives FundIncome Optimiser Plan
Open-ended Equity Fund
65% to 80% in Equity and Equity Derivatives (equity unhedgedexposure limited to 5%), 20% to 35% in Debt instruments.
Retail Option and Institutional Option
Retail Option
Growth and Dividend with dividend payout and dividendreinvestment facilities.
Dividend Reinvestment
Retail Option: Rs.5,000 (plus in multiples of Re.1)Institutional Option: Rs.5 crores (plus in multiples of Re.1)
Rs.1,000/- (plus in multiples of Re.1/-)
Nil
i) 0.5% of the applicable NAV, if the investment is redeemedwithin a period of 6 months from the date of allotment.
ii) Nil – if the investment is redeemed after 6 months fromthe date of allotment.
Within 10 Business Days from the date of acceptance of atransaction request.
Rs. 500/-
3.00 p.m.3.00 p.m.
Retail Option (Monthly): Minimum Rs. 1,000 + 5 post-datedcheques for a minimum of Rs. 1000 each.Entry load for SIP & STP investments: NilExit load for SIP & STP investments:i) 0.5% of the applicable NAV, if the investment is redeemed
within a period of 6 months from the date of allotment.ii) Nil – if the investment is redeemed after 6 months from
the date of allotment.
Retail Option: Rs.500 and in multiples of Re. 1/- providedminimum balance should not fall below Rs.5000/-.
Available
1.25%1.25%2.50%
Equity & Derivatives FundWealth Optimiser Plan
Open-ended Equity Fund
65% to 100% in Equity and Equity Derivatives (equityunhedged exposure limited to 80%), 0% to 35% in Debtinstruments.
Regular Option
–
Growth and Dividend with dividend payout and dividendreinvestment facilities.
Dividend Reinvestment
Regular Option: Rs.5,000 (plus in multiples of Re.1)
Rs.1,000/- (plus in multiples of Re.1/-)
i) 2.25% of the applicable NAV, if the investment amountis less than Rs.5 crores
ii) Nil – for investment of Rs.5 crores and above.
i) 0.50% of the applicable NAV if redemption/switchouts ismade within 6 months from the date of investment.
ii) Nil for investment of Rs.5 crores and above and redeemedany time.
Within 10 Business Days from the date of acceptance of atransaction request.
Rs 500/-
3.00 p.m.3.00 p.m.
Regular Option (Monthly): Minimum Rs. 1000 + 5 post datedcheques for a minimum of Rs. 1000 each.Entry load for SIP & STP investments:i) 2.25% of the applicable NAV, if the investment amount is
less than Rs.5 crores.ii) Nil – if the iinvestment amount is Rs.5 crores or moreExit load for SIP & STP investments : Nil
Regular Option: Rs.500 and in multiples of Re. 1/- providedminimum balance should not fall below Rs.5000/-.
Available
1.25%1.25%2.50%
Statutory Details: ICICI Prudential Mutual Fund (erstwhile Prudential ICICI Mutual Fund) (the Fund) was set up as a Trust sponsored by Prudential plc (through its wholly owned subsidiary namely Prudential Corporation HoldingsLtd) and ICICI Bank Ltd. ICICI Prudential Trust Limited (erstwhile Prudential ICICI Trust Limited ) (Trust company) is the Trustee to the Fund and ICICI Prudential Asset Management Company Ltd. (erstwhile Prudential ICICI AssetManagement Company Limited) (AMC) is the Investment Manager to the Fund. ICICI Bank Ltd (ICICI Bank) and Prudential Plc (acting through its wholly owned subsidiary namely Prudential Corporation Holdings Ltd) are thepromoters of the AMC and the Trust Company. ICICI Bank currently holds 51% stake in both the companies and the balance 49% stake in both the companies is held by Prudential plc (acting through its wholly owned subsidiarynamely Prudential Holdings Corporation Ltd). Prudential Plc (acting through its wholly owned subsidiary namely Prudential Corporation Holdings Ltd) transferred 6% of its shareholding in both the companies to ICICI Bank w.e.f26th August 2005.Subsequently in accordance with the approval granted by the Board of Directors and the shareholders of the AMC and the Trust Company the name of the AMC has been changed to ICICI Prudential AssetManagement Company Limited and the name of the Trust Company has been changed to ICICI Prudential Trust Limited. SEBI has vide its letter no IMD/PM/84968/07 dated January 23, 2007 conveyed its no objection to the saidchange of names of the AMC & the Trust company. The said change of names has also been approved by the Registrar of Companies, NCT of Delhi & Haryana, Ministry of Company Affairs, Govt of India. The Board of Directorsof the Trust company have at their meeting held on 20th February 2007 accorded approval for the change of name of the Mutual Fund to ICICI Prudential Mutual Fund as well as of the various schemes /plans/options there under.SEBI has vide its Letter Nos IMD/PM/90168/07 & IMD/PM/90170/07 dated 2nd April 2007 accorded approval for the same. Risk Factors: Mutual Funds and securities investments are subject to market risks and there is no assuranceor guarantee that the objectives of the Schemes will be achieved. As with any securities investment, the NAV of the Units issued under the Schemes can go up or down, depending on the factors and forces affecting the capitalmarkets. Past performance of the Sponsors, AMC/Fund does not indicate the future performance of the Schemes of the Fund. The Sponsors are not responsible or liable for any loss resulting from the operation of the Schemes beyondthe contribution of an amount of Rs.22.2 lacs, collectively made by them towards setting up the Fund and such other accretions and additions to the corpus set up by the Sponsors. • ICICI Prudential Growth Plan^ (An open-ended equity fund. Objective is to generate long term capital appreciation), Entry Load: **, Exit Load: Nil; ICICI Prudential Income Plan (An open-ended Debt Fund. Objective is to generate income through investments indebt securities), Entry Load: Nil, Exit Load: For investment of less than or upto Rs. 10 Lakhs : 0.50% of applicable Net Asset Value (NAV) if the investment held for less than or equal to a period of 6 months; For investment of aboveRs. 10 Lakhs: Nil; ICICI Prudential Liquid Plan (An open-ended Liquid Income Fund. Objective is to generate reasonable returns while providing high levels of liquidity), Entry Load: Nil, Exit Load: Nil; ICICI Prudential FMCGFund^ (An open-ended FMCG Sectoral Fund. Objective is to generate long term capital appreciation through investments primarily in FMCG sector), Entry Load: **, Exit Load: Nil; ICICI Prudential Tax Plan^ (An open-endedEquity Linked Saving Scheme. Objective is to generate long term capital appreciation), Entry Load: **, Exit Load: Nil; ICICI Prudential Gilt Fund - Treasury Plan (An open-ended short-term Gilt Fund. Objective is to generateregular returns through investments made in gilts), Entry Load: Nil, Exit Load: Nil; ICICI Prudential Gilt Fund - Investment Plan (An open-ended medium-term Gilt Fund. Objective is to generate regular returns throughinvestments made in gilts), Entry Load: Nil, Exit Load: Nil; ICICI Prudential Balanced Fund^ (An open-ended Balanced Fund. Objective is to generate long term capital appreciation and current income), Entry Load: **, ExitLoad: Nil; ICICI Prudential Technology Fund^ (An open-ended Equity Fund. Objective is to generate long term capital appreciation), Entry Load: **, Exit Load: Nil; ICICI Prudential Monthly Income Plan (An open endedfund. Monthly income is not assured and is subject to the availability of distributable surplus) (Objective is to generate regular income through investments in fixed income securities), Entry Load: Nil, Exit Load: Forinvestment of less than or upto Rs. 10 Lakhs : 0.50% of applicable Net Asset Value (NAV) if the investment held for less than or equal to a period of 6 months; For investment of above Rs. 10 Lakhs : Nil; ICICI Prudential FixedMaturity Plan – Series 30 - 13 Months Plan (A close-ended Debt Fund. Objective is to generate regular returns by investing in a portfolio of fixed income securities/debt instruments normally maturing in line with the timeprofile of the Scheme), Entry Load: Nil, Exit Load: Nil - for redemptions made on Maturity, 2% of the applicable NAV for redemptions made during repurchase facility period; ICICI Prudential Hybrid Fixed Maturity Plan -13 months Plan (A close-ended Income Fund. The primary objective of the Scheme is to seek to generate regular returns by investing in a portfolio of fixed income securities/ debt instruments normally maturing in line with thetime profile of the Plan. The secondary objective of the Scheme is to generate long-term capital appreciation by investing a portion of the Scheme's assets in equity and equity related instruments), Entry Load: Nil, Exit Load: Nil- for redemptions made on Maturity, 2% of the applicable NAV for redemptions made during repurchase facility period; ICICI Prudential Fixed Maturity Plan – Series 34 - One Year Plan A, One Year Plan B, FifteenMonths Plan, Sixteen Months Plan, Seventeen Months Plan & Eighteen Months Plan (A close-ended Debt Fund. Objective of the Plan under the Scheme is seeking to generate regular returns by investing in a portfolioof fixed income securities/ debt instruments normally maturing in line with the time profile of the Plan.), Entry Load: Nil, Exit Load: Nil - for redemptions made on Maturity, 2% of the applicable NAV for redemptions made during
Statutory Details & Risk Factors
Contd...

repurchase facility period; ICICI Prudential Fixed Maturity Plan - Series 35 – Thirteen Months Plan A & Thirteen Months Plan B, One Year Plan (A close-ended Debt Fund. Objective of the Plan under the Schemeis seeking to generate regular returns by investing in a portfolio of fixed income securities/debt instruments normally maturing in line with the time profile of the Plan. Entry Load: Nil, Exit Load: Nil - for redemptions madeon Maturity, 2% of the applicable NAV for redemptions made during repurchase facility period); ICICI Prudential Fixed Maturity Plan - Series 37 – Fourteen Months Plan, One Year Plan - A (A close-ended Debt Fund.Objective of the Plan under the Scheme is seeking to generate regular returns by investing in a portfolio of fixed income securities/ debt instruments normally maturing in line with the time profile of the Plan. Entry Load:Nil, Exit Load: Nil - for redemptions made on Maturity, 2% of the applicable NAV for redemptions made during repurchase facility period); ICICI Prudential Fixed Maturity Plan - Series 37 – Three Months Plan A & ThreeMonths Plan B (A close-ended Debt Fund. Objective of the Plan under the Scheme is seeking to generate regular returns by investing in a portfolio of fixed income securities/ debt instruments normally maturing in linewith the time profile of the Plan. Entry Load: Nil, Exit Load: Nil - for redemptions made on Maturity, 1% of the applicable NAV for redemptions made during repurchase facility period); ICICI Prudential Fixed Maturity Plan- Series 37 – Three Months Plus Plan A (A close-ended Debt Fund. Objective of the Plan under the Scheme is seeking to generate regular returns by investing in a portfolio of fixed income securities/ debt instrumentsnormally maturing in line with the time profile of the Plan. Entry Load: Nil, Exit Load: Nil - for redemptions made on Maturity, 1% of the applicable NAV for redemptions made during repurchase facility period); ICICI PrudentialFixed Maturity Plan - Series 34 – Six Months Plan (A close-ended Debt Fund. Objective of the Plan under the Scheme is seeking to generate regular returns by investing in a portfolio of fixed income securities/ debtinstruments normally maturing in line with the time profile of the Plan. Entry Load: Nil, Exit Load: Nil - for redemptions made on Maturity, 1% of the applicable NAV for redemptions made during repurchase facility period);ICICI Prudential Fixed Maturity Plan - Series 38 –Three Months Plan A, Three Months Plan B & Three Months Plan C – (A close-ended Debt Fund. Objective of the Plan under the Scheme is seeking to generateregular returns by investing in a portfolio of fixed income securities/ debt instruments normally maturing in line with the time profile of the Plan), Entry Load: Nil, Exit Load: Nil - for redemptions made on Maturity, 1% of the applicableNAV for redemptions made during repurchase facility period; ICICI Prudential Fixed Maturity Plan - Series 38 –One Year Plan A – (A close-ended Debt Fund. Objective of the Plan under the Scheme is seeking to generateregular returns by investing in a portfolio of fixed income securities/ debt instruments normally maturing in line with the time profile of the Plan), Entry Load: Nil, Exit Load: Nil - for redemptions made on Maturity, 2% of the applicableNAV for redemptions made during repurchase facility period; ICICI Prudential Child Care Plan (Study Plan: An open-ended fund. Objective is to generate income by creating a portfolio that is invested in debt, money marketinstruments and equity and equity related securities. Gift Plan: An open-ended Fund. Objective is to generate capital appreciation by creating a portfolio that is invested in equity and equity related securities and debt and moneymarket instruments), Entry Load for both the plans are 1.50%. The Exit Load for both the Plans are 1%, if investment is redeemed within 3 years. (2) Nil, if investment is redeemed after 3 years but before the Unitholder attainsthe age of 18; ICICI Prudential Power^ (An open-ended Growth Fund. Objective is to generate long term capital appreciation through investments in core sectors & associated feeder industries), Entry Load: **, Exit Load:Nil; ICICI Prudential Short Term Plan (An open-ended Income Fund. Objective is to generate Income through investments in debt securities) Entry Load: Nil, Exit Load: Nil; ICICI Prudential Long Term Plan (An open-endedIncome Fund. Objective is to generate income through investment in range of debt and money market instruments while maintaining optimum balance of yield, safety and liquidity), Entry Load: Nil, Exit Load: Nil; ICICI PrudentialSweep Plan (An open-ended Liquid Fund. Objective is to provide reasonable returns, commensurate with low risk while providing a high level of liquidity, through investments made primarily in money market and debt securities),Entry Load: Nil, Exit Load: Nil; ICICI Prudential Index Fund (An open-ended index linked Growth Scheme. Objective is track the returns of S&P CNX Nifty Index through investment in stocks drawn from constituents of Nifty),Entry Load: 1% of the Applicable NAV, Exit Load: NI; ICICI Prudential Flexible Income Plan (An open-ended Income Fund. Objective is to generate income through investments in a range of debt instruments and money marketinstruments of various maturities with a view to maximising income while maintaining the optimum balance of yield, safety and liquidity) Entry Load: Nil, Exit Load: Investments made: (a) before July 24, 06 - Nil (b) on or afterJuly 24, 2006 - 0.50% of the applicable NAV, if the redemption is made within one month from the date of investment. Investment made on or after March 28, 2007 - 0.25% of the applicable NAV, if the redemption/switch-out is made within 10 days from the date of investment; ICICI Prudential Dynamic Plan^ (An open-ended Equity Fund. Objective is to generate capital appreciation by actively investing in equity and equity related securitiesand for defensive consideration in debt / money market instruments), Entry Load: **, Exit Load: Nil; SENSEX Prudential ICICI Exchange Traded Fund (“SPIcE”) (An open-ended exchange listed, index linked growth scheme.Objective is to provide the investment returns that closely corresponds to the total return of securities as represented by the SENSEX). Entry Load: Nil, Exit Load: 2.5% of applicable NAV in case of no quotes on the BSE for fivetrading days consecutively and an investor redeeming directly from the Fund; ICICI Prudential Floating Rate Plan – Option A, B, C & D (An open-ended income fund. Objective is to generate income consistent with the prudentrisk from a portfolio comprising substantially of floating rate debt instruments, fixed rate debt instruments swapped for floating rate return, and also fixed rate instruments and money market instruments) Entry Load : Nil, ExitLoad: For all investments made on or after April 24, 2007, an exit load of 0.25% of the applicable NAV if the redumption/switch-out is made within 10 days from the date of investment. ICICI Prudential Advisor Series(An open-ended asset allocation fund, which is of the nature of Fund of Funds, comprising there under five investment Plans, with a primary objective to generate returns through investment in underlying schemes of ICICI PrudentialMutual Fund) Entry Load: For ICICI Prudential Very Cautious Plan and ICICI Prudential Cautious Plan is Nil and for ICICI Prudential Moderate Plan, ICICI Prudential Aggressive Plan and ICICI Prudential Very Aggressive Plan, theEntry Load is 1%, 1.50% and 1.75% respectively, Exit Load: Nil, Further, for investments by the Fund of Funds scheme, in underlying schemes of ICICI Prudential Mutual Fund, there would not be any entry load / exit load. ICICIPrudential Gilt Fund Investment Plan - PF Option (An open-ended Medium Term Gilt Fund. Objective is to generate income through investments in Gilts of various maturities) Entry Load: Nil, Exit load : 0.60% of a NAVin case the amount sought to be redeemed is not being invested under the Plan for a minimum period of 365 days, ICICI Prudential Gilt Fund Treasury - PF Option (An open-ended Gilt Fund. Objective is to generate incomethrough investments in Gilts of various maturities) Entry Load: Nil, Exit load: 0.80% of a NAV in case the amount sought to be redeemed is not being invested under the Plan for a minimum period of 365 day; ICICI PrudentialIncome Multiplier Fund (An open-ended debt fund which invests upto 30% in equity. Objective is to generate long-term capital appreciation from a portfolio that is invested predominantly in debt and money market securitiesand the balance in equity and equity related securities) Entry Load: Nil, Exit Load: (i) 1% - For investments of less than Rs. 5 crores and if the investments are held for less than a period of 12 months; (ii) No Exit Load for investmentsof Rs. 5 crores and above; ICICI Prudential Discovery Fund^ (An open-ended Equity Fund. Objective is to generate returns through a combination of dividend income and capital appreciation by investing primarily in a well-diversified portfolio of value stocks) Entry Load: **, Exit Load: Nil; ICICI Prudential Long Term Floating Rate Plan – Option A, B & C (An open-ended Income Fund. Objective is to generate income through investmentsin a range of debt and money market instruments of various maturities with a view to maximizing income while maintaining the optimum balance of yield, safety and liquidity) Entry Load : Nil, Exit Load : Nil for Options B andC and for Option A - 0.50% for investments of less than or equal to Rs. 1 Crore and redemption is made on or before the completion of six months from the date of allotment of units; ICICI Prudential Emerging S.T.A.R. (StocksTargeted At Returns) Fund^ (An open-ended Equity Fund. Primary objective is to generate capital appreciation by actively investing in diversified mid cap stocks. The scheme will invest primarily in companies that have a marketcapitalisation between 100 crores and 2000 crores.) Entry Load: **, Exit Load: The exit load structure for fresh and additional purchases for amounts less than Rs. 5 crores (including switch-ins from open ended debt schemes)made by unitholders during the period May 1, 2006 to May 31, 2006 will be – (i) 0.5% of the applicable NAV, if the amount sought to be redeemed or switched out is invested for a period of six months or less than six months fromthe date of allotment; (ii) Nil, if the amount sought to be redeemed or switched out is invested for a period of more than six months from the date of allotment. This load structure will be applicable only for the purchases (includingswitch-ins from open ended debt schemes) made during the period May 1, 2006 to May 31, 2006. For all other purchases made either before May 1, 2006 or after May 31, 2006 no exit load will be charged on the redemptions orswitch-outs made; ICICI Prudential Blended Plan (An open ended fund investing in a blend of equity, derivatives, debt and money market instruments under two Plans viz. Plan A and Plan B. Objective of Plan A under the schemeis to provide capital appreciation and income distribution to unitholders by investing in equity & equity related securities including derivatives and the balance portion in debt securities. Objective of Plan B under the scheme isto provide capital appreciation and income distribution to unitholders by investing predominantly in debt securities and the balance portion in equity & equity related securities including derivatives. Entry Load: Nil. Exit Load: Underboth the Plans viz., Plan A and Plan B, in case the amount sought to be redeemed is not invested by the investor for a period of 30 days from the date of allotment, an exit load @ 0.50% of applicable NAV will be imposed.); ICICIPrudential Infrastructure Fund^ (An open-ended equity scheme. Objective is to generate capital appreciation and income distribution to unitholders by investing predominantly in equity/equity related securities of thecompanies belonging to the infrastructure industries and balance in debt securities and money market instruments including call money), Entry Load: For all purchases of less than Rs.5 crore per transaction - 2.25% of applicableNAV, For Purchases of Rs.5 crores and above per transaction - Nil, Exit Load: For Investments made before November 28, 2005 - (i) If the amount originally invested per transaction is less than Rs. 5 crores and the redemptionrequest is made before completion of 6 months from the date of allotment of units - 1.00%, (ii) If the amount originally invested per transaction is Rs. 5 crores or more and whether the redemption is sought within 6 months orbeyond; or Any amount invested, for which the redemption request is made on or after the completion of 6 months from the date of allotment of units - No exit load; For investments made from November 28, 2005 onwards: Noexit load will be charged for investments made under the Scheme on or after November 28, 2005 irrespective of the amount invested; ICICI Prudential Services Industries Fund (PISIF)^ (An open-ended equity Scheme.Objective: to generate capital appreciation and income distribution to unitholders by investing predominantly in equity/equity related securities of the companies belonging to the service industry and balance in debt securitiesand money market instruments including call money), Entry Load: For all purchases of less than Rs.5 crore per transaction - 2.25% of applicable NAV, For Purchases of Rs. 5 crores and above per transaction - Nil; Exit Load: ForInvestments made during the New Fund Offering period: (i) 1% - If the amount originally invested per transaction is less than Rs. 5 crores and the redemption request is made before completion of 6 months from the date of allotmentof units. (ii) Nil - If the amount originally invested per transaction is Rs. 5 crores or more and whether the redemption is sought within 6 months or beyond; or Any amount invested, for which the redemption request is made onor after the completion of 6 months from the date of allotment of units. For investments made after New Fund Offer: Nil; ICICI Prudential Fusion Fund (A close-ended diversified equity scheme, with a maturity period of 5years, that seeks to generate long-term capital appreciation by investing predominantly in equity and equity related instruments of companies across large, mid and small market capitalization. Entry Load: Nil, Exit Load: For theredemptions made before the maturity date of the Scheme i.e. redemptions made during the repurchase facility period, the following exit load structure will be applicable: (i) 5% of the applicable NAV, if the amount sought tobe redeemed is invested for a period of one year or less than one year from the date of allotment; (ii) 4% of the applicable NAV, if the amount sought to be redeemed is invested for a period more than one year but less than orequal to two years from the date of allotment; (iii) 3% of the applicable NAV, if the amount sought to be redeemed is invested for a period of more than two years but less than or equal to three years from the date of allotment;(iv) 2% of the applicable NAV, if the amount sought to be redeemed is invested for a period of more than three years but less than or equal to four years from the date of allotment; (v) 1% of the applicable NAV, if the amountsought to be redeemed is invested for a period of more than four years from the date of allotment but redeemed before the date of maturity of the Scheme; ICICI Prudential Equity & Derivatives Fund – Income OptimiserPlan [An open-ended equity fund. Objective is to seek to generate low volatility returns by using arbitrage and other derivative strategies in equity markets and investments in short-term debt portfolio. Entry Load (inluding SIP/STP investments): Nil, Exit Load (inluding SIP/STP investments w.e.f. 5/01/07): (i) 0.5% of the applicable NAV, if the investment is redeemed within a period of 6 months from the date of allotment. (ii) Nil – if the investment is redeemedafter 6 months from the date of allotment]; ICICI Prudential Equity & Derivatives Fund – Wealth Optimiser Plan [An open-ended equity fund. Objective is to seek to provide capital appreciation and income distribution tothe investors by using equity derivatives strategies, arbitrage opportunities and pure equity investments. Entry Load (inluding SIP/STP investments): (i) 2.25% of the applicable NAV, if the investment amount is less than Rs.5 crores.(ii) Nil – for investment of Rs.5 crores and above. Exit Load: 0.5% of the applicable NAV, if the redemption/switch-out is made within 6 months from the date of investment, Nil for the investment of Rs.5 crores and above and redeemedat any time (Exit Load for SIP/STP investment is Nil)]; ICICI Prudential Fusion Fund Series – II [A close-ended diversified equity Scheme, with a maturity period of 3 years, that seeks to generate long-term capitalappreciation by investing predominantly in equity and equity related instruments of companies across large, mid and small market capitalization. Asset Allocation Pattern: Equity & equity related securities – 70% to 100%,Debt & Money Market Instruments* (including cash and cash equivalent) – 0 to 30%]. Entry Load: Nil, Exit Load: No exit load will be charged. However, being a close-ended Scheme, for redemptions made before theMaturity Date of the Scheme, i.e. redemptions made during the repurchase facility period, the AMC will redeem the units after recovering the balance proportionate unamortized new fund offer expenses in accordancewith SEBI Circular dated April 4, 2006. These are the names of the Schemes and do not in any manner indicate either the quality of the Schemes or their future prospects and returns. ** Entry Load for all the Equity Funds:(i) For investment of less than Rs.5 crores is 2.25% of applicable NAV; (ii) For investment of Rs.5 crores and above is Nil. No entry load will be payable in respect of switch transaction from one equity scheme of ICICI Prudentialto another equity scheme of ICICI Prudential. Further, for investments by a Fund of Funds Scheme(s) in various schemes of ICICI Prudential Mutual Fund, there would not be any entry load / exit load charged by the underlying schemes.^ For SIP & STP Investments: Entry load of 2.25% of the applicable NAV will be charged on the amount invested under the scheme(s). Exit Load: Nil.Exceptions: With effect from June 4, 2007, all new applications through the SIP & STP facility under Discovery Fund, Dynamic Plan, Emerging STAR Fund, Growth Plan, Power, Services Industries Fund andInfrastructure Fund, an exit load at the rate of 0.25% of the applicable NAV will be charged if the redemption/switch-out from the Schemes is made within 6 months from the date of allotment of units.For all investments below Rs. 5 crores made under Power and Services Industries Fund (excluding investments made through SIP and STP facility) from June 18, 2007, an exit load at the rate of 0.50% of the applicableNAV will be charged if redemption/switch-out of the investment is made within 6 months from the date of allotment of units.Load Structure on SIP & STP investments under the following schemes are as follows: • ICICI Prudential Child Care Plan (Gift Plan & Study Plan) – Entry Load: 1.50% of applicable NAV. Exit Load: 1.00%of Applicable NAV if the investment is redeemed within 3 years from the date of allotment, Nil thereafter • ICICI Prudential Moderate Plan – Entry Load: 1% of applicable NAV; Exit Load: Nil • ICICI Prudential AggressivePlan – Entry Load: 1% of applicable NAV; Exit Load: 0.5% of the applicable NAV, if the units are redeemed before completion of 2 years from the date of allotment • ICICI Prudential Very Aggressive Plan – Entry Load:1% of applicable NAV; Exit Load: 0.75% of the applicable NAV, if the units are redeemed before completion of 2 years from the date of allotment • ICICI Prudential Index Fund – Entry Load: Nil; Exit Load: 0.5% of theapplicable NAV, if the investment is redeemed within 1 year from the date of allotment, Nil thereafter • No entry or exit load will be charged on the SIP investments under ICICI Prudential Flexible Income Plan, ICICI PrudentialLong Term Plan, ICICI Prudential Income Plan, ICICI Prudential Monthly Income Plan, ICICI Prudential Income Multiplier Fund, ICICI Prudential Very Cautious Plan and ICICI Prudential Cautious Plan. Exit Load for fresh and additionalpurchases (including SIPs and STPs) made in the schemes given hereinbelow during September 15, 2006 to October 16, 2006, the following will be applicable: • ICICI Prudential Power, ICICI Prudential Dynamic Plan, ICICIPrudential Discovery Plan, ICICI Prudential Balanced Fund – (i) 0.50% of the applicable NAV if the investment is made for an amount of less than Rs. 5 crores and is invested for a period of six months or less than six months fromthe date of allotment. (ii) Nil for investment of Rs. 5 crores and above. • ICICI Prudential Income Multiplier Plan – (i) 1.25% of the applicable NAV if the investment is made for an amount of less than Rs. 5 crores and is investedfor a period of less than twelve months from the date of allotment. (ii) Nil for investment of Rs. 5 crores and above. • ICICI Prudential Monthly Income Plan – (i) 0.75% of the applicable NAV if the investment is made for an amountof less than or equal to Rs. 10 Lakhs and is invested for a period of six months or less than six months from the date of allotment. (ii) Nil for investment of above Rs. 10 Lakhs. • ICICI Prudential Child Care Plan Gift and Study Option– 1.25% of the applicable NAV if invested for a period of three years or less than three years from the date of allotment. The exit load structure will also be applicable for switch-ins to any of the above schemes from the followingopen-ended debt schemes alone: (a) ICICI Prudential Liquid Plan (b) ICICI Prudential Floating Rate Plan (c) ICICI Prudential Sweep Plan - Cash Option. There will be no change in the exit load structure for all purchases,SIPs, STPs, Switch-ins made either before September 15, 2006 or after October 16, 2006.
ICICI Prudential Mutual Fund Corporate Office(Erstwhile Prudential ICICI Mutual Fund)
Peninsula Tower, 8th Floor, Peninsula Corporate Park, Ganpatrao Kadam Marg, Off. Senapati Bapat Marg,Lower Parel, Mumbai – 400 013. Telephone No.: 022-24997000 Fax No.: 022-2499 7029
Website: www.icicipruamc.com E-mail: [email protected]
