assessment report on airborne geophysical survey mila property
TRANSCRIPT
ASSESSMENT REPORT on
AIRBORNE GEOPHYSICAL SURVEY M I L A PROPERTY NTS 82M/12E
51°35'N Lat., 119O37'tY Long. Kamloops Mining Division, B.C.
for Goldbank Ventures Ltd .
Kevin D. Lund, BSc. September 8, 1989
' ,
G E O L O G I C A L B R A N C H "??9 1
A S S E S S M E N T R E P O R T
i
A helicopter borne geophysical survey was carried out by Aerodat Limited and supervised by MPH Consulting Limited on behalf of Goldbank Ventures Ltd. over the latter's Mila property, near Vavenby, B.C. The survey, comprising 492 line-km of magnetic and electromagnetic measurements, was flown during the period February 12 through February 14, 1989. This report contains the interpreted results from that survey along with conclusions and recommendations for further evaluation of the property's potential.
The llila property is underlain by Permian and older Eagle Bay Formation rocks, which have been intruded by Devonian and Cretaceous granitic rocks and are overlain by Pliocene basalt.
Interpretation of the helicopter borne geophysical results, in combination with the known geology and exploration models, indicate the following five high priority areas:
I Conductor group 3 , consisting of 6 individual conductors, exhibits strong EM response over a 300-500 m strike length and is coincident with the local magnetic features. Conductor group 3 appears to be coincident with or very near the Road Showing as described by Christopher (1988). These conductors are at or near a strong contrast observed in the EM, magnetic and resistivity datasets, which possibly reflects the Vavenby Thrust Fault, as mapped by Schiarizza (1985).
I1 Conductor groups 6 and 7 are 2400 m long, strong EIl responses observed flanking a magnetic high. The position of Conductor groups 6 and 7 , situated between and parallel to the AFR Zone and Road Showing, indicates they are of potential exploration significance.

ii
I11 Conductor group 10 is observed as a number of strong EEI
responses coincident with a magnetic anomaly along 500 m of strike. Group 10 is situated to the north of and parallel to a mineralized zone previously located by Nicanex Mines.
IV Conductor group 9 exhibits moderate EM responses, over a possible strike length of 1000 m, coincident with magnetic highs in an area of no recorded exploration.
V Conductor group 24 is observed as a 1400 m long, weak Etl response along the flank of a magnetic high feature. Conductor group 24 is nearly coincident with a 1500 m long ground VLF-EM conductor previously defined by Kangeld Resources. Diamond drilling of the ground conductor inter- sected a shear zone.
Further exploration work on the Mila property is warranted. It is recommended that the helicopter borne geophysical survey be followed up with detailed geologic mapping (1:10,000 scale), lithogeochemical sampling, magnetometer and MaxMin HLEtl and/or Induced Polarization ground surveys in order to further delineate and test the EM conductors outlined by the airborne survey. The ground conductors should then be tested by trenching, where possible, and/or diamond drilling.
TABLE OF CONTENTS
S U Fl f4A R Y 1.0 INTRODUCTION 2.0 LOCATION, ACCESS, TITLE 3.0 EQUIPMENT
3.1 Aircraft 3.2 Electromagnetic System 3.3 VLF-EM System 3.4 Magnetometer 3.5 Radar Altimeter, Tracking Camera and
3.6 Analog Recorder and Digital Recorder Radar Positioning
4.0 DATA 4 .1 4.2 4.3 4.4 4.5 4.6 4.7
PRESENTATION Flight Path Recovery Electromagnetic Anomalies Total Field Magnetic Contours Vertical Magnetic Gradient Contours Apparent Resistivity Contours VLF-EM Total Field Contours Image Processing
5.0 GEOLOGY 5 . 1 Regional Geology 5.2 Regional Structure 5.3 Mineral Occurrences
5.3.1 Exploration Models 6.0 RESULTS OF PREVIOUS EXPLORATION
6.1 Geology 6.2 Mineralization
7 . 1 General Comments 7.2 Total Field and Vertical Gradient
Magnetic Data 7.3 Structural Interpretation 7.4 VLF-EM Survey 7.5 Resistivity 7.6 Electromagnetics
7.0 INTERPRETATION
8.0 CONCLUSIONS 9.0 RECOElMENDATIONS
CERTIFICATE - K.D. Lund, BSc. REFERENCES
Page i 2
2
5 5 5 5 5
6 6
7 7 7 8 8
9 9
1 0 10 1 2 1 2 13 1 5 1 5 1 5
1 8 1 8
a
24 28 28 29 3 0 36 3 9 40 4 1
List of Appendices
Statement of Expenditures APPENDICES I List of Personnel and
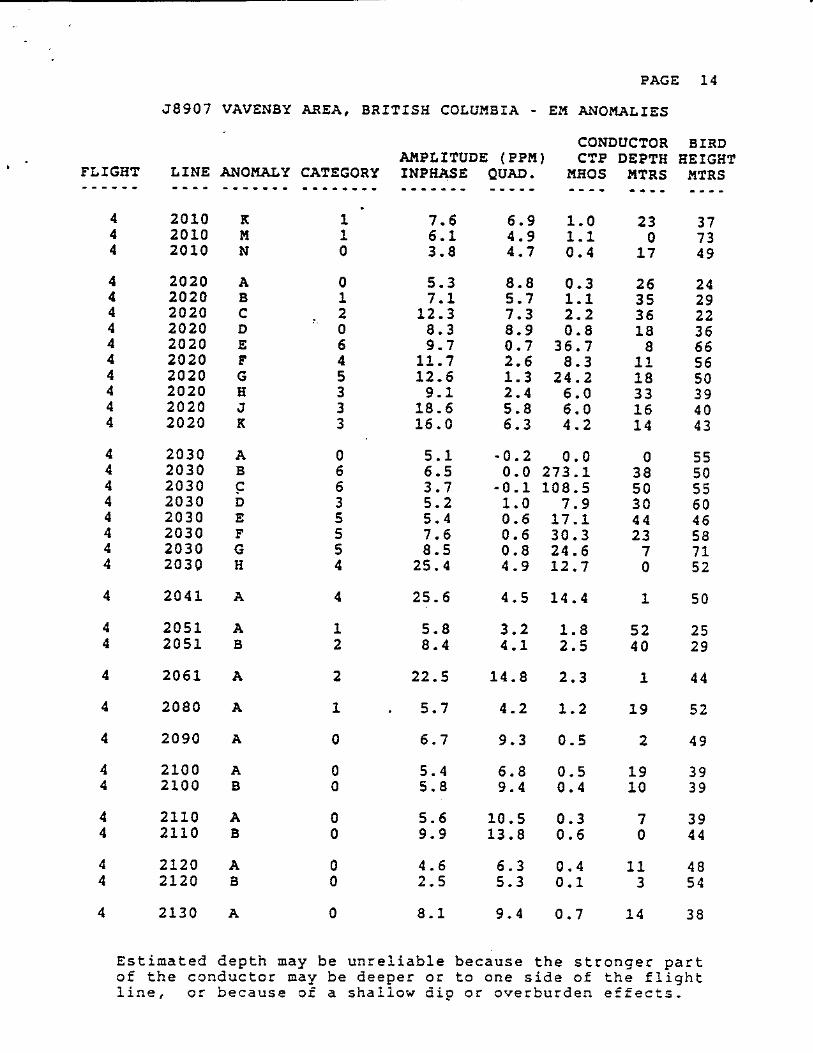
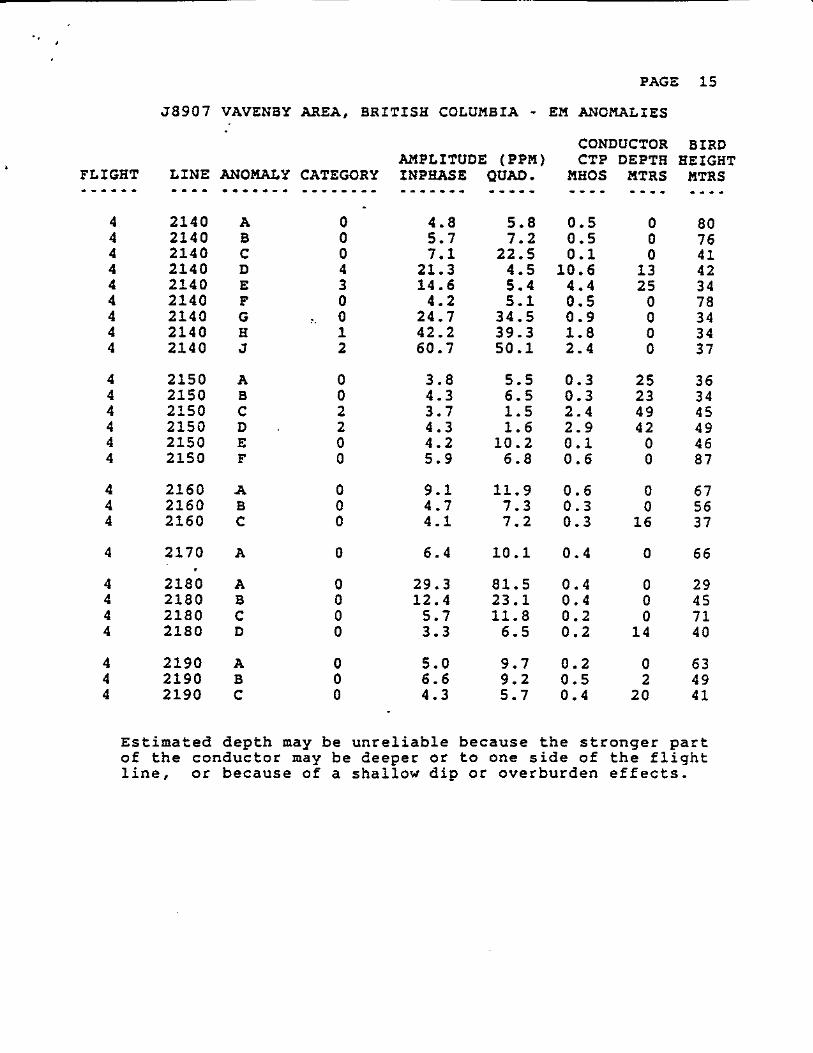
I1 General Interpretive Considerations I11 Erl Anomaly List

T a b l e s
Correlating Information Table 1 Interpreted EM Conductors and
L i s t of F i g u r e s Figures
1 General Location Map 1:8,000,000 2 Claims !lap 1 : 100,000 3 Regional Geology Map 1 : 200,000 4 Airborne Coverage 1: 100,000
L i s t of Maps (Scale 1:10 ,000 - in pocket)
5 Electromaqnetic Profile; showing anomaly peaks Flaps
along with in-phase amplitudes and conductivity thickness ranges for 4 6 0 0 Hz coaxial coil system
6 Total Field Maqnetic Contours; showing magnetic values contoured at 2 nanoTesla intervals, registered to photo mosaic
7 Vertical Maqnetic Gradient Contours; showing computed vertical magnetic gradient values '
contoured at 1 nanoTesla per metre, registered to photo mosaic
8 Apparent Resistivity Contours; showing contoured resistivity value, flight lines, calculated from 3 2 0 0 0 Hz coplanar EN Response assuming a 200 m conductive layer, registered to photo mosaic
9 Apparent Resistivity Contours; showing contoured resistivity value, flight lines, calculated from 4 6 0 0 Hz coaxial EM response assuming a 200 m conductive layer, registered to photo mosaic
10 VLF-EM Total Field Contours; showing contoured total field intensity in percent of NLK Jim Creek, Washington 24.8 kHz (Line Station), flight lines, registered to photo mosaic
VLF-EN Total Field Contours; showing contoured
Annapolis, Maryland 21.4 kHz (Ortho Station), flight lines, registered to photo mosaic
11 total field intensity in percent of NSS
Page 21-23
1 4
11 1 6
1 2 Geophysical Interpretation; compilation of all airborne geophysical data

Y U K O N \ T E R R I T O R Y
A L B E R T A
GOLDBANK VENTURES LTD.
GENERAL LOCATION MAP MlLA PROJECT
KAMLOOPS MINING DIVISION
1.0 INTRODUCTION
2
The purpose of the airborne survey was to map magnetic and conductive features which could be indicative of economic gold and base metal mineralization. This report describes the survey method and the results obtained. A lithological and structural interpretation of the property is made based on the results, priority targets and target areas identified. Conclusions and recommendations are presented for further evaluation of the economic potential of the property.
The geophysical equipment operated by Aerodat included a four- frequency electromagnetic system, a high-sensitivity cesium vapour magnetometer, a two-frequency VLF system, a radar posi- tioning system, a video camera and an altimeter.
At an azimuth of 160°/3400, a total of 492 line-km of coverage was flown from February 12 through 14, 1989. The flight lines were flown at nominal separations of 100 m in the eastern portion of the survey area and 200 m in the western portion.
All data were recorded in both digital and analog form. The ground positioning of the data was recorded on a standard VHS video tape and also marked on flight path mosaics by the operator while in flight.

2.0 LOCATION, ACCESS AND TITLE
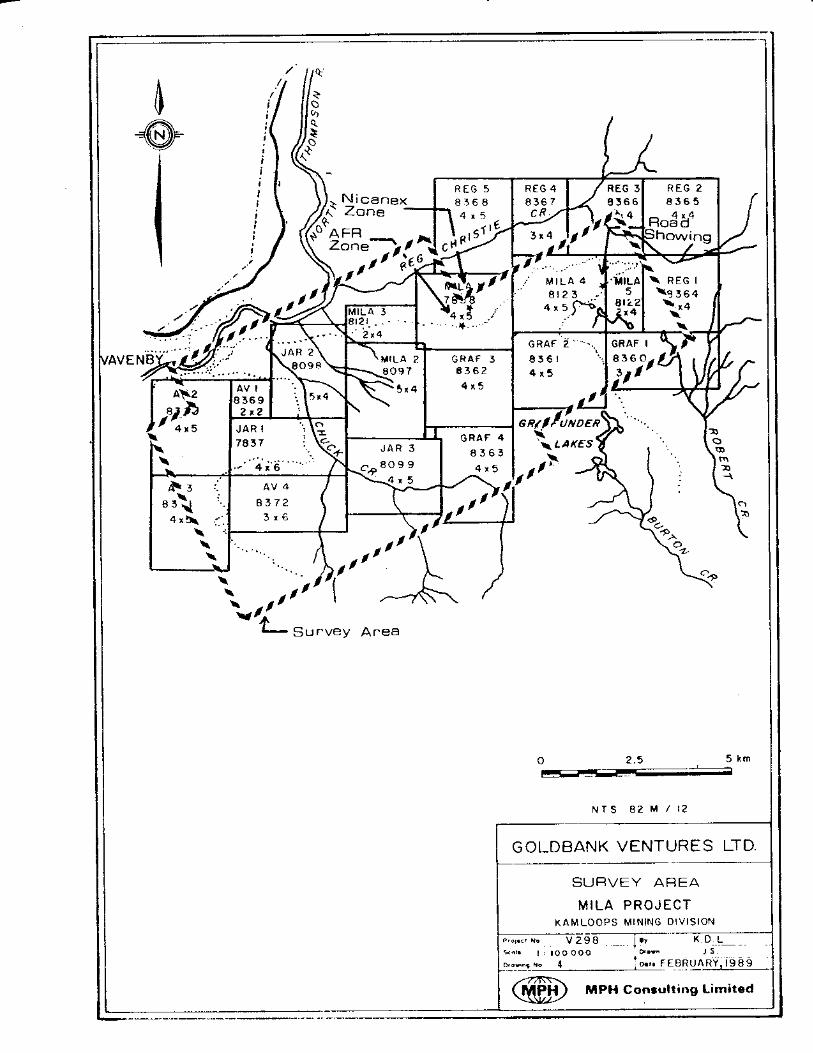
The Jar 1-3 and Mila 1-5 claims (Figure 2 ) are centred 5 km southeast of Vavenby, B.C. in the Kamloops !lining Division at approximately 5 1 ° 3 5 ' N latitude, 119O37'W longitude (NTS mapsheet 82M/12E).
Access to the claims from Vavenby is via a network of driveable logging roads. Numerous overgrown dirt tracks, impassable to vehicles, allow easy direct access on foot to many parts of the property.
The topography varies from steeply incised creeks to gently rolling plateau, with most of the terrain on the property being fairly steep. The Jar 1-3 and Mila 1-5 claims were staked by Goldbank Ventures Ltd., prior to conducting the helicopter borne survey. Claim information is summarized in the following table:
Anniversary Claim Name Record No. Units Date
Jar 1 Jar 2 Jar 3 Mila 1 Plila 2 Mila 3 Plila 4 Mila 5
7 8 3 7 8 0 9 8 8 0 9 9 7 8 3 8 8 0 9 7 8 1 2 1 8 1 2 3 8 1 2 2
1 8 20 20 20 20
8 20
8 - Total 1 3 4 units
June Oct. Oct. June Oct. NOV . Nov. rJov.
3 0 , 1 9 8 9 1 9 , 1 9 8 9 1 9 , 1 9 8 9 3 0 , 1 9 8 9 2 0 , 1 9 8 9
5, 1 9 8 9
7 , 1 9 8 9 6 , 1 9 8 9

-.
CLAIMS MAP MlLA PROJECT
K A M L O O P S MINING DIVISION
Propct No v 2 9 8 w K D . L Sm'* I ' 100 000 Drown J .S . Drawlno NO 2 Date FEBRUARY.1989
- - - -
-
VAV E N
L J
0 2.5 5 km
N T S 8 2 M / 12
GOLDBANK VENTURES LTD.
I MPH Consulting Limited

5
3.0 EQUIPMENT *
3.1 Aircraft
An Aerospatiale A-Star 350-D helicopter (CG-FHS) was used for the survey. Installation of the geophysical and ancillary equipment was carried out by Aerodat.
3.2 Electromagnetic System
The Aerodat four-frequency electromagnetic system was utilized. The system consists of two vertical coaxial coil pairs operated at 9 3 5 Hz and 4 6 0 0 Hz and two horizontal coplanar coil pairs operated at 4 1 7 5 Hz and 30000 Hz. The transmitter/receiver separation between the coaxial and coplanar pairs is 7 m. The in-phase and quadrature signals are measured simultaneously for the four frequencies at a sample rate of 10 samples per second.
3.3 VLF-EM System
A Herz Totem 2A VLF-EM system was utilized. The instrument measures total field and quadrature components of two selected transmitters. The transmitting stations monitored were NLK, Jim Creek, Washington, broadcasting at 2 4 . 8 kHz (line station), and NSS, Annapolis, Maryland broadcasting at 2 4 . 0 kHz (ortho station). The VLF-EM signals were measured simultaneously at a sample rate of 5 samples per second.
3.4 Magnetometer
The magnetometer utilized was a Scintrex model VIW-2321 H8, cesium, optically pumped magnetometer sensor having a reading sensitivity of 0.1 nT, sampling at a rate of 5 samples per
* from Aerodat Logistical \?rite-up
6
second. The base station utilized was an IFG digital base station with a GSN-8 proton precession magnetometer operating at the base of operations in Clearwater, B.C. The diurnal vari- ations of the earth's magnetic field were corrected between the base unit and field unit.
3 . 5 Radar A l t i m e t e r , Tracking C a m e r a and Radar P o s i t i o n i n g
A King KRA-10 radar altimeter was used to record terrain clear- ances.
The Notorola Mine Ranger (FIRS 111) radar navigation system was used to guide flight paths and later for flight path recovery.
A Panasonic video camera was used to record the flight path on a standard VHS video tape. The camera was operated in the normal continuous mode with times and fiducial numbers encoded on the tape for cross reference to the analog and digital data.
3 . 6 Analog Recorder and D i g i t a l Recorder
To display the data during the survey, an R!4S dot matrix recorder was used. The survey information has been recorded digitally on magnetic tape using a DAS-8 data system.
7
4.0 DATA PRESENTATION*
4.1 Flight Path Recovery
The flight path recovery was derived from a combination of the navigator's manual picks which were mapped on a photo mosaic map and points taken from the records of the flight. The survey area is mostly rugged and mountainous. Portions of the survey when line-of-sight electronic navigation and flight path recovery systems were not practical, were established using the air photos and mosaics along with the video tracking camera to locate positions. Depending on quality of the air photos and mosaics, the rugged nature of the terrain, and the quality of the naviga- tion (pilot), there may be some errors in locating anomalies on a topographic map with respect to their true position on the ground. The flight paths are shown on each map with camera time marks and navigator manual fiducials for cross reference to both the analog and digital data.
4.2 Electromagnetic Anomalies
The anomalous electromagnetic responses were selected and analysed by computer to produce the final electromagnetic anomaly map. The anomalies picked by computer include bedrock, surficial and possibly cultural conductors.
The EEI anomalies are presented with the 4600 coaxial profiles. The conductors' axes have been interpreted and are shown reflect- ing variable confidence continuity. For discussion purposes the conductors have been grouped as shown on the geophysical interpretation map (figure 1 2 ) .
* from Aerodat Logistical Write-up
a
4.3 Total Field Magnetic Contours
The aeromagnetic data is corrected for diurnal variations by adjustment with digitally recorded base station data. There has been no correction for a regional variation. The corrected profile data were interpolated into a regular grid at a 25 m true scale interval using a cubic spline technique. This grid provided the basis for threading the presented contours at a 2 nT interval. The contoured aeromagnetic data has been presented on a mylar copy of photo mosaic base map with flight lines.
4.4 Vertical Magnetic Gradient Contours
The vertical magnetic gradient is calculated from the gridded total field magnetic data and contoured at a 1 nT/m interval. The vertical gradient data are presented on a mylar copy of the photo mosaic base map along with flight lines.
4.5 Apparent Resistivity Contours
The electromagnetic information was processed to yield an apparent resistivity map.
The computer-calculated apparent resistivities from the 3 3 kHz
and 4600 Hz datasets are based on a model consisting of a 200 m thick conductive layer (i.e. effectively, a half-space) over a resistive bedrock. The apparent resistivity profile data is then interpolated into a regular grid at a 25 m true scale interval using a cubic spline technique. Contoured apparent resistivity data are presented on a mylar copy of the photo mosaic base map along with the flight paths information.

9
4.6 VLF-EM Total Field Contours
The total field VLF-EM signals from Jim Creek, Washington and Annapolis, Maryland broadcasting at 2 4 . 8 and 21.4 kH respectively are compiled in a contour map form. These were presented on mylar copies of photo mosaic base map with flight lines.
The 'inline' receiver was tuned to Jim Creek, Washington, located at an azimuth of N 1 3 5 W and the 'ortho' station was tuned to Annapolis, Maryland, located at N 9 5 E . The respective signals will couple with conductive features orientated northwest with the 'inline' station an'd northeast with the 'ortho' station.
4.7 Image Processing
A total of 66, 35 mm slides of computer generated images were made of the total field magnetic, vertical gradient magnetic, VLF-EM, and resistivity data using RTI (Real Time Imagery) software. The data is analyzed with the aid of shadow maps and by adjusting the colour ranges of the contour amplitudes. The technique is relatively inexpensive and allows subtle structural features to be interpreted more readily than from the standard presentations.

10
5 . 0 GEOLOGY
5.1 Regional Geology
Geological mapping by the British Columbia Department of Mines was carried out in the Vavenby area by Schiarizza (1985). It shows the Vavenby area as being underlain by Paleozoic Eagle Bay Formation rocks, intruded by Devonian(?) and Cretaceous granitic rocks, and overlain by Miocene basalt (Figure 3 ) .
Eagle Bay Formation
The Eagle Bay Formation in the Vavenby area is divided into eight units (Schiarizza, 1985). At the base of the formation is a quartzite dominated succession (Unit 1) of unknown age. This is overlain by a succession of felsic to intermediate metavolcanic rocks (Units 2 and 3), and fine to coarse-grained clastic metasedimentary rocks (Units 4 and 5) of Devonian-Mississippian age. Structurally above these rocks is a mafic metavolcanic- limestone division (Unit 6) of Cambrian age, overlain by inter- mediate metavolcanics (Unit 7). The carbonate member of Unit 6 is referred to as the Tshinakin limestone. The structurally highest division of the Eagle Bay Formation comprises clastic metasedimentary rocks of Unit 8. These rocks are overturned, however, and Unit 8 may be the oldest unit within the Eagle Bay succession.
Granitic Rocks
Cretaceous granite and granodiorite of the Raft and Baldy bath- oliths, shown in Figure 3 as Unit 11, intrude the Eagle Bay rocks. In contrast to the abrupt northern contact of the Baldy batholith, the southern margin of the Raft batholith is marked by a broad zone of intermixed metasedimentary and granitic rocks.

1 2
Basalt
The flat-lying, undeformed Pliocene basalt flows shown in Figure 3 as Unit 12, are the easternmost representatives of an extensive mass of Late Miocene to Pliocene plateau lavas which cover much of the area to the west and northwest of Vavenby (Campbell and Tipper, 1971).
5 . 2 Regional S truc ture
Schiarizza and Preto ( 1 9 8 7 ) describes four types of structures which exist in the Vavenby area:
1.
2.
3.
4 .
5.3
The
An early metamorphic foliation, axial planar to very rare, small isoclinal folds. This is locally observed to be discordant to and/or folded about the dominant second generation schistosity.
Southwesterly directed thrust faults dipping to the north.
Northeast trending faults, which are predominantly .strike- slip faults displaying a right-lateral offset.
Northerly trending normal faults, commonly west side down, exhibiting little or no lateral offset.
Mineral Occurrences
Chu Chua, Samatosum, and Harper Creek are three deposits of particular importance because of their similar geological setting to the Jar and Mila claims.
The Chu Chua deposit, located approximately 30 km southwest of the Jar and Hila claims, is a stratabound massive sulphide deposit in intermediate to basic volcanic rocks of the Fennel Formation.

13
The Samatosum deposit, located approximately 50 km south of the Jar and Mila claims, is believed to be a stratabound volcanogenic massive sulphide deposit within a structurally complex sequence of Paleozoic metavolcanic and metasedimentary rocks mapped as the Eagle Bay Assemblage (Pirie, 1989). The original discovery was marked by a geochemistry anomaly coincident with a VLF-EM anomaly. The strong VLF-EM conductors near the Samatosum deposit have been attributed to graphitic argillite based on drilling results. The mineralization occurs very near the graphitic argillite in sequence. Best mineralization is believed to occur at or near a significant break between the volcanic/sedimentary environments.
The Harper Creek deposit, located approximately 10 km southwest of the Jar and Mila claims, is a disseminated sulphide deposit associated with Devonian orthogneiss intruding Eagle Bay Assemblage metasediments and metavolcanic rocks. Mineralization is disseminated along schistosity surfaces, or as banded dissemi- nated sulphides, or occurs along fracture planes, with local concentrations of pyrite-pyrrhotite lenses.
It is believed the copper mineralization at Harper Creek is not stratigraphically controlled. The mineralization is reported to occur as tabular zones transgressing lithology. This zone grades 0.4 per cent copper, and has a strike length of more than 1800 m. Thicknesses exceeding 100 m in width and depth extension downdip to 600 m have been defined by Noranda (Schiarizza and Preto, 1987).
5.3.1 Exploration Models
Four exploration models currently define the geologic under- standing of the Eagle Bay and Fennel Formations:
14
Base metal stratiform, stratabound sulphide minerali- zation (Chu Chua). Silver - + base metal , sulphide mineralization at or close to a significant break between a volcanic and sedimentary sequence (Samatosum). Base metal, disseminated sulphide deposit (Harper Creek). Structurally controlled gold - + sulphide mineralization associated with silicified faults or shear zones.
15
6 . 0 RESULTS OF PREVIOUS EXPLORATION
6.1 Geology
The geology, geochemistry, geophysics and diamond drilling on the Mila property are compiled in a report by Peter Christopher and Associates, Inc. ( 1 9 8 8 ) . The report includes data from Nicanex Mines (Chisholm, 1 9 7 0 ) ; Greenwood Exploration (Kruzick, 1 9 7 6 ) ; Barrier Reef Resources (Dawson, 1978, 1 9 7 9 ) ; Cima Resources (Corvalan, 1 9 8 4 ) ; Newmont Exploration (Turner and Limion, 1984; Nebocat, 1985; Turner, 1 9 8 5 ) and Kangeld Resources (Burgess, 1981; Freeze and Troup, 1 9 8 4 ) . The southern areas of the property were covered by Royal Canadian Ventures (Naylor and White, 1 9 7 1 ) . The whole property was covered by an airborne magnetic survey (G.S.C., 1 9 7 3 ) .
6.2 Mineralization
The two main zones of disseminated copper mineralization trend east-west. They are known as the Nicanex and AFR Zones (Chisholm, 1 9 7 0 ) . A third mineralized area is the Road Showing (Christopher, 1988 ; Turner and Limion, 1 9 8 4 ) located 3.5 km to the east of both the Nicanex and AFR Zones as shown in Figure 4. This showing contains disseminated copper and lead mineralization accompanied by anomalous levels of gold.
The Nicanex discovery zone consists of a zone of sparse mineral- ized outcrops and float, approximately 800 m long (E-TJ) and up to 1 5 0 m wide. Mineralization consists of disseminated fine- grained chalcopyrite along foliation planes and on fractures in quartz-chlorite-sericite schists. - Scattered pyrrhotite and pyrite is usually found with the chalcopyrite, and malachite is present on some weathered surfaces.
The AFR Zone lies roughly south of and parallel with the Nicanex Zone. It consists of several mineralized outcrops and a number
0 2 . 5 5 krn
N T S 82 M 1 1 2 -
GOLDBANK VENTURES LTD.
SURVEY AREA
MlLA PROJECT K A M L O O P S MINING DIVISION __
OI K 0 . l -
@ MPH Consulting Limited

1 7
of occurrences of mineralized float in an area about 1000 m long (E-W) and about 150 m wide. Mineralization consists of finely disseminated grains of chalcopyrite in silvery phyllite and slightly calcareous quartz-chlorite-sericite schists. Orange weathered carbonate (ankerite?) and orange-brown limonite occur in fractures within this zone. Scattered pyrite usually accom- panies the chalcopyrite. Disseminated galena occurs locally in crosscutting quartz veins.
The Road Showing is a 10 m* area of mineralized outcrop. Mineralization consists of finely disseminated grains of pyrite, pyrrhotite, chalcopyrite, galena and magnetite along foliation planes and on fractures in both quartz-chlorite-sericite schists and silvery phyllites.
Newmont conducted a Pulse EM ground survey program south and west of the Road Showing. The Road Showing may be positioned at the northern edge of this survey area. Newmont drill tested pulse EN conductors which were determined to be graphitic argillite (Turner and Limion, 1 9 8 4 ; Turner, 1985).
Besides the massive to disseminated strata-bound sulphide model discussed, a structurally controlled gold mineralization model best describes a geologic target in the western portion of the survey area, as outlined by the Kangeld program (Freeze and Troup, 1 9 8 4 ) .
For a more detailed discussion of the property geology, the reader is referred to a report written by Peter Christopher ( 1 9 8 8 ) for Goldbank Ventures Ltd.,. which consists of a detailed compilation of the particular anomalous zones and 1 9 8 8 geological work.
18
7.0 INTERPRETATION
7.1 General Comments
The Vavenby area is dominantly covered with glacial overburden of variable depth. Geologic knowledge of the property to date has been based on limited available outcrop, historical exploration data in specific areas and previous regional airborne geophysical surveys (G.S.C., 1973).
A total of six geologic units has been mapped by Schiarizza (1985) in the Vavenby area. For the purposes of the geophysical interpretation, these geologic units have been categorized into general lithologic units having similar magnetic and electrical properties, such as sediments, felsic to intermediate volcanics and mafic volcanics.
These categories are not intended to be rigid and can be summar- ized as:
Schiarizza's Units
Sediments Units 5 and 8 Fine- to coarse-grained clastic metasediments
Units 1, 2, and 7 Felsic to intermediate metavolcanics
Unit 6 rlafic metavolcanics - limestone
Felsic to intermediate volcanics
Maf ic volcanics
The exploration models and potential targets are as follows:
a) Stratiform, strata-bound c-onductors with correlating magnetic features which may reflect either volcanogenic massive sulphide mineralization or disseminated sulphide mineralization associated with pyritic mafic volcanics (e.g. Chu Chua?).

19
First priority - conductors 3d,3e,3f,7d,9~,9d,9e,lOa,lOb, 1 Od
Second priority- conductors 4b,4c,lb,lc,ld
b) Stratiform, strata-bound conductors with no correlating magnetic features but possibly reflecting the exploration model in (a) (e.g. Samatosum).
First priority - conductors 3b13c16b,6c,7a,7b Second priority- conductors 5a113b,13c,13g,12b,12c,12g,
2a,2b,2c,la,12b,12c
c) Conductors crosscutting the regional lithologic trend and with correlating magnetic features. These may reflect either:
i ) structurally controlled, shear zone-hosted lode gold mineralization within mafic flows/sills,
ii) disseminated base metal mineralization associated with carbonated, pyritic mafic volcanics (Harper (Creek).
First priority - conductors 3d?,3e?,3f?,4b?,4c?
d) Conductor crosscutting the regional lithologic trend and with no correlating magnetic features but which may reflect either of the exploration models in (c).
First priority - conductors 24a119a119d Second priority- conductors 21b,25b,26a,26b
Other possible bedrock conductive features are identified but are not classified as priority exploration targets.
The total field magnetic survey and calculated vertical gradient data defined:
i ) The predominant geologic strike to be 0 5 0 " to 070°, ii ) Three domains of contrasting magnetic susceptibility,
20
iii) Structural features trending in two dominant directions, north to northeast and east to west.
The total field VLF-Erl data from two transmitting stations defined:
i ) Numerous northeast to east trending conductors, ii ) A number of probable/possible bedrock conductors and
structural features.
The resistivity data set calculated from the EPI measurements defined:
i ) Contrasts in resistivity which supports, in part, lithologic interpretation.
The EM data sets defined:
i ) 27 conductor groups of conductive trends, ii ) Several conductors support lithologic and, structural
interpretation.
The three known showings are as follows, along with physical characteristics and the geophysical signature associated with the showings:
Nicanex Zone: disseminated sulphide mineralization along foliation planes and on fractures approximately 800 m long and up to 150 m wide, trending 090" (Dawson, 1 9 7 9 ) .
Conductors located near Nicanex Zone are lla,llb,llc.
AFR Zone: disseminated sulphide mineralization approximate- ly 1000 m long and up to 150 m wide, trending 090" and possibly parallel to the Nicanex Zone (Dawson, 1 9 7 8 ) .
Conductors located near AFR Zone are 12a,12b,12g, and 12h in Domain Ia.
Road Showing : disseminated sulphide mineralization over 10 m2 (Christopher, 1989). Conductors located near Road Showing are 3d and 3f in Domain Ia and coincident with magnetic high features.

Table 1 - Interpreted W Conductors and Correlating Information
Magnetic Conductance Strike Orien- Associ- Range (Mhos) Length (m) tation Domain ation
[Conductor Croup 1 1 la**
Low Resistivity VLF-EM Correlation
Jim Ck, WA Annapolis, MI: Coaxial Coplanar 24.8 kHz 21 4 kHz 4600 Hz 32000 Hz Comments
1 b** lC** Id** le
[conductor Croup 2 1 2a** 2b** 2c** 2d
Conductor Group 3 1 3a 3b* 3c * 3d*
3e* I f * 2.
[‘Conductor Croup 4 1 4a 4b** 4c** 4d**
I Conductor Croup 51 Sa** 5b** 1 Conductor Croup 61 6a 6b* 6c*
7a* [Conductor Croup 7
7 b* 7c 7d*
[ Conductor Croup 8 1 8a 8b
1 to 8 1 to 8 15 to 30 1 to 4 1 to 4
4 to 8 2 to>30 8 to 30 1 to 20
1 to 4 2 to 15 2 t o 8 ’
4 to 30 I 4 to 30
6 ,
1 to 15 2 to 30 1 to 4 4 to 30
2 to 10 >30
0 to 3
4 to 12 8 to 25 4 to 30
2 to 8 4 to 8 1 to 2 2 to 8
1 to 2 I 1 t o 2 I
100 100 100 100 200
100 400 200 600
200 200 500 300
100 300
100 500 500 400
900 400
100 300
2400
800 300 200 300
4 00 600
070 070 050 070 090
040 050 070 090
070 070 080 070
090 050
030 050 050 050
060 060
050 050 050
070 060 070 050
la
Ia
Ia
la I Ia-Ib
Ib
Ib
C
S
F C
c (L) (L) I F F
C F F F
I : I
N N N N N
F F C
F
F C
S
C C
F F F
F F
C
C
C F C C
C C
F C C
C F
F F
C
F C
F C
C
S
F
Reflects sulphide mineral- ization and/or graphitic argillites
Possibly drilled by Newmont, reflects graphitic arglllite
Reflects Road Showing Mineralization
Vavenby Thrust Fault? I Extension of AFR Zone(?)
Extension of Nicanex Zone(?)

Table 1 - In te rpre ted EM Conductors and Corre la t ing Information (cont .2)
Magnetic Associ-
a t i o n Conductance S t r i k e Orien-
VLF-EM Corre la t ion J i m Ck, WA Annapolis, MD Coaxial Coplanar
24.8 kHz 21.4 kHZ 4600 Hz 32000 Hz Comments I Conductor Group 9 1 , 9a 9b* 9c 9d 9e* 9f
l b
9g I [ Conductor Group 1 0 1 , 10a* lob* 1 oc 1 Od
I 10e [Conductor Group 11 I ,
1 l a I l b 1 lc l l d * *
12a 12b** 12c** 12d 12e 12f 12g** 12h**
13a 13b** 13c** 13d 13e 13f
I Conductor Group 1 2 1
I Conductor Group 1 3 1
13g** I IConductor tiroup 1 4 1 ,
14a
4 t o 12 4 t o 1 2 1 t o 2 4 t o 8
4 t o 1 2 0 t o 2
10 t o 30 2 t o >30 1 t o 2 4 t o 1 2 1 t o 2
2 t o 4 2 t o 4 3 t o 6 6 t o 1 4
2 to a
2 t o 4 4 t o 1 2 4 t o 12 2 t o 5 2 t o 5 2 t o 5 4 t o 1 2 2 t o 8
4 t o 1 2 4 t o 1 2 1 t o 5 1 t o 5 1 t o 5 >30
4 t o 12
l t o 2 I
100 400 200 100 200 200 200
200 500 100 100 200
100 100 100 100
300 500 800 200 200 200 200 400
100 500 400 400 400 100 600
2 00
060 060 060 060 070 080 105
060 060 030 060 070
100 080 100 030
090 100 070 050 050 050 050 050
060 060 060 060 030 050 050
I b
I b
Ia-Ib
I I Low R e s i s t i v i t v I
l a
C
C
C C
C C
F F F C
F
C C C C C C
C C
C
C C
C
C C
C
C C F
C S
C C
C C C
C
C
C C C
C
C C C C C F
C F
C F F
F S
C C
C C C C F
C
C
S
C
F C
C
C
C C
C
North of and p a r a l l e l t o Nicanex Zone
AFR Zone(?)
* Firs t P r i o r i t y Explorat ion Target C co inc ident F f lanking (L) low (B) broad ** Second P r i o r i t y Exploration Target S semicoincident N none - no r e l a t i o n s h i p h igh narrow

1
Conductance S t r i k e Orien- Range (Mhos) Length (m) t a t i o n I I
Table 1 - I n t e r p r e t e d EM Conductors and C o r r e l a t i n g In fo rma t ion ( con t .3 )
Low R e s i s t i v i t y Magnetic VLF-EM C o r r e l a t i o n Associ- J i m Ck, WA Annapolis , MC Coax ia l Coplanar
Domain I a t i o n 24.8 kHz 21.4 kHz 4600 Hz 32000 Hz Comments
[ Conductor Group 15 1 I I Conductor Group 16 1 I [Conductor Group 17 1 ,
17a 17b 17c
18a LConductor Group 18
I 18b
19a* 1 Conductor Group 1 9 1 I
19b 19c 19d* 19e
I 19f
20a 20b
2 l a
I Conductor Group 2 0 1 I [Conduc to r Group 21 1 ,
’ I ’ 2 1 b**
I Conductor Group 22 I I [Conductor Group 23
23a ‘ I I 23b
24a* [Conductor Group 24 1 ,
I 24b
[Conduc to r Group 25 1 I 25a 25b** I 25c I 1 Conductor Group 26 1 , 26a**
I 26b** 26c
I Conductor Group 27 , 27a**
I 27b
<l I <1
1 t o 2 2 t 0 4 I 2 t o 4
1 t o 12 1 t o 3 2 t o 12 2 t o 20 8 t o 12 4 t o a
1 t o 2
2 t o 12 2 t o 10
I t o 2 I I
1 t o 2 1
2 t o LO 2 t o 6 I 1 t o 3 1 t o 2 I 1 t o . 3 4 t o 12 1 t o 2
8 t o 20
7 t o 30
300 I 100 I
200 400 I 400
400 400 I
1000 200 400
1600 200 400
400 400 I 600 600 I 400 I
200 200
1400 600
500 1000
2 00
200 200 I
050 I 030 I
050 050 1 030
050
050 050 050 05 0 050 030
060 060 I 090
050 I
050 I
030 030 I 090
030 050 I 050
100
110 100 1 120
I I I II I I
Ia
Ia I la I
I1 I f
I I I
I
la I Ia
C
C
F
F
F C
C
C F
F
C C
C
S
C
C
C F
F C
C C
C
C
C F
C
C C C
C C
S
C S C
F
F C
C F
C F
C C
F
F
C F
F
F F
C F
C C C
S h e a r / F a u l t Zone (? )
Co inc iden t w i t h ground VLF-EM conduc to r S h e a r / f a u l t zone
S h e a r / f a u l t zone (? )
( B ) broad (N) narrow
( L ) low P r i o r i t y Exp lo ra t ion Target C c o i n c i d e n t F f l a n k i n g (H) h igh ** Second P r i o r i t y Exp lo ra t ion Target S semico inc iden t N none - no r e l a t i o n s h i p

2 4
In addition to the showings located in the survey area, previous exploration work conducted in the western portion of the airborne coverage defined a ground VLF-EM anomaly trending 0 9 0 " approxi- mately 1500 m long which was tested by one drillhole. This hole is reported to have intersected a shear zone with gold mineral- ization (Freeze and Troup, 1 9 8 4 ) . A weak helicopter borne EM
conductor ( 2 4 a ) and strong VLF-EM conductor is located near or coincident with the ground VLF-EM conductor.
The magnetic data sets were interpreted in conjunction with resistivity data sets to define lithologic contacts and structur- al features. The lithologic contacts and structures are also supported in part by the VLF-EM and EH surveys. The interpreta- tion was then related to Schiarizza's regional mapping ( 1 9 8 5 ) .
The interpreted overall features are in agreement with mapping by Schiarizza, however the geophysics indicates a more complex stratigraphy than Schiarizza's mapping suggests.
From the EM results, - no bedrock conductive trends were defined. Those are presented in Table 1 along with related magnetics, VLF-EM, and resistivity features.
The VLF-EPI data sets were interpreted in conjunction with the EM
to define conductive strike lengths as well as map resistivity contrasts in the lithology.
7.2 Total Field and Vertical Gradient Magnetic Data
The corrected total field data present a complex response pattern which indicates several possible directions of faulting and a high degree of folding of the underlying lithologic units, suggesting a moderate intensity of structural deformation and lateral displacement of individual units. The chosen contouring intervals (Maps 6 and 7 ) have served to highlight the more subtle

25
features without distorting the more readily identifiable responses. Total field magnetic amplitudes vary from 5 7 , 3 5 0 to 5 9 , 0 0 0 nT. The magnetic background is estimated to be 5 7 , 7 0 0 nT. Numerous magnetic features with amplitudes typically ranging from 50 to 500 nT above background occur throughout the area.
In the eastern portion of the survey area these features indicate dominant lithologic trends between N30E and N60E, in agreement with the Regional Airborne Magnetic Survey (G.S.C., 1 9 7 3 ) and the current geological information (Schiarizza, 1 9 8 5 ) . Elsewhere, the orientations of the magnetic features vary considerably due to the interpreted deformation.
From the magnetic data, three areas of contrasting magnetic response were observed which are denoted Domains I, I1 and 111. Domain I is located over most of the survey area and is further divided into Subdomains Ia and Ib. Subdomains Ia and Ib are defined by their relative resistivity responses, being very low resistivities and moderate resistivities respectively. Domain I1 reflects the highest magnetic amplitudes measured. Domain I11 is similar to Domain I in magnetic response and is further defined by a lack of EM response. Domain I11 is located dominantly in the northeastern portion of the survey area.
Magnetic Domain I, encompassing most of the property, is char- acterized by a generally quiescent magnetic response pattern typical of sediments or felsic volcanics. The associated total field magnetic amplitudes range f r o m 5 7 , 3 8 0 to 5 7 , 8 5 0 nT with individual magnetic features only in Domain I exhibiting a northeast trend. An exception to this is the extreme southwest corner of the survey area where northwest trending magnetic features are apparent. Schiarizza ( 1 9 8 5 ) and Turner and Limion ( 1 9 8 4 ) have mapped metasediments in this area.
Within Domain I are two units of higher susceptibility labelled Subdomains Ia and Ib. Subdomains Ia and Ib have similar magnetic
26
characteristics. The reason they are differentiated is the contrast in their accompanying resistivities. The moderate resistivities which define Ib are possibly reflecting a felsic volcanic unit whereas the lower resistivities related to Subdomain Ia are interpreted to reflect a sediment unit. These higher amplitude magnetic features (up to 100-200 m wide) are also typical, in part, of mafic volcanics. This magnetic data, therefore, indicates that mafic volcanics are extensive west of Chuck Creek. The mapping of sediments grading metamorphically into metasediments with some mafic metavolcanics (Schiarizza, 1 9 8 5 ) indicates that mafic volcanics occur on both banks of Chuck Creek. The mafic volcanics on the east bank must be of limited extent as the lower amplitude magnetic response pattern is more typical of metasediments, therefore the magnetic interpretation near Chuck Creek is in disagreement with Schiarizza's mapping.
Domain I1 is located in the western third, across the central portion of the survey area and through the southern portion of the eastern one-third of the property. It contains the highest magnetic amplitudes measured within the survey area. The total field amplitudes range from approximately 57,850 nT to 59,000 nT. The magnetic features within Domain I1 are approximately 100 to
3 0 0 m wide and are predominantly northeast trending. Regional folding, interpreted in the western portion of Domain 11, is especially apparent in the vertical gradient data (see Flap 12).
The magnetic features interpreted from the vertical gradient data set are shown in the geophysical compilation (Map 1 2 ) .
Previously mapped mafic metavolcanics (Schiarizza, 1 9 8 5 ) within Domain I1 indicate this magnetic unit likely reflects inter-
mediate to mafic volcanics.
It is of interest to note a strong correlation between the high- est magnetic amplitudes recorded and the presence of Tshinakin

L
27
limestone mapped by Schiarizza ( 1 9 8 5 ) . This relationship has been observed in airborne data south of the Baldy batholith as well (verbal communication, Ian Pirie, Plinnova Inc.). The causal source of the high magnetic amplitudes associated with the limestone cannot readily be explained at this time.
Magnetic Domain I11 is situated primarily in the northeast portion of the survey area. Its features have a predominantly east-west trend. Domain I11 is characterized by a magnetically quiescent background with total field amplitudes varying between 57,850 nT and 58,100 nT. Domain I11 is further characterized by an absence of EM conductors. Individual magnetic features within the domain have amplitudes of 50 to 100 nT above back- ground. The overall response pattern supports the interpreted regime of folding and faulting made by Schiarizza ( 1 9 8 5 ) . Domain I11 is interpreted to reflect an intermediate to felsic volcanic unit.
Previous regional geologic mapping (Schiarizza, 1 9 8 5 ) . coincident with Domain I11 indicates it is underlain by two units consisting of a quartzite dominated succession and a felsic to intermediate metavolcanic unit. No distinction between these geologic units can be made from the magnetic data.
The first step in an interpretation is to outline the causal sources of individual magnetic responses. The vertical gradient magnetic map, calculated from the total field data set, was extremely useful in this process. The sharper, narrower responses in the vertical gradient data set enable closely-spaced multiple magnetic features to be more confidently interpreted as well as allowing the structural regime on the property to be more clearly delineated.
Due to the limited geological information, the current magnetic interpretation is of a general nature. Where there are coinci- dent EH anomalies or detailed geologic knowledge, such as the three mineralized showings, a more comprehensive examination has been made.
28
7.3 Structural Interpretation
The faults and folding interpreted from the total field magnetic data are supported, in part, by the EPl and calculated resistivity results. This interpreted structure is presented on Map 12.
From the data, two fault directions are apparent which are a north to northeast trend and an east to west trend. The inter- preted faults are presented as either major faults (supported by magnetics, EM and resistivity data) or minor faults (supported by magnetic or resistivity data only).
The magnetic response pattern clearly suggests folding in the northeast and western portions of the survey area. The structur- al interpretation has been kept very simplistic at this time due to the limited geologic knowledge. Undoubtedly the underlying property is much more complex but further interpretation is not warranted based on the limited data set currently available.
7.4 VLF-EM
The VLF-EM method is 'a limited and relatively unsophisticated technique with respect to the determination of conductance. In addition, it is difficult to determine the dip and/or depth to a conductive source. Hence, the VLF-EM method provides a preliminary indication of specific areas for further geophysical and geological exploration. This is particularly true on this property where extreme topographic variations are noted.
The VLF-EM data is presented in contour form of total field strength (Maps 10 and 11). As is typically the case, the VLF-EM survey produced a multitude of anomalous responses exhibiting a wide variety of characteristics. The VLF-EM conductors generally persist over two or more flight lines and a number of zones extend over considerable distances. The dominant conduc- tive trend is northeast to east, conformable with the magnetics.

I"- = 29
A correlation of the VLF-EM conductors with EM, magnetics, resistivity and geology is presented in Table 1. The VLF-EM was particularly useful when incorporated with the magnetic interpre- tation in defining lithologies and structure. The VLF-EM results were also used in conjunction with the EM interpretation to extend known conductors.
7.5 Resistivity
Resistivity maps were created from the 4600 Hz coaxial EM responses and from the 3 2 kHz coplanar responses. The calculated resistivities range from 1 ohm-m to greater than 10,000 ohm-m. This large variation is typical in resistivity data. Interpreta- tion of the resistivity data is presented in Table 1.
The resistivity data was useful when combined with the magnetic data sets, particularly in discriminating Subdomains.Ia and Ib. The following are the general resistivity characteristics of the interpreted magnetic domains:
Doma in
Ia low calculated resistivities, generally less than 500 ohm-m as shown on Maps 8 and 9
Ib low to moderate calculated resistivities, generally between 500 ohm-m and 2000 ohm-m as shown in Maps 8, 9
I1 highest calculated resistivities indicated on Maps 8, 9
I11 moderate to high resistivities indicated on Maps 8, 9
The low resistivity areas possibly reflect only sediments and
areas exhibiting low to moderate resistivity might reflect
sediments with felsic to intermediate volcanics. The high resis- tive areas probably reflect mafic volcanics and/or limestone.

30
7.6 Electromagnetics
A line-by-line data quality check of the analog records was made of the electromagnetic data at the survey site and these were determined to be within the survey specifications outlined. All EM conductors were manually chosen from the analog charts and transferred to create a redball EM map.
The EM conductors picked off the analog tracer in the field were checked against an Aerodat proprietary selection program, producing a preliminary pick. This technique ensured that every conductor spotted in the analog response was plotted on the 4600 Hz profile map (Map 5 ) and geophysical interpretation (Map 12).
Approximately 570 anomalous responses were defined by Aerodat's proprietary selection software. The program chooses and calcu- lates conductivity thickness of individual conductors along the flight profile. The depths and conductivity thicknesses of the EM conductors were calculated from the 4600 Hz coaxial responses by Aerodat using a vertical thin conductor as a model (Appendix 111).
A comparison was made between the 935 Hz and 4600 Hz coaxial response to assist in determining conductor quality and attitude. For example, a strong response from both frequencies clearly indicates a bedrock conductor.
These interpreted EM conductors and their designations are shown on the 4600 Hz profiles (Map 5 ) and also the geophysical compila- tion (Hap 12). A total of 27 "cond.uctor groups" is interpreted, and these groups have Seen further subdivided into individual conductor trends. The conductors have been organized into Groups for discussion purposes, even though individual conductors within a particular group might be in very different geologic settings.

31
When interpreting the continuity between various conductors and grouping the conductors, an attempt was made to organize the groups so that all conductors shared similar trends or geophysical signatures within a group. A table of conductors was compiled and includes the relationship of the airborne geophysical results and ground geophysics, if applicable. An interpretation of geophysical results is noted in the last column of Table 1. These 27 conductor groups, which are presented on f4aps 5 and 12, are summarized as follows:
CONDUCTOR GROUP 1 comprises features extending over two eastern portion of the survey are coincident wth a magnetic entirely within Subdomain Ia, sediments and felsic volcanics
five closely spaced conductive or three flight lines near the area. Conductors lb,lc,ld, and le high feature. The conductors are this being interpreted to reflect . The EM features are interpreted
to reflect sulphide mineralization and/or graphitic sediments hosted in felsic volcanics.
CONDUCTOR GROUP 2 comprises four conductive features extending over two to seven flight lines. Conductors 2b and 2d are weak to moderate amplitude conductive features, which may possibly reflect a graphitic sediment unit or sulphide mineralization. Conductor 2c is situated near the area where Newmont tested a pulse EM conductor. The Newmont conductor was attributed to graphitic argillite (Turner, 1986).
CONDUCTOR GROUP 3 comprises six closely spaced linear conductive features within Subdomain Ia. The conductors are moderate to strong EM responses coincident in part with a magnetic high. Conductor 3d is situated close to the Road Showing mineraliza- tion. Conductor 3d has a strike length of 300 m, indicating the Road Showing nay possibly extend. further than what has been exposed on surface. Conductors 3e and 3f are coincident to the same magnetic feature as Conductor 3d. Conductors 3b and 3c are moderate to strong EM conductors with no association to magnetic features. These conductors are possibly reflecting non-magnetic sulphide mineralization or a graphitic argillite unit.
3 2
CONDUCTOR GROUP 4 comprises four conductor trends having weak to moderate strength within Subdomain Ia. Conductors 4b and 4c are coincident or flanking magnetic high features. These conductors are possibly reflecting a sulphide mineralized model with magnetic association. Conductor 4d has no magnetic association and is possibly reflecting sulphide mineralization with no related magnetic features.
CONDUCTOR GROUP 5 comprises two strong, persistent conductive features within Subdomain Ia. Conductors 5a and 5b are coin- cident with magnetic lows and are situated near a lithologic contact. North of Conductors 5a and 5b are numerous parallel to semiparallel conductors of variable strength and strike length: south of 5a and 5b there are only a few weak conductive trends. The magnetics and resistivities near 5a and 5b suggest a strong contrast in physical properties from north to south. Schiarizza (1985) has mapped the Vavenby Thrust Fault in the area of Conduc- tors 5a and 5b along a similar trend. Conductors 5a and 5b may reflect sulphide mineralization without magnetic associations or a graphitic argillite unit.
CONDUCTOR GROUP 6 comprises three moderate to strong, persistent conductive features within Subdomains Ia and Ib. Conductor 6c is flanking a magnetic high feature and possibly reflects sulphide mineralization and/or graphitic argillite. The ground position of Conductor 6c is located between the AFR Zone and the Road Showing and may reflect an extension of the AFR Zone.
CONDUCTOR GROUP 7 comprises four weak to moderate, variably continuous conductive features within Subdomain Ib. Conductor 7a is coincident with a narrow magnetic high feature. The ground position of Conductor 7a is located just east of the Nicanex Zone and is a possible extension eastward. Conductor 7a may reflect sulphide mineralization. Conductors 7b and 7d are flanking a magnetic high feature and possibly reflect sulphide mineralization or a graphitic argillite unit in a felsic to intermediate volcanic sequence.
L
3 3
CONDUCTOR GROUP 8 comprises two weak conductive features flanking
a magnetic high feature within Subdomain Ib. Conductors 8a and
8b possibly reflect sulphide mineralization or probably a graphi-
tic argillite unit.
CONDUCTOR GROUP 9 comprises seven conductive features coincident or flanking magnetic high features within Subdomain Ib. Conduc-
tors 9a through 9g probably reflect sulphide mineralization or a conductive argillite within a mafic volcanic sequence. There is
no recorded exploration in this area to date.
CONDUCTOR GROUP 10 comprises five moderate to strong conductive
features coincident with magnetic high features within Subdomain Ib. Conductors 10a, lob, and 10d are all coincident with the
same magnetic feature and probably reflect sulphide mineraliza- tion north of and parallel to the Nicanex Zone. There does not appear to have been any previous exploration in this area.
CONDUCTOR GROUP 11 comprises four weak to moderate conductive
features having short strike lengths within Subdomain Ib. Conductor llc is flanking a magnetic high feature and Conductor lld is coincident with a magnetic high feature. The positions of
Conductors llc and lld are situated near the location of the Nicanex Zone and may reflect sulphide mineralization.
CONDUCTOR GROUP 12 comprises eight moderate conductive features
within Subdomains Ia and Ib. In general, these conductors have no magnetic association with the exception of Conductor 12h which flanks a magnetic high feature. Conductors 12a through 12h may
reflect sulphide mineralization or probably reflect graphitic argillite in a felsic to intermediate volcanic sequence.

34
CONDUCTOR GROUP 13 comprises seven moderate conductive features within Subdomain Ia. Conductors 13a through 13g are not asso- ciated with any magnetic features and may reflect sulphide mineralization or probably graphitic argillite in a felsic volcanic sequence.
CONDUCTOR GROUP 14 comprises a single weak conductive feature within Domain 11.
CONDUCTOR GROUP 15 comprises a single weak conductive feature within Domain I.
CONDUCTOR GROUP 16 comprises a single weak conductive feature within Domain 11.
CONDUCTOR GROUP 17 comprises three weak conductive features within Domain 11. Conductor 17c flanks a magnetic high feature near the contact between Domain I and Domain 11. Conductors 17a through 17c may reflect graphitic argillite in a mafic volcanic sequence or possibly a shear/fault zone.
CONDUCTOR GROUP 18 comprises two weak to moderate conductive features within Subdomain Ia. Conductors 18a and 18b are not associated with any magnetic features and may reflect sulphide mineralization or probably graphitic argillite in a felsic volcanic sequence or possibly a shear/fault zone.
CONDUCTOR GROUP 19 comprises six weak to moderate conductive features within Subdomain Ia and these conductors are not associated with any magnetic features. Conductors 19a and 19b are continuous over 1000 m or more and may reflect sulphide mineralization or probably graphitic argillite in a felsic volcanic sequence or possibly a shear/fault zone.
CONDUCTOR GROUP 20 comprises two weak conductive features within Subdomain Ia and is not associated with any magnetic features.
35
CONDUCTOR GROUP 21 comprises two moderate conductive features within Subdomain Ia which are not associated with any magnetic features.
CONDUCTOR GROUP 22 comprises a single weak conductive feature within Domain I near the interpreted contact between Domains I and 11.
CONDUCTOR GROUP 23 comprises two weak to moderate conductive features within Domain I which are not associated with any magnetic features.
CONDUCTOR GROUP 24 comprises two weak, very persistent conductive features parallel to the contact between Domains I and 11. Conductor 24a has a strike length of 1400 m and is coincident with a 1500 m long VLF-EM conductor located by Krangeld and when tested by drilling was determined to reflect a shear/fault zone (Freeze and Troup, 1984).
CONDUCTOR GROUP 25 comprises three weak to moderate conductive features within Domain I and is located near the interpreted contact between Domains I and 11. Conductor 25b is 1000 m along strike and may reflect a shear/fault zone.
CONDUCTOR GROUP 26 comprises three strong conductive features within Domain I and is located near the interpreted contact between Domains I and 11. Conductors 26a through 26c are of short strike length and are not associated with any magnetic features. These conductors may reflect sulphide mineralization or probably graphitic argillite in an intermediate to mafic volcanic sequence.
CONDUCTOR GROUP 27 comprises two strong conductive trends within Subdomain Ia and is not associated with any magnetic features. These conductors may reflect sulphide mineralization or probably graphitic argillite in a felsic to intermediate volcanic sequence.
C m
3 6
8 . 0 CONCLUSIONS
From the helicopter borne geophysical surveys, a lithological and structural interpretation was made. The magnetic data sets defined Domains I, I1 and 111. Domain I was further defined as Ia and Ib by the resistivity data sets. The table below shows the domains, general geophysical characteristics and possible lithologic unit.
Lithologic Domain Geophysical Characteristics Units
I Low to moderate magnetic amplitudes, sediments in a quiescent patterns, low to moderate felsic volcanic resistivities sequence
Ia and Ib have higher magnetic susceptibility units within Domain I
Ia defined by lower resistivities sediments in a
Ib defined by moderate resistivity intermediate felsic ,grading to
volcanic sequence
I1 Highest magnetic amplitudes and mafic volcanics, highest resistivity amplitudes limestone(?)
I11 Moderate magnetic amplitudes exhibiting variable patterns, moderate to high resistivity amplitudes
intermediate to mafic volcanics
The structural interpretation has been kept to simply defining two fault directions, from the geophysical data sets. North to northeast and east to west trending faults are interpreted as either major or minor faults. The magnetic data sets strongly reflect folding in the northeast and western portions of the survey area. These areas appear to be very complex and require more ground geology/geophysics information in order to make any further structural interpretation.
37
The electromagnetic survey defined several conductive features. These conductors may reflect sulphide mineralization or litho- logic units, i.e. graphitic argillite. A thorough overview of all exploration to date on the Elila property was carried out in order to relate specific conductive responses to geologic features. This is discussed in section 7.1.
Examination of the geophysical data from the airborne survey in conjunction with the limited ground data indicates five high priority areas for additional exploration. They are:
Conductor qroup 3 exhibits a strong EM response over 300 m to 500 m of strike length and is coincident with magnetic highs. The conductor group appears coincident to or very near the Road Showing mineralization. Conductive feature 3d indicates this showing to have a 300 m strike length. These conductors are at or near a strong contrast observed in the EM, magnetics and resistivity data sets which possibly is reflecting the Vavenby Thrust Fault.
Coincident strong EM conductors and magnetics present a positive indicator of metallic mineralization. Directly relating the Road Showing to the EPl conductors strongly supports the interpretation of sulphide mineralization, possibly reflecting exploration models 1, 2 or 3 as out- lined in section 5.3.1.
Conductor qroups 6 and 7 exhibit strong EM responses with a 2 4 0 0 m strike length flanking a narrow magnetic anomaly and may reflect exploration models 1 and 2 outlined in section 5.3.1. Conductor groups 6 and 7 are ground positioned between the AFR Zone and Road Showing and are possible extensions of these mineralized showings.
Conductor qroup 10 exhibits strong E f l responses coincident with a magnetic feature over a 500 r;l strike length and

38
similar geophysical characteristics to Conductor group 3
near the Road Showing mineralization. The approximate position of Conductor group 10 lies north of a mineralized zone located by Nicanex Mines (Chisholm, 1 9 7 0 ) and possibly reflects an untested parallel zone.
4 ) Conductor qroup 9 exhibits moderate EM responses coincident with magnetic features along a 400 m strike length also similar to Conductor group 3 geophysical responses. Conduc- tor group 9 appears to be an untested mineralized area noted here and is possibly a new zone similar to the Road Showing.
5 ) Conductor qroup 2 4 exhibits a weak to moderate EM response over 1400 m. The magnetics and VLF-EH are interpreted to reflect a fault structure. Conductor group 24 is related to a position coincident with a ground VLF-EM anomaly located by Freeze and Troup ( 1 9 8 4 ) and tested by diamond drilling to be a mineralized shear zone. This conductor is generally untested along strike and the strongest conductive zones are yet to be tested.
Several second priority targets are noted in section 7.6 and are worthy of testing as well. However, priority was given to areas of known mineralization and targets having significant geophysi- cal similarities to areas of known mineralization. The targets were pared down to the five conductive groups discussed here.
39
9.0 RECOMMENDATIONS
Based on the preceding interpretations and conclusions and in the context of the previously stated exploration models, the follow- ing is recommended to further explore the potential of the property:
Detailed geologic mapping to be integrated into current geological and geophysical data base in order to assess additional EFI conductors located by the airborne geophysical survey.
Delineate the five high priority targets as defined in the conclusions as well as others subsequently defined in (l), with ground HLEEl, Induced Polarization and magnetic surveys.
Contingent upon the results, trenching of the more pros- pective conductors if overburden is determined to be sufficiently shallow, and/or diamond drilling.
Respectfully submitted /”:
Kevin D. Lund, BSc. Geophysicist
Vancouver, B.C. September 8, 1 9 8 9
4 0
CERTIFICATE
I, Kevin D. Lund, do hereby certify:
1) That I am a Consulting Geophysicist with business offices at 2406 - 555 West Hastings Street, Vancouver, B.C. V6B 4N5.
2) That I am a graduate in Geological Engineering of Nichigan Technological University, Houghton, Michigan, USA (BSc., 1983).
3) That I have practised within the geological profession for the past eight years.
4 ) That the opinions, conclusions and recommendations contained herein are based on field work carried out on the property from February 12, 1989 to February 14, 1989.
5) That I own no direct, indirect, or contingent interests in the subject property or shares or securities of Goldbank Ventures Ltd. or associated companies.
Kevin D. Lund, BSc.
Vancouver, B.C. September 8, 1989
4 1
REFERENCES
B u r g e s s , S. 1 9 8 1 . G e o l o g y , G e o p h y s i c s a n d G e o c h e m i s t r y , A f t e r
You P r o p e r t y . AR 9959
C a m p b e l l , R.B. a n d T i p p e r , H.W. 1 9 7 1 . B o n a p a r t e L a k e Elap-area,
B r i t i s h C o l u m b i a , G e o l o g i c a l S u r v e y of C a n a d a , Memoir 3 6 3 ,
1 0 0 p a g e s
C h i s h o l m , E .O. 1 9 7 0 . A G e o c h e m i c a l R e p o r t o n t h e ESP Group .
C h r i s t o p h e r , P. 1 9 8 8 . R e p o r t o n t h e J a r and Hila C l a i m s .
C o r v a l a n , I . R . 1 9 8 4 . R e p o r t o n G e o c h e m i c a l S u r v e y , C H I C l a i m .
C r o s b y , R.O. 1 9 7 0 . Report o n a n I n d u c e d P o l a r i z a t i o n S u r v e y ,
Dawson, J.M. 1 9 7 8 . G e o l o g i c a l , G e o c h e m i c a l a n d G e o p h y s i c a l
AR 2676
AR 1 2 4 6 5
ESP Group. AR 2677
Report o n t h e P i p e a n d E x h a l i t e C l a i m G r o u p s . AR 6 9 3 3
Dawson, J . M . 1 9 7 9 . R e p o r t o n P e r c u s s i o n D r i l l i n g o n t h e P i p e C l a i m Group. AR 7119
F r e e z e , J . C . a n d T r o u p , A.G. 1 9 8 4 . Diamond D r i l l i n g R e p o r t o n
t h e A f t e r You P r o p e r t y . AR 9959
G e o l o g i c a l S u r v e y of Canada 1 9 7 3 . G e o p h y s i c a l S e r i e s (Aeromag-
K r u z i c k , J . H . 1976 . A s s e s s m e n t G e o l o g i c a l R e p o r t o n t h e VAV
n e t i c ) Map o f Vavenby , B.C. Map 85236
C l a i m . AR 5909
L i m i o n , H. 1 9 8 5 . R e p o r t o n G e o p h y s i c a l Ground S u r v e y s o n t h e
Reg 2 a n d 3 M i n e r a l C l a i m s , r l a g n e t i c and E l e c t r o m a g n e t i c
P u l s e S u r v e y s . AR 1 4 5 0 5
N a y l o r , H. a n d W h i t e , L.G. 1 9 7 1 . Report on G e o l o g i c a l a n d Geo-
c h e m i c a l S u r v e y s o f VM 81 a n d # 2 , VA # 1 a n d # 2 . AR 3525
Nebocat, J . 1985 . G e o l o g i c a l a n d Geochemical R e p o r t o n t h e REG
1-8 C l a i m s . AR 1 3 5 5 7
P a l a c k y , G . J . 1 9 8 6 . A i r b o r n e R e s i s t i v i t y H a p p i n g . GSC P a p e r
86 -22 , p . 1 9 5
P e t r o , V.A. a n d S c h i a r i z z a , P. 1 3 8 4 . Geology a n d M i n e r a l
D e p o s i t s of t h e Adams P l a t e a u - C l e a r w a t e r R e g i o n . BCAR
p . 1 6
c
42
P i r i e , I . 1989 . The Samatosurn D e p o s i t , N o r t h e r n M i n e r M a g a z i n e ,
J u n e 1 9 8 9 , p . 15-18
S c h i a r i z z a , P. 1 9 8 5 . Geo logy of t h e E a g l e Bay F o r m a t i o n Between
t h e R a f t a n d B a l d y B a t h o l i t h s . BCAR p. 8 9
S c h i a r i z z a , P. a n d P r e t o , V.A. 1 9 8 7 . Geo logy of t h e Adams
Plateau-Clearwater-Vavenby Area. M i n i s t r y o f E n e r g y , Mines
a n d P e t r o l e u m R e s o u r c e s , P a p e r 1987-2 , 88 p a g e s
T e l f o r d , W . M . , e t . a l . 1 9 7 6 . A p p l i e d G e o p h y s i c s C a m b r i d g e
U n i v e r s i t y P r e s s , P. 860
T u r n e r , J . A . a n d L i m i o n , H . 1 9 8 4 . G e o l o g i c a l , G e o p h y s i c a l a n d
G e o c h e m i c a l R e p o r t o n t h e r4cCorvie 1-5 C l a i m s . AR 13560
T u r n e r , J . A . 1 9 8 5 . Geological a n d G e o c h e m i c a l Report o n t h e Reg
2 a n d 3 C l a i m s , p r i v a t e repor t T u r n e r , J . A . 1 9 8 6 . Diamond D r i l l R e p o r t o n t h e Clearwater
P r o j e c t , p r i v a t e r e p o r t V a l e n t i n i , A.E. 1 9 8 9 . A e r o d a t L i m i t e d R e p o r t o n Combined
H e l i c o p t e r B o r n e M a g n e t i c , E l e c t r o m a g n e t i c a n d VLF-EM S u r v e y ,
Vavenby A r e a , B.C. ( p r i v a t e r e p o r t )
Walcott , P.E. 1 9 7 0 . A G e o p h y s i c a l Report on a Ground M a g n e t i c
S u r v e y o n t h e ESP C l a i m Group. AR 2678

A P P E N D I X I
List of Personnel and
Statement of Expenditures

L I S T OF PERSONNEL AND STATEMENT OF EXPENDITURES
The following expenses have been incurred on the Jar 1-3 and flila 1-5 claims for the purpose of mineral exploration. Field work was carried out from February 12 through February 14, 1989.
Field Costs
Personnel: K . Lund, BSc.
2. Dvorak, Consultant 4 days @ $350
4 days @ 600
Equipment Rental : 4WD Truck 4 days @ $90
Disbursements:
Food Accommodation Fuel llisc. (toll)
15% administration
Contractor:
Aerodat Limited Mobilization/demobilization 492 line-km @ $85/km
Report Costs
Personnel:
$ 1,400.00
2,400.00 $ 3,800.00
360.00
202.55 207.36 104.16 20.00
534.07 ’ 80.11
614.18
1,250 .OO 41,820.00
K. Lund, BSc. 5 days @ $350 Report Reproduction (Dominion) 106.49
13 hrs @ 25 325.00 431.49
Dra f t ing
15% administration
43,070.00
1,750 .OO
64.72 496.21
Field and Report Costs $50 ,090 .33

c
APPENDIX I1
General Interpretive Considerations
APPENDIX I1
GENERAL INTERPRETATION CONSIDERATIONS
(from Aerodat Limited logistical write-up)
Electromagnetic
The Aerodat four-frequency system utilizes two different trans- mitter/receiver coil geometries. Widely separated frequencies were employed with one frequency approximately the same for both coil configurations. The frequencies utilized were 935 Hz and 4600 Hz for the coaxial coil pairs, and 4175 Hz and 30,000 Hz for the coplanar coil pairs.
The electromagnetic response measured by the helicopter system is a function of the electrical and geometrical properties of the specific conductor and its lithologic host.
The electrical properties of a conductor are determined largely by its conductivity, magnetic susceptibility, size and shape. The geometrical properties of a response ,are mainly the function of the conductor's shape and also the conductor's orientation with respect to the flight lines or the measuring transmitter and receiver system.
For a given conductive body, the measure of conductance is closely related to the phase shift measured between the receiver and transmitter. A small phase shift indicates a very good conductor whereas a large phase shift indicates a conductor of low conductance.
The ratio of the in-phase and quadrature amplitudes is a quanti- tative measure of the conductance: a large ratio indicates a strong conductor whereas a poor conductor will be reflected in a
very low ratio.

Appendix 11.2
A non-magnetic vertical half-plane model and the amplitudes, in ppm of the primary field, recorded at the response peak over the conductor from the 4 6 0 0 Hz coaxial coil configuration results are used to calculate the conductor strengths (conductances in mhos) and depths. These are shown on Maps 5 and 12 and tabulated in Appendix 111.
The in-phase amplitudes are also presented with the conductances in symbolized form on the electromagnetic profiles (Maps 5 and 12).
The conductance and depth values presented are correct only as far as this very simple model will allow. In reality, these values are only approximations as the geological source may be of limited strike length, have limited depth extent, be highly magnetic in or beneath conductive overburden. In general, the conductance estimate is least affected by all of these limita- tions. However, the depth estimate should be considered as relative and treated with caution.
The conductance of most overburden responses will be in the order of two mhos or less. In the case of conductive clays, an apparent conductance of two to four mhos may be measured. The conduc- tances of faults and shear zones, which might be of exploration interest in the context of gold exploration models, unfortunately also fall mainly within this range. However, some discrimination is possible as the overburden and clay lenses are generally laterally extensive while faults and shear zones tend to be of narrow width but large strike extent. These are reflected by large and short wavelength responses, respectively.
Any conductances between four and ten mhos might be reflecting disseminated or stringer metallic sulphides and/or graphite. Higher conductances tend to reflect seni-massive or massive sulphides and/or graphite.

Appendix 11.3
Sphalerite, cinnabar, stibnite are sulphides that can inhibit the electrical conductivity of the sulphide assemblage.
Some geometric information about the bedrock conductor may be interpreted from the anomalous response shape profile. These changes in the anomaly shapes are related to a change in the inductive coupling between the transmitter, target, and receiver.
In the case of a steeply dipping, sheet-like conductor, the response from the coaxial pair would be a symmetric peak directly over the conductor. The response from a coplanar pair over the same conductor will pass through a null relationship and yield minimum directly over the conductor. If the dip is changed, the response seen on the coaxial pair will change little while the coplanar pair will change with the side lobe on the downdip side, strengthening relative to that of the updip side.
If the thickness of the steeply dipping conductor is increased from very thin to reflect a block rather than a plate, the the responses from the coaxial and coplanar pairs will be the same with a peak directly over the conductor. No apparent minimum of the coplanar response will be seen directly over the conductor.
In summary, therefore, a steeply dipping sheet-like conductor will display a decrease in the coplanar response coincident with the peak of the coaxial response. The relative strength of this coplanar null will be related inversely to the thickness of the conductor. A very pronounced null indicates a relatively thin conductor. The dip of a conductor can be inferred from the amplitudes of the side lobes of a very thin conductor. Massive conductors could be approximated and should display a single, simple peak profile from both the coaxial and coplanar coils, with an expected ratio between the coplanar to coaxial to be
approximately 8 : l .

Appendix 11.4
If a flat line conductive layer, such as overburden, is modelled, the response of the coaxial and coplanar coils is a function of the altitude. The profile shapes will be similar in both coil configurations, but the coplanar response may be expected to be
four times greater than the coaxial response. Overburden anomalies tend to produce broad poorly defined profiles.
The magnetometer data was digitally recorded in the airgraph and measured to an accuracy of 0.1 nT by the cesium vapour magneto- meter. The digital tape was then processed by a computer to make the necessary diurnal corrections with the base mag.
The final total field magnetic contour map is uncorrected for regional variances.
If the geophysicist should choose, the magnetic data may also be processed mathematically to enhance either short wavelength responses of near surface bedrock features or the magnetic responses of lithologic units. In this case, a vertical deriva- tive has been calculated to create a vertical gradient contour map (Map 7 ) which enhances near surface responses and is a useful aid, combined with the total field magnetic map, in defining lithologic and structural features.
Depending on the geological model and type of mineralization expected, one might be searching for EM conductors having a coincident or semicoincident magnetic anomaly. These conductors may reflect sulphides containing pyrrhotite and/or magnetite or sulphides closely associated with mafic volcanics for example. If the conductor is also magnetic, it will usually produce an EM anomaly, whose general pattern resembles that of the magnetics. This can be seen in the amplitudes of the in-phase of the EM
anomaly which will be weakened. In addition, if the conductance is also low, the in-phase EIl anomaly may even be reversed in sign, providing the magnetic sulphide concentration is high enough within the conductor.

Appendix 11.5
Kes is t ivi ty
The apparent re istivity maps are c lculated from the rela- tionship between the in-phase to quadrature amplitudes at a particular transmitting frequency from the EM survey: at 33,000 Hz from the coplanar and 4 , 6 0 0 Hz from the coaxial coil pairs. The calculated apparent resistivity is a useful mapping tool. Anomalies caused by altitude changes are virtually eliminated s o that, in effect, the resistivity data reflects only those anomalies caused by conductivity changes. The interpreter can differentiate between conductor trends, gross bedrock, and lithological changes typical of conductive overburden. For example, discrete conductors will generally appear as narrow, low amplitude features and broad conductors such as overburden will appear as very wide, low amplitude responses.
The model used for generating resistivity maps is a buried half space model. The model consists of a resistive layer, 200 m of apparent thickness, overlying a conductive half space. Actually, in a geologic sense this layer is very variable, but by choosing 200 m it is presumed that we are investigating bedrock features only beneath the overburden after accounting for the altitude of the "bird . I '
The input values into the resistivity algorithm are the in-phase and quadrature components of the coplanar or coaxial pair results from the selected frequency. The output is the apparent resis- tivity of a conductive half-space and the sensor-source separa- tion. The apparent depth to the bedrock feature is simply the source-sensor distance minus the measured altitude or flying height. The errors in measured altitude will directly affect the apparent depth parameter but not the apparent resistivity amplitude.
-
Appendix 11.6
The apparent depth parameter can be a useful indicator of layer- ing and has been used for permafrost mapping where the apparent depths were used as a measure of the permafrost thickness. For the most part, little quantitative use can be made of the apparent depths. The resistivity map often provides more useful information about the bedrock conductivity distribution than the EM map. The EM map portrays discrete anomalies in regions of higher or changing resistivity; that is, an EM map emphasizes changes from the norm such as bedrock conductors or lithologic/ electrical contacts.
VLF-EM
The VLF method makes use of the radiation from powerful military radio transmitters as its primary signal. The field associated with the primary field is elliptically polarized in the vicinity of electrical conductors. A Hertz Totem 2A receiver uses three coils that are in an XYZ configuration to measure the total field and vertical quadrature components of two stations. The trans- mitting frequencies of VLF transmitting stations lie between 15 and 25 Kh and therefore.generally result in high response factors for bodies with low conductance: for example, disseminated sulphide ores have been found to produce a measurable VLF signal. For this same reason, poor conductors such as shear contacts, breccia zones, fault zones, alteration zones, and flow tops may also produce VLF anomalies.
This method can be used effectively as a geologic mapping tool. The major disadvantages of this method are its shallow depth of investigation and its sensitivity to conductive overburden and variations in topography. In conductive ground, the depth of exploration is severely limited. The total field response is an indicator of the axial location of the conductor being a maximum directly over the conductor.

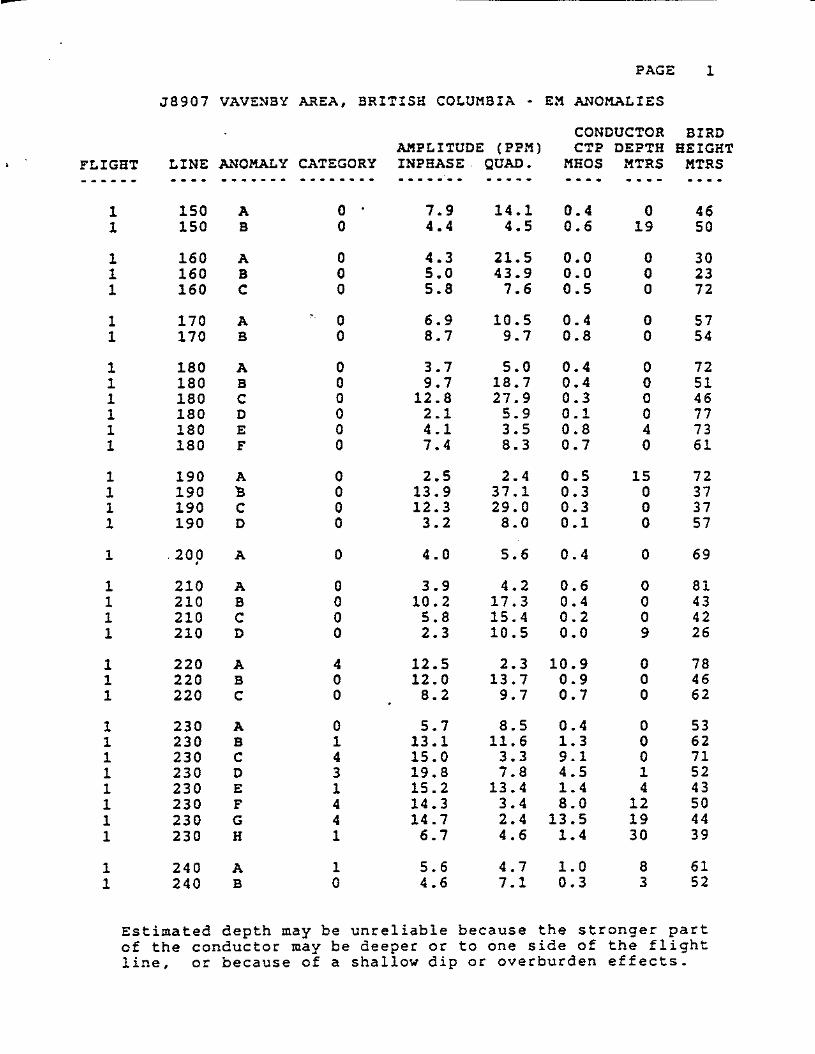
APPENDIX I11
EM Anomaly L i s t
1 1
1 I 1
1 1
1 1 1 1
1
1 1 1 1
1 1 1
1 1
PAGE: 1
58907 VAVENBY AREA, BRITISH COLUMBIA - EX ANOMALIES CONDUCTOR BIRD
AMPLITUDE (PPM) CTP DEPTH HEIGHT LINE ANOMALY CATEGORY INPHASE. QUAD. - - - - 150 150
160 160 160
170 170
180 180 180 180 180 180
190 190 190 190
.200
210 210 210 210
220 220 220
230 230 230 230 230 230 230 230
240 240
A B
A B C
A B
A B C D E F
A B C D
A
A B C D
A B C
A B C D E F G H
A B
0 0
0 0 0
.. 0 0
0 0 0 0 0 0
0 0 0 0
0
0 0 0 0
4 0 0
0 1 4 3 1 4 4 1
1 0
7.9 4.4
4.3 5.0 5.8
6.9 8.7
3.7 9.7
12.8 2.1 4.1 7.4
2.5 13.9 12.3 3.2
4.0
3.9 10.2 5.8 2.3
12.5 12.0 8.2
5.7 13.1 15.0 19.8 15.2 14.3 14.7 6.7
5.6 4.6
14.1 4.5
21.5 43.9 7.6
10.5 9.7
5.0 18.7 27.9 5.9 3.5 8.3
2.4 37.1 29.0 8.0
5.6
4.2 17.3 15.4 10.5
2.3 13.7 9.7
8.5 11.6 3.3 7.8
13.4 3.4 2.4 4.6
4.7 7.1
MHOS ---. 0.4 0.6
0.0 0.0 0.5
0.4 0.8
0.4 0.4 0.3 0.1 0.8 0.7
0.5 0.3 0.3 0.1
0.4
0.6 0.4 0.2 0.0
10.9 0.9 0.7
0.4 1.3 9.1 4.5 1.4 8.0
13.5 1.4
1.0 0.3
MTRS ---. 0
19
0 0 0
0 0
0 0 0 0 4 0
15 0 0 0
0
0 0 0 9
0 0 0
0 0 0 1 4
12 19 30
8 3
MTRS .--- 46 50
30 23 72
57 54
72 51 46 77 73 61
72 37 37 57
69
81 43 42 26
78 46 62
53 62 71 52 43 50 44 39
61 52
Estimated depth may be unreliable because the stronger part of the conductor may be deeper or to one side of the flight line, or because of a shallow dip or overburden effects.

1 1 1 I 1 1 1 1 1 .
1 1 1 1 1 1 1 1 1 1 1
PAGE 2
58907 VAVENBY AREA, BRITISH COLUMBIA - EM ANOMALIES CONDUCTOR BIRD
AMPLITUDE (PPM) CTP DEPTH HEIGHT LINE ANOMALY CATEGORY INPHASE QUAD. MHOS - - - - 240 240 240 240 240
250 250 250 250 250 250 250 250 250
260 260 260 260 260 260 .260 260 260
270 270 270 270 270 270 270 270 270 270 270
280 280 280 280 280 280 280
C D E F G
A B C D E F G H J
A B C D E F G H J
A B C D E F G H J K M
A B C D E F G
2 - 8.7 3 3 4 0
4 .. 5
3 2 4 4 4 2 0
3 4 3 3 3 3 0 0 0
0 0 0 0 0 2 4 3 5 4 2
1 0 4 2 0 0 0
6.6 19.5 23.5 7.6
31.9 37.0 18.3 20.1 32.5 25.1 5.9 6.2 5.5
5.2 15.7 25.6 23.5 13.9 16.1 6.0 7.4 6.3
10.6 5.5 9.9 5.1 8.9
28.0 . 46.4
22.2 24.7 7.6 6.4
11.1 9.6
13.8 9.7 8.4 7.3 8.1
3.2 1.7 7.7 4.3
16.7
7.1 4.5 5.5 9.5 8.4 4.5 0.9 2.3
13.1
1.6 2.6 8.3 6.5 5.0 6.0
13.0 13.6 19.5
11.6 17.2 21.6 11.1 11.4 14.8 11.0 8.2 3.1 1.3 2.6
10.2 14.8 2.7 3.8
13.6 18.5 18.8
3.8 5.6 4.4
13.3 0.3
11.2 26.2 6.3 3.5 9.2
13.9 11.3 3.3 0.2
4.0 13.5 6.3 7.6 4.5 4.5 0.2 0.3 0.1
0.9 0.1 0.3 0.2 0.6 3.4
11.4 5.1
22.4 10.4 2.9
1.1 0.5
10.4 3.6 0.4 0.2 0.2
MTRS - - - - 9 0 0 0 0
6 0 0 0 0 0
16 41 0
0 0 0 0 0 0 0 5 0
7 0 0 0 0 1 0 2 0
23 32
0 0 0 0 0 0 0
MTRS - - - - 62
101 79 62 42
41 62 77 64 61 61 71 39 42
96 83 68 78 75 69 53 37 35
42 52 47 57 51 44 51 50 53 56 46
63 53 76 72 54 52 49
Estimated depth may be unreliable because the stronger part of the conductor may be deeper o r to one side of the flight line, or because of a shallow dip or overburden effects.
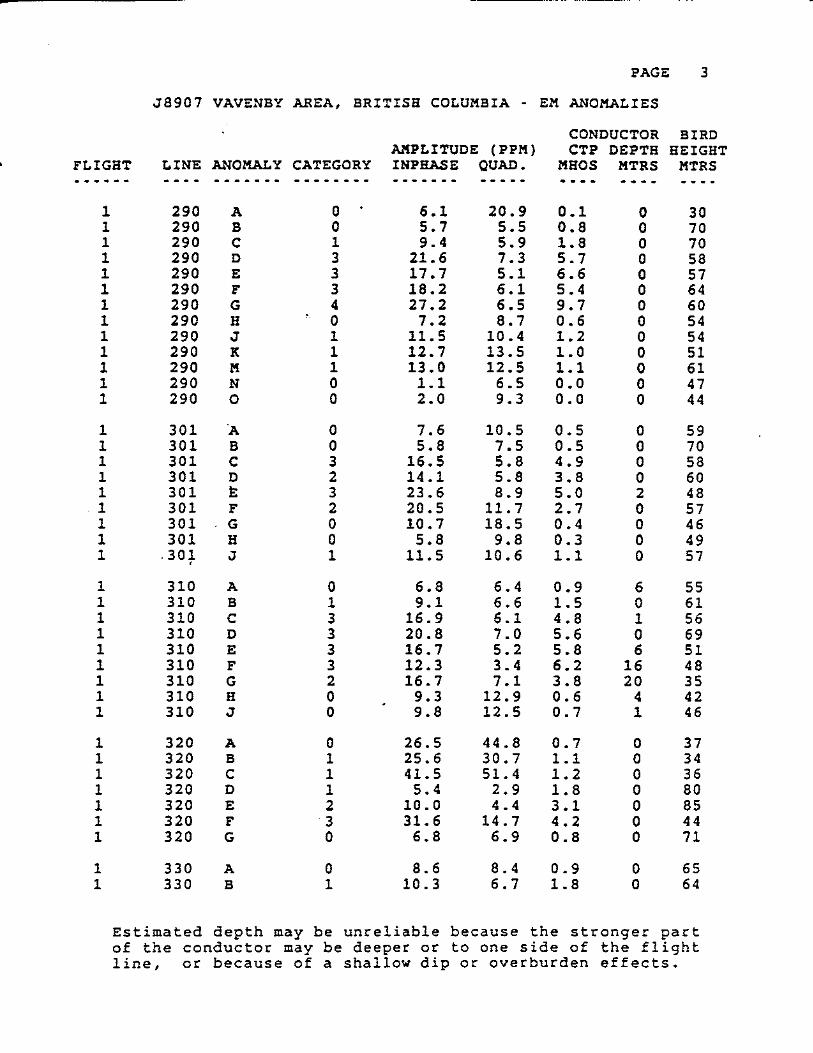
PAGE 3
58907 VAVENBY AREA, B R I T I S H COLUMBIA - EM ANOMALIES
1 I 1 1 1 1 1 1 1 1 1 1 1
290 290 290 290 290 290 290 290 290 290 290 290 290
A B C D E F G H J K M N 0
0 - 0 1 3 3 3 4
:, 0 1 1 1 0 0
6.1 5.7 9.4
21.6 17.7 18.2 27.2 7.2
11.5 12.7 13.0 1.1 2.0
20.9 5.5 5.9 7.3 5.1 6.1 6.5 8.7
10.4 13.5 12.5 6.5 9.3
0.1 0.8 1.8 5.7 6.6 5.4 9.7 0.6 1.2 1.0 1.1 0.0 0.0
0 0 0 0 0 0 0 0 0 0 0 0 0
30 70 70 58 57 64 60 54 54 51 61 47 44
301 301 301 301 301 301 301 301 .30+
310 310 310 310 310 310 310 310 310
'A B C D B F G H J
7.6 5.8
16.5 14.1 23.6 20.5 10.7 5.8
11.5
10.5 7.5 5.8 5.8 8.9
11.7 18.5 9.8
10.6
0.5 0.5 4.9 3.8 5.0 2.7 0.4 0.3 1.1
59 70 58 60 48 57 46 49 57
6.8 9.1
16.9 20.8 16.7 12.3 16.7 9.3 9.8
6.4 6.6 6.1 7.0 5.2 3.4 7.1
12.9 12.5
A B C D E F G B J
0.9 1.5 4.8 5.6 5.8 6.2 3.8 0.6 0.7
6 0 1 0 6
16 20 4 1
55 61 56 69 51 48 35 42 46
320 320 320 320 320 320 320
A B C D E F G
26.5 25.6 41.5 5.4
10.0 31.6 6.8
44.8 30.7 51.4 2.9 4.4
14.7 6.9
0.7 1.1 1.2 1.8 3.1 4.2 0.8
37 34 36 80 85 44 71
1 1
330 330
A B
0 1
8.6 10.3
8.4 6.7
0.9 1.8
0 0
65 64
Estimated depth may be unreliable because the stronger part of the conductor may be deeper or to one side of the flight line, or because of a shallow dip or overburden effects.
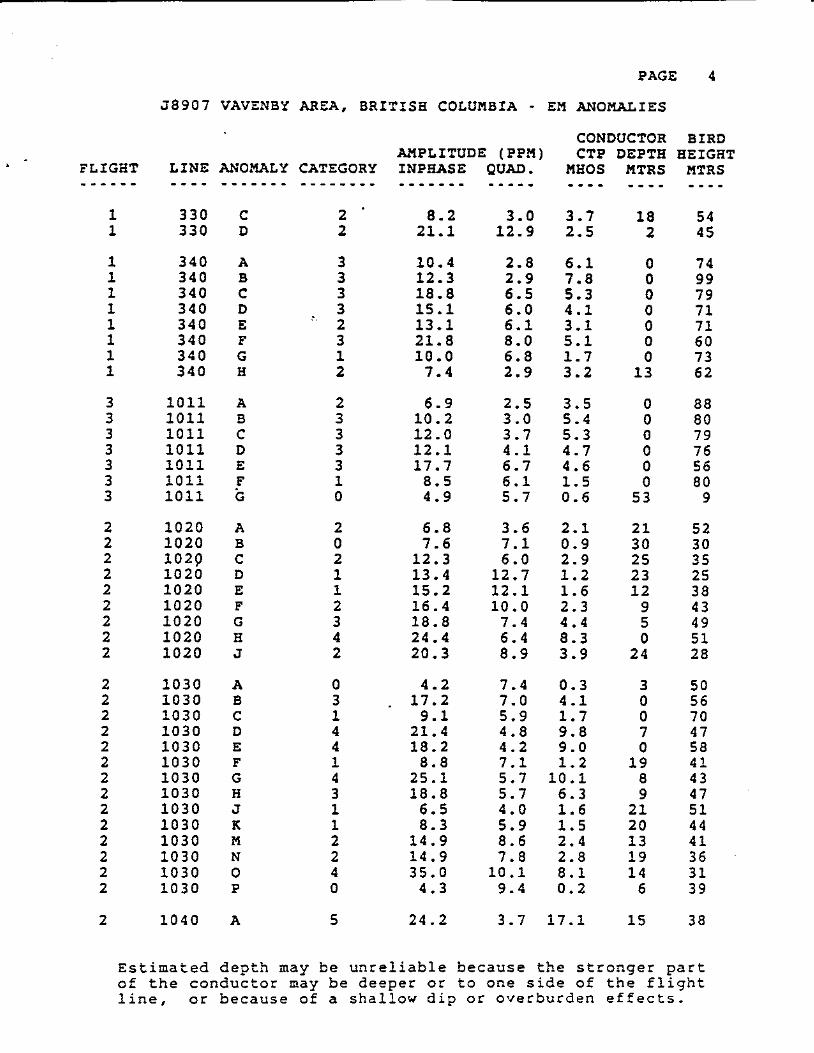
1 1
2 2 2 2 2 2 2 2 2 2 2 2 2 2
2
PAGE 4
58907 VAVENBY AREA, BRITISH COLUMBIA - EM ANOMALIES
330 C 2 - 8.2 3.0 3.7 18 54 330 D 2 21.1 12.9 2.5 2 45
340 A 340 B 340 C 340 D 340 E 340 F 340 G 340 H
3 3 3 3
?' 2 3 1 2
10.4 12.3 18.8 15.1 13.1 21.8 10.0 7.4
2.8 6.1
6.5 5.3 6.0 4.1 6.1 3.1 8.0 5.1
2.9 3.2
2.9 7.8
6.8 1.7
0 0 0 0 0 0 0
13
74 99 79 71 71 60 73 62
1011 A 2 6.9 2.5 3.5 0 88 1011 B 3 10.2 3.0 5.4 0 80 1011 c 3 12.0 3.7 5.3 0 79 1011 D 3 12.1 4.1 4.7 0 76 1011 E 3 17.7 6.7 4.6 0 56 1011 F 1 8.5 6.1 1.5 0 80 1011 G 0 4.9 5.7 0.6 53 9
1020 A 1020 B
1020 D 1020 E 1020 F 1020 G 1020 H 1020 J
1029 c
1030 1030 1030 1030 1030 1030 1030 1030 1030 1030 1030 1030 1030 1030
A B C D E F G H J K M N 0 P
0 3 1 4 4 1 4 3 1 1 2 2 4 0
6.8 7.6
12.3 13.4 15.2 16.4
24.4 20.3
18.8
3.6 2.1 7.1 0.9 6.0 2.9
12.7 1.2 12.1 1.6 10.0 2.3 7.4 4.4 6.4 8.3 8.9 3.9
4.2 7.4 0.3 . 17.2 7.0 4.1
9.1 5.9 1.7 21.4 4.8 9.8 18.2 4.2 9.0 8.8 7.1 1.2
25.1 5.7 10.1 18.8 5.7 6.3 6.5 4.0 1.6 8.3 5.9 1.5
14.9 8.6 2.4 14.9 7.8 2.8 35.0 10.1 8.1 4.3 9.4 0.2
21 30 25 23 12 9 5 0
24
52 30 35 25 38 43 49 51 28
3 50 0 56 0 70 7 47 0 58
19 41 8 43 9 47
21 51 20 44 13 41 19 36 14 31 6 39
1040 A 5 24.2 3.7 17.1 15 38
Estimated dep of the conduc line, or bec
'th may tor may ause of
be I be a
unrel deep shall
iable er or ow dip
be to ' 0
cause one
r ove
' th sid rbu
e st e of rden
K 'onger part the flight effects.

& FLIGHT
2 2 2 2 2 2 2 2 2 2 2 2
PAGE 5
58907 VAVENBY AREA, BRITISH COLUMBIA - EM ANOMALIES
LINE - - - - 1040 1040 1040 1040 1040 1040 1040 1040 1040
1050 1050 1050 1050 1050 1050 1050 1050 1050 1050 1050 1050
106b 1060 1060 1060 1060 1060 1060 1060 1060
1070 1070 1070 1070 1070 1070
1080 1080 1080
1080 ioao
ANOMALY - - - - - - - B C D E F G H J K
A B C D E F G H 3 K M N
A B C D E F G H J
A B C D E F
A B C D E
CATEGORY - - - - - - - - 5 . 2 4 5 4 4 3
:. 4 0
6 6 2 2 2 3 3 2 2 3 6 6
1 4 4 2 3 4 3 3 6
0 2 4 4 4 1
1 3 4 6 4
CONDUCTOR AMPLITUDE (PPM) CTP INPHASE - - - - - - - 25.9 9.2
10.6 14.6 12.6 12.6 13.3 23.7 3.8
5.7 10.8 19.1 9.6 9.4
18.3 21.7 17.3 8.9 5.9
18.0 21.8
6.6 32.1 26.9 11.4 24.7 28.7 7.9
13.5 14.2
3.5 6.1
10.1 23.5 62.3 20.4
7.3 19.6 23.2 14.5 19.6
QUAD. MHOS
3.0 25.3 3.6 3.5 1.8 11.6 1.3 30.9 2.3 11.1 2.4 10.5 3.3 7.4 5.3 10.2 6.6 0.3
0.0 220.2 -0.11000.0 8.5 5.4 4.1 6.8 6.2
10.1 4.6 1.9 0.5 1.7
4.8 8.6 6.0 5.4
5.1 2.6 3.4 0.9
9.3 2.0 1.9 5.3
13.4 15.3
4.6 5.6 5.2 0.2 4.4
8.4
Es t ima t ed depth may be unreliable because
3.8 2.1 3.0 4.7 7.1 2.5 2.3 4.0
161.3 41.3
1.3 8.7
10.6 2.9 5.9
14.6 4.2 7.3
48.7
0.1 3.9
10.0 10.0 14.2 1.9
1.6 6.9
10.1 398.4
9.6
DEPTH MTRS - - - - 23 9 8
25 32 12 0
18 1
31 0 4 9 0 6 0 0 3
31 23 11
39 21 19 32 0 0
20 9
31
0 15 0 0
16 20
40 24 17 13 0
BIRD HEIGHT MTRS - - - - 30 60 62 39 34 54 67 34 54
61 96 49 55 79 . 49 54 56 64 51 38 45
29 25 31 31 50 55 54 55 35
55 66 93 61 21 25
28 31 36 53 61
the stronqer part of the conductor may be deeper or to one side of the flight line, or because of a shallow dip or overburden effects.

PAGE 6
58907 VAVENBY AREA, BRITISH COLUMBIA - EM ANOMALIES
1080 P 3 . 30.3 10.0 6.5 4 42 1080 G 4 37.1 8.1 12.0 4 40 1080 H 4 38.8 8.5 12.1 0 46 1080 J 2 10.4 5.0 2.7 27 37 1080 K 4 9.7 2.1 8.1 37 35 1080 M 5 7.9 0.9 18.5 48 31
1090 A :. 3 14.2 4.8 5.0 0 78 1090 B 3 17.9 6.4 4.9 0 67 1090 c 4 27.8 6.1 10.9 22 27 1090 D 2 28.6 16.1 * 3.1 17 27 1090 E 0 8.1 8.5 0.8 20 35
2 1100 A 0 4.8 4.5 0.8 26 44
2 2
1110 1110
A B
2 2
21.1 15.9
9.4 10.4
3.9 2.1
0 63 21 31
2 2 2 2 2 2 2 2 2 2 2 2 2
1120 1120 1120 1120 1120
1120 1120 1120 1120 1120 1120 1120
1120
x B C D E F G H J K M N 0
2 1 2 2 3 5 0 0 0 0 0 0 0
18.4 13.7 15.0 15.3 16.0 14.7 3.8 3.9 4.3 4.4 3.9 3.8 4.3
11.3 9.5 6.2 6.9 5.6 2.1 4.8 5.3 5.3 4.7 4.5 5.4 7.2
2.4 1.8 3.8 3.4 4.9
16.2 0.4 0.4 0.5 0.6 0.5 0.4 0.3
24 26 28 26 0 69 0 62 0 68
16 47 0 66 0 65 0 64
11 57 10 58 12 49 1 53
3.6 6.5
15.5 14.3 19.4 11.5 17.1 16.6 19.1
1130 1130 1130 1130 1130 1130 1130 1130 1130
7.4 2.3 5.7 7.9
10.3 7.6
10.9 11.9 11.2
0.2 3.6 4.5 2.5 3.0 1.8 2.2 1.9 2.6
A B C D E F G H J
0 53 0 84 0 77 7 49 4 46 0 68
27 24 22 28 16 34
2 2 2
1140 1140 1140
A B C
2 1 2
15.1 5.1
14.5
9.7 2.9 6.6
2.1 1.7 3.3
23 30 43 37 0 59
Estimated depth may be unreliable because the stronger part of the conductor may be deeper or to one side of the flight line, or because of a shallow dip or overburden effects.

c
PAGE 7
58907 VAVENBY AREA, BRITISH COLUMBIA - EM ANOMALIES CONDUCTOR
AMPLITUDE (PPM) CTP DEPTH INPHASE QUAD. MHOS MTRS - - - - - - - - - - - - - - - - - - - -
BIRD HEIGHT MTRS - - - -
I FLIGBT --.-.- 1140 D 3 1140 E 3 1140 F 4 1140 G 4
2 2 2 2
14.4 5.3 4.4 1 14.1 3.8 6.7 0 14.2 2.4 12.8 20 12.1 2.1 11.7 38
59 62 44 29
1150 A 3
1150 C 3 1150 D 2 1150 E 1
1150 B :, 1 5.2 1.1 6.9 19 7.0 4.0 1.9 0
23.4 7.0 6.8 4 17.7 12.1 2.0 0 11.6 8.2 1.7 16
70 88 47 53 40
1160 A 1160 B 1160 C 1160 D 1160 E 1160 F 1160 F 1160 H
21.9 9.4 4.1 ' 4.2 3.8 0.8 15.8 8.9 2.6 13.0 4.5 4.7 17.7 6.8 4.5 14.7 4.3 6.1 18.8 6.4 5.4 34.0 3.0 39.5
19 8 8 0 0 0
23 24
32 66 46 63 56 66 32 24
1170 A 2 1170 B 3 1170 C 3 1170 D 2 1170 E 0 1170 F 3
7.2 3.3 2.6 0 32.6 10.8 6.6 0 17.7 6.7 4.6 0 20.0 9.1 3.7 7 4.1 5.2 0.4 0
19.8 8.4 4.1 9
76 49 58 45 80 43
2 2 2 2 2 2 2 2 2 2 2
1180 1180 1180 1180 1180 1180 1180 1180 1180 1180 1180
A B C D E F G H J K M
3 3 3 3 3 4 0 0 0 0 0
23.6 15.8 16.0 17.0 14.2 12.5 3.3 4.1 4.6 4.2 5.0
9.1 4.9 6.2 4.2 5.7 4.8 5.8 5.2 3.5 7.6
8.8 0.1 8.1 0.2 8.5 0.3 9.0 0.2 9.5 0.3
2.8 8.4
19 3 0 0 5
16 6 4 4 4 3
31 54 64 60 57 49 38 46 46 42 44
3.1 4.9 0.3 7 3.2 5.3 0.2 3
16.9 2.3 18.0 2 37.1 8.6 11.0 0 16.9 16.3 1.2 0 8.3 7.5 1.0 0
55 57 58 53 47 59
1190 A 0 1190 B 0 1190 c 5 1190 D 4 1190 E 1 1190 F 1
Estimated depth may be unreliable because the stronger part of the conductor may be deeper or to one side of the flight line, or because of a shallow dip or overburden effects.
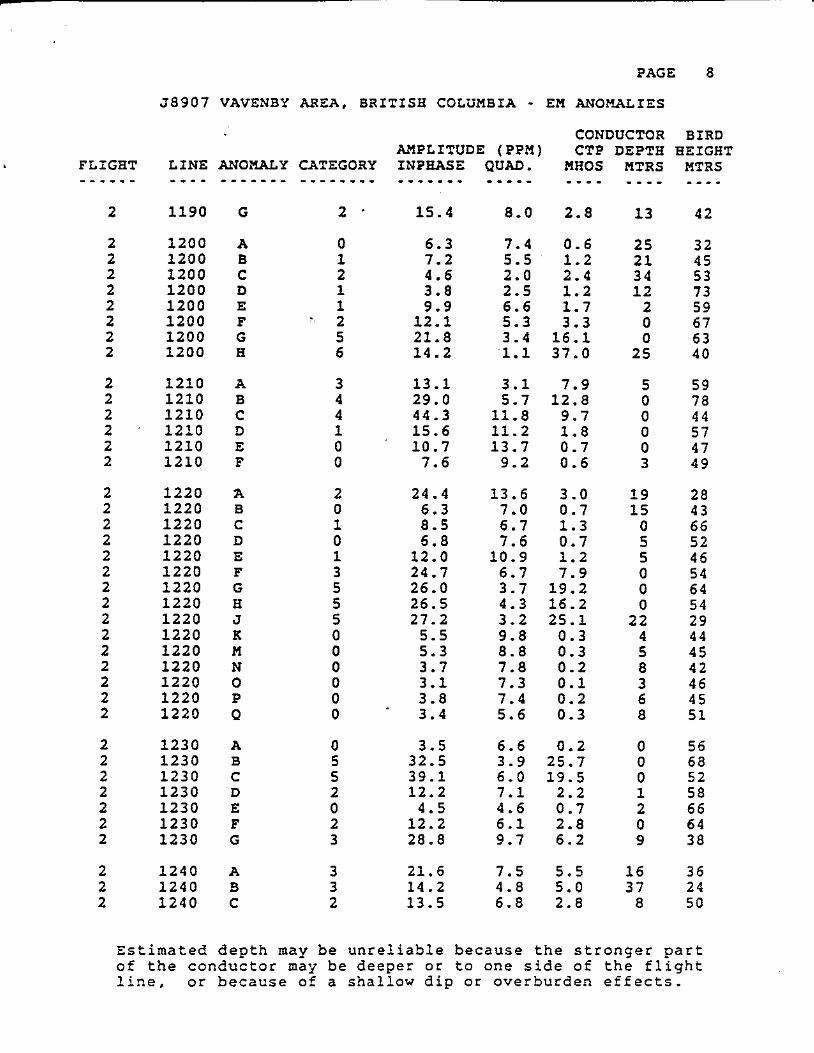
PAGE 8
58907 VAVENBY AREA, BRITISH COLUMBIA - EM ANOMALIES CONDUCTOR BIRD
LINE ANOMALY CATEGORY INPHASE QUAD. MHOS MTRS MTRS AMPLITUDE (PPM) CTP DEPTH HEIGHT
- - - - - - - - - - - - - - - - - - - - - - - - - - - - - - - - - - - - - - - - - - - 2 1190 G 2 - 15.4 8.0 2.8 13 42
1200 A 0 6.3 7.4 0.6 25 32 1200 B 1200 c 1200 D 1200 E 1200 F
1 2 1 1
:. 2 5 6
7.2 4.6 3.8 9.9
12.1
5.5 ' 1.2 2.0 2.4 2.5 1.2 6.6 1.7 5.3 3.3
21 45 34 53 12 73 2 59 0 67 0 63
25 40 2 2
1200 1200
G H
21.8 14.2
3.4 '1.1
16.1 37.0
2 2 2 2 . 2 2
1210 1210 1210 1210 1210 1210
A B C D E F
13.1 29.0 44.3 15.6 10.7 7.6
3.1 5.7
11.8 11.2 13.7 9.2
7.9 12.8 9.7 1.8 0.7 0.6
5 59 0 78 0 44 0 57 0 47 3 49
2 2 2 2 2 2 2 2 2 2 2 2 2 2 2
1220 1220 1220 1220 1220 1220 1220 1220 1220 1220 1220 1220 1220 1220 1220
a B C D E F G 11 J K M N 0 P Q
2 0 1 0 1 3 5 5 5 0 0 0 0 0 0
24.4 6.3 8.5 6.8
12.0 24.7 26.0 26.5 27.2 5.5 5.3 3.7 3.1 3.8
* 3.4
13.6 7.0 6.7 7.6
10.9 6.7 3.7 4.3 3.2 9.8 8.8 7.8 7.3 7.4 5.6
3.0 0.7 1.3 0.7 1.2 7.9
19.2 16.2 25.1 0.3 0.3 0.2 0.1 0.2 0.3
19 28 15 43 0 66 5 52 5 46 0 54 0 64 0 54
22 29 4 44 5 45 8 42 3 46 6 45 a 51
1230 1230 1230 1230 1230 1230 1230
3.5 32.5 39.1 12.2 4.5
12.2 28.8
6.6 3.9 6.0 7.1 4.6 6.1 9.7
A B C D E F G
0.2 25.7 19.5 2.2 0.7 2.8 6.2
0 56 0 68 0 52 1 58 2 66 0 64 9 38
2 2 2
1240 1240 1240
A B C
3 3 2
21.6 14.2 13.5
7.5 4.8 6.8
5.5 5.0 2.8
16 36 37 24 8 50
Estimated depth may be unreliable because the stronger part of the conductor may be deeper or to one side of the flight line, or because of a shallow dip or overburden effects.

2 2 2 2 2 2 2 2 2 2 2 2
3 3
3 3 3 3 3 3 3 3 3 3 3
3
PAGE 9
58907 VAVENBY AREA, BRITISX COLUMBIA - EM ANOMALIES
1240 1240 1240 1240 1240 1240 1240 1240 1240 1240 1240 1240
D E F G H J K M N 0 P Q
2 - 3 5 6 6 5 3
:. 0 0 0 0 0
13.2 11.6 40.0 57.8 56.3 10.8 3.9 3.3 4.9 4.2 3.1 4.8
6.4 2.9 3.6 5.2 5.5 22.7 5.6 40.2 3.6 70.2 1.3 18.8 0.8 6.5 5.1 0.3 6.0 0.5 5.2 0.5 4.8 0.3
11.5 0.2
0 1 0 0 0 0
26 8
16 26 19 1
1250 A 5 11.6 1.3 21.1 0 1250 B ’ 4 14.2 3.0 9.4 0 1250 C 3 17.3 5.9 5.2 0 1250 D 1 9.9 7.2 1.5 0 1250 E 1 15.6 12.0 1.7 0 1250 F 2 20.8 9.2 3.9 5
1260 1260 1260 1266 1260 1260 1260 1260
A B C D E F G H
14.7 4.9 8.8
23.1 20.7 32.5 37.1 3.4
7.4 2.9 4.5 0.8 5.8 1.7
10.7 3.8 8.2 4.5 8.1 9.6 9.0 10.4 9.6 0.1
21 0 1 0 0 0 0 0
1270 A 2 6.8 3.6 2.1 10 1270 B 4 33.3 9.2 8.5 17
1280 1280 1280 1280 1280 1280 1280 1280 1280 1280 1280
A B C D E F G H J X M
1 3 1 2 3 4 4 2 2 0 0
5.8 19.2 6.1
12.9 21.8 22.8 25.4 4.3 4.0 7.6 5.6
4.6 1.1 7.1 4.8 3.4 1.8 6.5 2.8 5.8 7.8 4.4 12.3 6.9 8.0 2.0 2.1 1.5 2.8 9.3 0.6 7.9 0.4
32 11 0 5 0 0
10 18 30 2 5
1290 A 0 8.7 13.7 0.5 0
BIRD HEIGHT MTRS - - - - 59 64 5 0 53 55 75 72 54 45 38 44 41
69 80 57 62 61 46
36 70 62 52 61 47 51 52
63 29
37 43 77 54 58 54 41 70 63 51 49
49
Estimated depth may be unreliable because the stronger part of the conductor may be deeper or to one side of the flight line, or because of a shallow dip or overburden effects.

PAGE 10
58907 VAVENBY AREA, BRITISE COLUMBIA - EM ANOMALIES CONDUCTOR BIRD
ANOMALY CATEGORY INPHASE QUAD. MHOS MTRS MTRS AMPLITUDE (PPM) CTP DEPTH HEIGHT
- - - - - - - - - - - - - - - - - - - - - - - - - - - - - - - - - - - --.- 3 3 3 3
1290 1290 1290 1290
B C D E
0 - 0 3 2
3.8 7.6 0.2 8.7 12.2 0.6 8.3 2.8 4.2
10.6 5.1 2.8
3 0
18 10
47 52 55 54
1301 1301 1301 1301 1301
1 0
:. 0 0 0
11.3 7.1 1.9 6.4 6.2 0.8 7.9 15.0 0.3 7.1 11.6 0.4 5.8 8.2 0.4
A B C D E
12 24 0 1
13
47 38 42 45 40
1310 1310 1310 1310 1310 1310 1310 1310
A B C D E F G '11
3.8 3.5 4.1
17.7 8.3
11.4 9.4 9.3
6.0 11.8 14.8 18.7 5.0
10.5 9.5
10.6
0.3 0.1 0.1 1.1 1.8 1.1 0.9 0.8
0 0 0 4 0 9
11 11
63 40 44 37 75 42 43 40
1320 1320 1320 132'0 1320 1320 1320
9.8 13.9 14.6 12.0 8.7 5.0 5.5
11.8 9.5 5.6
10.8 8.2
12.5 21.6
A B C D E F G
0.7 1.9 4.2 1.2 1.0 0.2 0.1
19 17 0
13 4 9 0
30 37 64 38 52 31 38
1330 1330 1330 1330 1330 1330 1330 1330
5.2 6.0 7.3
17.4 6.4 9.6 9.8 7.3
A B C D E F G H
14.9 14.3 11.1 17.0 7.7 2.3 5.3 3.8
0.1 0.2 0.4 1.2 0.6 7.0 2.3 2.2
31 36 54 47 48 71 59 64
1340 1340 1340 1340 1340 1340 1340 1340
A B C D E F G H
5.6 3.7 7.7 5.4 7.3
13.9 27.6 7.6
8.7 6.6 9.6 8.4 5.4 6.9 7.0 7.0
0.4 0.2 0.6 0.4 1.3 2.9 9.0 1.0
18 29 34 24 14 8 7
18
33 26 18 27 51 49 42 41
Estimated depth may be unreliable because the stronger part of the conductor may be deeper or to one side of the flight line, or because of a shallow dip or overburden effects.
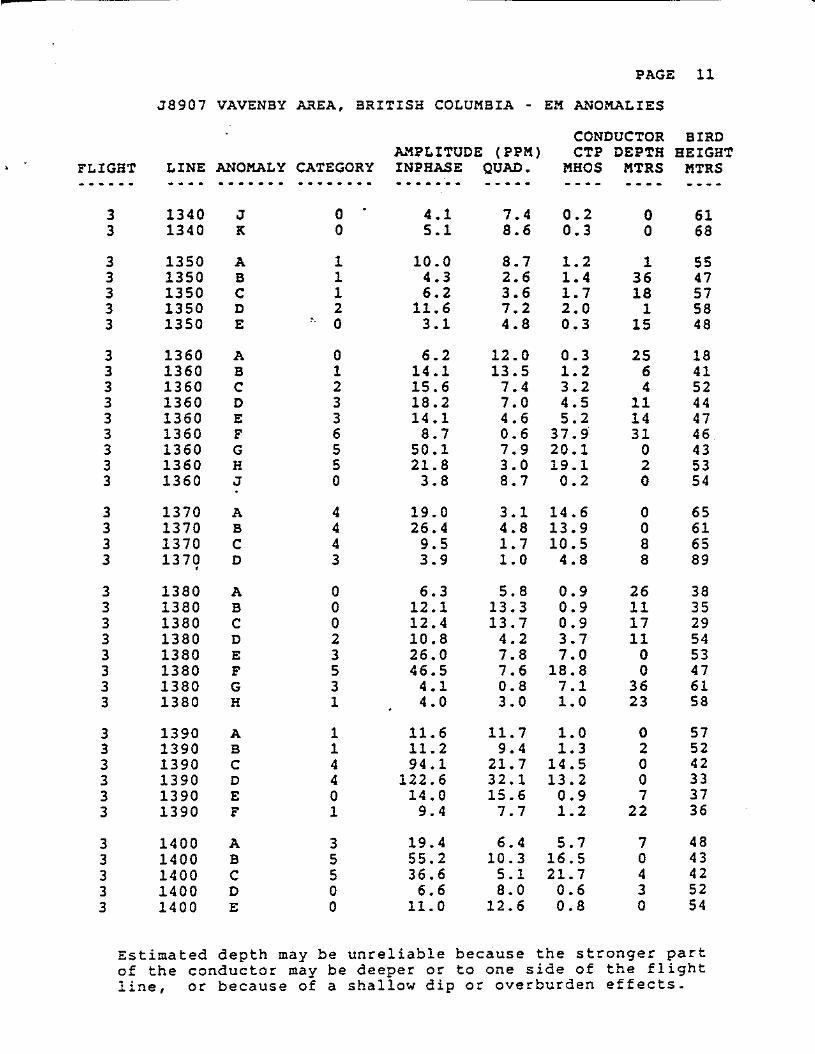
c
PAGE 11
58907 VAVENBY AREA, BRITISH COLUMBIA - EM ANOMALIES
1340 J 0 - 4.1 7.4 0.2 0 61 1340 K 0 5.1 8.6 0.3 0 68
3 3
1350 A 1 10.0 8.7 1.2 1 55 1350 B 1 4.3 2.6 1.4 36 47 1350 C 1350 D
1 2
6.2 3.6 1.7 18 57 11.6 7.2 2.0 1 58
1350 E :. 0 3.1 4.8 0.3 15 48
1360 1360 1360 1360 1360 1360 1360 1360 1360
A B C D E F G H J
A B C D
6.2 14.1 15.6 18.2 14.1 8.7
50.1 21.8 3.8
12.0 13.5 7.4 7.0 4.6 0.6 7.9 3.0 8.7
0.3 1.2 3.2 4.5 5.2
37.9' 20.1 19.1 0.2
25 6 4
11 14 31 0 2 0
18 41 52 44 47 46 43 53 54
1370 1370 1370 1370
19.0 26.4 9.5 3.9
3.1 4.8 1.7 1.0
14.6 13.9 10.5 4.8
0 0 8 8
65 61 65 89
1380 A 1380 B 1380 C 1380 D 1380 E 1380 F 1380 G 1380 H
6.3 12.1 12.4 10.8 26.0 46.5 4.1 4.0
5.8 0.9 13.3 0.9 13.7 0.9 4.2 3.7 7.8 7.0 7.6 18.8 0.8 7.1 3.0 1.0
26 11 17 11 0 0
36 23
38 35 29 54 53 47 61 58
1390 A 1 11.6 11.7 1.0 0 57 1390 B 1 11.2 9.4 1.3 2 52 1390 C 4 94.1 21.7 14.5 0 42 1390 D 4 122.6 32.1 13.2 0 33 1390 E 0 14.0 15.6 0.9 7 37 1390 F 1 9.4 7.7 1.2 22 36
1400 A 3 19.4 6.4 5.7 7 48 1400 B 5 55.2 10.3 16.5 0 43 1400 C 5 36.6 5.1 21.7 4 42 1400 D 0 6.6 8.0 0.6 3 52 1400 E 0 11.0 12.6 0.8 0 54
Estimated depth may be unreliable because the stronger part of the conductor may be deeper or to one side of the flight line, or because of a shallow dip or overburden effects.
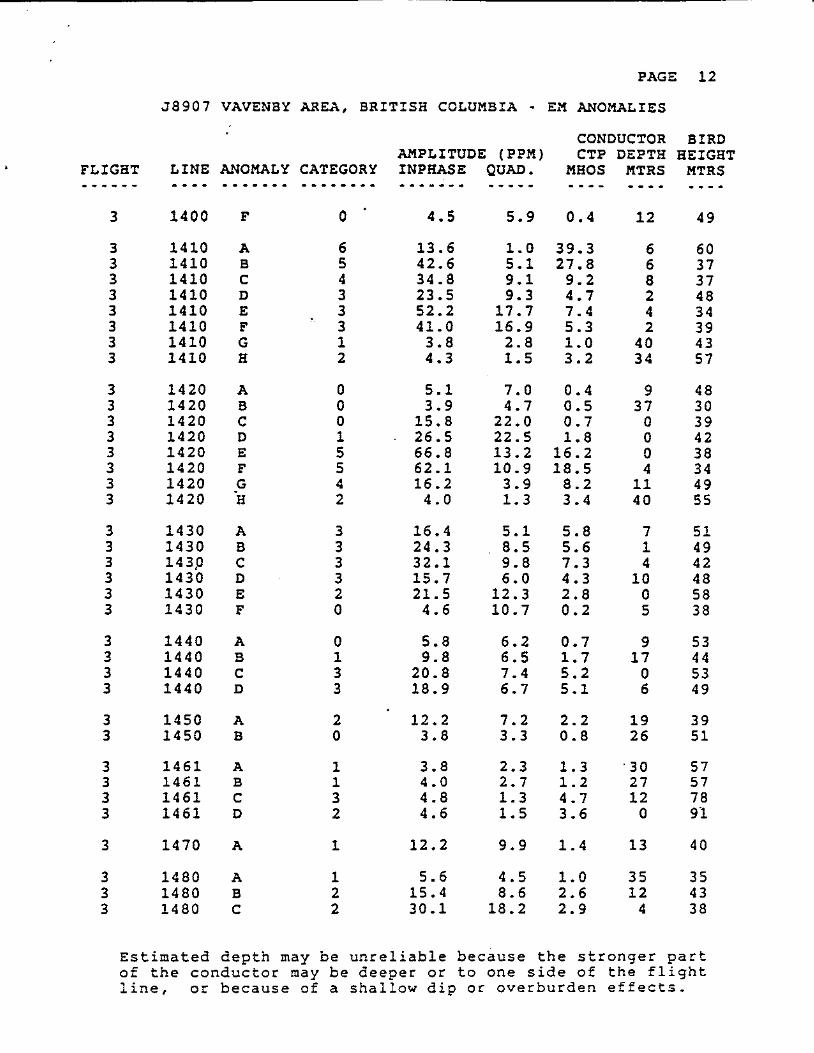
PAGE 12
58907 VAVENBY AREA, BRITISH COLUMBIA - EM ANOMALIES CONDUCTOR BIRD
LINE ANOMALY CATEGORY INPHASE QUAD. MHOS MTRS MTRS AMPLITUDE (PPM) CTP DEPTH HEIGHT
- - - - - - - - - - - - - - - - - - - - - - - - - - - - - - - - - - - - - - - - - - - 1400 F 0 - 4.5 5.9 0.4 12 49 3
1410 A 1410 B 1410 C 1410 D 1410 E 1410 F 1410 G 1410 H
6 5 4 3 3
.. 3
13.6 42.6 34.8 23.5 52.2 41.0 3.8 4.3
1.0 39.3 5.1 27.8 9.1 9.2 9.3 4.7
17.7 7.4 16.9 5.3 2.8 1.0 1.5 3.2
6 6
2 4 2
40 34
a 60 37 37 48 34 39 43 57
1 2
1420 A 1420 B 1420 C 1420 D 1420 E 1420 F 1420 G 1420 H
5.1 3.9
15.8 . 26.5
66.8 62.1 16.2 4.0
7.0 0.4 4.7 0.5
22.0 0.7 22.5 1.8 13.2 16.2 10.9 18.5 3.9 8.2 1.3 3.4
9 37 0 0 0 4
11 40
48 30 39 42 38 34 49 55
1430 A 3 16.4 5.1 5.8 7 51 1430 B 3 24.3 , 8.5 5.6 1 49 143p C 3 32.1 9.8 7.3 4 42 1430 D 3 15.7 6.0 4.3 10 48 1430 E 2 21.5 12.3 2.8 0 58 1430 F 0 4.6 10.7 0.2 5 38
3 3 3 3
1440 A 0 5.8 6.2 0.7 9 53 1440 B 1 9.8 6.5 1.7 17 44 1440 C 3 20.8 7.4 5.2 0 53 1440 D 3 18.9 6.7 5.1 6 49
1450 A 2 12.2 7.2 2.2 19 39 1450 B 0 3.8 3.3 0.8 26 51
3 3
3 3 3 3
1461 A 1 3.8 2.3 1.3 '30 57 1461 B 1 4.0 2.7 1.2 27 57 1461 C 3 4.8 1.3 4.7 12 78 1461 D 2 4.6 1.5 3.6 0 91
3 1470 A 1 12.2 9.9 1.4 13 40
3 3 3
1480 A 1 5.6 4.5 1.0 35 35 1480 B 2 15.4 8.6 2.6 12 43 1480 C 2 30.1 18.2 2.9 4 38
Estimated depth may be unreliable because the stronger part of the conductor may be deeper or to one side of the flight line, or because of a shallow dip or overburden effects.

PAGE 13
58907 VAVENBY AREA, BRITISH COLUMBIA - EM ANOMALIES
3 1480 D 3 1480 E
2 5.3 2.2 2.7 22 62 0 4.0 4.3 0.6 17 52
1490 1490 1490 1490 1490
A B C D E
0 2 0 1
:- 1
8.7 10.4 8.9 9.5 5.7
11.6 0.6 4.6 3.1
12.6 0.5 6.0 1.8 3.3 1.7
26.0 1.8 36.3 3.5 17.3 1.7 4.2 0.5 6.6 0.3
23 11 12 31 43
25 54 34 31 34
1500 1500 1500 1500 1500
29.7 58.6 21.3 3.8 4.0
A B C D E
6 6 0
37 16
32 28 45 33 39
3 1510 A 3 45.1 23.5 4.0 0 37 3 1510 B 3 65.8 24.4 7.0 4 31 3 1510 C 5 59.3 8.4 24.3 11 28 3 1510 D 6 42.0 2.4 75.6 4 41
3 1520 A 3 16.5 4.4 7.2 0 64 3 1520 B 1 9.0 6.6 1.4 0 69
4 4 4 4 4 4 4 4 4 4 4 4
2006 2000 2000 2000 2000 2000
2000 2000 2000 2000 2000
2000
A B C D E F G H J K M N
2 5 5 4 2 4 4 1 0 0 1 2
20.7 44.3 46.6 35.3 24.4 12.1 17.9 4.7 4.1 6.7 5.9 4.6
10.4 3.3 8.0 16.2 6.3 24.2 7.6 12.0
14.7 2.7 2.2 11.0 4.0 9.4 2.8 1.5 4.6 0.5 7.0 0.8 3.6 1.6 1.5 3.6
14 11 8
13 24 28 10 41 0 4
14 27
36 32 34 32 22 39 48 40 69 55 61 63
4 4 4 4 4 ' 4 4 4 4
2010 2010 2010 2010 2010 2010 2010 2010 2010
A B C D E F G H J
3.7 11.8 5.5 4.6 4.1 7.9 8.0 4.0 9.4
1.5 2.4 35 6.6 2.3 9 4.6 1.0 14 2.8 1.4 24 2.6 1.3' 17 5.4 1.5 0 4.1 2.3 0 3.7 0.7 3 9.2 .1.0 19
60 51 55 57 67 69 73 71 35
Estimated depth may be unreliable because the stronger p a r t of the conductor may be deeper or to one side of the flight line, or because of a shallow dip or overburden effects.