assessment of wic cost-containment practices: executive
TRANSCRIPT
brought to you by COREView metadata, citation and similar papers at core.ac.uk
provided by Research Papers in Economics
Assessment of WIC Cost-Containment Practices: Executive Summary. By John A.Kirlin, Nancy Cole, and Christopher Logan, Abt Associates Inc. Phil R. Kaufman, ERSproject representative. Food and Rural Economics Division, Economic ResearchService, U.S. Department of Agriculture. Food Assistance and Nutrition ResearchReport No. 31.
AbstractThe Special Supplemental Nutrition Program for Women, Infants, and Children (WIC)provides both nutrition education and supplemental foods containing nutrients determinedby nutritional research to be lacking in the diets of pregnant, breastfeeding, and post-partum women, infants, and children. State WIC agencies have implemented practicesdesigned to reduce the cost of food packages containing these prescribed foods. Forinstance, one of the WIC program’s primary cost-saving practices is negotiating rebatecontracts with manufacturers of infant formula. Additional practices include limitingauthorized vendors to stores with lower food prices; limiting approved brands, packagesizes, forms, or prices; and negotiating rebates with food manufacturers or suppliers.There is concern that these practices may inadvertently counter the program’s goal ofproviding supplemental foods and nutrition education. Based on a review of cost-con-tainment practices in six States, including interviews with the various stakeholders andanalysis of WIC administrative files, the study draws three major conclusions: (1) cost-containment practices reduced average food package costs by 0.2 to 21.4 percent,depending on practices implemented and local conditions; (2) the cost-containmentpractices had few adverse outcomes for WIC participants; and (3) administrative costsof the practices were low, averaging about 1.5 percent of food package savings.
The full report, Assessment of WIC Cost-Containment Practices: Final Report, isavailable online at www.ers.usda.gov/publications/efan03005.
Keywords: WIC Program, cost-containment, food-item restrictions, vendor restric-tions, manufacturers’ rebates, food package costs
Use of brand names does not imply approval or constitute endorsement by USDA.
Cover photos courtesy of:Jeffrey Kaufman and Anna Sorensen (woman shopping for eggs)
Washington, DC 20036-5831 May 2003
To purchase a paper copy of this report, call 1-800-999-6779
ii ✥ Assessment of WIC Cost-Containment Practices: Executive Summary/FANRR-31 Economic Research Service/USDA
AcknowledgmentsThe other authors and I would like to thank the many individuals who helped with thisstudy and assisted with preparation of this final report.
At the U.S. Department of Agriculture, Economic Research Service, Phil Kaufmanserved as Project Officer for the study. In this capacity, he played a major role in devel-oping the study’s statement of work and its overall research design. He coordinated allcontacts with the Food and Nutrition Service of USDA, and offered valuable assistanceduring data collection and analysis. Finally, he led and coordinated the technical review ofthis final report; the scope and content of the report bear his imprint in many ways.
Also at ERS, David Smallwood, Betsey Kuhn, and James Blaylock provided importantsupport and oversight. Gerald Plato assisted in the early stages of the study with itsresearch design. Both he and Elizabeth Frazao served as technical reviewers fornumerous drafts of the report and provided valuable comments. Linda Hatcher,Courtney Knauth, and Victor B. Phillips, Jr., provided editorial and graphic designassistance. At FNS, Dawn Aldridge provided important input into both the contractaward and technical review of drafts.
A great appreciation goes to the WIC program directors and staff in the six States thatparticipated in this study: California, Connecticut, North Carolina, Ohio, Oklahoma,and Texas. In addition to participating in lengthy interviews about their cost-contain-ment practices, they provided data files and other critical information needed for thestudy. We thank them for their full cooperation and assistance, and for the commentsthey provided on a draft of this report.
We also wish to thank the many WIC participants, vendors, and other stakeholderswho responded to our requests for information during the course of the study. We inter-viewed nearly 1,300 WIC participants, collected price data from over 100 WIC ven-dors, collected detailed point-of-sale information on WIC transactions in nearly 600supermarkets, and conducted focus groups with participants who had dropped out ofWIC. We also conducted interviews with representatives of the Food MarketingInstitute, the Grocery Manufacturers of America, the National Grocers Association, theNational WIC Association, the Private Label Manufacturers Association, and thenational and regional offices of the FNS. To all these individuals, vendors, and groups,we extend our heartfelt thanks.
Many individuals at Abt Associates and its subcontractors for the study helped with theanalysis or preparation of the final report. Charles Pappas of SmartSource Directrecruited the supermarkets that provided WIC transaction data, and Terry Stewart ofMarketing Resources International conducted the focus groups with WIC dropouts. AtAbt Associates, John Straubinger and Michael Harnett were survey directors for thestudy. Nancy McGarry and Ellie Lee served as the study’s programmers, and MaryKay Crepinsek, Dave Rodda, Joanna Golding, and Lisa Litin helped with the analyses.Chris Holm participated in the interviews with State and local officials. Finally, FredGlantz and Nancy Burstein helped review the final report, and Susan Byers Paxsondirected its production, with assistance from Jan Nicholson. Our thanks go to all ourcolleagues who worked with us on this project.
John A. KirlinProject DirectorAbt Associates Inc.
Economic Research Service/USDA Assessment of WIC Cost-Containment Practices: Executive Summary/FANRR-31 ✥ iii
ContentsPage
List of Tables ................................................................................................................iv
List of Figures ..............................................................................................................iv
Purpose of Study...........................................................................................................1
Summary of Findings...................................................................................................2
Main Findings by Outcome Measure .........................................................................4Program Costs: Food Costs and Food Cost Savings .................................................4Program Costs: Administrative Costs of Cost-Containment Practices......................5Access to WIC Vendors .............................................................................................6Availability of Prescribed Foods................................................................................7Participant Satisfaction With and Use of Prescribed Food........................................8Participants with Special Diets or Food Allergies ...................................................12Food Instrument Redemption ..................................................................................14Program Participation ..............................................................................................15Health Outcomes......................................................................................................16
Main Findings by Cost-Containment Practice ........................................................16Competitive Pricing at Application..........................................................................17Requiring Purchase of Least Expensive Brands......................................................17Limiting Approved Brands ......................................................................................18Limiting Approved Types of Foods .........................................................................18Limiting the Allowed Packaging of Foods ..............................................................19Manufacturer Rebates ..............................................................................................19Multiple Food-Item Restrictions..............................................................................19
Implications of the Findings for Other States .........................................................19
Appendix A: Cost-Containment Practices, 1999 .....................................................21
Appendix B: Data Sources.........................................................................................25State WIC Administrative Data ...............................................................................25Interviews with State and Local WIC Officials.......................................................25Survey of WIC Participants .....................................................................................25Survey of Price and Availability of WIC Food Items .............................................25WIC Transaction Data from Supermarkets..............................................................26Focus Group Discussions with WIC Program Dropouts.........................................26Interviews with Concerned Stakeholders ................................................................26
iv ✥ Assessment of WIC Cost-Containment Practices: Executive Summary/FANRR-31 Economic Research Service/USDA
List of TablesTable Page
1 Summary of State WIC cost-containment practices, FY2001..............................32 Food-item restrictions, by food category..............................................................93 Health outcomes of WIC participants.................................................................164 Estimated savings per WIC participant per month from requiring
purchase of least expensive brands ..................................................................175 Estimated savings per WIC participant per month from restrictions on
allowed types of food .......................................................................................18
Appendix table
1 Use of competitive pricing for WIC vendor selection, 1999 .............................212 WIC item cost-containment practices, 1999.......................................................23
List of FiguresFigure .......................................................................................................................Page
1 Average food package costs per WIC participant per month...............................42 Average food cost savings per WIC participant per month..................................53 Participant access to WIC vendors .......................................................................64 Availability of approved WIC foods.....................................................................75 WIC participant satisfaction with allowed brands of food.................................106 WIC families buying “all” prescribed food........................................................107 WIC families consuming “all” purchased food..................................................118 WIC families facing binding constraints on food choices .................................129 WIC families with special diets or food allergies ..............................................13
10 Rate of WIC food instrument issuance/pickup...................................................1411 Rate of WIC food instrument redemption ..........................................................1412 WIC dropout rates...............................................................................................15
The Food and Nutrition Service (FNS) of the U.S.Department of Agriculture (USDA), together with des-ignated State agencies, administers the Special Supple-mental Nutrition Program for Women, Infants, and Chil-dren (WIC). The WIC program provides both nutritioneducation and supplemental foods containing nutrientsdetermined by nutritional research to be lacking in thediets of pregnant, breastfeeding, and postpartum women,infants, and children. Funding is provided by FNS toState WIC agencies through annual appropriations fromCongress. Each State’s cash grant includes a food grantand a Nutrition Services and Administration (NSA) grant.In FY2001, food grants totaled $3.0 billion, or approx-imately 73 percent of the total cash grant. Cost savingsthrough infant formula rebates provided an additional$1.5 billion in funding; FNS estimates that the rebateswould support about 28 percent of the WIC caseload.
In an effort to ensure the best use of available funds andto provide for participation by all eligible individuals,State WIC agencies have implemented practicesdesigned to reduce the cost of food packages containingthese prescribed foods. For instance, one of the WICprogram’s primary cost-saving practices is negotiatingrebate contracts with manufacturers of infant formula.Additional practices include limiting authorized foodvendors (such as supermarkets and grocery stores) tooutlets with lower food prices; limiting food-item selec-tion according to brand, package size, form, or price (forinstance, requiring purchase of least cost items); andnegotiating rebates with food manufacturers or suppliers.
Concerns have been raised that vendor-selection prac-tices may reduce WIC participants’ access to authorizedvendors, and that item-selection practices and manu-facturers’ rebates may reduce participant satisfactionwith allowed food items. Lower satisfaction may leadto lower consumption of certain foods or a decision to
leave the program. In either case, the cost-containmentpractices may have the inadvertent effect of counteringthe program’s goal: to provide supplemental foods andnutrition education in order to safeguard and improvenutritional intake, birth outcomes, child development,and health outcome measures.
Purpose of StudyAs part of the William F. Goodling Child NutritionReauthorization Act of 1998, the U.S. Congress direct-ed the Economic Research Service (ERS), USDA, toassess the impacts of WIC cost-containment practiceson the following outcome measures:1
• Program participation.
• Access and availability of prescribed foods.
• Voucher redemption rates and actual food selectionsby participants.
• Participants on special diets or with specific food allergies.
• Participant use of and satisfaction with prescribed foods.
• Achievement of positive health outcomes.
• Program costs (includes both food and administrative costs).
In a competitive bidding process, ERS contracted withAbt Associates Inc. in September 1999 to conduct thisresearch study. This executive summary presents themain findings of the study.2
Economic Research Service/USDA Assessment of WIC Cost-Containment Practices: Executive Summary/FANRR-31 ✥ 1
Assessment of WICCost-Containment Practices
Executive Summary
John A. KirlinNancy Cole
Christopher Logan
1In accordance with the legislation authorizing this study, the impacts ofinfant formula rebates were not assessed during this research.
2The citation for the full report is John A. Kirlin, Nancy Cole, andChristopher Logan, Assessment of WIC Cost-Containment Practices: FinalReport, Economic Research Service, U.S. Department of Agriculture,February 2003 (electronic publication E-FAN-03-005).
The study examines the relationships between StateWIC cost-containment practices, program costs, andWIC participant outcomes. Prior research has identi-fied possible practices to lower WIC food costs.3 Littleis known, however, about the specific impacts, both onparticipants and State WIC agencies, of various meas-ures taken to contain food costs.
There is considerable variation in cost-containmentpractices used by State WIC agencies. Because of thepotential differences in the use and implementation ofthese practices by States, ERS decided upon a casestudy research design that would serve to identify thelinkages between various types of cost-containmentand Agency and participant outcomes. After adetailed State-by-State review of WIC cost-contain-ment practices, six States were selected for case study:California, Connecticut, North Carolina, Ohio,Oklahoma, and Texas.4 These States represent a mixture of practices and, in particular, they had prac-tices that were thought to be restrictive enough to have measurable outcomes. Throughout this study,those outcomes in States with specific practices arecompared with outcomes in States without thosepractices.
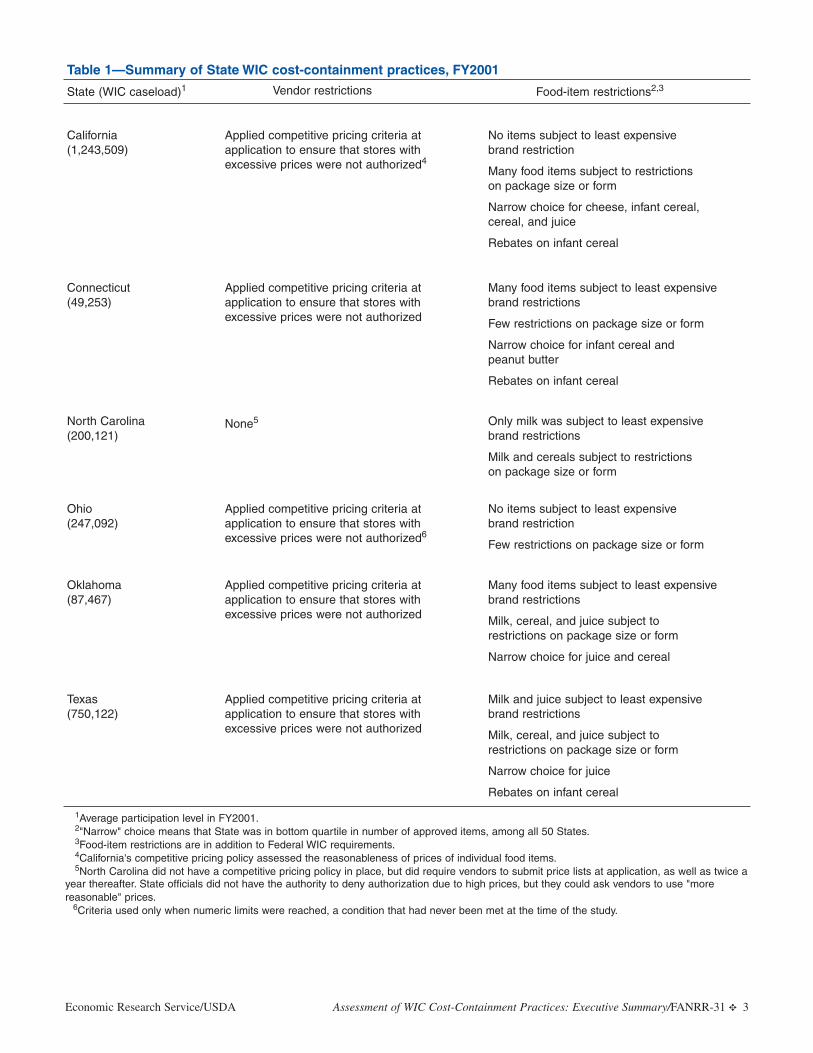
As displayed in table 1, five of the six States (all butNorth Carolina) applied competitive pricing criteriaat vendor application to ensure that stores withexcessive prices were not authorized to participate.Connecticut, Oklahoma, and Texas, however, werethe only States with explicit thresholds for priceabove which stores could not be authorized; thestudy treats these three States as the “restrictive”States (with respect to vendor restrictions) whencomparing outcomes between restrictive and nonre-strictive States.5
All six States imposed food-item restrictions accordingto price, brand, package size or form, or number ofallowed types within a food category. North Carolinaand Ohio, however, had relatively few food-item
restrictions; they were selected for the study to repre-sent States without such restrictions. The States impos-ing specific restrictions varied by food category, so the“restricted” group of States also varies by food catego-ry in the analyses.
California, Connecticut, and Texas contracted with asingle manufacturer for rebates on infant cereal. Froma participant’s perspective, such rebates are similar toState limits on allowed brands, and the study treatsthese two cost-containment practices similarly withregard to their impact on participants.
This study does not provide national estimates of theimpacts of WIC cost-containment practices becausethe six case study States were not randomly selected.In addition, the results of this study, for any of the sixcase study States, cannot be considered representativeof any State outside of the study. Instead, as the casestudy approach allows, the focus is on understandingthe linkages between specific cost-containment prac-tices, or combinations of practices, and their outcomes.The data used in the study to examine outcomes aredescribed in appendix B.
Summary of FindingsThere are three major findings from this study:
(1) Four of the six case study States (California,Connecticut, Oklahoma, and Texas) imposedrestrictions on many WIC foods in an effort toreduce food package costs. Their efforts weresuccessful, reducing monthly food package costsby an average of nearly 15 percent.
(2) Cost-containment practices were associated withfew adverse outcomes for WIC participants.
(3) State and local office administrative costs attrib-uted to cost-containment practices were relative-ly low. In the four States with substantial food-item restrictions, administrative costs averagedless than 1.5 percent of estimated food packagesavings. These costs averaged about 0.4 percentof the States’ annual NSA funds.
Due to the nature of case studies, these findings cannotbe construed as applicable to all States. In addition, thesuccess of cost-containment practices in these Stateswas the result of their ongoing efforts to find thosepractices that both reduced food package costs andwere acceptable to participants.
2 ✥ Assessment of WIC Cost-Containment Practices: Executive Summary/FANRR-31 Economic Research Service/USDA
3Food Assistance: A Variety of Practices May Lower the Cost of WIC,GAO/RCED-97-225, September 17, 1997.
4Appendix A presents two tables summarizing the cost-containment prac-tices used by States in 1999. This information was used in selecting the sixcase study States, as described in the study’s interim report. See John A.Kirlin and Nancy Cole, Assessment of WIC Cost-Containment Practices: AnInterim Report to Congress, Economic Research Service, U.S. Departmentof Agriculture, February 2001 (electronic publication E-FAN-01-005).
5In California, price thresholds were used to identify excessive prices forindividual food items, not to deny authorization to vendors. Ohio’s use ofcompetitive pricing applied only when numeric limits were reached, a con-dition that had never been met at the time of the study.
Economic Research Service/USDA Assessment of WIC Cost-Containment Practices: Executive Summary/FANRR-31 ✥ 3
year thereafter. State officials did not have the authority to deny authorization due to high prices, but they could ask vendors to use "more reasonable" prices.
6Criteria used only when numeric limits were reached, a condition that had never been met at the time of the study.
Table 1—Summary of State WIC cost-containment practices, FY2001
State (WIC caseload)1 Vendor restrictions Food-item restrictions2,3
California(1,243,509)
Applied competitive pricing criteria at application to ensure that stores with excessive prices were not authorized4
No items subject to least expensive brand restriction
Many food items subject to restrictions on package size or form
Narrow choice for cheese, infant cereal, cereal, and juice
Rebates on infant cereal
Connecticut(49,253)
Applied competitive pricing criteria at application to ensure that stores with excessive prices were not authorized
Many food items subject to least expensivebrand restrictions
Few restrictions on package size or form
Narrow choice for infant cereal and peanut butter
Rebates on infant cereal
North Carolina(200,121)
None5 Only milk was subject to least expensive brand restrictions
Milk and cereals subject to restrictions on package size or form
Ohio(247,092)
Applied competitive pricing criteria at application to ensure that stores with excessive prices were not authorized6
No items subject to least expensive brand restriction
Few restrictions on package size or form
Oklahoma(87,467)
Applied competitive pricing criteria at application to ensure that stores with excessive prices were not authorized
Many food items subject to least expensivebrand restrictions
Milk, cereal, and juice subject to restrictions on package size or form
Narrow choice for juice and cereal
Texas(750,122)
Applied competitive pricing criteria at application to ensure that stores with excessive prices were not authorized
Milk and juice subject to least expensive brand restrictions
Milk, cereal, and juice subject to restrictions on package size or form
Narrow choice for juice
Rebates on infant cereal
1Average participation level in FY2001.2"Narrow" choice means that State was in bottom quartile in number of approved items, among all 50 States.3Food-item restrictions are in addition to Federal WIC requirements.4California's competitive pricing policy assessed the reasonableness of prices of individual food items.5North Carolina did not have a competitive pricing policy in place, but did require vendors to submit price lists at application, as well as twice a
Main Findings byOutcome Measure
Program Costs: Food Costs and Food Cost Savings
Issue: The cost of WIC foods varies considerablyfrom State to State. Factors such as differences inallowed foods, food prices, caseload composi-tion, and differences in the needs of participantsand the food prescriptions they receive makecross-State comparisons difficult. In addition,States lack information about likely food costsavings due to their cost-containment practices.Better information about food costs and food costsavings would allow States to assess cost-con-tainment practices.
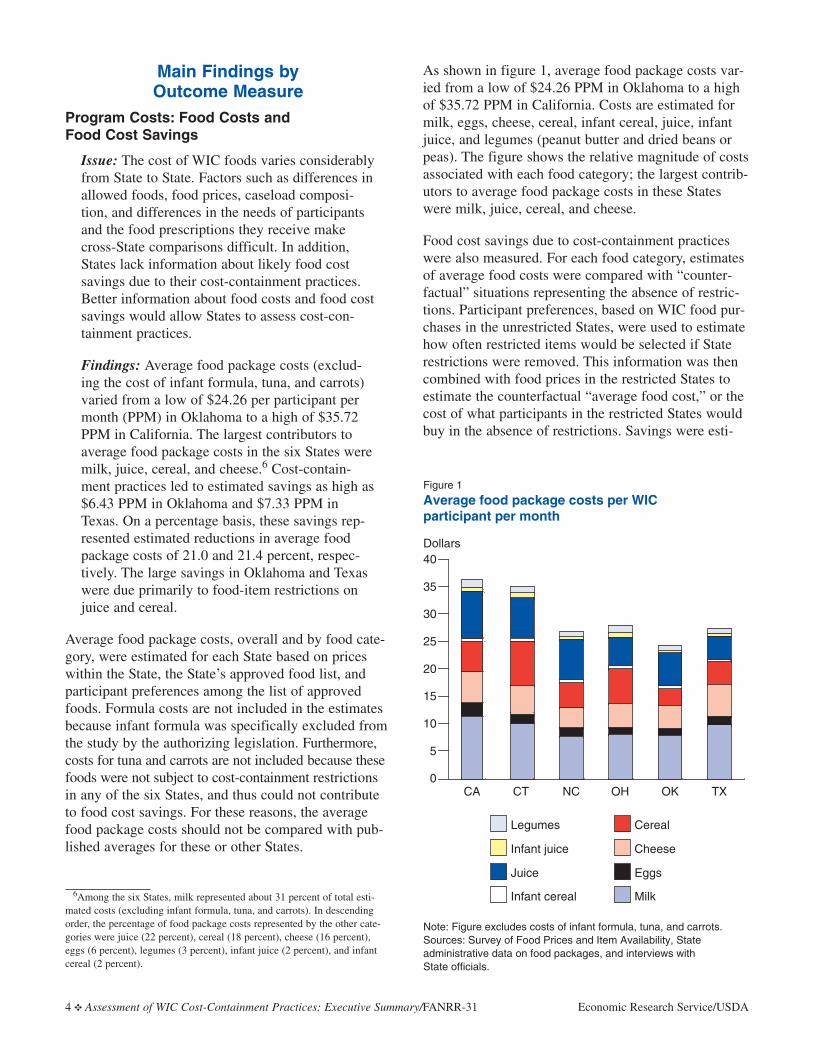
Findings: Average food package costs (exclud-ing the cost of infant formula, tuna, and carrots)varied from a low of $24.26 per participant permonth (PPM) in Oklahoma to a high of $35.72PPM in California. The largest contributors toaverage food package costs in the six States weremilk, juice, cereal, and cheese.6 Cost-contain-ment practices led to estimated savings as high as$6.43 PPM in Oklahoma and $7.33 PPM inTexas. On a percentage basis, these savings rep-resented estimated reductions in average foodpackage costs of 21.0 and 21.4 percent, respec-tively. The large savings in Oklahoma and Texaswere due primarily to food-item restrictions onjuice and cereal.
Average food package costs, overall and by food cate-gory, were estimated for each State based on priceswithin the State, the State’s approved food list, andparticipant preferences among the list of approvedfoods. Formula costs are not included in the estimatesbecause infant formula was specifically excluded fromthe study by the authorizing legislation. Furthermore,costs for tuna and carrots are not included because thesefoods were not subject to cost-containment restrictionsin any of the six States, and thus could not contributeto food cost savings. For these reasons, the averagefood package costs should not be compared with pub-lished averages for these or other States.
As shown in figure 1, average food package costs var-ied from a low of $24.26 PPM in Oklahoma to a highof $35.72 PPM in California. Costs are estimated formilk, eggs, cheese, cereal, infant cereal, juice, infantjuice, and legumes (peanut butter and dried beans orpeas). The figure shows the relative magnitude of costsassociated with each food category; the largest contrib-utors to average food package costs in these Stateswere milk, juice, cereal, and cheese.
Food cost savings due to cost-containment practiceswere also measured. For each food category, estimatesof average food costs were compared with “counter-factual” situations representing the absence of restric-tions. Participant preferences, based on WIC food pur-chases in the unrestricted States, were used to estimatehow often restricted items would be selected if Staterestrictions were removed. This information was thencombined with food prices in the restricted States toestimate the counterfactual “average food cost,” or thecost of what participants in the restricted States wouldbuy in the absence of restrictions. Savings were esti-
4 ✥ Assessment of WIC Cost-Containment Practices: Executive Summary/FANRR-31 Economic Research Service/USDA
6Among the six States, milk represented about 31 percent of total esti-mated costs (excluding infant formula, tuna, and carrots). In descendingorder, the percentage of food package costs represented by the other cate-gories were juice (22 percent), cereal (18 percent), cheese (16 percent),eggs (6 percent), legumes (3 percent), infant juice (2 percent), and infantcereal (2 percent).
Figure 1
Average food package costs per WIC participant per month
Dollars
Legumes
Note: Figure excludes costs of infant formula, tuna, and carrots.Sources: Survey of Food Prices and Item Availability, State administrative data on food packages, and interviews with State officials.
CA CT NC OH OK TX
Cereal
Infant juice
Juice
Infant cereal
Cheese
Eggs
Milk
0
5
10
15
20
25
30
35
40
mated as the difference between the estimated costs ofthe restricted and unrestricted food packages.
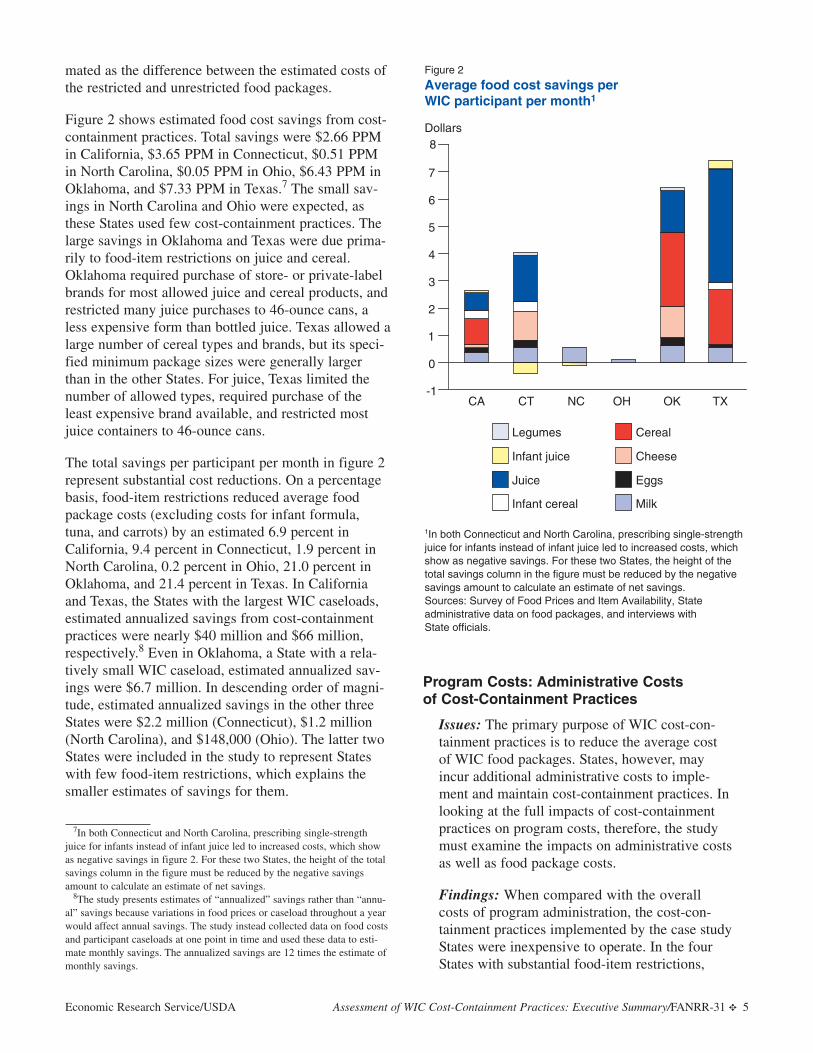
Figure 2 shows estimated food cost savings from cost-containment practices. Total savings were $2.66 PPMin California, $3.65 PPM in Connecticut, $0.51 PPMin North Carolina, $0.05 PPM in Ohio, $6.43 PPM inOklahoma, and $7.33 PPM in Texas.7 The small sav-ings in North Carolina and Ohio were expected, asthese States used few cost-containment practices. Thelarge savings in Oklahoma and Texas were due prima-rily to food-item restrictions on juice and cereal.Oklahoma required purchase of store- or private-labelbrands for most allowed juice and cereal products, andrestricted many juice purchases to 46-ounce cans, aless expensive form than bottled juice. Texas allowed alarge number of cereal types and brands, but its speci-fied minimum package sizes were generally largerthan in the other States. For juice, Texas limited thenumber of allowed types, required purchase of theleast expensive brand available, and restricted mostjuice containers to 46-ounce cans.
The total savings per participant per month in figure 2represent substantial cost reductions. On a percentagebasis, food-item restrictions reduced average foodpackage costs (excluding costs for infant formula,tuna, and carrots) by an estimated 6.9 percent inCalifornia, 9.4 percent in Connecticut, 1.9 percent inNorth Carolina, 0.2 percent in Ohio, 21.0 percent inOklahoma, and 21.4 percent in Texas. In Californiaand Texas, the States with the largest WIC caseloads,estimated annualized savings from cost-containmentpractices were nearly $40 million and $66 million,respectively.8 Even in Oklahoma, a State with a rela-tively small WIC caseload, estimated annualized sav-ings were $6.7 million. In descending order of magni-tude, estimated annualized savings in the other threeStates were $2.2 million (Connecticut), $1.2 million(North Carolina), and $148,000 (Ohio). The latter twoStates were included in the study to represent Stateswith few food-item restrictions, which explains thesmaller estimates of savings for them.
Program Costs: Administrative Costs of Cost-Containment Practices
Issues: The primary purpose of WIC cost-con-tainment practices is to reduce the average costof WIC food packages. States, however, mayincur additional administrative costs to imple-ment and maintain cost-containment practices. Inlooking at the full impacts of cost-containmentpractices on program costs, therefore, the studymust examine the impacts on administrative costsas well as food package costs.
Findings: When compared with the overallcosts of program administration, the cost-con-tainment practices implemented by the case studyStates were inexpensive to operate. In the fourStates with substantial food-item restrictions,
Economic Research Service/USDA Assessment of WIC Cost-Containment Practices: Executive Summary/FANRR-31 ✥ 5
7In both Connecticut and North Carolina, prescribing single-strengthjuice for infants instead of infant juice led to increased costs, which showas negative savings in figure 2. For these two States, the height of the totalsavings column in the figure must be reduced by the negative savingsamount to calculate an estimate of net savings.
8The study presents estimates of “annualized” savings rather than “annu-al” savings because variations in food prices or caseload throughout a yearwould affect annual savings. The study instead collected data on food costsand participant caseloads at one point in time and used these data to esti-mate monthly savings. The annualized savings are 12 times the estimate ofmonthly savings.
Figure 2
Average food cost savings per WIC participant per month1
Dollars
CA CT NC OH OK TX
1In both Connecticut and North Carolina, prescribing single-strengthjuice for infants instead of infant juice led to increased costs, whichshow as negative savings. For these two States, the height of thetotal savings column in the figure must be reduced by the negativesavings amount to calculate an estimate of net savings.Sources: Survey of Food Prices and Item Availability, State administrative data on food packages, and interviews with State officials.
-1
0
1
2
3
4
5
6
7
8
Legumes Cereal
Infant juice
Juice
Infant cereal
Cheese
Eggs
Milk
administrative costs averaged less than 1.5 per-cent of estimated food package savings. Theseestimated costs represented, on average, about0.4 percent of the States’ FY2001 NSA costs.
The study collected information from the States on theadministrative costs of their cost-containment prac-tices. Costs were estimated for the following: use ofprice data in vendor authorization; use of cost criteriain constructing WIC food lists; communicating infor-mation about price-based restrictions on allowablefoods to participants and vendors; establishing andrenewing infant cereal rebate contracts; and trackingand claiming the rebates. The estimated total adminis-trative costs ranged from $0.01 PPM in Oklahoma to$0.10 PPM in Connecticut. These estimates mayunderstate or overstate actual costs because the Statescould not always provide information needed to esti-mate costs for specific functions.9 Even allowing for aconsiderable margin of error, however, costs related tocost-containment were small.
The study did not estimate the cost of designing andimplementing (as opposed to operating) cost-contain-ment practices because the States implemented thesepractices many years ago; data on implementationcosts were not available.
Access to WIC Vendors
Issue: Competitive pricing policies are designedto lower the average cost of prescribed WIC foodpackages by keeping high-price stores out of theprogram. Such policies, however, may restrictWIC participants’ access to vendors if the policyreduces the number of authorized stores.
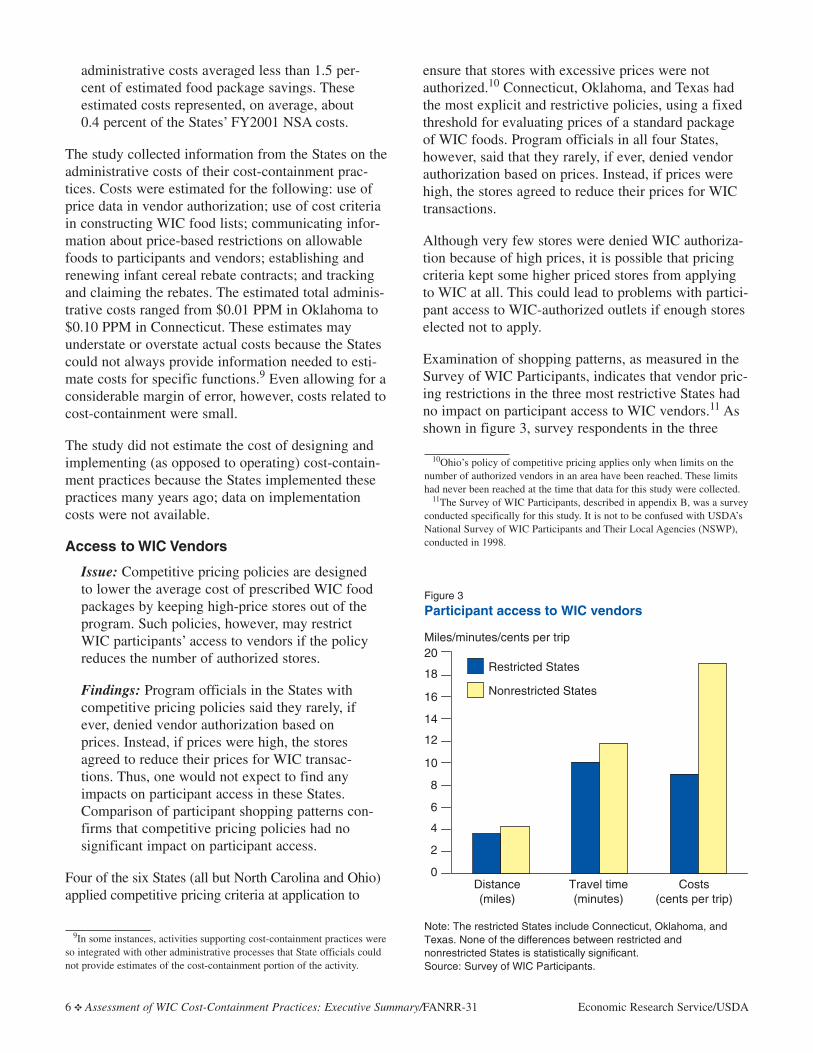
Findings: Program officials in the States withcompetitive pricing policies said they rarely, ifever, denied vendor authorization based onprices. Instead, if prices were high, the storesagreed to reduce their prices for WIC transac-tions. Thus, one would not expect to find anyimpacts on participant access in these States.Comparison of participant shopping patterns con-firms that competitive pricing policies had nosignificant impact on participant access.
Four of the six States (all but North Carolina and Ohio)applied competitive pricing criteria at application to
ensure that stores with excessive prices were notauthorized.10 Connecticut, Oklahoma, and Texas hadthe most explicit and restrictive policies, using a fixedthreshold for evaluating prices of a standard packageof WIC foods. Program officials in all four States,however, said that they rarely, if ever, denied vendorauthorization based on prices. Instead, if prices werehigh, the stores agreed to reduce their prices for WICtransactions.
Although very few stores were denied WIC authoriza-tion because of high prices, it is possible that pricingcriteria kept some higher priced stores from applyingto WIC at all. This could lead to problems with partici-pant access to WIC-authorized outlets if enough storeselected not to apply.
Examination of shopping patterns, as measured in theSurvey of WIC Participants, indicates that vendor pric-ing restrictions in the three most restrictive States hadno impact on participant access to WIC vendors.11 Asshown in figure 3, survey respondents in the three
6 ✥ Assessment of WIC Cost-Containment Practices: Executive Summary/FANRR-31 Economic Research Service/USDA
10Ohio’s policy of competitive pricing applies only when limits on thenumber of authorized vendors in an area have been reached. These limitshad never been reached at the time that data for this study were collected.
11The Survey of WIC Participants, described in appendix B, was a surveyconducted specifically for this study. It is not to be confused with USDA’sNational Survey of WIC Participants and Their Local Agencies (NSWP),conducted in 1998.
9In some instances, activities supporting cost-containment practices wereso integrated with other administrative processes that State officials couldnot provide estimates of the cost-containment portion of the activity.
Restricted States
0
2
4
6
8
10
12
14
16
18
20
Nonrestricted States
Note: The restricted States include Connecticut, Oklahoma, and Texas. None of the differences between restricted and nonrestricted States is statistically significant.Source: Survey of WIC Participants.
Figure 3
Participant access to WIC vendors
Miles/minutes/cents per trip
Distance(miles)
Travel time(minutes)
Costs(cents per trip)
States with vendor restrictions, as a group, did nottravel farther or longer to do their WIC shopping,compared with their regular shopping, than partici-pants in the remaining States, nor did they pay more inout-of-pocket expenses. If vendor restrictions hadreduced participant access, the columns for restrictedStates in the figure would be taller than those for thenonrestricted States; instead, they are shorter.
A major reason for finding no relationship betweenprice restrictions and access to vendors is that mostsurvey respondents said they did their WIC and regu-lar shopping at the same store. A cross-State averageof only 13.0 percent did their WIC and non-WIC shop-ping at different stores.
Availability of Prescribed Foods
Issue: Cost-containment practices may reducethe availability of prescribed WIC foods in twoways. First, if competitive pricing restrictionshave the unintentional consequence of limitingaccess to well-stocked stores, then WIC partici-pants may have difficulty finding prescribedfoods at WIC vendors. Second, when State cost-containment practices limit the different fooditems that may be purchased with the WIC foodinstrument, the likelihood of finding an approveditem at an authorized store may decrease.
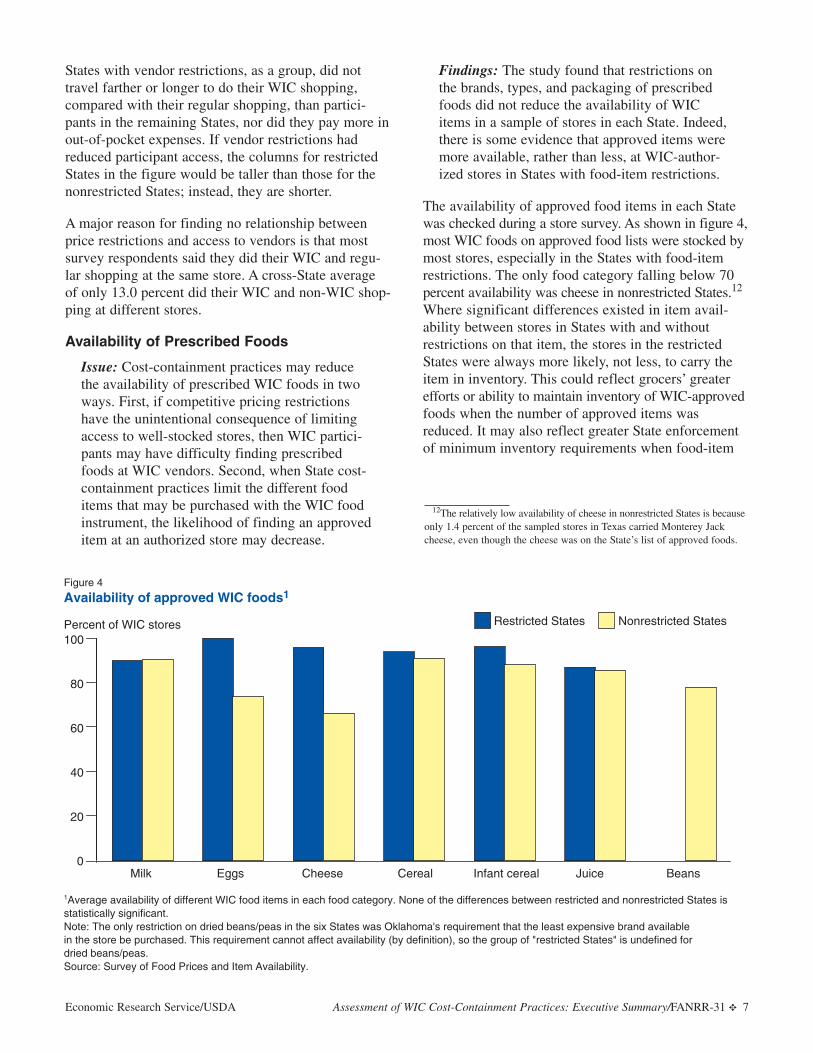
Findings: The study found that restrictions onthe brands, types, and packaging of prescribedfoods did not reduce the availability of WICitems in a sample of stores in each State. Indeed,there is some evidence that approved items weremore available, rather than less, at WIC-author-ized stores in States with food-item restrictions.
The availability of approved food items in each Statewas checked during a store survey. As shown in figure 4,most WIC foods on approved food lists were stocked bymost stores, especially in the States with food-itemrestrictions. The only food category falling below 70percent availability was cheese in nonrestricted States.12
Where significant differences existed in item avail-ability between stores in States with and withoutrestrictions on that item, the stores in the restrictedStates were always more likely, not less, to carry theitem in inventory. This could reflect grocers’ greaterefforts or ability to maintain inventory of WIC-approvedfoods when the number of approved items wasreduced. It may also reflect greater State enforcementof minimum inventory requirements when food-item
Economic Research Service/USDA Assessment of WIC Cost-Containment Practices: Executive Summary/FANRR-31 ✥ 7
Figure 4
Availability of approved WIC foods1
Percent of WIC stores Restricted States Nonrestricted States
Milk Cheese Cereal Infant cereal JuiceEggs Beans0
20
40
60
80
100
1Average availability of different WIC food items in each food category. None of the differences between restricted and nonrestricted States is statistically significant.Note: The only restriction on dried beans/peas in the six States was Oklahoma's requirement that the least expensive brand available in the store be purchased. This requirement cannot affect availability (by definition), so the group of "restricted States" is undefined for dried beans/peas.Source: Survey of Food Prices and Item Availability.
12The relatively low availability of cheese in nonrestricted States is becauseonly 1.4 percent of the sampled stores in Texas carried Monterey Jackcheese, even though the cheese was on the State’s list of approved foods.
restrictions are in place.13 Regardless, there is no evi-dence that the presence of cost-containment practicesreduced the availability of prescribed foods.
The columns in figure 4 represent an average availabilityof food items in each food category, and they can maskunderlying variation. Thus, for instance, milk availabilityin restricted States averages 90 percent in figure 4. Inthese same States, 100 percent of sampled stores car-ried whole, 2-percent reduced-fat, and evaporatedmilk. For other types of milk, the percentages of storescarrying the milk varied: 1-percent low-fat milk (88.0percent), nonfat milk (78.8 percent), nonfat dry milk(82.1 percent), and lactose-reduced or lactose-freemilk (81.0 percent). Similar variation exists in the non-restricted States and for other food categories. For nofood item, however, were stores in restricted Statessignificantly less likely to carry the item than stores innonrestricted States.
Another way to examine the impact of cost-contain-ment practices on food availability is to compare thepercentages of stores in States with and withoutrestrictions that meet WIC’s minimum variety require-ments for store inventory. Nearly all stores met therequirements for all food categories. There were nosignificant differences between the States with andwithout restrictions.
Participant Satisfaction With and Use of Prescribed Food
Issue: State practices to reduce food packagecosts—by restricting brands, types, or packagingof allowed foods—limit WIC participants’ foodchoices. One of the concerns with food-itemrestrictions is the possibility that State limits onallowed foods may adversely affect WIC partici-pants’ satisfaction with their WIC food package.In turn, lower satisfaction may reduce their likeli-hood of purchasing and consuming all the pre-scribed foods. If such an adverse effect exists,then this cost-containment practice may have anundesired impact on the WIC program’s ability toimprove the nutritional status of participants.
Findings: Most WIC participants surveyed forthis study indicated they were “very satisfied”with the brands of food and package sizes allowedon their State’s list of approved foods, althoughexceptions existed (only about 50 percent were
very satisfied with allowed brands of cereal).Differences in satisfaction levels between Stateswith and without restrictions are small and statis-tically insignificant. There is also no evidence thatfood-item restrictions caused participants to buyless food, and the purchased food in States withrestrictions was usually just as likely to be eatenas food purchased in States without food-itemrestrictions. In each State, however, more than 10percent of surveyed participants reported a pref-erence for a federally approved food item not onthe State’s list of allowed foods—a State-imposed “binding constraint” on their food pur-chases. Restrictions on cereal caused the mostbinding constraints, followed by cheese.
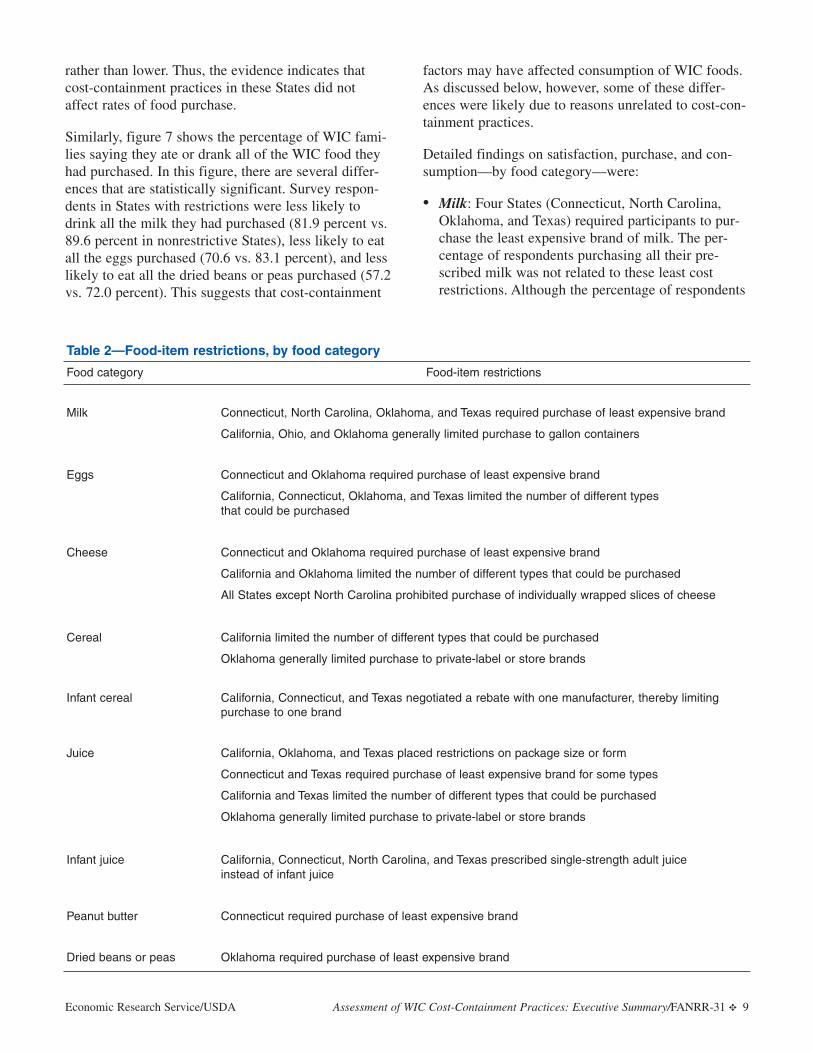
Table 2 displays the food-item restrictions used by thesix case study States during the first half of 2001,when data for this study were collected. It providesmore detail than table 1 because restrictions for eachfood category are listed. The most common restrictionin the States was the requirement that participants pur-chase the least expensive brand of a food category(usually milk, eggs, or cheese) in the store.
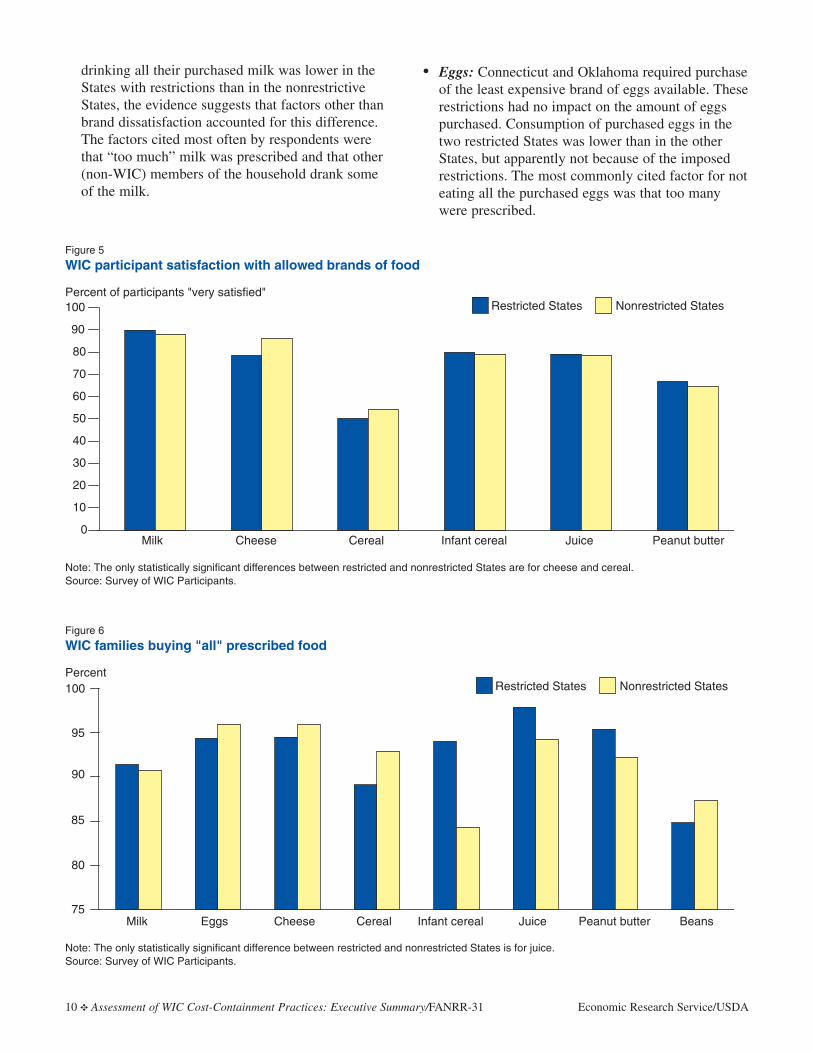
Among the case study States, most surveyed WIC par-ticipants indicated they were “very satisfied” with thebrands of food allowed on their State’s list of approvedfoods (fig. 5). Brand satisfaction was highest for milk,cheese, infant cereal, and juice, with satisfaction levelsgenerally near or above 80 percent. About 65 percentof respondents said they were “very satisfied” withallowed brands of peanut butter, and a little more than50 percent indicated satisfaction with allowed brandsof cereal. Most importantly, when overall satisfactionlevels in States with restrictions are compared withlevels in the nonrestrictive States, the differences infigure 5 are small and usually not statistically signifi-cant. Only for cheese and cereal did food-item restric-tions affect levels of satisfaction with allowed brands.
With regard to “use” of prescribed foods, the studyexamined both the purchase and consumption of WICfoods by asking survey respondents how much of theirmonthly prescription they purchased, and how muchof the purchased food they (or other WIC members ofthe household) ate or drank. Figure 6 shows the per-centage of respondents who said they purchased all thefood prescribed for WIC members of their family, byfood category. The only category with a statisticallysignificant difference between the restricted and nonre-stricted States was juice, but purchase rates for juicewere higher in the restricted States (97.9 to 94.3 percent)
8 ✥ Assessment of WIC Cost-Containment Practices: Executive Summary/FANRR-31 Economic Research Service/USDA
13Data to address either hypothesis were not collected for the study.
rather than lower. Thus, the evidence indicates thatcost-containment practices in these States did notaffect rates of food purchase.
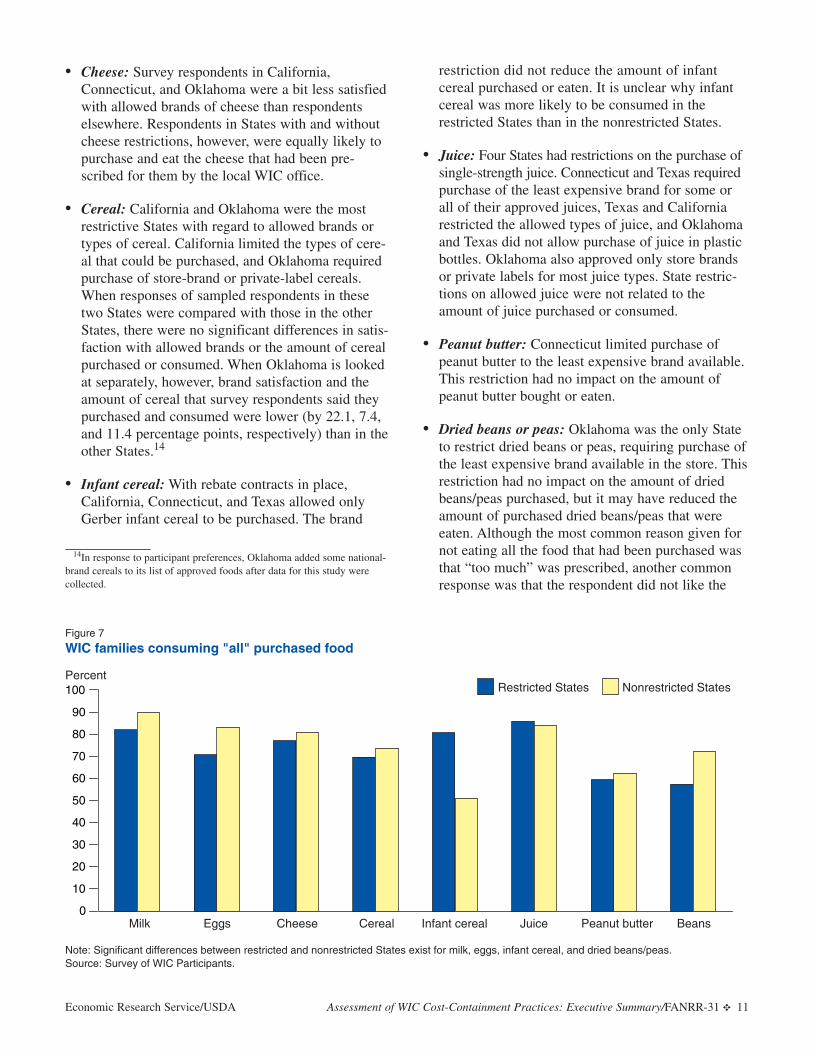
Similarly, figure 7 shows the percentage of WIC fami-lies saying they ate or drank all of the WIC food theyhad purchased. In this figure, there are several differ-ences that are statistically significant. Survey respon-dents in States with restrictions were less likely todrink all the milk they had purchased (81.9 percent vs.89.6 percent in nonrestrictive States), less likely to eatall the eggs purchased (70.6 vs. 83.1 percent), and lesslikely to eat all the dried beans or peas purchased (57.2vs. 72.0 percent). This suggests that cost-containment
factors may have affected consumption of WIC foods.As discussed below, however, some of these differ-ences were likely due to reasons unrelated to cost-con-tainment practices.
Detailed findings on satisfaction, purchase, and con-sumption—by food category—were:
• Milk: Four States (Connecticut, North Carolina,Oklahoma, and Texas) required participants to pur-chase the least expensive brand of milk. The per-centage of respondents purchasing all their pre-scribed milk was not related to these least costrestrictions. Although the percentage of respondents
Economic Research Service/USDA Assessment of WIC Cost-Containment Practices: Executive Summary/FANRR-31 ✥ 9
Table 2—Food-item restrictions, by food category
Food category Food-item restrictions
Milk Connecticut, North Carolina, Oklahoma, and Texas required purchase of least expensive brand
California, Ohio, and Oklahoma generally limited purchase to gallon containers
Eggs Connecticut and Oklahoma required purchase of least expensive brand
California, Connecticut, Oklahoma, and Texas limited the number of different types that could be purchased
Cheese Connecticut and Oklahoma required purchase of least expensive brand
California and Oklahoma limited the number of different types that could be purchased
All States except North Carolina prohibited purchase of individually wrapped slices of cheese
Cereal California limited the number of different types that could be purchased
Oklahoma generally limited purchase to private-label or store brands
Infant cereal California, Connecticut, and Texas negotiated a rebate with one manufacturer, thereby limiting purchase to one brand
Juice California, Oklahoma, and Texas placed restrictions on package size or form
Connecticut and Texas required purchase of least expensive brand for some types
California and Texas limited the number of different types that could be purchased
Oklahoma generally limited purchase to private-label or store brands
Infant juice California, Connecticut, North Carolina, and Texas prescribed single-strength adult juice instead of infant juice
Peanut butter Connecticut required purchase of least expensive brand
Dried beans or peas Oklahoma required purchase of least expensive brand
drinking all their purchased milk was lower in theStates with restrictions than in the nonrestrictiveStates, the evidence suggests that factors other thanbrand dissatisfaction accounted for this difference.The factors cited most often by respondents werethat “too much” milk was prescribed and that other(non-WIC) members of the household drank someof the milk.
• Eggs: Connecticut and Oklahoma required purchaseof the least expensive brand of eggs available. Theserestrictions had no impact on the amount of eggspurchased. Consumption of purchased eggs in thetwo restricted States was lower than in the otherStates, but apparently not because of the imposedrestrictions. The most commonly cited factor for noteating all the purchased eggs was that too manywere prescribed.
10 ✥ Assessment of WIC Cost-Containment Practices: Executive Summary/FANRR-31 Economic Research Service/USDA
Figure 5
WIC participant satisfaction with allowed brands of food
Percent of participants "very satisfied"
0
10
20
30
40
50
60
70
80
90
100
Note: The only statistically significant differences between restricted and nonrestricted States are for cheese and cereal.Source: Survey of WIC Participants.
Milk Cheese Cereal Infant cereal Juice Peanut butter
Restricted States Nonrestricted States
Figure 6
WIC families buying "all" prescribed food
Percent
Note: The only statistically significant difference between restricted and nonrestricted States is for juice.Source: Survey of WIC Participants.
75
80
85
90
95
100
Milk Cheese Cereal Infant cereal Juice Peanut butterEggs Beans
Restricted States Nonrestricted States
• Cheese: Survey respondents in California,Connecticut, and Oklahoma were a bit less satisfiedwith allowed brands of cheese than respondentselsewhere. Respondents in States with and withoutcheese restrictions, however, were equally likely topurchase and eat the cheese that had been pre-scribed for them by the local WIC office.
• Cereal: California and Oklahoma were the mostrestrictive States with regard to allowed brands ortypes of cereal. California limited the types of cere-al that could be purchased, and Oklahoma requiredpurchase of store-brand or private-label cereals.When responses of sampled respondents in thesetwo States were compared with those in the otherStates, there were no significant differences in satis-faction with allowed brands or the amount of cerealpurchased or consumed. When Oklahoma is lookedat separately, however, brand satisfaction and theamount of cereal that survey respondents said theypurchased and consumed were lower (by 22.1, 7.4,and 11.4 percentage points, respectively) than in theother States.14
• Infant cereal: With rebate contracts in place,California, Connecticut, and Texas allowed onlyGerber infant cereal to be purchased. The brand
restriction did not reduce the amount of infantcereal purchased or eaten. It is unclear why infantcereal was more likely to be consumed in therestricted States than in the nonrestricted States.
• Juice: Four States had restrictions on the purchase ofsingle-strength juice. Connecticut and Texas requiredpurchase of the least expensive brand for some orall of their approved juices, Texas and Californiarestricted the allowed types of juice, and Oklahomaand Texas did not allow purchase of juice in plasticbottles. Oklahoma also approved only store brandsor private labels for most juice types. State restric-tions on allowed juice were not related to theamount of juice purchased or consumed.
• Peanut butter: Connecticut limited purchase ofpeanut butter to the least expensive brand available.This restriction had no impact on the amount ofpeanut butter bought or eaten.
• Dried beans or peas: Oklahoma was the only Stateto restrict dried beans or peas, requiring purchase ofthe least expensive brand available in the store. Thisrestriction had no impact on the amount of driedbeans/peas purchased, but it may have reduced theamount of purchased dried beans/peas that wereeaten. Although the most common reason given fornot eating all the food that had been purchased wasthat “too much” was prescribed, another commonresponse was that the respondent did not like the
Economic Research Service/USDA Assessment of WIC Cost-Containment Practices: Executive Summary/FANRR-31 ✥ 11
Figure 7
WIC families consuming "all" purchased food
Percent
Note: Significant differences between restricted and nonrestricted States exist for milk, eggs, infant cereal, and dried beans/peas.Source: Survey of WIC Participants.
Milk Cheese Cereal Infant cereal Juice Peanut butterEggs Beans
Restricted States Nonrestricted States
0
10
20
30
40
50
60
70
80
90
100
14In response to participant preferences, Oklahoma added some national-brand cereals to its list of approved foods after data for this study were collected.
beans or peas. This latter response may have indi-cated dissatisfaction with the taste or quality of theleast expensive brand.
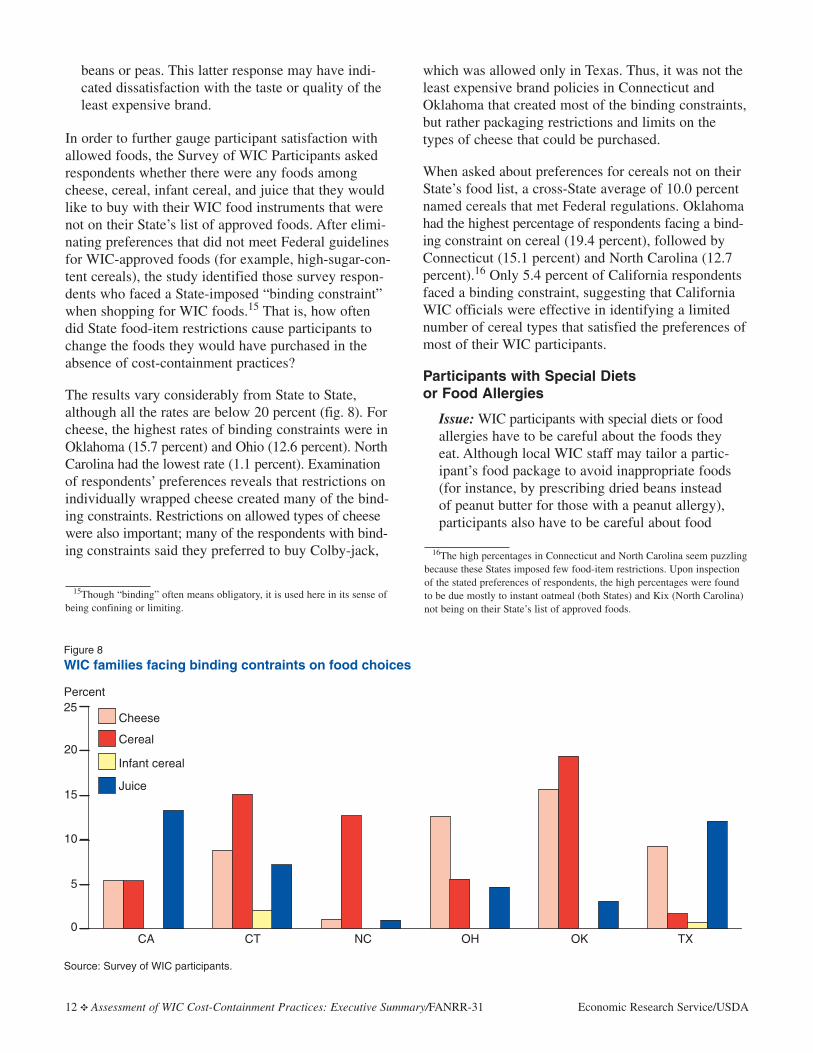
In order to further gauge participant satisfaction withallowed foods, the Survey of WIC Participants askedrespondents whether there were any foods amongcheese, cereal, infant cereal, and juice that they wouldlike to buy with their WIC food instruments that werenot on their State’s list of approved foods. After elimi-nating preferences that did not meet Federal guidelinesfor WIC-approved foods (for example, high-sugar-con-tent cereals), the study identified those survey respon-dents who faced a State-imposed “binding constraint”when shopping for WIC foods.15 That is, how oftendid State food-item restrictions cause participants tochange the foods they would have purchased in theabsence of cost-containment practices?
The results vary considerably from State to State,although all the rates are below 20 percent (fig. 8). Forcheese, the highest rates of binding constraints were inOklahoma (15.7 percent) and Ohio (12.6 percent). NorthCarolina had the lowest rate (1.1 percent). Examinationof respondents’ preferences reveals that restrictions onindividually wrapped cheese created many of the bind-ing constraints. Restrictions on allowed types of cheesewere also important; many of the respondents with bind-ing constraints said they preferred to buy Colby-jack,
which was allowed only in Texas. Thus, it was not theleast expensive brand policies in Connecticut andOklahoma that created most of the binding constraints,but rather packaging restrictions and limits on thetypes of cheese that could be purchased.
When asked about preferences for cereals not on theirState’s food list, a cross-State average of 10.0 percentnamed cereals that met Federal regulations. Oklahomahad the highest percentage of respondents facing a bind-ing constraint on cereal (19.4 percent), followed byConnecticut (15.1 percent) and North Carolina (12.7percent).16 Only 5.4 percent of California respondentsfaced a binding constraint, suggesting that CaliforniaWIC officials were effective in identifying a limitednumber of cereal types that satisfied the preferences ofmost of their WIC participants.
Participants with Special Diets or Food Allergies
Issue: WIC participants with special diets or foodallergies have to be careful about the foods theyeat. Although local WIC staff may tailor a partic-ipant’s food package to avoid inappropriate foods(for instance, by prescribing dried beans insteadof peanut butter for those with a peanut allergy),participants also have to be careful about food
12 ✥ Assessment of WIC Cost-Containment Practices: Executive Summary/FANRR-31 Economic Research Service/USDA
15Though “binding” often means obligatory, it is used here in its sense ofbeing confining or limiting.
Figure 8
WIC families facing binding contraints on food choices
Percent
0
5
10
15
20
25Cheese
CA CT NC OH OK TX
Source: Survey of WIC participants.
Cereal
Infant cereal
Juice
16The high percentages in Connecticut and North Carolina seem puzzlingbecause these States imposed few food-item restrictions. Upon inspectionof the stated preferences of respondents, the high percentages were foundto be due mostly to instant oatmeal (both States) and Kix (North Carolina)not being on their State’s list of approved foods.
ingredients. One concern with State restrictionson allowed food items is that participants withspecial diets or food allergies may have problemsshopping for appropriate foods, especially cere-als, when well-known brands, with known ingre-dients, are not included on the State’s list ofallowed foods.
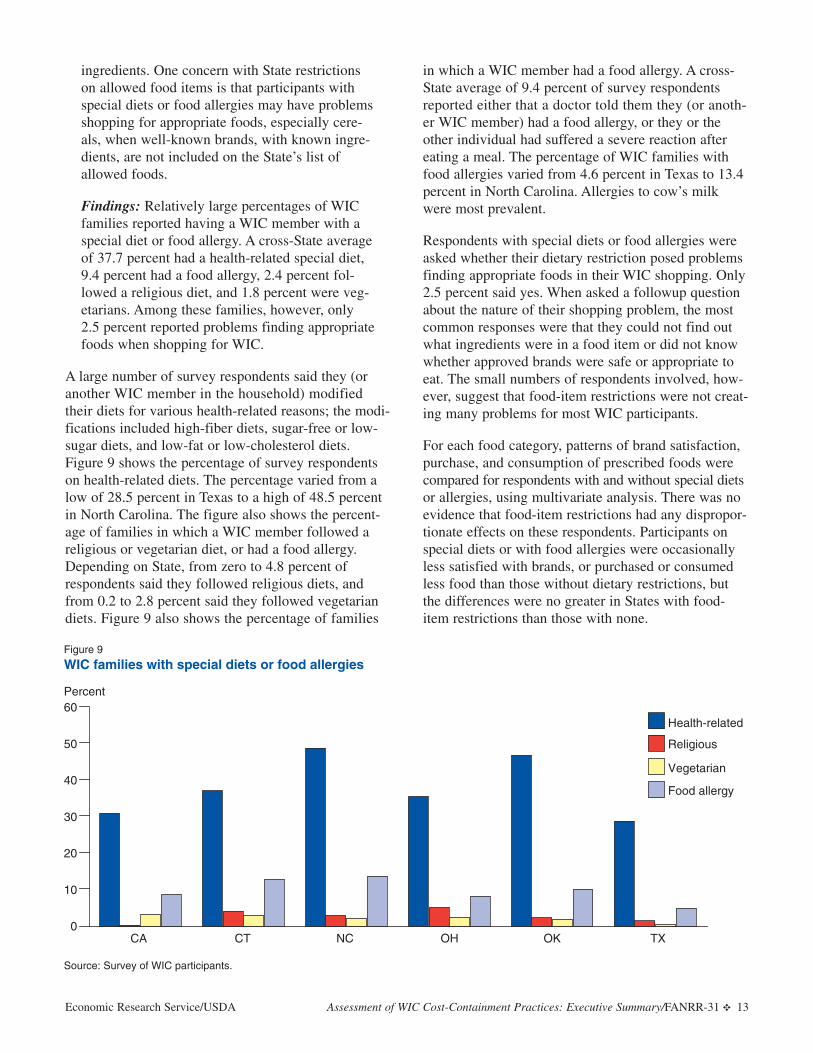
Findings: Relatively large percentages of WICfamilies reported having a WIC member with aspecial diet or food allergy. A cross-State averageof 37.7 percent had a health-related special diet,9.4 percent had a food allergy, 2.4 percent fol-lowed a religious diet, and 1.8 percent were veg-etarians. Among these families, however, only2.5 percent reported problems finding appropriatefoods when shopping for WIC.
A large number of survey respondents said they (oranother WIC member in the household) modifiedtheir diets for various health-related reasons; the modi-fications included high-fiber diets, sugar-free or low-sugar diets, and low-fat or low-cholesterol diets.Figure 9 shows the percentage of survey respondentson health-related diets. The percentage varied from alow of 28.5 percent in Texas to a high of 48.5 percentin North Carolina. The figure also shows the percent-age of families in which a WIC member followed areligious or vegetarian diet, or had a food allergy.Depending on State, from zero to 4.8 percent ofrespondents said they followed religious diets, andfrom 0.2 to 2.8 percent said they followed vegetariandiets. Figure 9 also shows the percentage of families
in which a WIC member had a food allergy. A cross-State average of 9.4 percent of survey respondentsreported either that a doctor told them they (or anoth-er WIC member) had a food allergy, or they or theother individual had suffered a severe reaction aftereating a meal. The percentage of WIC families withfood allergies varied from 4.6 percent in Texas to 13.4percent in North Carolina. Allergies to cow’s milkwere most prevalent.
Respondents with special diets or food allergies wereasked whether their dietary restriction posed problemsfinding appropriate foods in their WIC shopping. Only2.5 percent said yes. When asked a followup questionabout the nature of their shopping problem, the mostcommon responses were that they could not find outwhat ingredients were in a food item or did not knowwhether approved brands were safe or appropriate toeat. The small numbers of respondents involved, how-ever, suggest that food-item restrictions were not creat-ing many problems for most WIC participants.
For each food category, patterns of brand satisfaction,purchase, and consumption of prescribed foods werecompared for respondents with and without special dietsor allergies, using multivariate analysis. There was noevidence that food-item restrictions had any dispropor-tionate effects on these respondents. Participants onspecial diets or with food allergies were occasionallyless satisfied with brands, or purchased or consumedless food than those without dietary restrictions, butthe differences were no greater in States with food-item restrictions than those with none.
Economic Research Service/USDA Assessment of WIC Cost-Containment Practices: Executive Summary/FANRR-31 ✥ 13
Figure 9
WIC families with special diets or food allergies
Percent
CA CT NC OH OK TX
Source: Survey of WIC participants.
0
10
20
30
40
50
60Health-related
Religious
Vegetarian
Food allergy
Food Instrument Redemption
Issue: Participant dissatisfaction with vendor orfood-item restrictions could lead to reduced useof food instruments (that is, WIC vouchers orchecks), defeating the program goal of supple-menting participants’ diets with nutritious foods.Three types of behavior could reduce food instru-ment use:
(1) Participants could fail to pick up their foodinstruments at the local WIC office or clinic.
(2) They could fail to redeem some or all oftheir food instruments.
(3) For instruments that are redeemed, partici-pants could purchase only some of the prescribed foods.
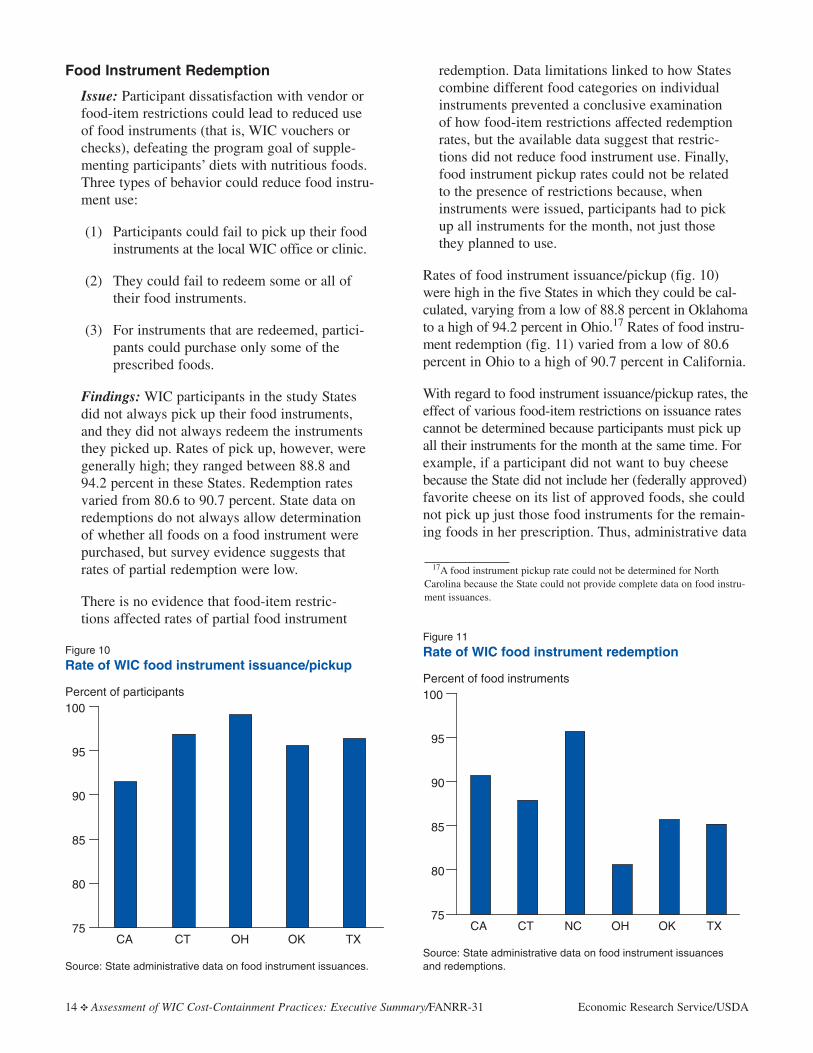
Findings: WIC participants in the study Statesdid not always pick up their food instruments,and they did not always redeem the instrumentsthey picked up. Rates of pick up, however, weregenerally high; they ranged between 88.8 and94.2 percent in these States. Redemption ratesvaried from 80.6 to 90.7 percent. State data onredemptions do not always allow determinationof whether all foods on a food instrument werepurchased, but survey evidence suggests thatrates of partial redemption were low.
There is no evidence that food-item restric-tions affected rates of partial food instrument
redemption. Data limitations linked to how Statescombine different food categories on individualinstruments prevented a conclusive examinationof how food-item restrictions affected redemptionrates, but the available data suggest that restric-tions did not reduce food instrument use. Finally,food instrument pickup rates could not be relatedto the presence of restrictions because, wheninstruments were issued, participants had to pickup all instruments for the month, not just thosethey planned to use.
Rates of food instrument issuance/pickup (fig. 10)were high in the five States in which they could be cal-culated, varying from a low of 88.8 percent in Oklahomato a high of 94.2 percent in Ohio.17 Rates of food instru-ment redemption (fig. 11) varied from a low of 80.6percent in Ohio to a high of 90.7 percent in California.
With regard to food instrument issuance/pickup rates, theeffect of various food-item restrictions on issuance ratescannot be determined because participants must pick upall their instruments for the month at the same time. Forexample, if a participant did not want to buy cheesebecause the State did not include her (federally approved)favorite cheese on its list of approved foods, she couldnot pick up just those food instruments for the remain-ing foods in her prescription. Thus, administrative data
14 ✥ Assessment of WIC Cost-Containment Practices: Executive Summary/FANRR-31 Economic Research Service/USDA
17A food instrument pickup rate could not be determined for NorthCarolina because the State could not provide complete data on food instru-ment issuances.
Figure 10
Rate of WIC food instrument issuance/pickup
Percent of participants
Source: State administrative data on food instrument issuances.
75
80
85
90
95
100
CA CT OH OK TX
Figure 11
Rate of WIC food instrument redemption
Percent of food instruments
Source: State administrative data on food instrument issuances and redemptions.
CA CT NC OH OK TX75
80
85
90
95
100
on food instrument issuance cannot isolate the possibleimpacts of different food-item restrictions.
The impacts of food-item restrictions on redemptionrates could be examined because participants canredeem instruments containing desired foods, whilenot using those containing foods whose appeal wasreduced by the restrictions. However, the presence ofmultiple food categories on many food instrumentsmade this a challenging analysis because some cate-gories were subject to restrictions whereas others werenot. Attempts to model the likelihood of food instru-ment use as a function of prescribed foods, foodrestrictions, and other variables were unsuccessful;model results were inconsistent and extremely sensi-tive to model specification. Examination of redemp-tion rates, by State, for all instruments containing par-ticular food categories found that redemption rateswere often higher, rather than lower, in States withrestrictions, suggesting that unmeasured State-leveleffects were obscuring any possible effects of therestrictions. Thus, if food-item restrictions did reducerates of food instrument redemption in these States, theeffects were too small to detect with available data.
The Survey of WIC Participants did ask about pur-chase behavior. The survey results do not unambigu-ously identify partial redemption, because respondentswho said they did not buy “all” of a prescribed foodcould have either partially redeemed an instrument ornot redeemed it at all. Nevertheless, the survey resultsprovide an upper bound for rates of partial redemption.
The food category most often redeemed in full wascheese in California, where only 0.6 percent of respon-dents said they did not purchase all. The highest ratefor not buying all was 33.5 percent for driedbeans/peas in North Carolina. Averaged over all sixStates, the highest rates for not buying all prescribedfood were 13.1 percent for dried beans/peas and 10.9percent for infant cereal. Only one rate differencebetween restricted and unrestricted States was statisti-cally significant (a 3.6-percentage-point difference forjuice), but the direction was opposite to what onewould expect from food-item restrictions. Thus, thesurvey results indicate that food-item restrictions werenot related to rates of partial redemption.
Program Participation
Issue: One concern with the use of cost-con-tainment practices is that they may reduce partic-ipants’ satisfaction with the WIC program, lead-ing to reduced participation, and hence, reduced
distribution of health and nutrition benefits to eli-gible individuals. The study addressed this possi-bility by examining program “dropout” rates andconducting focus groups with WIC dropouts todetermine whether State restrictions on vendorsor food choice contributed to their decision toleave the program.18
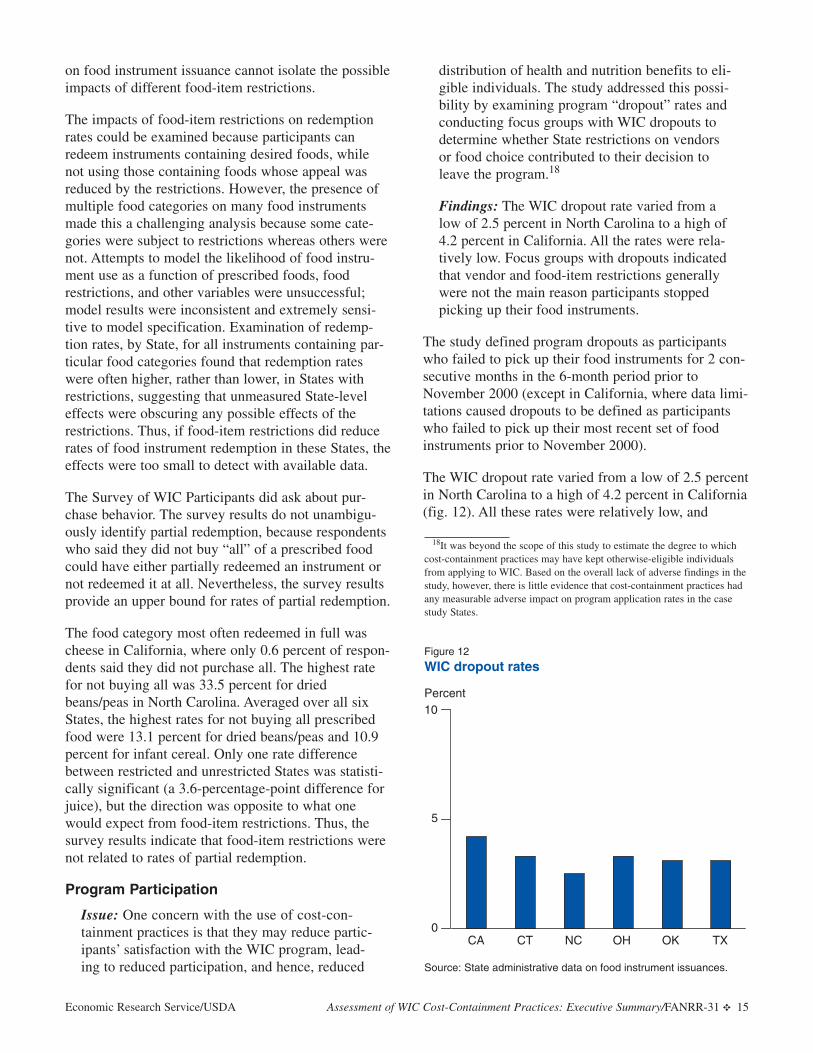
Findings: The WIC dropout rate varied from alow of 2.5 percent in North Carolina to a high of4.2 percent in California. All the rates were rela-tively low. Focus groups with dropouts indicatedthat vendor and food-item restrictions generallywere not the main reason participants stoppedpicking up their food instruments.
The study defined program dropouts as participantswho failed to pick up their food instruments for 2 con-secutive months in the 6-month period prior toNovember 2000 (except in California, where data limi-tations caused dropouts to be defined as participantswho failed to pick up their most recent set of foodinstruments prior to November 2000).
The WIC dropout rate varied from a low of 2.5 percentin North Carolina to a high of 4.2 percent in California(fig. 12). All these rates were relatively low, and
Economic Research Service/USDA Assessment of WIC Cost-Containment Practices: Executive Summary/FANRR-31 ✥ 15
18It was beyond the scope of this study to estimate the degree to whichcost-containment practices may have kept otherwise-eligible individualsfrom applying to WIC. Based on the overall lack of adverse findings in thestudy, however, there is little evidence that cost-containment practices hadany measurable adverse impact on program application rates in the casestudy States.
Figure 12
WIC dropout rates
Percent
Source: State administrative data on food instrument issuances.
CA CT NC OH OK TX
10
5
0
factors unrelated to cost containment (for instance,problems getting to the clinic for an appointment, diffi-culty using the food instruments, or the belief that onewas no longer eligible for WIC) explained some of thedropouts.
Focus group sessions were held with dropouts whosaid, during a screening interview, that vendor or food-item restrictions contributed to their dropping out.Finding enough dropouts who met the screening crite-ria proved difficult, suggesting that most dropoutsfailed to pick up their instruments for reasons unrelat-ed to cost-containment practices. Indeed, even amongthe focus group respondents, the major reasons fordropping out were unpleasant experiences at WIC clin-ics and the “hassle” of picking up one’s food instru-ments. Only about one-third of all focus group respon-dents said that food-item restrictions were their majoror second most important reason for dropping out.Vendor restrictions were seldom mentioned. Thus,although cost-containment practices may have con-tributed to the decision of some participants to stopparticipating in WIC, the evidence suggests that anyeffects were small.
Health Outcomes
Issue: WIC cost-containment practices do notdirectly affect the health outcomes of WIC par-ticipants, but there is potential for an indirecteffect. If limits on food choice result in reducedfood instrument redemption or food use, thenWIC’s goal of improving health and nutrition sta-tus by providing nutrient-dense foods could becompromised. Similarly, if cost-containmentpractices cause participants to drop out of theprogram, they would not have access to the pro-gram’s nutrition education and health referralservices.
Findings: Based on study results, there is littleevidence that the six States’ cost-containmentpractices affected food instrument redemption,food use, or participation rates. Thus, the studyconcludes that these cost-containment practicescould not have had adverse effects on health out-comes of participants.
Despite the conclusion that cost-containment practicescould not have affected health outcomes because theydid not affect food instrument redemption or food use,the study did examine the relationship between foodinstrument redemption rates and changes in four healthmeasures, based on WIC participants observed in the
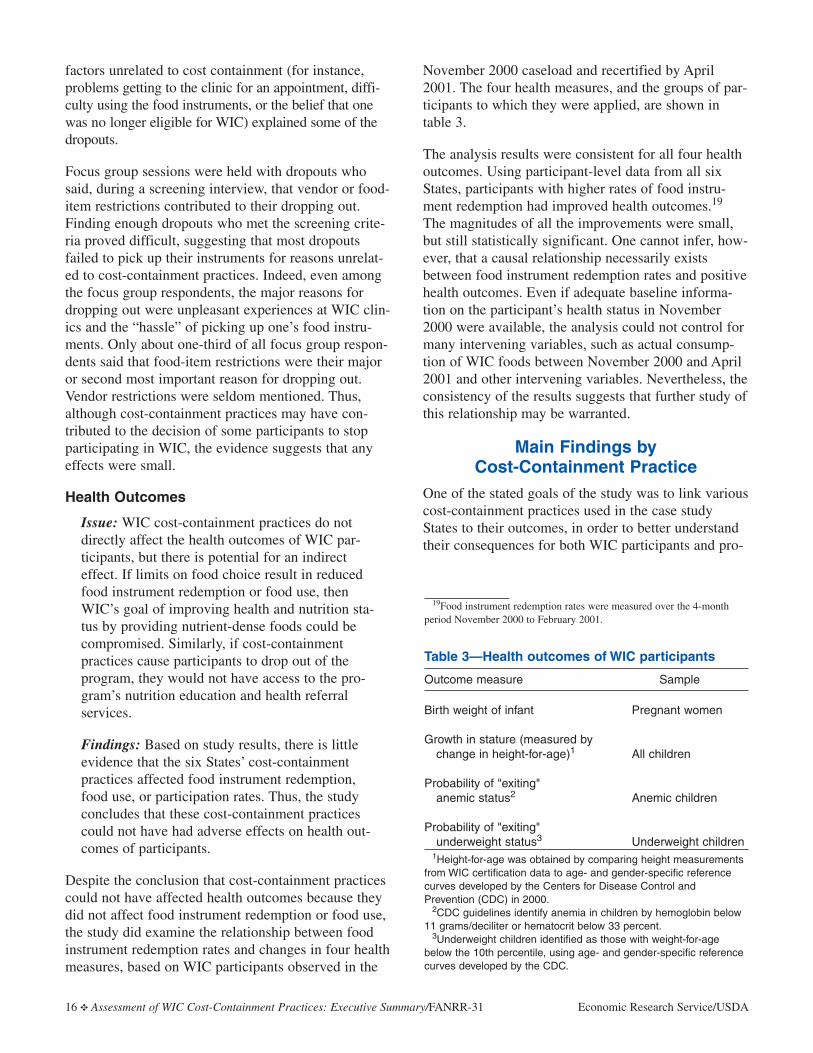
November 2000 caseload and recertified by April2001. The four health measures, and the groups of par-ticipants to which they were applied, are shown intable 3.
The analysis results were consistent for all four healthoutcomes. Using participant-level data from all sixStates, participants with higher rates of food instru-ment redemption had improved health outcomes.19
The magnitudes of all the improvements were small,but still statistically significant. One cannot infer, how-ever, that a causal relationship necessarily existsbetween food instrument redemption rates and positivehealth outcomes. Even if adequate baseline informa-tion on the participant’s health status in November2000 were available, the analysis could not control formany intervening variables, such as actual consump-tion of WIC foods between November 2000 and April2001 and other intervening variables. Nevertheless, theconsistency of the results suggests that further study ofthis relationship may be warranted.
Main Findings byCost-Containment Practice
One of the stated goals of the study was to link variouscost-containment practices used in the case studyStates to their outcomes, in order to better understandtheir consequences for both WIC participants and pro-
16 ✥ Assessment of WIC Cost-Containment Practices: Executive Summary/FANRR-31 Economic Research Service/USDA
19Food instrument redemption rates were measured over the 4-monthperiod November 2000 to February 2001.
Table 3—Health outcomes of WIC participants
Outcome measure Sample
Birth weight of infant Pregnant women
Growth in stature (measured by change in height-for-age)1 All children
Probability of "exiting" anemic status2 Anemic children
Probability of "exiting" underweight status3 Underweight children
1Height-for-age was obtained by comparing height measurementsfrom WIC certification data to age- and gender-specific referencecurves developed by the Centers for Disease Control andPrevention (CDC) in 2000.
2CDC guidelines identify anemia in children by hemoglobin below11 grams/deciliter or hematocrit below 33 percent.
3Underweight children identified as those with weight-for-agebelow the 10th percentile, using age- and gender-specific referencecurves developed by the CDC.
gram administration. This section presents each majorcost-containment practice and its associated outcomes.However, the section also presents the combinedimpact of multiple restrictions that affect the samefood category (for instance, savings arising when aState restricts both allowed types and packaging ofjuice).
Competitive Pricing at Application
Four of the six States (all but North Carolina andOhio) used competitive price criteria when selectingstores to authorize as WIC vendors. The study foundno evidence that use of price criteria at application hadan adverse effect on participants’ access to vendorlocations, availability of food items, or continuing par-ticipation. This was not surprising because State offi-cials said they rarely denied vendor authorizationbased on prices. Instead, in order to receive authoriza-tion, stores with high prices often agreed to reducetheir pricing for WIC purchases.
The study did not examine whether this vendor restric-tion had an impact on average food package costs. Aneffect, if one existed, could have gone either way. Bykeeping out high-price stores, average food packagecosts could have been reduced. By allowing high-pricestores to reduce prices to meet price criteria, however,such policies could have raised average costs byauthorizing more stores at the high end of the pricedistribution. If so, this is a tradeoff that State officialsseemed willing to make in order to improve participantaccess to WIC vendors.
The use of competitive pricing at application was notexpected to have an impact on the other outcomemeasures under investigation—satisfaction with anduse of prescribed foods, disproportionate effects onparticipants on special diets or with food allergies,redemption of food instruments, or achievement ofpositive health outcomes.
Requiring Purchase of Least Expensive Brands
The most common food-item restriction in the sixStates was the requirement that participants purchasethe least expensive brand of a food category availablein the store. Connecticut had this policy for milk, eggs,cheese, citrus juice, and peanut butter. North Carolina,which was selected for this study because it used veryfew cost-containment practices, required purchase ofthe least expensive brand of milk. Oklahoma had aleast expensive brand policy for milk, eggs, cheese,
and dried beans/peas, and Texas required purchase ofthe least expensive brand of milk and juice.
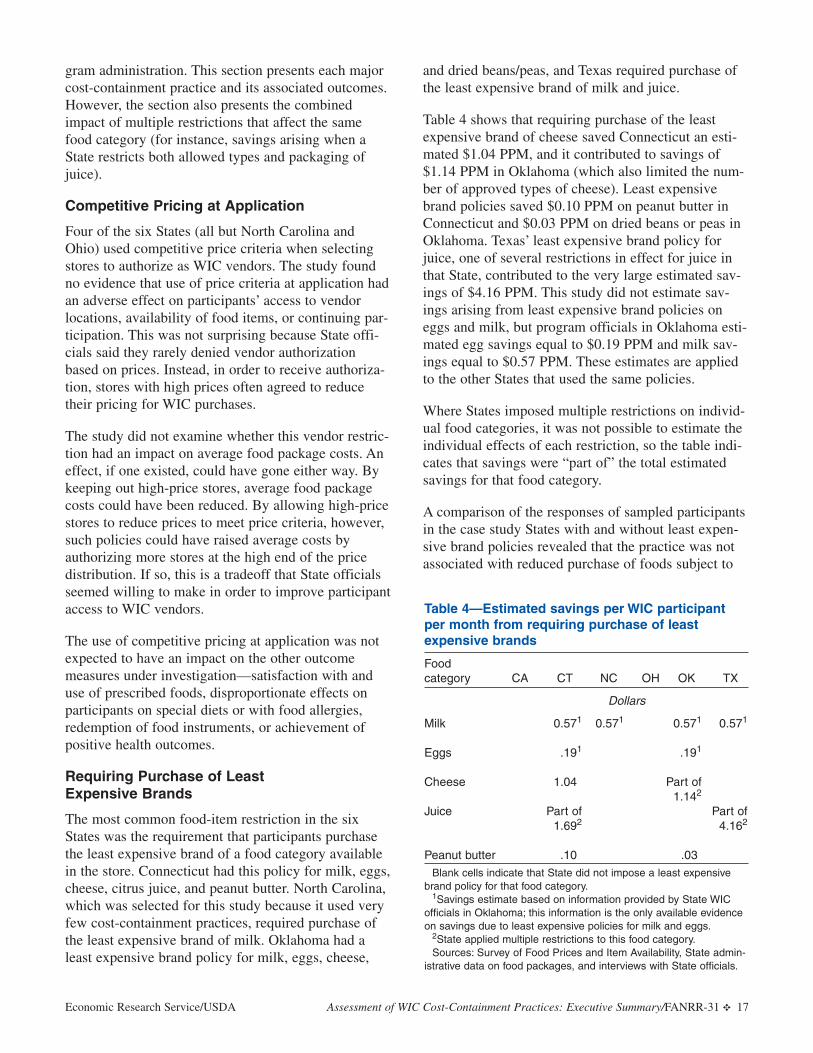
Table 4 shows that requiring purchase of the leastexpensive brand of cheese saved Connecticut an esti-mated $1.04 PPM, and it contributed to savings of$1.14 PPM in Oklahoma (which also limited the num-ber of approved types of cheese). Least expensivebrand policies saved $0.10 PPM on peanut butter inConnecticut and $0.03 PPM on dried beans or peas inOklahoma. Texas’ least expensive brand policy forjuice, one of several restrictions in effect for juice inthat State, contributed to the very large estimated sav-ings of $4.16 PPM. This study did not estimate sav-ings arising from least expensive brand policies oneggs and milk, but program officials in Oklahoma esti-mated egg savings equal to $0.19 PPM and milk sav-ings equal to $0.57 PPM. These estimates are appliedto the other States that used the same policies.
Where States imposed multiple restrictions on individ-ual food categories, it was not possible to estimate theindividual effects of each restriction, so the table indi-cates that savings were “part of” the total estimatedsavings for that food category.
A comparison of the responses of sampled participantsin the case study States with and without least expen-sive brand policies revealed that the practice was notassociated with reduced purchase of foods subject to
Economic Research Service/USDA Assessment of WIC Cost-Containment Practices: Executive Summary/FANRR-31 ✥ 17
Table 4—Estimated savings per WIC participant per month from requiring purchase of least expensive brands
Foodcategory CA CT NC OH OK TX
Dollars
Milk 0.571 0.571 0.571 0.571
Eggs .191 .191
Cheese 1.04 Part of1.142
Juice Part of Part of1.692 4.162
Peanut butter .10 .03Blank cells indicate that State did not impose a least expensive
brand policy for that food category.1Savings estimate based on information provided by State WIC
officials in Oklahoma; this information is the only available evidenceon savings due to least expensive policies for milk and eggs.
2State applied multiple restrictions to this food category.Sources: Survey of Food Prices and Item Availability, State admin-
istrative data on food packages, and interviews with State officials.
the restrictions. The policies were correlated withreduced levels of consumption of milk, cheese, eggs,and dried beans/peas, but not peanut butter or juice. Inall cases except dried beans/peas, however, respon-dents who did not eat all the purchased food cited fac-tors unrelated to food-item restrictions as the main rea-son (for instance, that too much food had been pre-scribed). Thus, whether least expensive brand policiesreduced consumption is unclear. If so, the magnitudeof the effect was too small to detect.
There is no evidence that the use of least expensivebrand policies affected the study’s other outcomemeasures, or that they had disproportionate effects onparticipants on special diets or with food allergies.
Limiting Approved Brands
Oklahoma was the only State that required purchase ofprivate-label or store-brand items for cereals and juice.Texas also placed limits on brands of juice, allowingselected national brands.
Oklahoma’s restrictions against national brands of cerealsaved an estimated $2.72 PPM. The restrictions, howev-er, were associated with lower levels of participant sat-isfaction with allowed brands of cereal, reduced levelsof cereal purchase, and reduced levels of consumption.In response to participant preferences, Oklahomaadded some national-brand cereals to its list ofapproved foods after data for this study were collected.
Brand restrictions on juice had no impact on expressedlevels of satisfaction with approved brands, and theydid not reduce either the amount of juice purchased orconsumed.
Finally, there is no evidence that limiting the numberof approved juice and cereal brands affected rates ofeither food instrument pickup (based on focus grouprespondents’ reasons for dropping out of WIC), instru-ment redemption, achievement of positive health out-comes, or the availability of allowed juice or cereal inthese States.
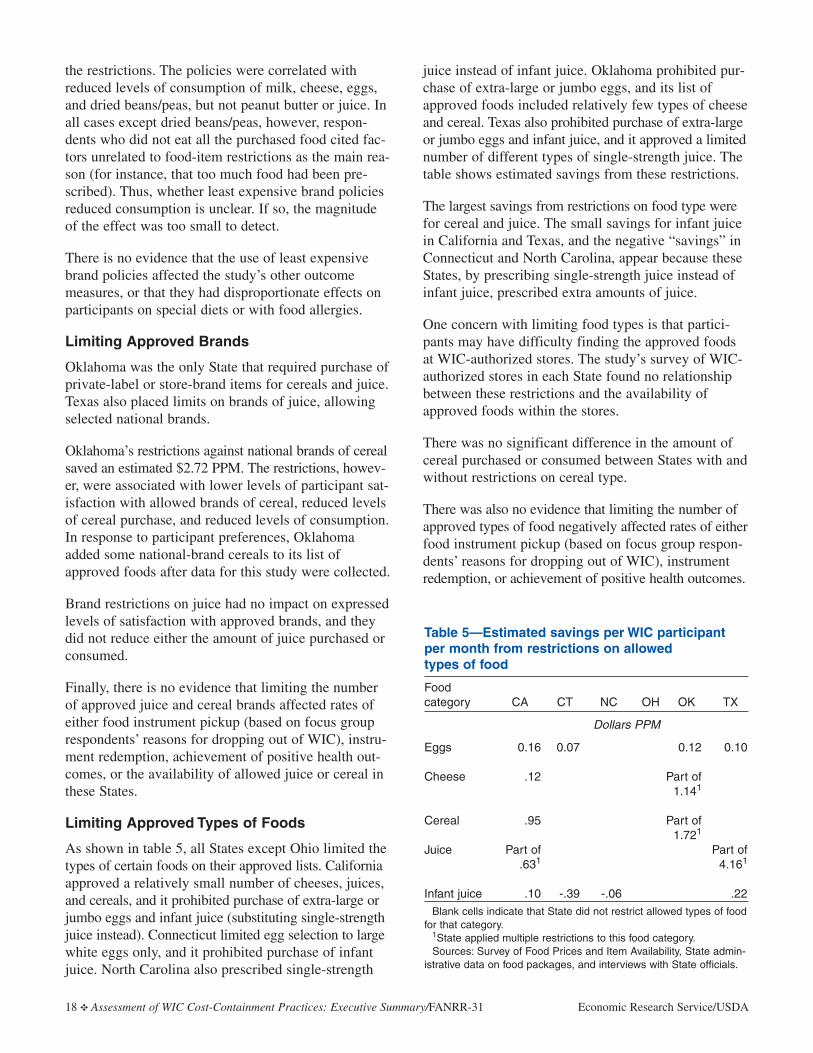
Limiting Approved Types of Foods
As shown in table 5, all States except Ohio limited thetypes of certain foods on their approved lists. Californiaapproved a relatively small number of cheeses, juices,and cereals, and it prohibited purchase of extra-large orjumbo eggs and infant juice (substituting single-strengthjuice instead). Connecticut limited egg selection to largewhite eggs only, and it prohibited purchase of infantjuice. North Carolina also prescribed single-strength
juice instead of infant juice. Oklahoma prohibited pur-chase of extra-large or jumbo eggs, and its list ofapproved foods included relatively few types of cheeseand cereal. Texas also prohibited purchase of extra-largeor jumbo eggs and infant juice, and it approved a limitednumber of different types of single-strength juice. Thetable shows estimated savings from these restrictions.
The largest savings from restrictions on food type werefor cereal and juice. The small savings for infant juicein California and Texas, and the negative “savings” inConnecticut and North Carolina, appear because theseStates, by prescribing single-strength juice instead ofinfant juice, prescribed extra amounts of juice.
One concern with limiting food types is that partici-pants may have difficulty finding the approved foodsat WIC-authorized stores. The study’s survey of WIC-authorized stores in each State found no relationshipbetween these restrictions and the availability ofapproved foods within the stores.
There was no significant difference in the amount ofcereal purchased or consumed between States with andwithout restrictions on cereal type.
There was also no evidence that limiting the number ofapproved types of food negatively affected rates of eitherfood instrument pickup (based on focus group respon-dents’ reasons for dropping out of WIC), instrumentredemption, or achievement of positive health outcomes.
18 ✥ Assessment of WIC Cost-Containment Practices: Executive Summary/FANRR-31 Economic Research Service/USDA
Table 5—Estimated savings per WIC participant per month from restrictions on allowed types of food
Foodcategory CA CT NC OH OK TX
Dollars PPM
Eggs 0.16 0.07 0.12 0.10
Cheese .12 Part of1.141
Cereal .95 Part of1.721
Juice Part of Part of.631 4.161
Infant juice .10 -.39 -.06 .22Blank cells indicate that State did not restrict allowed types of food
for that category.1State applied multiple restrictions to this food category.Sources: Survey of Food Prices and Item Availability, State admin-
istrative data on food packages, and interviews with State officials.
Limiting the Allowed Packaging of Foods
All six States set minimum package sizes for at leastone WIC food group. California, Oklahoma, and Texashad the most package-size restrictions.
Ohio and Oklahoma generally prohibited purchase ofmilk in half-gallon or quart containers. These restrictionssaved the States an estimated $0.05 PPM in both Ohioand Oklahoma. State officials in California estimatedthat their efforts to have participants buy milk in 2-gal-lon “value packs” saved an amount equal to $0.38 PPM.
Restrictions on egg sizes saved an estimated $0.16PPM in California, $0.07 PPM in Connecticut, $0.12PPM in Oklahoma, and $0.10 PPM in Texas.
Texas imposed larger package size requirements oncereal purchases to take advantage of their lower perounce costs. The estimated savings from this policywere $2.00 PPM. The State’s restrictions on shelf-sta-ble juice containers (46-ounce cans only) contributedto juice savings of $4.16 PPM.
There is no evidence that limiting the package formsof food negatively affected either rates of food instru-ment pickup (based on focus group respondents’ rea-sons for dropping out of WIC), instrument redemption,consumption of prescribed foods, the achievement ofpositive health outcomes, or program participation.
Manufacturer Rebates
California, Connecticut, and Texas received rebates onsales of infant cereal through contracts that specified asingle allowed brand. These rebates saved an estimated$0.32 PPM in California, $0.37 PPM in Connecticut,and $0.27 PPM in Texas.
The infant cereal rebates did not affect the availabilityof allowed brands in the three States. They were bindingon almost no WIC participants, and the brand restric-tions were not related to levels of brand satisfaction,amount purchased, or amount consumed. There is alsono evidence that the infant cereal rebates affected ratesof food instrument redemption, program participation,or the achievement of positive health outcomes.
Multiple Food-Item Restrictions
The States in the study imposed multiple food-itemrestrictions for some foods, and it was not possible forthe study to estimate the singular effect of the individ-ual restrictions. This section summarizes the totaleffects of these multiple restrictions.
For cheese, least expensive brand policies and restric-tions on type and packaging created binding con-straints on a cross-State average of 8.8 percent of sur-vey respondents, with the lowest rate in NorthCarolina (1.1 percent) and the highest rates inOklahoma (15.7 percent) and Ohio (12.6 percent).
Restrictions on brand, type, and packaging of breakfastcereal were binding on a cross-State average of 10.0percent of survey respondents, with the highest rates inOklahoma (19.4 percent), Connecticut (15.1 percent),and North Carolina (12.7 percent). Texas had the low-est rate (1.7 percent).
Least expensive brand policies and restrictions onbrand, type, and packaging of juice were binding on across-State average of 6.9 percent of survey respon-dents, with the highest rates in California (13.3 per-cent) and Texas (12.1 percent). The lowest rate was inNorth Carolina (1.0 percent).
Finally, there is no evidence that any food-item restric-tions had a differential impact on WIC participantswith food allergies or those on special diets.
Implications of the Findingsfor Other States
The cost-containment practices implemented by the sixcase study States were relatively inexpensive to man-age and operate, reduced food package costs, and hadfew adverse impacts on WIC participants. It is there-fore tempting to conclude that all States should imple-ment similar practices.20
For cost-containment practices to work, they need tobe well managed by State officials. The success of costcontainment in the case study States was the result ofongoing efforts by these States to find those restric-tions that both reduced food package costs and wereacceptable to participants. (For instance, all six Statescollected price information on a regular basis andobtained feedback from local offices on participantcomments on allowed foods.) What works well in oneState might not work at all in another. Similarly, aneffective practice today may not work tomorrow.Selecting and managing appropriate cost-containmentpractices is therefore a dynamic process, requiringongoing attention to local food markets (especially
Economic Research Service/USDA Assessment of WIC Cost-Containment Practices: Executive Summary/FANRR-31 ✥ 19
20Many other States, of course, already use cost-containment practices(see appendix A for practices adopted by States). The six States in thisstudy were selected to allow analysis of different combinations of thesepractices.
price and availability of federally approved fooditems) and participant preferences.
A critical factor in this process lies in the ongoingevaluation of program effectiveness. To facilitate thisactivity, States should not overlook the ability to sys-tematically collect and analyze relevant data. In theprocess of assessing cost-containment practices for thisstudy, considerable limitations and difficulties wereencountered due to a lack of program information inreadily usable form. In most States, for example, theeffects of cost-containment practices on food redemp-tions could not be completely analyzed due to differentfoods being combined on individual food instruments.
This study provides evidence that cost-containmentpractices can reduce WIC food package costs.Estimates of cost savings in other States are beyondthe scope of this study, as are estimates of the potentialfor additional savings if further restrictions wereadopted. The potential for further cost savings woulddepend on States’ current use of vendor and itemrestrictions and Federal incentives for States to adoptadditional restrictions. Furthermore, not all cost-con-tainment practices may be appropriate for all Statesbecause of differences in item prices, availability, andparticipant preferences. States therefore need the flexi-bility to find the right balance between food costreductions and limits on participant choice and use.
20 ✥ Assessment of WIC Cost-Containment Practices: Executive Summary/FANRR-31 Economic Research Service/USDA
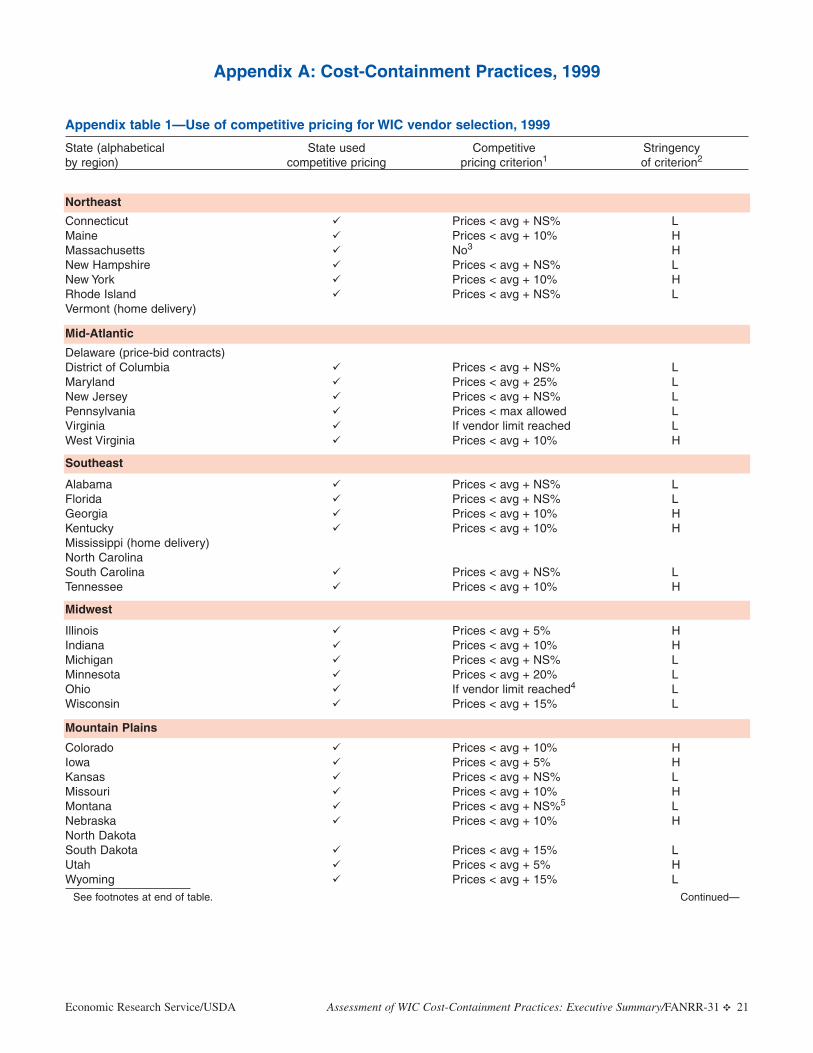
Economic Research Service/USDA Assessment of WIC Cost-Containment Practices: Executive Summary/FANRR-31 ✥ 21
Appendix table 1—Use of competitive pricing for WIC vendor selection, 1999
State (alphabetical State used Competitive Stringencyby region) competitive pricing pricing criterion1 of criterion2
Connecticut � Prices < avg + NS% LMaine � Prices < avg + 10% HMassachusetts � No3 HNew Hampshire � Prices < avg + NS% LNew York � Prices < avg + 10% HRhode Island � Prices < avg + NS% LVermont (home delivery)
Delaware (price-bid contracts)District of Columbia � Prices < avg + NS% LMaryland � Prices < avg + 25% LNew Jersey � Prices < avg + NS% LPennsylvania � Prices < max allowed LVirginia � If vendor limit reached LWest Virginia � Prices < avg + 10% H
Alabama � Prices < avg + NS% LFlorida � Prices < avg + NS% LGeorgia � Prices < avg + 10% HKentucky � Prices < avg + 10% HMississippi (home delivery)North CarolinaSouth Carolina � Prices < avg + NS% LTennessee � Prices < avg + 10% H
Illinois � Prices < avg + 5% HIndiana � Prices < avg + 10% HMichigan � Prices < avg + NS% LMinnesota � Prices < avg + 20% LOhio � If vendor limit reached4 LWisconsin � Prices < avg + 15% L
Colorado � Prices < avg + 10% HIowa � Prices < avg + 5% HKansas � Prices < avg + NS% LMissouri � Prices < avg + 10% HMontana � Prices < avg + NS%5 LNebraska � Prices < avg + 10% HNorth DakotaSouth Dakota � Prices < avg + 15% LUtah � Prices < avg + 5% HWyoming � Prices < avg + 15% L
See footnotes at end of table. Continued—
Northeast
Mid-Atlantic
Southeast
Appendix A: Cost-Containment Practices, 1999
Midwest
Mountain Plains
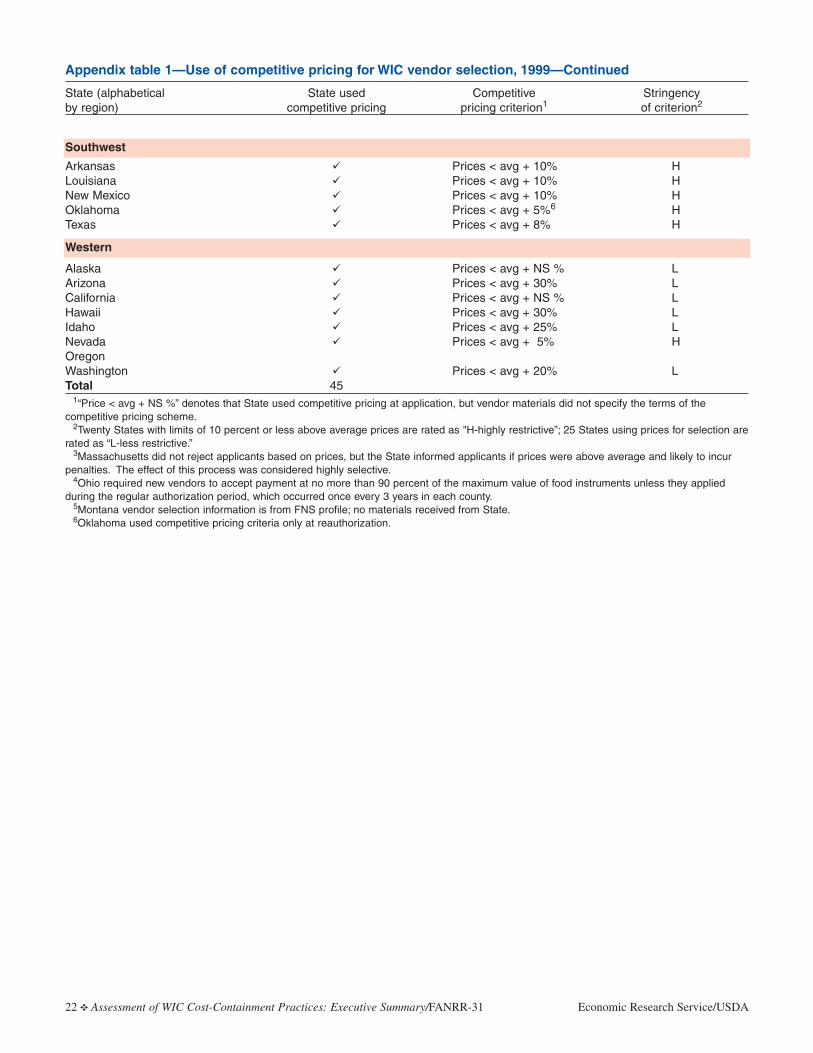
22 ✥ Assessment of WIC Cost-Containment Practices: Executive Summary/FANRR-31 Economic Research Service/USDA
Appendix table 1—Use of competitive pricing for WIC vendor selection, 1999—Continued
State (alphabetical State used Competitive Stringencyby region) competitive pricing pricing criterion1 of criterion2
Arkansas � Prices < avg + 10% HLouisiana � Prices < avg + 10% HNew Mexico � Prices < avg + 10% HOklahoma � Prices < avg + 5%6 HTexas � Prices < avg + 8% H
Alaska � Prices < avg + NS % LArizona � Prices < avg + 30% LCalifornia � Prices < avg + NS % LHawaii � Prices < avg + 30% LIdaho � Prices < avg + 25% LNevada � Prices < avg + 5% HOregonWashington � Prices < avg + 20% LTotal 45
1“Price < avg + NS %” denotes that State used competitive pricing at application, but vendor materials did not specify the terms of the competitive pricing scheme.
2Twenty States with limits of 10 percent or less above average prices are rated as "H-highly restrictive”; 25 States using prices for selection arerated as “L-less restrictive.”
3Massachusetts did not reject applicants based on prices, but the State informed applicants if prices were above average and likely to incurpenalties. The effect of this process was considered highly selective.
4Ohio required new vendors to accept payment at no more than 90 percent of the maximum value of food instruments unless they applied during the regular authorization period, which occurred once every 3 years in each county.
5Montana vendor selection information is from FNS profile; no materials received from State.6Oklahoma used competitive pricing criteria only at reauthorization.
Southwest
Western
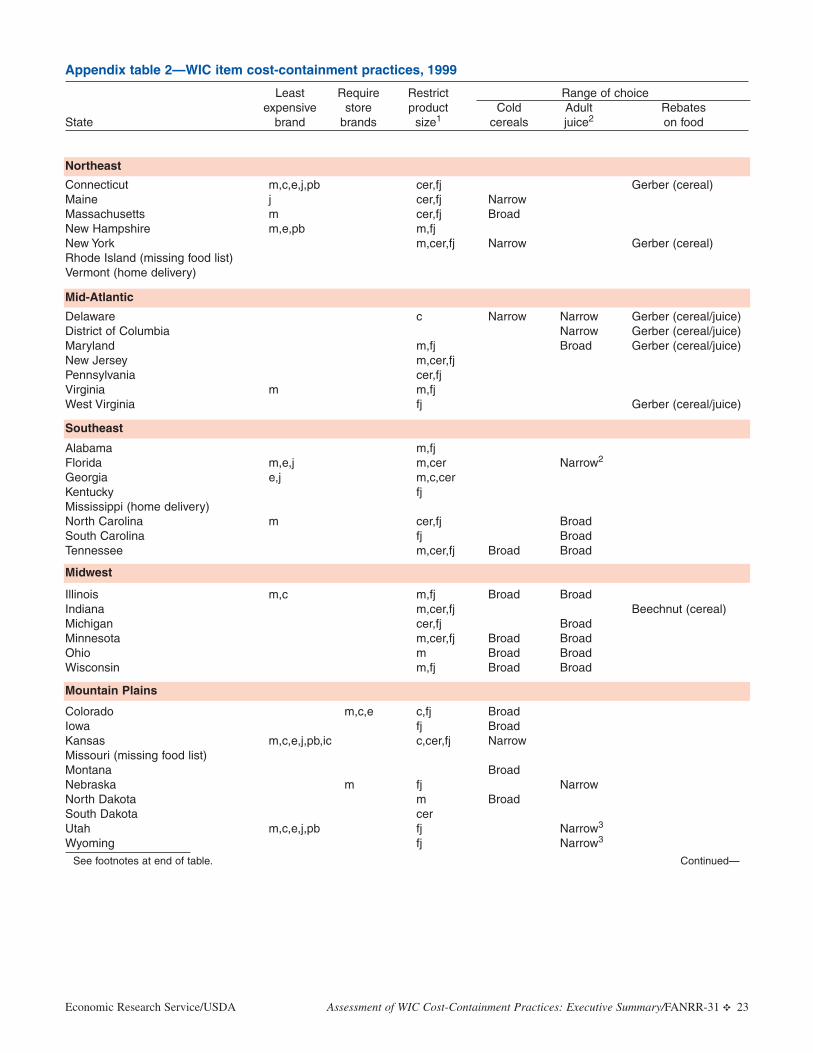
Economic Research Service/USDA Assessment of WIC Cost-Containment Practices: Executive Summary/FANRR-31 ✥ 23
Appendix table 2—WIC item cost-containment practices, 1999
Least Require Restrict Range of choiceexpensive store product Cold Adult Rebates
State brand brands size1 cereals juice2 on food
Connecticut m,c,e,j,pb cer,fj Gerber (cereal)Maine j cer,fj NarrowMassachusetts m cer,fj BroadNew Hampshire m,e,pb m,fjNew York m,cer,fj Narrow Gerber (cereal)Rhode Island (missing food list)Vermont (home delivery)
Delaware c Narrow Narrow Gerber (cereal/juice)District of Columbia Narrow Gerber (cereal/juice)Maryland m,fj Broad Gerber (cereal/juice)New Jersey m,cer,fjPennsylvania cer,fjVirginia m m,fjWest Virginia fj Gerber (cereal/juice)
Alabama m,fjFlorida m,e,j m,cer Narrow2
Georgia e,j m,c,cerKentucky fjMississippi (home delivery)North Carolina m cer,fj BroadSouth Carolina fj BroadTennessee m,cer,fj Broad Broad
Illinois m,c m,fj Broad BroadIndiana m,cer,fj Beechnut (cereal)Michigan cer,fj BroadMinnesota m,cer,fj Broad BroadOhio m Broad BroadWisconsin m,fj Broad Broad
Colorado m,c,e c,fj BroadIowa fj BroadKansas m,c,e,j,pb,ic c,cer,fj NarrowMissouri (missing food list)Montana BroadNebraska m fj NarrowNorth Dakota m BroadSouth Dakota cerUtah m,c,e,j,pb fj Narrow3
Wyoming fj Narrow3
See footnotes at end of table. Continued—
Northeast
Mid-Atlantic
Southeast
Midwest
Mountain Plains
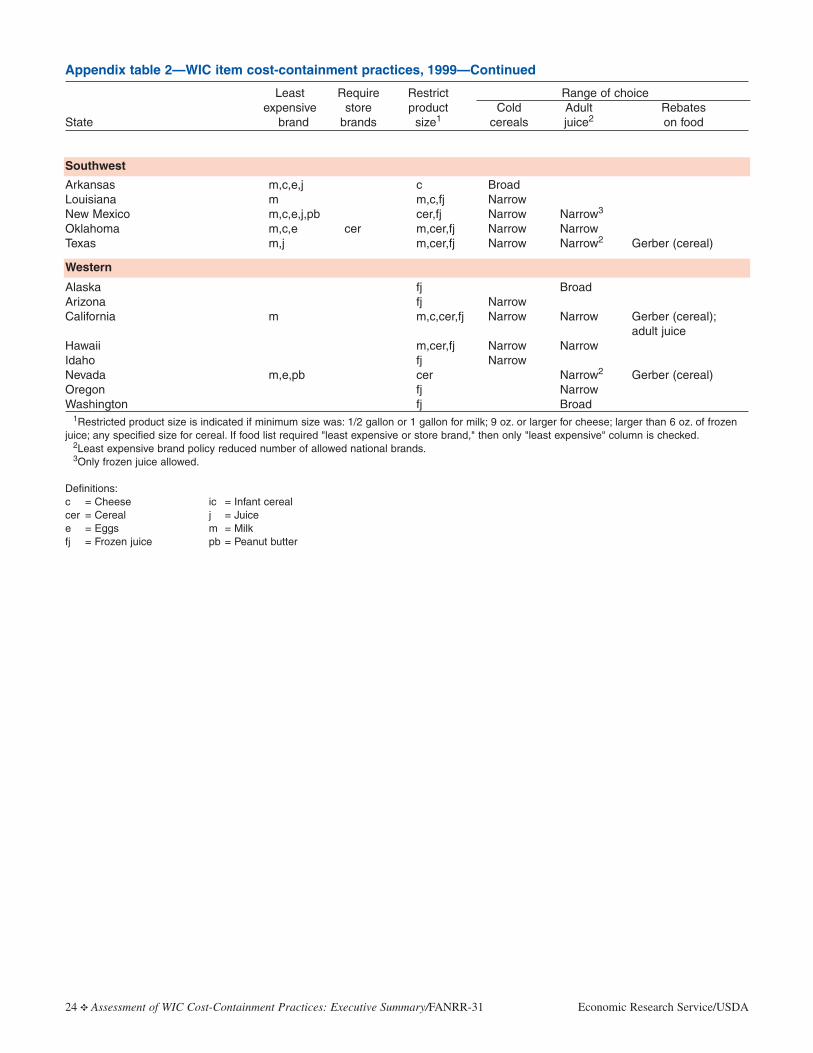
24 ✥ Assessment of WIC Cost-Containment Practices: Executive Summary/FANRR-31 Economic Research Service/USDA
Appendix table 2—WIC item cost-containment practices, 1999—Continued
Least Require Restrict Range of choiceexpensive store product Cold Adult Rebates
State brand brands size1 cereals juice2 on food
Arkansas m,c,e,j c BroadLouisiana m m,c,fj NarrowNew Mexico m,c,e,j,pb cer,fj Narrow Narrow3
Oklahoma m,c,e cer m,cer,fj Narrow NarrowTexas m,j m,cer,fj Narrow Narrow2 Gerber (cereal)
Alaska fj BroadArizona fj NarrowCalifornia m m,c,cer,fj Narrow Narrow Gerber (cereal);
adult juiceHawaii m,cer,fj Narrow NarrowIdaho fj NarrowNevada m,e,pb cer Narrow2 Gerber (cereal)Oregon fj NarrowWashington fj Broad
1Restricted product size is indicated if minimum size was: 1/2 gallon or 1 gallon for milk; 9 oz. or larger for cheese; larger than 6 oz. of frozenjuice; any specified size for cereal. If food list required "least expensive or store brand," then only "least expensive" column is checked.
2Least expensive brand policy reduced number of allowed national brands.3Only frozen juice allowed.
Definitions:c = Cheese ic = Infant cerealcer = Cereal j = Juicee = Eggs m = Milkfj = Frozen juice pb = Peanut butter
Southwest
Western
Appendix B: Data SourcesThe analysis of the impacts of WIC cost-containmentpractices relies on a variety of data sources, includingboth extant data and data collected from the case studyStates specifically for this study. These include:
• State WIC administrative data
• Interviews with State and local WIC officials
• A survey of WIC participants
• A store survey of the price and availability of WICfood items
• WIC transaction data collected from supermarkets
• Focus groups with participants who dropped out ofthe WIC program
• Interviews with other concerned stakeholders
Each data source is summarized below.
State WIC Administrative Data
Two types of State administrative data were collected:participant certification records and food instrumentdata.
Statewide administrative records for WIC participantswere obtained from the six case study States at twopoints in time: November 2000 and April 2001. Thesefiles contain demographic characteristics of WIC par-ticipants and certification information such as nutri-tional risks, health status, food package prescription,and income level.
Statewide food instrument data were collected fromeach State for a 4-month period, from November 2000through February 2001. The data typically include onerecord for each WIC food instrument issued, with dataelements indicating its status (issued, paid, rejected, orvoid), date paid, and payment amount.
Administrative data on participants from November2000 provided the sampling frame for the study. Threegeographic areas were selected for primary data col-lection within each State, representing urban, subur-ban, and rural areas. Selection of geographic areas wasbased on caseload counts, with selection proportionateto caseload size. Primary data collections in the threegeographic areas were the Survey of WIC Participants,the store survey, and the interviews with State andlocal WIC agencies.
Administrative data were also used for several lines ofanalyses. Statewide participant records were used to
characterize participants for the analyses of foodinstrument redemption and to explore the associationbetween redemption and change in health status (asmeasured from the November and April certificationfiles). Food instrument data were used to measure foodinstrument redemption rates for each State and toexamine the relationship between food instrumentredemption and health outcomes.
Interviews with State and Local WIC Officials
Interviews were conducted with representatives of allsix State WIC agencies selected for the study. Theseinterviews, held between May and August 2001, pro-vided information on the procedures for applying cost-containment measures, the results of the measures,staff time and other costs devoted to maintenance ofthe measures, and views of State staff on the impactsof cost-containment measures on program costs andparticipant outcomes.
In addition, three local agencies representing urban,suburban, and rural areas were selected in each Statefor telephone interviews. These agencies providedinformation on local agency involvement in, and expe-rience with, cost-containment measures—principallythe provision of training and assistance to participantsabout food-item restrictions. The local agency interviewswere conducted between July and September 2001.
Survey of WIC Participants
The Survey of WIC Participants interviewed a total of1,285 WIC families in the six States, between Februaryand June 2001. Most interviews were conducted bytelephone; for the 12.3 percent of sampled participantswho could not be reached by telephone, interviewswere conducted by field staff at participants’ homes.The overall survey response rate was 77 percent.
The survey collected information about satisfaction withWIC food items; food instrument pickup; food-itempurchase, consumption, and preferences; participantaccess to WIC vendors; program participation; presenceof special diets or food allergies; and health referrals.
Survey of Price and Availability of WIC Food Items
The Survey of Food Prices and Item Availability col-lected price information and data on food-item avail-ability from a sample of 106 WIC food stores in thesix case study States (17 to 18 WIC-authorized ven-dors in each State).
Economic Research Service/USDA Assessment of WIC Cost-Containment Practices: Executive Summary/FANRR-31 ✥ 25
Data collectors visited each sampled store and checkedon the price and availability of over 400 food itemsapproved for WIC under Federal guidelines. Thesedata were used to estimate cost savings from food-itemrestrictions.
WIC Transaction Data from Supermarkets
In retail food stores that scan food-item bar codes atcheckout, the store’s point-of-sale (POS) system auto-matically creates a record of each scanned item. Theserecords can be used to identify food items purchasedin WIC transactions if the POS system saves detailedinformation about the type of tender used in the trans-action. The study contacted all the large supermarketchains in the six case study States to inquire whethertheir POS systems could identify food items paid forwith WIC checks or vouchers. A number of POS sys-tems could not. Supermarket chains whose POS sys-tems could identify WIC transactions were invited toparticipate in the study by providing copies of theirWIC transaction data for a 5- to 6-week period in early2001. Six supermarket chains agreed to provide datafrom nearly 600 stores. Together, these scanner dataprovide information for over one-half million WICtransactions in five of the six States; no supermarketsin Oklahoma were able to participate in the study.
Focus Group Discussions with WIC Program Dropouts
Focus groups were conducted with WIC participantswho did not pick up their WIC food instruments andwho indicated, during a screener survey, that this wasrelated to dissatisfaction with either WIC food items oraccess to WIC vendors. Six focus groups were con-ducted in five States, collecting indepth, qualitativeinformation on the reasons WIC participants fail tomake full use of their WIC food benefits.21
A focus group moderator used the same topic guide inall States. Topics were broadly focused on WIC partic-ipants’ satisfaction with the selection of WIC-approvedfoods, access to WIC vendors, and ease of using WICfood instruments. The goal of the focus groups was todetermine the extent to which cost-containment prac-tices affected these participants’ decisions to stop pick-ing up their WIC checks and vouchers.
Although focus groups do not provide data that can becompared across States in a quantitative way, they
provide indepth qualitative insights about WIC partici-pants’ satisfaction. The stories told by the focus groupmembers allowed the study to determine whether par-ticular aspects of cost-containment practices are sin-gled out by WIC participants when they describe theirexperiences with the program.
Interviews with Concerned Stakeholders
In addition to collecting information from WIC agen-cies, the study contacted representatives from foodindustry associations and from the National WICAssociation (NWA), formerly the National Associationof WIC Directors (NAWD). These organizations haveexpressed concerns in the past about WIC cost-con-tainment practices. Many of these concerns wereinvestigated as part of the study. In summary:
• The NWA is a voluntary membership organizationrepresenting State and local WIC agencies nation-wide. NWA members expressed two main concernsabout cost-containment practices: (1) the negativeimpact of food-item restrictions on program partici-pation; and (2) obstacles to States’ utilization of foodcost savings to increase Federal NSA funds in supportof higher WIC participation levels.22 They stressedthat States needed flexibility in designing foodpackages to attract and retain program participants.
• The Grocery Manufacturers of America (GMA) is atrade organization representing companies that man-ufacture and market most of the best known nation-al brand products. Their biggest concern with cost-containment efforts is those practices that reduceWIC participants’ choices among brands of WIC-approved products, especially breakfast cereals.They believe that such restrictions reduce partici-pant satisfaction and can lead to decreased partici-pation in WIC.
• Members of the Private Label ManufacturersAssociation (PLMA) are pleased that private-label,or store-brand, items are being added to WIC-approved food lists in many States. They perceive,
26 ✥ Assessment of WIC Cost-Containment Practices: Executive Summary/FANRR-31 Economic Research Service/USDA
21A planned focus group in Hartford, Connecticut was cancelled becausenot enough participants who met the screening criteria could be recruited.
22NWA’s concern with States’ use of food cost savings has beenaddressed by FNS since the interview was conducted. In December 1999,FNS published a rule expanding conversion authority for cost-containmentsavings to NSA funds. According to the rule, a State WIC agency “maynow convert food funds to NSA funds based on projected increases in par-ticipation instead of just actual participation increases.” The NSA expendi-ture standard was reduced to 10 percent to improve accountability for thenew conversion authority and to prevent this expanded conversion authori-ty from being used to substantially shift food money to NSA spendingwithout increased cost-containment savings and participation.
however, that some State WIC agencies are biasedagainst private-label foods. Members also are con-cerned with policies that require WIC-approved fooditems to be available statewide, because not all foodchains operate throughout a State. Finally, PLMAmembers believe that limiting vendors may (uninten-tionally) eliminate many private-label products fromthe WIC program and lead to increased costs andreduced product availability for WIC participants.
• The Food Marketing Institute (FMI) and theNational Grocers Association (NGA) are trade asso-ciations representing food retailers and wholesalers.
These groups do not like cost-containment practicesdesigned to limit the number of WIC-authorizedvendors, arguing that such practices are inefficientand expensive to implement. The groups believethat the practices tend to reduce participation ofsmaller neighborhood stores, which in turn affectsWIC participants’ accessibility to WIC-authorizedstores. They also do not like price ceilings, whichthey claim are unfair to small retailers whose coststructures are higher, or least expensive brand poli-cies, which they believe confuse store clerks andWIC customers.
Economic Research Service/USDA Assessment of WIC Cost-Containment Practices: Executive Summary/FANRR-31 ✥ 27