assessment of soil degradation under agricultural land use
TRANSCRIPT

243
Assessment of Soil Degradation under Agricultural Land Use
Sites: Emerging Evidence from the Savanna Region of North
Eastern Nigeria
Mohammed Bakoji Yusuf1 *,
Umar Jauro Abba 1
Mohammed Salim Isa1
Abstract
Soil degradation remains a global environmental phenomenon that is interpreted differently in
different environments, despite its global dimension in terms of loss of soil fertility from crop fields
in most of the major agricultural regions of the word. This study reports the results of a
quantitative index (indices) developed to assess soil degradation associated with agricultural land
uses for two contrasting topographies. The study also, identifies the basic underlying pattern of
the interrelationship between the soil properties in a part of the Northern Guinea Savanna belt of
Nigeria. Using thirteen soil properties, three indices are developed namely: organic nutrients,
cation exchange capacity, and soil texture. The indices range from 34.3 % for Ca and 33.7 % for
CEC for fallow land to 68.8 % for Na and 57.8 % for OC for continuously cultivated farms on
hillslope and flatland sites, respectively. The organic nutrients index was the most degraded index
in both sites. The results of the analysis of factor scores for the three land Use types on both sites
show two to three basic underlying relationships among the soil properties analyzed, with
continuously cultivated farms being the worst degraded then fallow plots with forest fields being
the least degraded. The study recommends that the agricultural quality of the soil be evaluated by
monitoring only these few soil properties in the study region.
Keywords: Soil degradation, Agricultural Landuse sites, Quantitative index, Nigeria
1Department of Geography, Faculty of Social & Management Sciences, Taraba State University,
Jalingo, Nigeria. *Corresponding author’s Email: [email protected].
Ghana Journal of Geography Vol. 11(2), 2019 pages 243-263

Ghana Journal of Geography Vol. 11(2), 2019 pages 243-263
244
Introduction
Despite, the wealth of literature that exists on the prevalence (Kiryushin, 2007, Lal, 2009,
Romanov, 2009, Gorokhova & Kupriyanova, 2012, Molchanov, 2015), causes (Zaidel’man, 2009,
Babacv et al., 2015), and impacts of soil degradation (Pimentel, 2006, Kuznetsova et al. 2009),
and the global dimension of the loss of soil fertility from crop fields in most of the major
agricultural regions of the world (Mueller et al. 2010), soil degradation remains a global
environmental phenomenon that is interpreted differently in different environments. For the most
part, soil degradation is seen as the loss of land productivity, quantitatively and qualitatively,
through many processes, such as soil erosion, overgrazing, cultivation, and cropping, leaching,
water logging and pollution. Kiryushin (2007), Romanvov, (2009), Molchanov et al. (2015),
defined “soil degradation as the gradual or complete reduction of soil fertility (quality) through the
physical removal of soil by erosion without actual loss of soil or a combination of both with a
resultant decline in crop productivity.” Importantly, soil degradation is a gradual process that may
take several years or decades to be recognized, and when noticed, it may be difficult or take a very
long time to fully reclaim the land.
Soil degradation processes, or mechanisms, that set in motion the degradation include physical,
chemical and biological processes (Pimentel, 2006, Lal, 2009, Gorobtsova et al. 2016). Prominent
among the physical processes are deforestation, desertification, and deterioration of soil structure,
leading to crusting, compaction, and erosion (Muchena et al. 2005,Yusuf et al. 2015). Significant
chemical processes include acidification, leaching, soil salinity, and a decrease in cation retention
capacity and fertility exhaustion (Gurbanov, 2010, Ahukaemere et al. 2012). The biological
processes include a reduction in the total biomass carbon and a decline in soil biodiversity (Tilman,
et al., 2002, Vasil’evskaya et al. 2006, Lal, 2013).
In the study region, as elsewhere in tropical regions, physical, as well as biochemical degradation,
is experienced as a result of cultivation and harvesting, burning, overgrazing and soil erosion
(Cobo, et al. 2010, Yusuf et al. 2015). Martensson (2009) identifies the most common types of
physical and biochemical soil degradation in Nigeria as soil desiccation, soil compaction, and
salinization. It is apparent from the above that, the concept of soil degradation is a complex one

Assessment of Soil Degradation under Agricultural Land Use Sites
245
for which there is no one single universal method or index of assessment. This is probably because,
as Pimentel (2006), noted, it comes in different forms depending on land use and sites.
Numerous studies have been conducted on the effects of the processes of soil degradation, such as
cultivation and erosion of soil fertility (Ogidiolu, 2000, Cobo et al. 2010, Malgwi & Abu, 2011,
Eni, 2012, Senjobi et al. 2013, Sotona, et al. 2013), using different soil properties perceived by the
authors as being relevant to examining a similar problem. This seems to indicate the absence of
acceptable indices for the tropical environment and, in particular, two contrasting topographies.
The importance of an index for assessing changes in soil associated with agricultural land use
cannot be over-emphasized. It will, among other things, ensure comparability among land uses (Qi
et al. 2009, Gorobtsova et al.2016), and rapid evaluation and assessment of the resource quality of
the soil between and within contrasting topographies (Gorokhova et al. 2012). This paper,
therefore, seeks to develop a quantitative index (indices) for assessing soil degradation associated
with agricultural land use between two contrasting topographies in similar geographical settings
and to identify the basic underlying pattern of the interrelationship between the soil properties.
This is imperative because such indices, as pointed out earlier, are useful for rapid mapping of soil
the resource quality of vast areas for management purposes.
Material and Methods
Study Location
Nigeria has a total surface land area of 923.769 square kilometers, out of which 86% (794,441
km2) belongs to the Savanna region (Martensson, 2009). The Savanna region is sub-divided into
four major ecological zones, namely: Derived Savanna, Guinea Savanna, Sudan, and Sahel
Savanna. Martensson (2009) further subdivided the Guinea Savanna into the Southern Guinea
Savanna and the Northern Guinea Savanna. The later covers about 600,252 km2, representing
about 60% of the country’s total land area.
Ghana Journal of Geography Vol. 11(2), 2019 pages 243-263
246
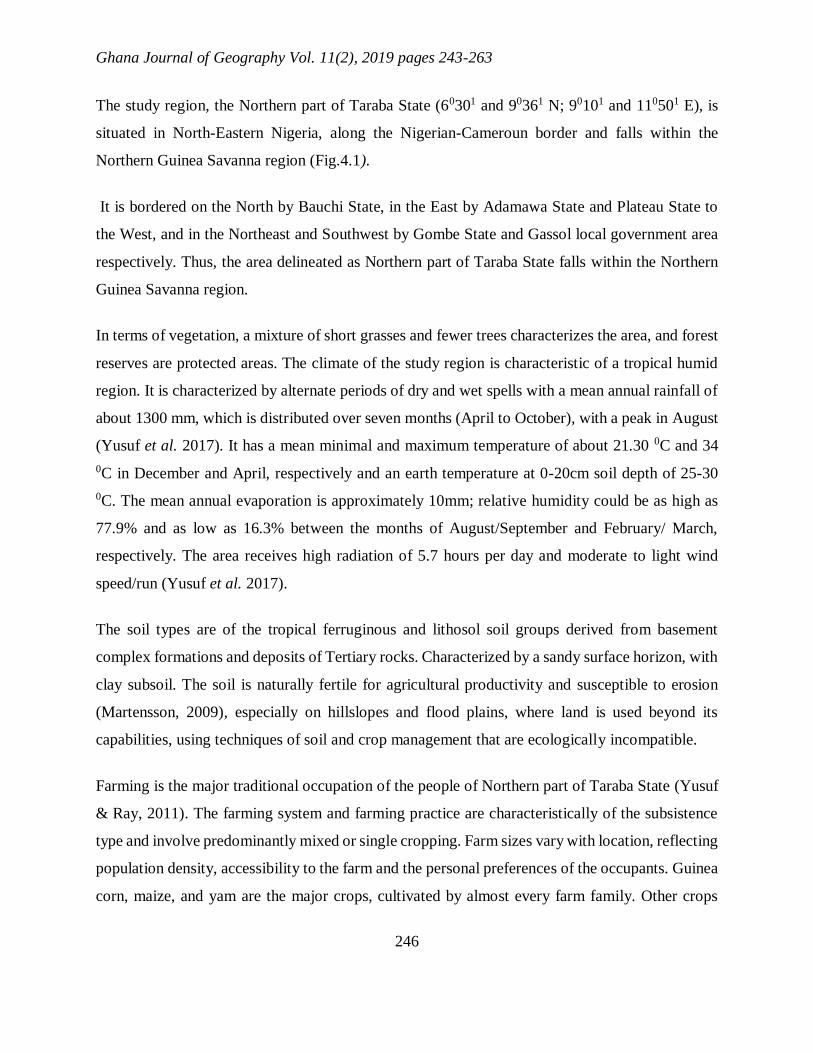
The study region, the Northern part of Taraba State (60301 and 90361 N; 90101 and 110501 E), is
situated in North-Eastern Nigeria, along the Nigerian-Cameroun border and falls within the
Northern Guinea Savanna region (Fig.4.1).
It is bordered on the North by Bauchi State, in the East by Adamawa State and Plateau State to
the West, and in the Northeast and Southwest by Gombe State and Gassol local government area
respectively. Thus, the area delineated as Northern part of Taraba State falls within the Northern
Guinea Savanna region.
In terms of vegetation, a mixture of short grasses and fewer trees characterizes the area, and forest
reserves are protected areas. The climate of the study region is characteristic of a tropical humid
region. It is characterized by alternate periods of dry and wet spells with a mean annual rainfall of
about 1300 mm, which is distributed over seven months (April to October), with a peak in August
(Yusuf et al. 2017). It has a mean minimal and maximum temperature of about 21.30 0C and 34
0C in December and April, respectively and an earth temperature at 0-20cm soil depth of 25-30
0C. The mean annual evaporation is approximately 10mm; relative humidity could be as high as
77.9% and as low as 16.3% between the months of August/September and February/ March,
respectively. The area receives high radiation of 5.7 hours per day and moderate to light wind
speed/run (Yusuf et al. 2017).
The soil types are of the tropical ferruginous and lithosol soil groups derived from basement
complex formations and deposits of Tertiary rocks. Characterized by a sandy surface horizon, with
clay subsoil. The soil is naturally fertile for agricultural productivity and susceptible to erosion
(Martensson, 2009), especially on hillslopes and flood plains, where land is used beyond its
capabilities, using techniques of soil and crop management that are ecologically incompatible.
Farming is the major traditional occupation of the people of Northern part of Taraba State (Yusuf
& Ray, 2011). The farming system and farming practice are characteristically of the subsistence
type and involve predominantly mixed or single cropping. Farm sizes vary with location, reflecting
population density, accessibility to the farm and the personal preferences of the occupants. Guinea
corn, maize, and yam are the major crops, cultivated by almost every farm family. Other crops

Assessment of Soil Degradation under Agricultural Land Use Sites
247
cultivated include millet, rice, cassava, potatoes, groundnuts, beans, and vegetables. To lessen the
risk of soil erosion, and safeguard soil and crop productivity, the farmers, typically grow a variety
of crops. Farming operations are generally labour–intensive and largely a reflection of traditional
methods, using drudgery- enhancing primitive tools such as hoes, cutlasses, machetes, and axes,
which have been passed from generation to generation (Yusuf & Ray, 2011). The study region
has large number of livestock especially, cattle, goats, sheep, pigs, and poultry. The growing of
crops and rearing of livestock threaten the natural resilience of the vegetation of the region and,
hence, soil degradation.
Figure 1: Map of the study region
Method
In order to attain the objective of this study, a reconnaissance survey of the study region was
undertaken to gain an understanding of the components of the production system, and the
Ghana Journal of Geography Vol. 11(2), 2019 pages 243-263
248
biophysical and environmental situation. During this stage, two contrasting land use sites, with six
survey plots were identified. The surveyed plots were farmlands which had been under continuous
cultivation for more than ten years, located in both the flatland and hillside areas, with a slope
angle range of 0-4% and 5-22%, respectively. Land which, had been fallow 7-10 years in both
sites, and a protected area (forest) which had been intact as long as the local people can remember.
The forest soil from the flatland site was used as the control against which changes in soil
properties arising from the establishment of other land uses were assessed. To ensure uniformity
in the soil samples collected from the surveyed sites, the sites were selected from a similar
geographical setting with respect to climate, soil and land use types. Vitellariaparadoxa,
Tamarindysindica, Parkia species, Aegyptiaca, and Balantie species were the dominant tree
species in the forest areas. Shrubs, with little useful wood mixed with some grasses, are dominant
plant species in fallow fields (Myparrhemiaviolescensspp, Penisetumpedicellatum, Schizachyrium
exile, Typha, wind sorghum, Calotropisproceras, and Ipomeas spp). Guinea corn, millet, yam,
cassava were the major crops grown in both sites.
Administratively, the study region falls into six local government areas of Taraba State: Ardo-
Kola, Jalingo, Lau, Karim-Lamido, Yorro, and Zing. There are a total of sixty-two (62) districts in
the six local government areas. Within each district, there was a range of between 21 to 47 major
villages with each village having approximately a range of between 305 to 874-farm families
(TADP, 2013) village listening form. One village was purposively selected for soil sample
collections based on: - (i). The seriousness of the soil erosion problem, (ii). Accessibility, (iii).
The need to have two comparable slope and flatland farms representative of the study area, and,
(iv). The selection considered land use types, rather than soil types.
Subsequently, from the six surveyed plots, eight surveyed positions (5 from the hillslope and three
on the flat land area) were randomly selected for soil sample collection. The five surveyed position
on the hillslope sites is one each from the upslope, mid-slope and downslope of continuously
cultivated farms, a fallow, and forest fields, and on the flat land are one each from farmlands under
continuous cultivation, fallow, and forest plots.
Assessment of Soil Degradation under Agricultural Land Use Sites
249
In order to cover, representatively, all the surveyed plots, Grids were imposed over the surveyed
position. Each surveyed position was 50m x 50m and the area was later divided into one-meter
square grids. Ten of these one-meter square grids were selected using a table of random numbers,
and a soil sample was collected from each of the selected grids from a depth of 0-20cm. At each
surveyed position, samples were obtained at three successive intervals, before, during, and after
the peak of rainfall, and composite samples were made by carefully mixing twenty-five soil
samples. Soil sampling was restricted to the uppermost soil profile because most of the significant
changes in soil physiochemical properties, especially in a tropical environment, are limited to the
topmost ploughable layer, 0-20 cm of the soil profile (Ogidiolu, 2000, Adejuwon, 2008, Cyril &
Difference, 2012). A total of six hundred soil samples (24 composite samples) were obtained with
the aid of a soil auger and each composite sample was placed in a new well-labeled polythene bag.
The soil samples were then air-dried at a room temperature of 280C, lightly ground and sieved
using a 2mm mesh sieve, and analyzed using standard laboratory procedures, with utmost care to
avoid differential loss of fine dust.
The particle size distribution was obtained using the Bouyocous hydrometer method. In sequence,
the textural class of the soils was determined by subjecting the obtained particle size distribution
to Marshall’s textural triangle. The bulk density was determined by the clod method. The soil pH
was measured in 1:2.5 soils: water suspension ratio with the use of a glass electrode pH meter. The
electrical conductivity (EC) of the saturation extracted was determined by the sequence alongside
the pH in the same suspension using the EC meter. Organic carbon (OC) was determined using
Walkley & Black’s (1934) potassium dichromate wet oxidation method, in which the soil organic
matter content is obtained by multiplying the organic carbon content by a conversion factor of
1,724. Similarly, total nitrogen (TN), available phosphorus (P) , available potassium (K) and
sodium (Na) were determined by the Kjeldahl method (Bremner & Mulvaney, 1982), Bray
extraction method, (Bray & Kurtz, 1945) and flame photometry (Jacson,1965), respectively.
Exchangeable (Ca), was determined by the titrimetric method, while, (CEC), was computed from
the analyzed results of the soil bases, for soil property for forest lands on the one hand and for
other land use types on the other, to show the extent of soil degradation resulting from the opening
up of natural vegetation to cropping.

Ghana Journal of Geography Vol. 11(2), 2019 pages 243-263
250
The computed differences were then expressed as a percentage of the mean value of the forest soil
property. The index of the soil degradation was computed based on the assumption that the soil
fertility status of any land use types on both sites was once the same as that for the flatland forest
before the commencement of cultivation. Statistical analysis of variance (ANOVA) and principal
component analysis (PCA) were used to determine whether there were any significant differences
in each of the elements analyzed in the soils according to different land use type.
Results and Discussion
Soil physiochemical properties
The mean values of various soil properties revealed that there were differences between and within
the land use sites. The mean values of sand and silt contents were significantly higher in farms
under continuous cultivation and fallow plots on the hillslopes compared to those on a comparable
flatland (Table 1). These results concurred with the explanation provided by Cobo et al., (2010),
Amuyou et al. (2013), Senjobi et al. (2013), and Sotona et al. (2013), that soil textural properties
(sand, silt and clay contents) were higher in soils under cropping located at high altitudes compared
to soils under pure crops on lower slopes. In contrast, insignificant differences in textural
properties were reported by Ogidiolu, (2000), Adejuwon, (2008), with respect to contrasting land
use type.
However, the chemical properties showed an opposite trend to the physical properties. The areas
surveyed on flat land had a significantly higher mean content in relation to most chemical
properties, in particular, OC, TN, P, and CEC, suggesting, that erosion in the form of water erosion
is higher in farms under continuous cultivation and in fallow plots on hillslopes than those on
flatland. The variation in these soil properties can be associated with the differences in topography,
intensive leaching, and erosion. However, Ahukaemere et al. (2012) noted that lower OC content
accelerates soil erosion, which in turn threatens valuable soil nutrients and creates serious soil
management problems.
Assessment of Soil Degradation under Agricultural Land Use Sites
251
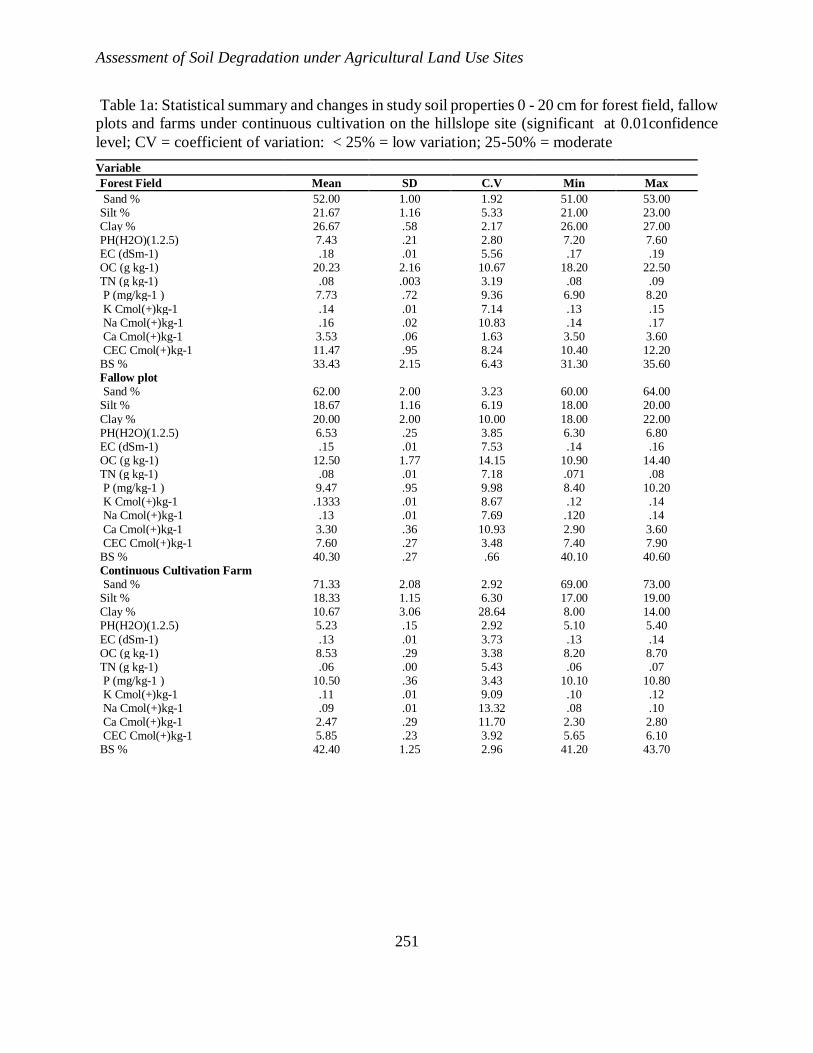
Table 1a: Statistical summary and changes in study soil properties 0 - 20 cm for forest field, fallow
plots and farms under continuous cultivation on the hillslope site (significant at 0.01confidence
level; CV = coefficient of variation: < 25% = low variation; 25-50% = moderate
Variable
Forest Field Mean SD C.V Min Max
Sand % 52.00 1.00 1.92 51.00 53.00 Silt % 21.67 1.16 5.33 21.00 23.00 Clay % 26.67 .58 2.17 26.00 27.00 PH(H2O)(1.2.5) 7.43 .21 2.80 7.20 7.60 EC (dSm-1) .18 .01 5.56 .17 .19 OC (g kg-1) 20.23 2.16 10.67 18.20 22.50 TN (g kg-1) .08 .003 3.19 .08 .09 P (mg/kg-1 ) 7.73 .72 9.36 6.90 8.20
K Cmol(+)kg-1 .14 .01 7.14 .13 .15 Na Cmol(+)kg-1 .16 .02 10.83 .14 .17 Ca Cmol(+)kg-1 3.53 .06 1.63 3.50 3.60 CEC Cmol(+)kg-1 11.47 .95 8.24 10.40 12.20 BS % 33.43 2.15 6.43 31.30 35.60 Fallow plot Sand % 62.00 2.00 3.23 60.00 64.00 Silt % 18.67 1.16 6.19 18.00 20.00
Clay % 20.00 2.00 10.00 18.00 22.00 PH(H2O)(1.2.5) 6.53 .25 3.85 6.30 6.80 EC (dSm-1) .15 .01 7.53 .14 .16 OC (g kg-1) 12.50 1.77 14.15 10.90 14.40 TN (g kg-1) .08 .01 7.18 .071 .08 P (mg/kg-1 ) 9.47 .95 9.98 8.40 10.20 K Cmol(+)kg-1 .1333 .01 8.67 .12 .14 Na Cmol(+)kg-1 .13 .01 7.69 .120 .14
Ca Cmol(+)kg-1 3.30 .36 10.93 2.90 3.60 CEC Cmol(+)kg-1 7.60 .27 3.48 7.40 7.90 BS % 40.30 .27 .66 40.10 40.60 Continuous Cultivation Farm Sand % 71.33 2.08 2.92 69.00 73.00 Silt % 18.33 1.15 6.30 17.00 19.00 Clay % 10.67 3.06 28.64 8.00 14.00 PH(H2O)(1.2.5) 5.23 .15 2.92 5.10 5.40
EC (dSm-1) .13 .01 3.73 .13 .14 OC (g kg-1) 8.53 .29 3.38 8.20 8.70 TN (g kg-1) .06 .00 5.43 .06 .07 P (mg/kg-1 ) 10.50 .36 3.43 10.10 10.80 K Cmol(+)kg-1 .11 .01 9.09 .10 .12 Na Cmol(+)kg-1 .09 .01 13.32 .08 .10 Ca Cmol(+)kg-1 2.47 .29 11.70 2.30 2.80 CEC Cmol(+)kg-1 5.85 .23 3.92 5.65 6.10 BS % 42.40 1.25 2.96 41.20 43.70

Ghana Journal of Geography Vol. 11(2), 2019 pages 243-263
252
Table 1b: Statistical summary and changes in study soil properties 0 - 20 cm for forest field, fallow
plots and farms under continuous cultivation on the flatland site (significant at 0.01confidence
level; CV = coefficient of variation: < 25% = low variation; 25-50% = moderate variation; > 50%
= high variation)
Variable Mean SD C.V Min Max
Forest field
Sand % 57.33 1.16 2.01 56.00 58.00
Silt % 22.67 5.09 5.09 22.00 24.00 Clay % 20.67 1.16 5.59 20.00 22.00
PH(H2O)(1.2.5) 5.60 .36 6.44 5.30 6.00
EC (dSm-1) .13 .02 11.46 .12 .15
OC (g kg-1) 9.37 .25 2.69 9.10 9.60
TN (g kg-1) .07 .004 6.06 .06 .07
P (mg/kg-1 ) 9.73 .91 9.32 8.70 10.40
K Cmol(+)kg-1 .12 .01 4.94 .11 .12
Na Cmol(+)kg-1 .07 .01 7.87 .07 .08
CaCmol(+)kg-1 2.44 .26 10.55 2.20 2.71
CEC Cmol(+)kg-1 6.30 .95 15.15 5.70 7.40
BS % 32.00 2.77 8.66 30.40 35.20
Fallow plot
Sand % 63.33 2.31 3.65 62.00 66.00
Silt % 21.00 1.73 8.25 20.00 23.00
Clay % 15.67 2.08 13.29 14.00 18.00
PH(H2O)(1.2.5) 5.43 .15 2.81 5.30 5.60
EC (dSm-1) .11 .01 9.09 .10 .12
OC (g kg-1) 9.00 .17 1.92 8.90 9.20
TN (g kg-1) .06 .004 5.89 .06 .06
P (mg/kg-1 ) 9.93 .46 4.65 9.40 10.20
K Cmol(+)kg-1 .11 .01 5.09 .11 .12
Na Cmol(+)kg-1 .06 .001 1.90 .06 .06 CaCmol(+)kg-1 2.32 .28 12.27 2.00 2.55 CEC Cmol(+)kg-1 5.10 .17 3.40 5.00 5.30
BS % 33.00 2.31 6.99 30.60 35.20
Continuous Cultivation farm
Sand % 71.56 3.71 5.19 66.00 77.00
Silt % 18.67 4.00 21.43 13.00 24.00
Clay % 10.17 1.12 11.00 8.00 12.00
PH(H2O)(1.2.5) 4.62 .42 9.10 4.20 5.30 EC (dSm-1) .07 .02 21.43 .05 .09 OC (g kg-1) 8.23 .23 2.78 7.90 8.50
TN (g kg-1) .04 .02 37.50 .01 .06
P (mg/kg-1 ) 10.96 .50 4.52 10.10 11.60
K Cmol(+)kg-1 .09 .04 48.56 .02 .13
Na Cmol(+)kg-1 .05 .01 15.30 .04 .06
CaCmol(+)kg-1 1.79 .53 29.77 1.00 2.40
CEC Cmol(+)kg-1 4.36 .240 5.52 4.10 4.80
BS % 36.63 2.61 7.13 32.10 40.10

Assessment of Soil Degradation under Agricultural Land Use Sites
253
Soil degradation indices
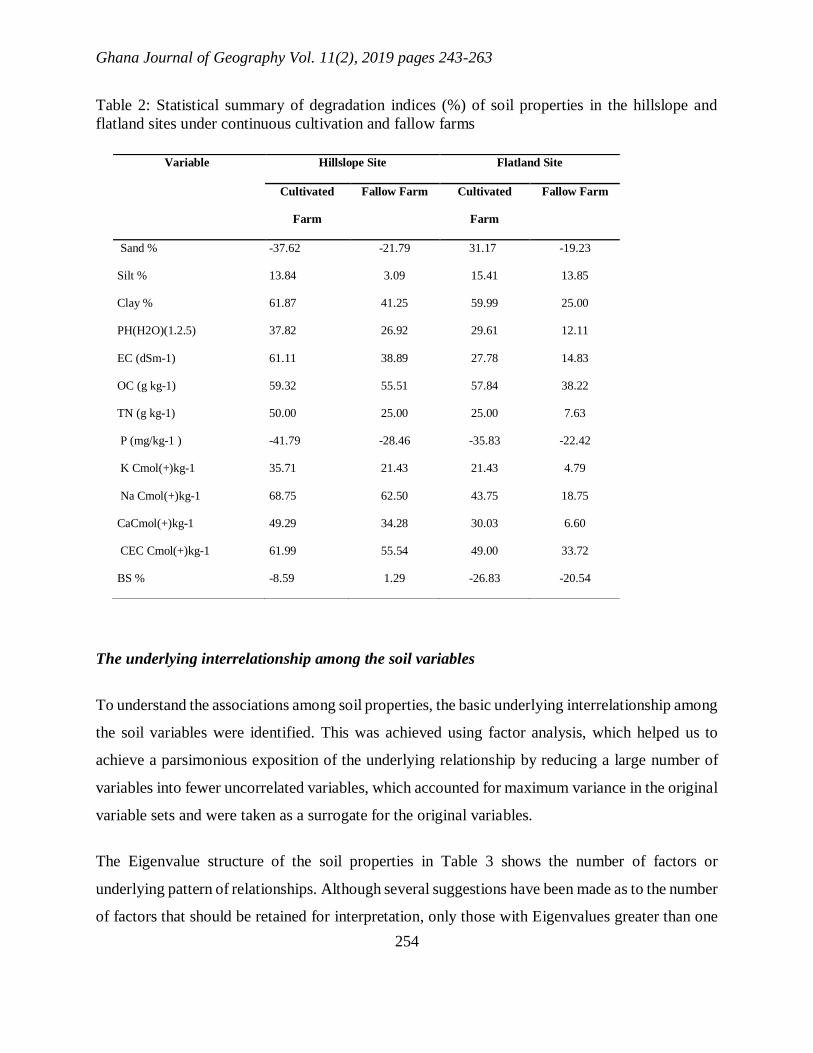
The levels in percentage of soil degradation between and within the two land use sites, as presented
in Table 2, show that: Na, CEC, clay, EC OC, and TN were the most degraded soil properties in
farms under continuous cultivation and OC, Na, and CEC in fallow farms on the hillslope site. In
the farms under continuous cultivation on the flatland site, clay, OC, CEC, and Na were the most
degraded soil properties, and none was recorded for fallow plots.
The degree of degradation was highest in farms under continuous cultivation compared to fallow
plots on both sites. However, continuously cultivated and fallow farms on the hillslope had a higher
proportion of degradation than those on the flatland. The degradation indices ranged from 34.3 %
for Ca and 33.7 % for CEC for fallow land to 68.8 % for Na and 57.8 % for OC for continuously
cultivated farms on the hillslope and flatland sites respectively. Similarly, a noticeable increase in
the degradation index of OC and CEC 57.84% and 49.00% for farms under continuous cultivation
on the flatland to 59.32% and 61.99% for those on the hillslope site was recorded. However, the
degradation indices were low for soil textural properties between and within the different land use
types.
The computed results for the level of degradation associated with each soil property for either site
revealed that; the degree of degradation was highest for variables on the hillslope than those on
the flatland site, as shown in Table 2. However, both sites were constrained by a similar response
mechanism; where OC, and TN, which can be collectively referred to as the organic nutrient index,
and Na, CEC, and Ca, which can together be referred to as cation exchange capacity index, are the
soil properties with the most degradation between and within the two contrasting sites. In addition,
soil properties with minimum deterioration rates can be used as indices (Ogidiolu, 2000). In this
regard, the study shows that soil texture is a useful index.
Ghana Journal of Geography Vol. 11(2), 2019 pages 243-263
254
Table 2: Statistical summary of degradation indices (%) of soil properties in the hillslope and
flatland sites under continuous cultivation and fallow farms
The underlying interrelationship among the soil variables
To understand the associations among soil properties, the basic underlying interrelationship among
the soil variables were identified. This was achieved using factor analysis, which helped us to
achieve a parsimonious exposition of the underlying relationship by reducing a large number of
variables into fewer uncorrelated variables, which accounted for maximum variance in the original
variable sets and were taken as a surrogate for the original variables.
The Eigenvalue structure of the soil properties in Table 3 shows the number of factors or
underlying pattern of relationships. Although several suggestions have been made as to the number
of factors that should be retained for interpretation, only those with Eigenvalues greater than one
Variable Hillslope Site Flatland Site
Cultivated
Farm
Fallow Farm Cultivated
Farm
Fallow Farm
Sand % -37.62 -21.79 31.17 -19.23
Silt % 13.84 3.09 15.41 13.85
Clay % 61.87 41.25 59.99 25.00
PH(H2O)(1.2.5) 37.82 26.92 29.61 12.11
EC (dSm-1) 61.11 38.89 27.78 14.83
OC (g kg-1) 59.32 55.51 57.84 38.22
TN (g kg-1) 50.00 25.00 25.00 7.63
P (mg/kg-1 ) -41.79 -28.46 -35.83 -22.42
K Cmol(+)kg-1 35.71 21.43 21.43 4.79
Na Cmol(+)kg-1 68.75 62.50 43.75 18.75
CaCmol(+)kg-1 49.29 34.28 30.03 6.60
CEC Cmol(+)kg-1 61.99 55.54 49.00 33.72
BS % -8.59 1.29 -26.83 -20.54

Assessment of Soil Degradation under Agricultural Land Use Sites
255
have been chosen for analysis in this study. On account of this, only three factors are significant,
and these account for 82% of the total variation in the phenomenon being examined on the hillslope
site and only one factor on the flatland land site, accounting for 86.4%.
Table 3: Eigenvalue Structure of the Soil Properties under the Hillslope and flatland sites
Factor Hillslope Site Flatland Site
Eigen
Valu
e
PCT of
Var
CUM
PCT
Eigen
Value
PCT of
Var
CUM
PCT
1 7.896 60.737 60.737 11.232 86.398 86.398
2 1.724 13.264 74.002 .818 6.291 92.689
3 1.045 8.042 82.044 .446 3.427 96.116
4 .968 7.442 89.486 .241 1.851 97.967
5 .453 3.481 92.967 .129 .992 98.959
6 .388 2.988 95.956 .078 .597 99.556
7 .233 1.792 97.748 .043 .333 99.889
8 .141 1.084 98.832 .014 .111 100.000
9 .074 .572 99.404 1.822E-
16
1.402E-
15
100.000
10 .043 .330 99.734 3.453E-
17
2.656E-
16
100.000
11 .028 .216 99.951 -7.643E-
17
-5.879E-
16
100.000
12 .004 .032 99.982 -3.179E-
16
-2.446E-
15
100.000
13 .002 .018 100.000 -9.695E-
16
-7.457E-
15
100.000
Table 4 shows the factor loadings of the soil variables. In the continuously cultivated farm, on the
hillslope, Table 4a, the first factor has positive loadings on sand, soil pH, EC and K, the second
factor on silt, clay, soil pH, and EC, the third factor contains high loadings on TN, Na, and BS, the
fourth factor loads positively on Soil pH and Na, and there are no high positive loadings recorded
on the fifth factor. Only two factors were extracted in the fallow and forest plots. The pattern of
factor loading for fallow land shows that, the first factor has high loadings on sand, pH, K, Ca,
CEC, and % BS, and the second loads on clay, EC, and OC, while, in the forest fields, the loading
Ghana Journal of Geography Vol. 11(2), 2019 pages 243-263
256
patterns reveal that the first factor has a high positive loading on silt, OC, TN, K, Ca, CEC and
BS, and the second factor on clay, pH, Na and Ca.
The patterns for land use types on flatland are shown in Table 5b, indicating that, the first factors
for continuously cultivated farms load positively high on seven variables Clay, OC, TN, K, Na,
Ca and CEC and the second factor on three pH, EC and OC. For the fallow plots, a significant
positive loading was recorded for six soil variables, silt, EC, TN, K, Ca and BS for the first factor,
and on four soil variables sand, pH, Ca and CEC for the second factor. While, for the forest field,
the first factor loaded positively high on six soil variables silt, pH, OC, TN, K, Na and Ca, and the
second factor only on three soil variables TN, Na and BS.
As a whole, the factor loadings patterns of each soil property are similar between and within the
three agricultural land use types and sites. A noticeable difference, however, was the higher
number of negative loadings in continuously cultivated farms on both sites compared to other land
use types. This suggests, therefore, that, interpreting the factor loading of soil variables may be
complex and it may be sometimes impossible to assign an exact definition to a factor because
many soil properties may load highly on that factor. Hence, in this study, a simple structure that
preserved the total variation was obtained by carrying out varimax rotation (Table 4a & 4b).
Table 5a shows the rotated factor matrix of these properties on each factor for the hillslope site.
The first rotated factor has the highest positive loading for silt, the second for clay and pH, the
third for total nitrogen and BS, while, the fourth and fifth for P and OC respectively, for
continuously cultivated farms. For the fallow farms, the first rotated factor has the highest positive
loading for clay, K, and CEC, and the second rotated factor for Ca, BS and pH. For forest soil, the
first rotated factor has the highest positive loading for silt, Ca, CEC and BS and the second rotated
factor positively loads on K, EC, OC, and TN.
For the land use types on the flatland site, Table 4b, only clay positively loads higher on the first
factor, pH, EC and OC on the second rotated factor for continuously cultivated farm land. For
fallow land, the first rotated factor has the highest positive loading for silt, OC, Na and % BS. The

Assessment of Soil Degradation under Agricultural Land Use Sites
257
second rotated factor loads on pH, EC, K, and Ca, while, for forest land, clay, P, CEC, and BS
positively load high on the first factor and pH, TN, and Na on the second rotated factor.
Table 4a: Factor Loadings and Rotated Factor Matrix for Soil Properties of the three Landuse
Types on the Hillslope Site
Factor Loadings Cultivated Fallow Forest
Factor
1
Factor
2
Factor
3
Factor
4
Factor
5
Factor
1
Factor
2
Factor
1
Factor
2
Sand % .749 -.630 -.083 .132 .034 .978 -.207 -.957 -.290
Silt % -.747 .574 .247 -.093 -.197 -.668 -.744 .957 .290
Clay % .321 .866 .011 .159 .257 -.529 .848 -.730 .684
PH(H2O)(1.2.5) .530 .556 .193 .562 .050 .992 .125 .839 .544
EC (dSm-1) .657 .649 .013 -.086 -.263 -.744 .668 .104 -.995
OC (g kg-1) .207 -.054 .418 .167 -.842 -.310 .951 .941 -.338
TN (g kg-1) .221 -.175 .845 -.222 .027 -.126 -.992 .974 -.227
P (mg/kg-1 ) .178 .478 .110 -.795 .277 -.978 .207 -.992 -.128
K Cmol(+)kg-1 .598 -.698 .239 -.141 .206 .978 -.207 .730 -.684
Na Cmol(+)kg-1 .080 .109 .650 .533 .494 -.668 -.744 -.730 .684
Ca Cmol(+)kg-1 -.448 -.070 -.538 .177 .203 .841 .541 .769 .639
CEC Cmol(+)kg-1 -.817 -.214 .203 .360 .009 .978 -.207 .971 .239
BS % -.547 -.126 .787 -.204 .099 .925 .381 .957 .290
Rotated Factor
Matrix
Sand % -.978 .009 -.054 -.046 .146 .875 .484 -.963 -.270
Silt % .982 -.030 .165 -.022 .056 -.019 -1.000 .963 .270
Clay % .257 .826 -.107 .408 -.128 -.955 .295 -.248 -.969
PH(H2O)(1.2.5) -.070 .947 -.030 .033 .202 .669 .744 1.000 -.008
EC (dSm-1) -.016 .569 -.198 .630 .412 -1.000 .019 -.447 .895
OC (g kg-1) -.009 .026 .126 -.116 .962 -.856 .516 .612 .791
TN (g kg-1) -.195 .012 .841 .159 .269 .554 -.833 .699 .715
P (mg/kg-1 ) .187 -.015 .223 .917 -.238 -.875 -.484 -.905 -.425
K Cmol(+)kg-1 -.896 -.161 .361 .064 .023 .875 .484 .248 .969
Na Cmol(+)kg-1 -.065 .650 .626 -.339 -.187 -.019 -1.000 -.248 -.969
Ca Cmol(+)kg-1 .193 -.177 -.429 -.335 -.450 .282 .959 .992 -.126
CEC Cmol(+)kg-1 .457 -.232 .231 -.742 -.130 .875 .484 .947 .320
BS % .385 -.271 .858 -.165 -.012 .450 .893 .963 .270

Ghana Journal of Geography Vol. 11(2), 2019 pages 243-263
258
Table 4b: Factor Loadings and Rotated Factor Matrix for Soil Properties of the three Landuse
Types on the Flatland Site
Factor Loadings Cultivated Farm Fallow Farm Forest Field
Variable Factor 1 Factor 2 Factor 1 Factor 2 Factor 1 Factor 2
Sand % -.979 -.203 -.482 .876 -.972 -.235
Silt % -.999 .038 .855 -.518 .959 -.282
Clay % .957 .291 -.518 -.855 -.959 .282
PH(H2O)(1.2.5) -.152 .988 .417 .909 .869 .496
EC (dSm-1) -.077 .997 .876 .482 -.972 -.235
OC (g kg-1) .533 .846 .605 -.796 .754 -.656
TN (g kg-1) .800 -.600 1.000 .031 .581 .814
P (mg/kg-1 ) -.971 -.241 -.946 .325 -.977 .215
K Cmol(+)kg-1 .846 -.533 .876 .482 .972 .235
Na Cmol(+)kg-1 .999 -.038 .482 -.876 .724 .690
Ca Cmol(+)kg-1 .999 -.038 .708 .706 .959 -.282
CEC Cmol(+)kg-1 .932 -.363 .210 .978 -.997 .073
BS % -.850 -.527 .938 -.347 -.680 .733
Rotated Factor Matrix
Sand % -.993 -.120 -.931 .364 .580 -.815
Silt % -.992 .122 .989 .150 -.910 .416
Clay % .978 .209 .150 -.989 .910 -.416
PH(H2O)(1.2.5) -.067 .998 -.263 .965 -.331 .944
EC (dSm-1) .008 1.000 .364 .931 .580 -.815
OC (g kg-1) .602 .798 .975 -.224 -1.000 -.001
TN (g kg-1) .746 -.666 .747 .664 .095 .995
P (mg/kg-1 ) -.987 -.158 -.935 -.356 .879 -.478
K Cmol(+)kg-1 .798 -.602 .364 .931 -.580 .815
Na Cmol(+)kg-1 .992 -.122 .931 -.364 -.095 .996
Ca Cmol(+)kg-1 .992 -.122 .092 .996 -.910 .416
CEC Cmol(+)kg-1 .898 -.441 -.465 .885 .801 -.599
BS % -.892 -.453 .942 .334 .994 .108

Assessment of Soil Degradation under Agricultural Land Use Sites
259
Table 5 shows the factor score patterns that reflect the spatial characteristics of the underlying
relationship among soil properties within and between the two contrasting sites. The results reveal
that the first two factors for continuously cultivated farms score negatively for most variables on
both land use sites, while, fallow plots and forest fields on both land use sites have progressively
decreasing numbers of negative scores for factor one, and decreasing negative scores from fallow
lands to the forest for factor two. This implies that continuously cultivated farms on both sites are
the most degraded of the three land use types with regards to soil properties. In comparison with
other land use types, the results further showed that the forest area on the flatland, which was used
as the control, suffered little or no degradation in terms of soil properties. This situation is a
reflection of the balanced and undisturbed nature of the nutrient cycling process within a natural
forest.
As a whole, most factors recorded the highest number of negative scores for continuously
cultivated farms, and the number decreased from fallow plots to forest fields within and between
land use sites. This, suggests that continuously cultivated farms are the worst degraded with
respect to these soil properties followed by fallow plots and then forest fields.
Table 5: Factor Scores for topsoil of the three Land Use Types on the Hillslope and Flatland Sites
Site Cultivated Farm Fallow Farm Forest Field
Factor 1 Factor 2 Factor 3 Factor 4 Factor 5 Factor 1 Factor 2 Factor 1 Factor 2
Hillslope Site
-1.22334 .79945 -1.44903 -.99073 1.16503 1.01066 .55848 1.11189 .31149
-.19050 -.37740 1.26453 -1.13419 -.39337 -.98899 .59602 -.28618 -1.11867
1.02267 -.17166 -.98746 -1.37224 -1.32310 -.02167 -1.15450 -.82571 .80718
-.99282 -.89088 -.48907 1.06109 .15465
-.38679 -1.36086 1.13854 -.36302 .85087
1.48710 -.85128 -.59464 .69626 .38317
-.87024 1.07082 .73306 .51497 -1.43519
.00624 .15450 -.45061 1.33278 -.59661
1.14768 1.62732 .83468 .25508 1.19455
Flatland Site
1.14602 -.14134 1.14162 .17330 -1.05021 .48000
-.45060 1.06315 -.42073 -1.07532 .10941 -1.14951
-.69542 -.92181 -.72089 .90202 .94079 .66951
Ghana Journal of Geography Vol. 11(2), 2019 pages 243-263
260
Conclusion
Soil degradation under agricultural land use in two contrasting topographies in a part of the
Northern Guinea Savanna belt of Nigeria was assessed. This was done by collecting and analyzing
thirteen different soil properties sampled from three-land use types on two contrasting
topographies (hillslope and flatland sites). Indices of degradation were computed for each soil
property. The results of these steps revealed that a number of soil properties could be used as
indices of soil degradation. Three important groups of soil properties were identified as indices of
soil degradation between and within the two contrasting sites namely: organic nutrients, cation
exchange capacity, and soil texture. The results for these simple indices were confirmed by the
results of factor analysis that show that there are two or three basic underlying relationships among
the soil properties analyzed. For this reason, in the Savanna environment the agricultural quality
of the soil can be evaluated or assessed by monitoring only these few soil properties. These indices
are easily measured both qualitatively and quantitatively and can even be evaluated cheaply, hence
it is beneficial. We recommend that researchers venture into similar studies in particular in relation
to the entire Savanna region of Nigeria, because of the agricultural, residential industrial and
engineering support potential.
Limitation
A major factor that may constrain the generalizability of the present study is the sample size for
each land use type; a larger size would have been more reliable. However, despite the small sub-
sample sizes, the fact is that the study is the first of its kind to develop a quantitative index (indices)
for assessing soil degradation associated with agricultural land uses between two contrasting
topographies and identify the basic underlying pattern of the interrelationship between the soil
properties in northern Guinea Savanna Region of Nigeria. It is hoped that future researchers will
contribute by examining with larger sample size.
Assessment of Soil Degradation under Agricultural Land Use Sites
261
Acknowledgement
The authors acknowledge with appreciation the efforts of the staff at the Soil Testing Laboratory,
Department of Soil Science, MAUTECH Yola, Nigeria, for analyzing the physiochemical
properties of the soils.
Reference
Adejuwon, J. O. (2008). A Comparism of soil properties under different lanuse types in a part of
the Nigerian cocoa belt. CATENA, 15, 319-331.
Ahukaemere, C. M., Ndukwu, B. N., & Agim, L. C. (2012). Soil Quality and Soil Degradation as
Influenced by Agricultural Land Use Types in the Humid Environment (Vol. 2).
Amuyou, U. A., Eze, E. B., Essoka, P. A., Efiong, J., & Egbai, O. O. (2013). Spatial Variability of
Soil Properties in the Obudu Mountain Region of Southeastern Nigeria. International
Journal of Humanities and Social Science, 3(15).
Babaev, M., Gurbanov, E., & Ramazanova, F. (2015). Main types of soil degradation in the Kura-
Aras Lowland of Azerbaijan. Eurasian Soil Science, 48(4), 445-456.
Cobo, J. G., Dercon, G., & Cadisch, G. (2010). Nutrient balances in African land use systems
across different spatial scales: A review of approaches, challenges and progress.
Agriculture, Ecosystems & Environment, 136(1–2), 1-15.
Cyril, N., & Difference, O. (2012). An Investigation of Temperature Variation at Soil Depths in
Parts of Southern Nigeria. American Journal of Environmental Engineering, 2(5), 142-
147.
Eni, I. (2012). Effects of Land Degradation on Soil Fertility: A Case Study of Calabar South,
Nigeria.
Gorokhova, I. N., & Kupriyanova, E. I. (2012). Assessment of soil degradation processes in the
water protection zone of the Ivan’kovskoe water reservoir on the basis of aerial survey
materials. Eurasian Soil Science, 45(1), 80-89.
Gurbanov, E. (2010). Soil degradation due to erosion under furrow irrigation. Eurasian Soil
Science, 43(12), 1387-1393.

Ghana Journal of Geography Vol. 11(2), 2019 pages 243-263
262
Kiryushin, V. (2007). Assessment of land quality and soil fertility for planning farming systems
and agrotechnologies. Eurasian Soil Science, 40(7), 785-791.
Kuznetsova, I., Utkaeva, V., & Bondarev, A. (2009). Assessment of changes in the physical
properties of plowed loamy soddy-podzolic soils in the nonchernozemic zone of European
Russia under the impact of anthropogenic loads. Eurasian Soil Science, 42(2), 137-146.
Lal, R. (2009). Soil degradation as a reason for inadequate human nutrition. Food Security, 1(1),
45-57.
Lal, R. (2013). Food security in a changing climate. Ecohydrology & Hydrobiology, 13(1), 8-21.
Malgwi, W. B., & Abu, S. T. (2011). variation in some physical properties of soils form on a hilly
terrain under different land use types in Nigeria savanna. International Journal of Soil
Science, 6(3), 150-163.
Martensson, U. (2009). Extract from Assessment of Soil Degradation in Nigeria. SSC Satellitbild,
SWECO International, and Niger Surveys and Consultants. Kiruna.
Molchanov, E., Savin, I. Y., Yakovlev, A., Bulgakov, D., & Makarov, O. (2015). National
approaches to evaluation of the degree of soil degradation. Eurasian Soil Science, 48(11),
1268-1277.
Muchena, F. N., Onduru, D. D., Gachini, G. N., & de Jager, A. (2005). Turning the tides of soil
degradation in Africa: capturing the reality and exploring opportunities. Land Use Policy,
22(1), 23-31.
Mueller, L., Schindler, U., Mirschel, W., Shepherd, T. G., Ball, B. C., Helming, K., . . . Wiggering,
H. (2010). Assessing the productivity function of soils. A review. Agronomy for
Sustainable Development, 30(3), 601-614.
Ogidiolu, A. (2000). Assessment of Soil Degradation Under Agricultural Landuses in a part of
Savana Region of Nigeria. Environmental Review, 3(1), 117-129.
Pimentel, D. (2006). Soil Erosion: A Food and Environmental Threat. Environment, Development
and Sustainability, 8(1), 119-137.
Qi, Y., Darilek, J. L., Huang, B., Zhao, Y., Sun, W., & Gu, Z. (2009). Evaluating soil quality
indices in an agricultural region of Jiangsu Province, China. Geoderma, 149(3–4), 325-
334.
Romanov, A. (2009). Remote assessment of the degree of soil degradation from radiation
properties of soils. Eurasian Soil Science, 42(3), 326-333.

Assessment of Soil Degradation under Agricultural Land Use Sites
263
Senjobi, B. A., S. J. Akinsete, O. T. Ande, C. T. Senjobi, M. Aluku, & Ogunkunle, O. A. (2013).
An Assessment of Spatial Variations of Some Soil Properties under Different Land Uses
in South-Western Nigeria. American Journal of Experimental Agriculture, 3(4).
Sotona, T., Salako, F. K., & Adesodun, J. K. (2013). Soil physical properties of selected soil series
in relation to compaction and erosion on farmers’ fields at Abeokuta, southwestern Nigeria.
Archives of Agronomy and Soil Science, 60(6), 841-857.
Taraba Agricultural Development Programme, (2013). Taraba Agricultural Development
Programme, Village listing Book.
Tilman, D., Cassman, K. G., Matson, P. A., Naylor, R., & Polasky, S. (2002). Agricultural
sustainability and intensive production practices. Nature, 418(6898), 671-677.
Vasil’evskaya, V., Grigor’ev, V. Y., & Pogozheva, E. (2006). Relationships between soil and
vegetation characteristics of tundra ecosystems and their use to assess soil resilience,
degradation, and rehabilitation potentials. Eurasian Soil Science, 39(3), 314-323.
Yusuf, M. B., & Ray, H. H. (2011). Farmers’ Perception and Reponses to Soil erosion in Zing
Local Government Area of Taraba State, Nigeria. Ethiopian Journal of Environmental
Studies and Management, 4(1): 3-98. doi:10.4314/ejesm.v4314i4311.4311.
Yusuf, M. B., Firuza B.M. & Khairulmaini, O.S. (2017). Variation in Soil Physiochemical
Properties at Different Land Use Sites in Northeastern Nigeria. International Journal of
Applied and Physical Sciences, 3(1), 26-34. DOI:
https://dx.doi.org/10.20469/ijaps.20463.50005-20461.
Yusuf, M. B., Firuza B.M. & Khairulmaini, O.S. . (2015). Survey of Rill Erosion Characteristics
of Small-scale Farmers’ Crop Fields in the Northern Part of Taraba State, Nigeria.
International Journal of Tropical Agriculture,, 33(4), 3305-3313.
Yusuf, M. B., Mustafa, F. B., & Salleh, K. O. (2017). Farmer perception of soil erosion and
investment in soil conservation measures: emerging evidence from northern Taraba State,
Nigeria. Soil Use and Management, March 2017, 33, 163–173, 33, 163–173 doi:
110.1111/sum.12332.
Zaidel’man, F. (2009). Degradation of soils as a result of human-induced transformation of their
water regime and soil-protective practice. Eurasian Soil Science, 42(1), 82-92.