assessment of operating challenges of digester foaming · assessment of operating challenges of...
TRANSCRIPT

Assessment of Operating Challenges of Digester Foaming by Ralph B. “Rusty” Schroedel, Jr., BCEE Brown and Caldwell

Central States Water Environment Association
Based Partially on a Survey and Workshops by the
Brown and Caldwell 2
Acknowledgements
Jeff Brochtrup, Madison MSD Randy Wirtz, Strand Associates Eric Lecuyer, Northern Moraine WRD (previously, Central States Executive Director)
Initial results presented at WEF Residuals and Biosolids Conference, May 2011, Sacramento, CA

Background
3

• Concerns Expressed at 2009 Annual Meeting • CSWEA Objective to Better Engage and Serve
Operators • Ad Hoc Committee Developed
• Selected Chair and Nominated Members • Developed Committee Charge
• Committee Developed Survey and Workshop as Goals
• Survey Developed and Performed in Late 2009/Early 2010 • Web Based • Follow Up by Committee Members
Formation of Ad Hoc Committee
Page 4

• Committee established after 2009 annual conference
• Initial groundwork in late 2009 • Survey sent out in early 2010 • 1st Workshop – April 2010 • Follow Up Survey • 2nd Workshop – April 2011 • 3rd Workshop – February 2012
History of the CSWEA Digester Foaming Committee’s Efforts

• Varying Sludge Loadings • Total Sludge Quantity • Ratio of Primary Sludge to WAS
• High Ratio of WAS • Inadequate Mixing • Nocardia and Microthrix Parvecella • Inconsistent or High VFAs • Low Influent Solids Concentration • Excessive or Fine Bubble Mixing
Initial Workshop - April 21, 2010 Identified Typical Causes of Excessive Foaming

Survey Results
Brown and Caldwell 7

• About 216 WWTPs have anaerobic digestion: • Illinois: 64 • Minnesota: 56 • Wisconsin: 96
• Ad hoc committee developed questionnaire to gauge the extent of anaerobic digester foaming problems at WWTPs
• Follow-up calls and e-mails
Brief Survey Summary

• Significant Digester Foaming in Last 10 Years?
Survey – 94 Responses (44%)
Percent of Responses 53%
47%
0%
10%
20%
30%
40%
50%
60%
70%
80%
90%
100%
Yes No
50 of the 94 Responses 23% (min) of the 216 WWTPs

• Was Cause of Digester Foaming Determined?
Survey Responses
55% 45%
0%
10%
20%
30%
40%
50%
60%
70%
80%
90%
100%
Yes No

• Size of WWTPs
Survey Trends
32%
60%
50%
86%
0%
10%
20%
30%
40%
50%
60%
70%
80%
90%
100%
< 1.0 mgd 1 to 5 mgd 5 to 20 mgd > 20 mgd
6 of 19
27 of 45 12 of 24
6 of 7
Percent of Plants w/ Digester Foaming

59%
40% 30%
0%
10%
20%
30%
40%
50%
60%
70%
80%
90%
100%
Activated Sludge Trickling Filters RBCs
• Type of Biological Treatment
Survey Trends
3 of 10 10 of 25
Percent of Plants w/ Digester Foaming
43 of 73

• Foaming in Activated Sludge?
Survey Trends
70%
58%
0% 10% 20% 30% 40% 50% 60% 70% 80% 90%
100%
Yes No
Percent of Plants w/ Digester Foaming
32 of 55 14 of 20

61% 64%
31%
0%
10%
20%
30%
40%
50%
60%
70%
80%
90%
100%
CPR BPR No P Removal
• Phosphorus Removal
Survey Trends
8 of 26
14 of 22 30 of 49 Percent of
Plants w/ Digester Foaming

60%
50%
38%
0%
10%
20%
30%
40%
50%
60%
70%
80%
90%
100%
NH3 Removal Total N Removal No N Removal
• Nitrogen Removal
Survey Trends
9 of 24
2 of 4 41 of 68 Percent of
Plants w/ Digester Foaming

• Digestion Process
Survey Trends
56%
43%
0%
10%
20%
30%
40%
50%
60%
70%
80%
90%
100%
Meso Only Thermo Only TPAD Acid-Gas
0 of 3 0 of 1
46 of 82
3 of 7
Percent of Plants w/ Digester Foaming

• Digester Detention Time
Survey Trends
60% 61%
47%
59%
0%
10%
20%
30%
40%
50%
60%
70%
80%
90%
100%
1 - 10 days 11 - 20 days 21 - 30 days > 30 days
3 of 5 14 of 23
16 of 34 19 of 32
Percent of Plants w/ Digester Foaming

• Digester Mixing System
Survey Trends
70% 64% 61%
33%
0%
10%
20%
30%
40%
50%
60%
70%
80%
90%
100%
Gas - Canon Gas - Lances Liquid - Pumped Recirc.
Liquid - Draft Tube
Percent of Plants w/ Digester Foaming
22 of 36
7 of 21
18 of 28 7 of 10

Follow Up Activities
Brown and Caldwell 19

• Attempted to Dig a Little Deeper: • Many of the same questions as 2010 • Mixing times, sequence, etc. • Heating equipment and methods • Feed sludge type, blending, etc. • Feeding times, sequence, etc. • Hauled waste acceptance • VS loading rates
Follow Up Survey

• Lowered our operating level • Reduced feed rates when it has foam • Increase Volatile Acid and Alkalinity testing • H2S / CO2 testing • Change mixing intervals • Reduced feed • Adjust duration of feed • Adjust removal rates • Reduced grease pumping
Second Workshop – Survey Responses – Comments – Dealing with Foam

• February 2012 • Provided more detailed analysis of specific case
studies • Causes • Solutions
• Further Developed and Refined “Mitigation and Adaptation” Concept
Third Workshop

Rapid Rise
Brown and Caldwell 23
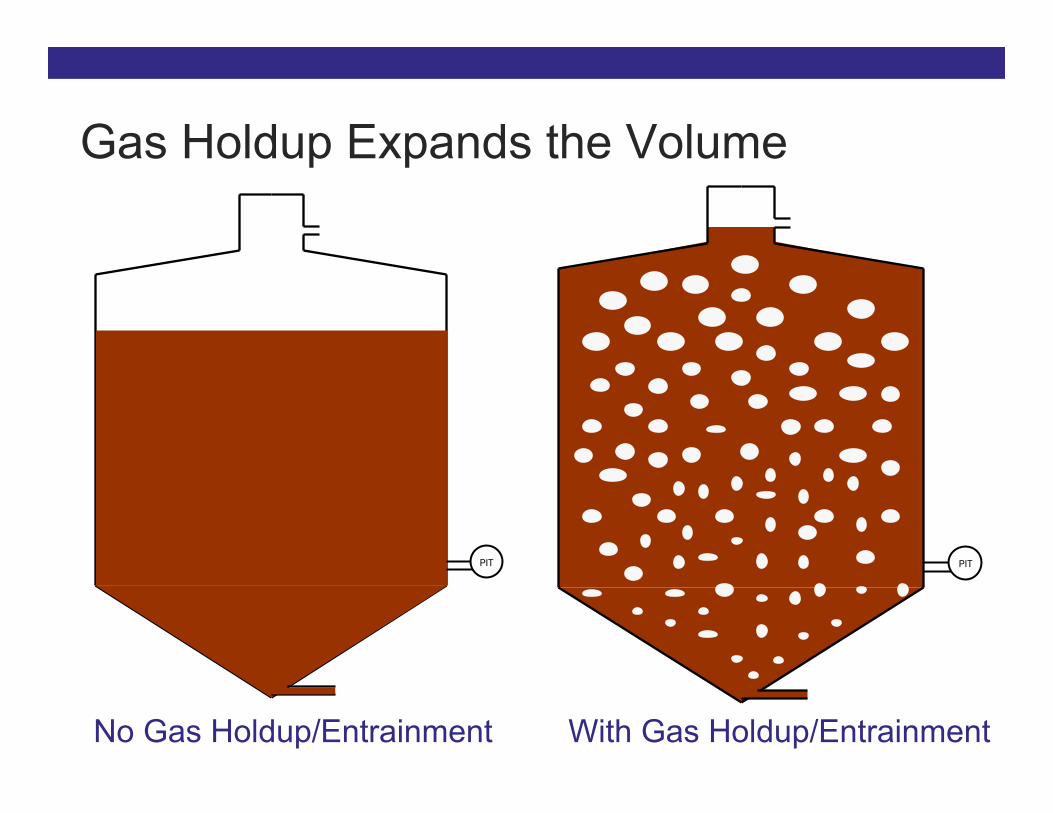
Gas Holdup Expands the Volume
No Gas Holdup/Entrainment With Gas Holdup/Entrainment
PIT PIT

Recent OWASA (NC) data suggest low-specific-gravity can be normal / ongoing
25
Digester Stage
Pressure (ft )
Radar (ft)
Calculated Average Specific Gravity
1 22.6 30.4 74%
2 19.2 23.3 82%
3 16.2 19.0 85%
RAD
PIT

Case Histories
Brown and Caldwell 26

Video from Hawaii Shows Rapid Rise in Action…
27
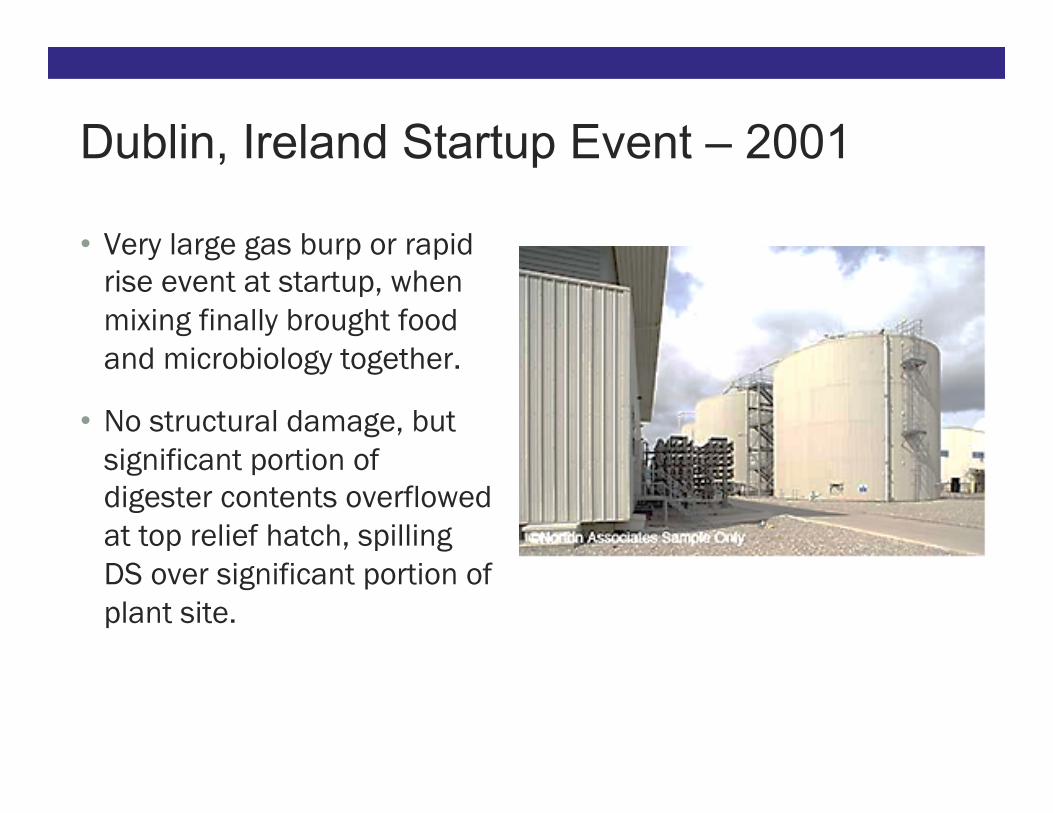
• Very large gas burp or rapid rise event at startup, when mixing finally brought food and microbiology together.
• No structural damage, but significant portion of digester contents overflowed at top relief hatch, spilling DS over significant portion of plant site.
Dublin, Ireland Startup Event – 2001

Marquette City, Michigan
• River of Digester Overflow – Foam/Biosolids
Extreme Events - Digester Overflows at Marquette City

Lillehammer, Norway Digester Cover Break
• Fiberglass cover break in 2005 (vacuum) and 2012 (over-pressure)
• Food-waste digester – “hot” fish waste load suspected in Dec 2012
• De-foamer not used during Dec 2012 event
• Resulting burp/rapid rise plugged PRVs and gas lines – also some debris in the digester

Cover Event in Northern Florida, 2012
• Floating cover digester being started up.
• Tank had significant undigested sludge, then temp brought up to meso.
• Rapid expansion of biology and activity brought major overflows plus tilting and jamming the floating cover – damage and major delay.

Spokane Digester Cover Break in 2004
• Sludge digester with fixed concrete cover
• Cover over-pressurized due to several factors
• Entire cover lifted, crashed, and broke apart
• 1 killed, 2 serious injuries • RR/burp event plugged pipes – DS
spilling out PRVs • Instrument / SCADA failure • Recent piping changes may have
caused confusion in response

• Tall primary digesters – 65 feet side-water depth
• Rapid Rise events documented starting in early 2012, biggest events when mixing stops (power out)
• Extreme specific gravity change over 6 hour event 0.92 → 0.77 (gas holdup). 11 % volume expansion, with overflows going to the secondary digester.
Brightwater WWTP Startup (2012) - King County, Washington

• Tanks were built with large overflow and surface wasting capacity
• Even tighter controlled feed to digesters has been implemented (no FOG slugs for now)
• Mixer ramping is highly controlled. • Radar has been added; operator
training improved; and capacitance probe for foam level monitoring
Brightwater WWTP Startup (continued)

Setup: • Vertical-oriented digester/reactors • Visually observe liquid rise/foam • Mixing with paddle mixer
Procedure: • Turn mixer off, or other changes • Measure slurry height over time • Observe characteristics of RR/foam • Continuously monitor gas production Ongoing Testing in 2014
Lab Testing at Bucknell University (Matt Higgins)
35


Page 37

Plant Description: • This is a 60 mgd plant that
has preliminary, primary, and secondary treatment. Solids handling facilities includes DAFT’s, anaerobic digestion, dewatering and incineration.
• Solutions • Improve feeding • Improve mixing • Improve temperature control
Digester No. 1 Case Study

Plant Description:
• This is an 8 mgd plant consists of preliminary, secondary, and tertiary treatment. The solids handling facilities consists of scum thickening, DAFT’s, anaerobic digestion and dewatering.
Digester No. 2 Case Study

Solution: • Acid- Gas Phased Digestion
Digester No. 2 Case Study Problems: • Nocardia

Phased Digestion
Feed Acid Phase
Diges.on
1 day
Methane Phase
Diges.on
10 days

Digester No. 3 Case Study
• Overpressurized the fixed covers, ripping connections between the steel cover and concrete wall.
• All 3 digesters had these events during first 2 years of operation.
• Cause seemed to be accumulation of low-SG sludge in the top portion of tanks.

Problems: • Feeding methods • Foam adaptation
Digester No. 3 Case Study
Solution: • Improved feeding methods • Improved mixing methods • Digester modifications


Draft Final Report in Review
Other Research

• Agencies are experiencing significant problems from burps, foaming, and rapid rise/gas holdup
• Information is beginning to be shared in the industry. • Digester foaming, gas holdup and rapid rise depends on many
factors: • Digester loading rates (and variability of loading) • Sludge characteristics/viscosity • Tank shape/configuration • Mixing system • Piping details (in/out, and overflow)
• Digester startups and process/loading changes often create unstable situations - more susceptible to foam and rapid rise events.
What Have We Learned from All This?

• Control Feeding • Monitor Sludge Feed
• Volatile acids (Below 4,000 mg/L) • VS loading rate • Consistent feed
• Maintain Temperature • Provide Good Mixing
Operator Controls
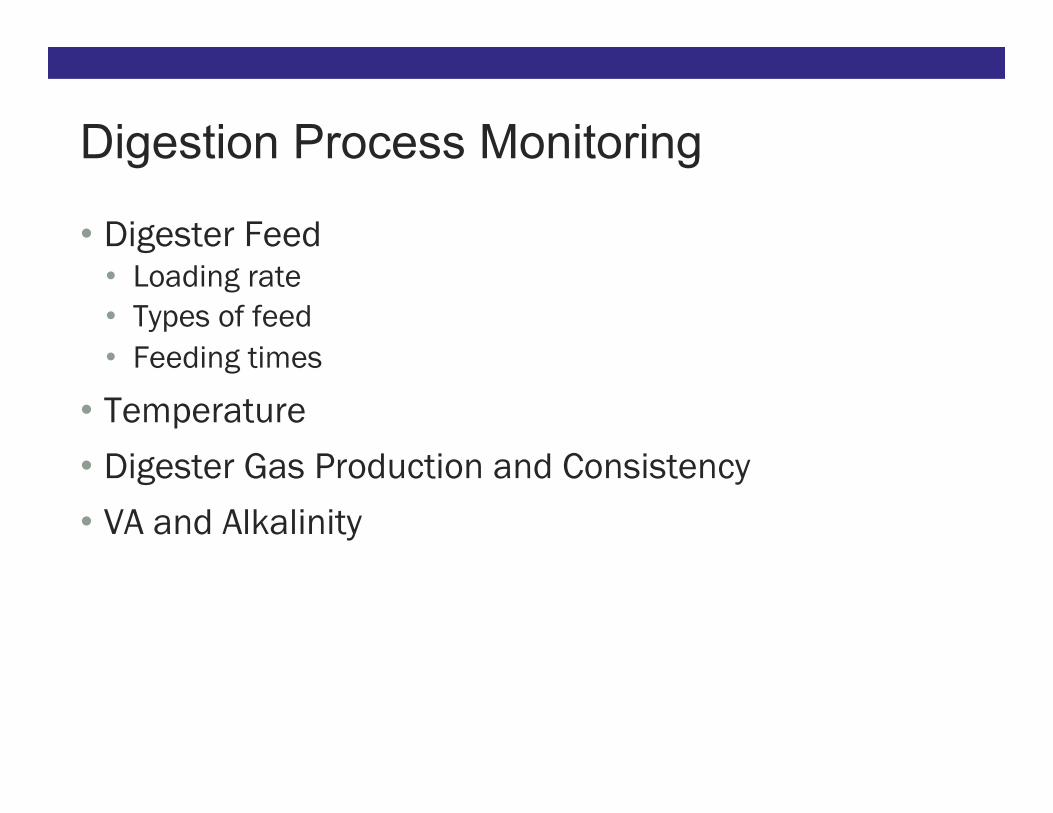
• Digester Feed • Loading rate • Types of feed • Feeding times
• Temperature • Digester Gas Production and Consistency • VA and Alkalinity
Digestion Process Monitoring

Surface Wasting Improvements
50

Cost - Cutting, More Effective Designs
51
Submerged Fixed Covers • Mimic egg performance • Last ~ 50 years • ½ the cost of Eggs • Concentrated surface wasting in dome
Submerged
Eggs

Emergency Relief Manhole
St. Petersburg (FL ERM Design)
Rapid Rise will Likely Happen in Highly Loaded Digesters
Address the symptom: • Try to dampen slug loads/force
consistent feed • Passive relief hatches/collection
to designed sludge receiving Alternative is failed mechanical covers or to fill digester gas piping…
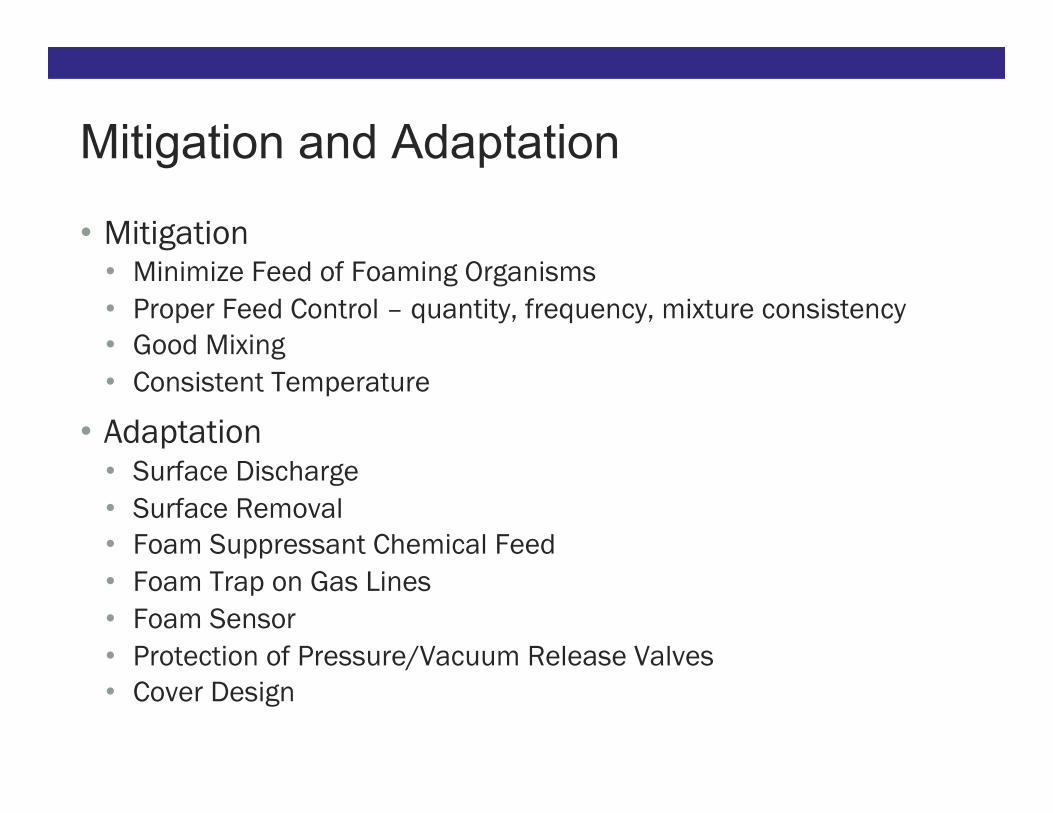
• Mitigation • Minimize Feed of Foaming Organisms • Proper Feed Control – quantity, frequency, mixture consistency • Good Mixing • Consistent Temperature
• Adaptation • Surface Discharge • Surface Removal • Foam Suppressant Chemical Feed • Foam Trap on Gas Lines • Foam Sensor • Protection of Pressure/Vacuum Release Valves • Cover Design
Mitigation and Adaptation
