assessment of gridded observations used for climate model … · 2017-01-20 · a second technique...
TRANSCRIPT
Assessment of gridded observations used for climate
model validation in the Mediterranean region: the
HyMeX and MED-CORDEX framework
Emmanouil Flaounas, Philippe Drobinski, Marco Borga, Jean-Christophe
Calvet, Guy Delrieu, Efrat Morin, Gianni Tartari, Roberta Toffolon
To cite this version:
Emmanouil Flaounas, Philippe Drobinski, Marco Borga, Jean-Christophe Calvet, Guy Delrieu,et al.. Assessment of gridded observations used for climate model validation in the Mediter-ranean region: the HyMeX and MED-CORDEX framework. Environmental Research Letters,IOP Publishing, 2012, 7 (2), pp.024017. <10.1088/1748-9326/7/2/024017>. <hal-01110326>
HAL Id: hal-01110326
https://hal.archives-ouvertes.fr/hal-01110326
Submitted on 27 Jan 2015
HAL is a multi-disciplinary open accessarchive for the deposit and dissemination of sci-entific research documents, whether they are pub-lished or not. The documents may come fromteaching and research institutions in France orabroad, or from public or private research centers.
L’archive ouverte pluridisciplinaire HAL, estdestinee au depot et a la diffusion de documentsscientifiques de niveau recherche, publies ou non,emanant des etablissements d’enseignement et derecherche francais ou etrangers, des laboratoirespublics ou prives.


This content has been downloaded from IOPscience. Please scroll down to see the full text.
Download details:
IP Address: 84.10.1.42
This content was downloaded on 13/10/2013 at 09:21
Please note that terms and conditions apply.
Assessment of gridded observations used for climate model validation in the Mediterranean
region: the HyMeX and MED-CORDEX framework
View the table of contents for this issue, or go to the journal homepage for more
2012 Environ. Res. Lett. 7 024017
(http://iopscience.iop.org/1748-9326/7/2/024017)
Home Search Collections Journals About Contact us My IOPscience
IOP PUBLISHING ENVIRONMENTAL RESEARCH LETTERS
Environ. Res. Lett. 7 (2012) 024017 (8pp) doi:10.1088/1748-9326/7/2/024017
Assessment of gridded observations usedfor climate model validation in theMediterranean region: the HyMeX andMED-CORDEX frameworkEmmanouil Flaounas1,7, Philippe Drobinski1, Marco Borga2,Jean-Christophe Calvet3, Guy Delrieu4, Efrat Morin5, Gianni Tartari6
and Roberta Toffolon6
1 LMD/IPSL, CNRS and Ecole Polytechnique, Palaiseau, France2 Department of Land and Agroforest Environments, University of Padova, Legnaro (PD) 35020, Italy3 CNRM/GAME, Meteo-France and CNRS, Toulouse, France4 LTHE, CNRS and Universite de Grenoble, Grenoble, France5 Geography Department, The Hebrew University of Jerusalem, Mt. Scopus, Jerusalem 91905, Israel6 Ev-K2-CNR Committee, Bergamo, Italy
E-mail: [email protected]
Received 28 February 2012Accepted for publication 1 May 2012Published 21 May 2012Online at stacks.iop.org/ERL/7/024017
AbstractThis letter assesses the quality of temperature and rainfall daily retrievals of the EuropeanClimate Assessment and Dataset (ECA&D) with respect to measurements collected locally invarious parts of the Euro-Mediterranean region in the framework of the Hydrological Cycle inthe Mediterranean Experiment (HyMeX), endorsed by the Global Energy and Water CycleExperiment (GEWEX) of the World Climate Research Program (WCRP). The ECA&D,among other gridded datasets, is very often used as a reference for model calibration andevaluation. This is for instance the case in the context of the WCRP Coordinated RegionalDownscaling Experiment (CORDEX) and its Mediterranean declination MED-CORDEX.This letter quantifies ECA&D dataset uncertainties associated with temperature andprecipitation intra-seasonal variability, seasonal distribution and extremes. Our motivation isto help the interpretation of the results when validating or calibrating downscaling models bythe ECA&D dataset in the context of regional climate research in the Euro-Mediterraneanregion.
Keywords: uncertainties assessment, model validation, E-OBS, HyMex, CORDEX
1. Introduction
Climate modeling has been developed and used for bothclimate understanding and prediction of future climate trends.Great progress has been achieved using global climate models(GCMs) to reconstruct the global climate with a horizontal
7 Address for correspondence: LMD—Ecole Polytechnique, 91128Palaiseau Cedex, France.
resolution of few hundred kilometers, allowing the explicitsimulation of global to synoptic scale atmospheric circulation.With increasing computer resources and performance, thesimulation of the climate system at much finer resolution(typically around a few tens of kilometers) has becomea realistic objective and a major issue to investigate thecontribution of mesoscale meteorological systems (breezes,orographic wind, cyclones, etc) to the regional climate.
11748-9326/12/024017+08$33.00 c© 2012 IOP Publishing Ltd Printed in the UK & the USA

Environ. Res. Lett. 7 (2012) 024017 E Flaounas et al
Hence, climate downscaling techniques have beendeveloped based on two distinct approaches. A first techniqueis dynamical downscaling (DD), based on the use ofregional climate models (RCMs) which solve the conservationequations on a highly resolved mesh grid (see, e.g., Maraunet al 2010 for a review). RCM initial and boundary conditionsare provided by GCM outputs. Nudging can also be appliedfor long-term RCM simulations to maintain consistencybetween the RCM large-scale dynamics and that of thedriving GCM (see, e.g., Salameh et al 2010, Omrani et al2012a, 2012b). A second technique is statistical downscaling(SD), based on the determination of a statistical relationshipbetween local measurements and GCM outputs over acalibration period. It is used for local projection of the GCMoutputs (see Wilby et al 2002 for a review).
The use of gridded observations has become particularlypopular for the calibration and evaluation of downscalingtechniques (see, e.g., Quadrelli et al 2001, Jacob et al 2007,Schmidli et al 2007, Hertig and Jacobeit 2008). In particularfor SD, gridded datasets allow us to overpass one majordrawback. Indeed, SD generally suffers from a lack of spatialrepresentativeness due to the need of local measurements forcalibration (see, e.g., Salameh et al 2009, Lavaysse et al 2011,Vrac et al 2011). Gridded datasets allow production by theSD technique of local climate information on a grid similar tothe numerical grid of DD, favoring the comparison betweenthe two downscaling techniques. However, these griddeddatasets are statistical extrapolations of surface observationsand are thus the products of more or less sophisticatedassimilating or interpolating systems (e.g. CRU dataset formonthly products at global scale—Mitchell and Jones 2005;ECA&D for daily outputs over the Euro-Mediterraneanarea—Haylock et al 2008; SAFRAN for three-hourly outputsover France—Quintana Seguı et al 2010). As a result, griddedobservations are not ‘local measurements’ but a product whichcan be seen as the best fit to the observations. Thus they shouldbe used with caution, since significant uncertainties mightcause misinterpreted results (Santos et al 2007, Hofstra et al2009).
In this letter, we give special attention to theMediterranean region as one of the two ‘hot spots’ of climatechange (Giorgi 2006). The Mediterranean climate presents avery complex seasonal cycle with extreme events governedby cyclones, severe storms and heat-waves. These regionalatmospheric processes are studied within the HydrologicalCycle in the Mediterranean Experiment (HyMeX), aimingat a better understanding of the regional water cycle andits variability, trend and extremes in a changing climate(Drobinski et al 2010, 2009b, 2009a, 2011). In addition,the Coordinated Regional Climate Downscaling Experiment(CORDEX; Giorgi et al 2009) and its Mediterraneandeclination (MED-CORDEX; Ruti et al 2012) of the WorldClimate Research Program (WCRP) is a program aimingat providing a quality controlled dataset of regional climatedownscaling based information for both recent past and 21stcentury projections. These downscaled data are produced athorizontal resolutions of 50 km or less, and their evaluationrelies very much on gridded datasets.
The European Climate Assessment and Dataset(ECA&D) provides daily data of temperature and rainfallsince 1950 at fine resolution (∼25 km), covering theEuro-Mediterranean area. Hence, ECA&D is very adequatefor the evaluation and calibration of both DD and SD forthe needs of climate research in the frame of HyMeXand MED-CORDEX. In this study we aim at quantifyingthe uncertainties of the daily temperature and rainfallgridded dataset of ECA&D. Our motivation is to helpthe interpretation of the results of DD and SD modelswhen calibrated or compared to this gridded database. Forthis reason, ECA&D is compared to local measurements,collected at the HyMeX stations labeled by the Global Energyand Water Cycle Experiment (GEWEX) of WCRP8.
After this introduction, the ECA&D daily temperatureand rainfall gridded dataset and the HyMeX local observationsare described in section 2. Section 3 quantifies anddiscusses the uncertainty of the ECA&D gridded datasetregarding specific local climates of different regions ofthe Mediterranean area. Finally, section 4 summarizes thediscussion and gives perspectives for future work.
2. Data and methodology
The ECA&D dataset (fourth version) contains 26 061 series ofobservations for 12 elements at 4823 meteorological stationsthroughout Europe and the Mediterranean. It covers Europe,North Africa and the Middle East with a horizontal resolutionof 0.25◦ × 0.25◦ (Klein Tank et al 2002, Haylock et al 2008).Daily 2 m temperature and total rainfall are available from1950. They have been widely used for regional climate studies(e.g. Haylock and Goodess 2004, Santos et al 2007) andclimate model evaluation (e.g. Frei et al 2003, Raisanen et al2004, Kjellstrom et al 2010).
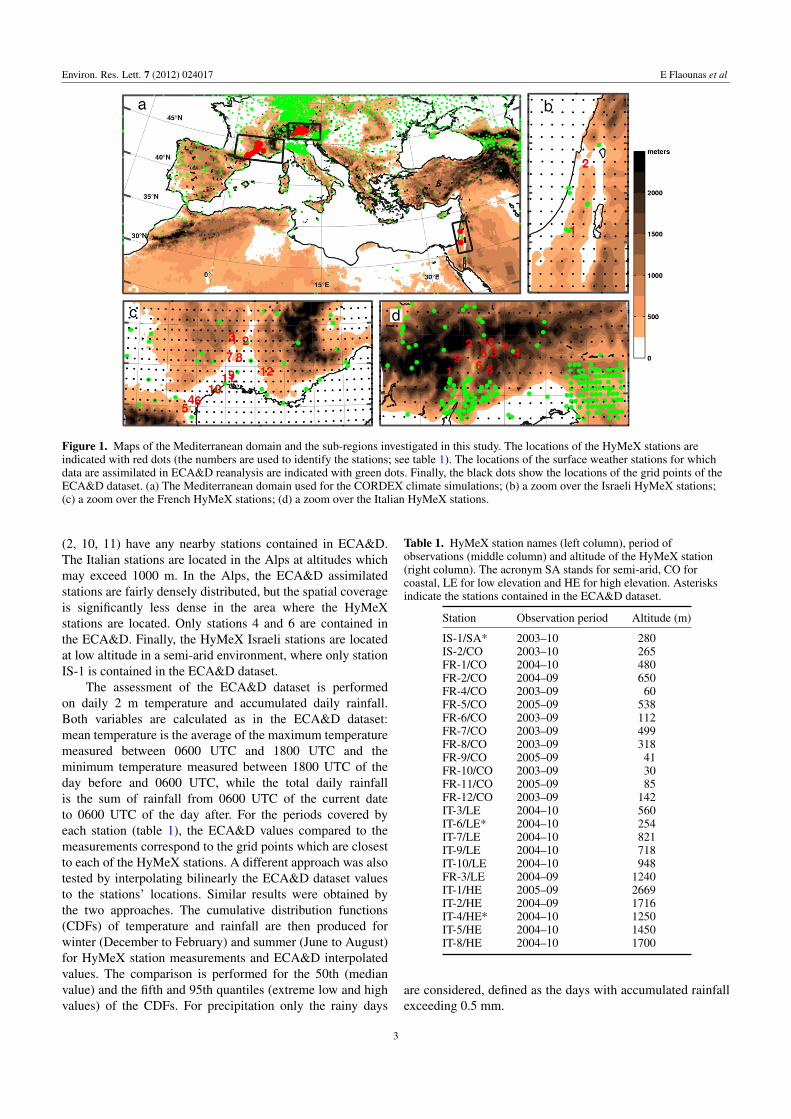
The meteorological stations used to evaluate the ECA&Ddataset are the GEWEX labeled research stations of theHyMeX network. Only three HyMeX stations out of the 24used in this study are contained in the ECA&D. The stationscollect hourly measurements; 12 stations are located in thecoastal region of Southern France, ten in Northern Italy in theAlps and two in Israel. To better assess the ECA&D dataset weseparate the stations into four categories: (i) semi-arid climatestations, (ii) mid-latitude coastal stations, (iii) mid-latitudelow elevation stations and (iv) mid-latitude high elevationstations. Stations are characterized as low (high) elevationstations if they are located at altitudes below (exceeding)1000 m. Table 1 provides information on the altitude, themeasurement period and the station characteristics. Figure 1displays the locations of the HyMeX stations, the stationscontained in the ECA&D and the ECA&D dataset grid points.The terrain elevation is also displayed as key informationto better understand the local climate specificities and theirpossible impact on the analysis of the data. In SouthernFrance most HyMeX stations are coastal and located in plainsat low altitude (below 500 m elevation) and three of them
8 Some of the Italian stations are also part of the ‘High Elevation’ regionalhydroclimate project of GEWEX.
2
Environ. Res. Lett. 7 (2012) 024017 E Flaounas et al
d
Figure 1. Maps of the Mediterranean domain and the sub-regions investigated in this study. The locations of the HyMeX stations areindicated with red dots (the numbers are used to identify the stations; see table 1). The locations of the surface weather stations for whichdata are assimilated in ECA&D reanalysis are indicated with green dots. Finally, the black dots show the locations of the grid points of theECA&D dataset. (a) The Mediterranean domain used for the CORDEX climate simulations; (b) a zoom over the Israeli HyMeX stations;(c) a zoom over the French HyMeX stations; (d) a zoom over the Italian HyMeX stations.
(2, 10, 11) have any nearby stations contained in ECA&D.The Italian stations are located in the Alps at altitudes whichmay exceed 1000 m. In the Alps, the ECA&D assimilatedstations are fairly densely distributed, but the spatial coverageis significantly less dense in the area where the HyMeXstations are located. Only stations 4 and 6 are contained inthe ECA&D. Finally, the HyMeX Israeli stations are locatedat low altitude in a semi-arid environment, where only stationIS-1 is contained in the ECA&D dataset.
The assessment of the ECA&D dataset is performedon daily 2 m temperature and accumulated daily rainfall.Both variables are calculated as in the ECA&D dataset:mean temperature is the average of the maximum temperaturemeasured between 0600 UTC and 1800 UTC and theminimum temperature measured between 1800 UTC of theday before and 0600 UTC, while the total daily rainfallis the sum of rainfall from 0600 UTC of the current dateto 0600 UTC of the day after. For the periods covered byeach station (table 1), the ECA&D values compared to themeasurements correspond to the grid points which are closestto each of the HyMeX stations. A different approach was alsotested by interpolating bilinearly the ECA&D dataset valuesto the stations’ locations. Similar results were obtained bythe two approaches. The cumulative distribution functions(CDFs) of temperature and rainfall are then produced forwinter (December to February) and summer (June to August)for HyMeX station measurements and ECA&D interpolatedvalues. The comparison is performed for the 50th (medianvalue) and the fifth and 95th quantiles (extreme low and highvalues) of the CDFs. For precipitation only the rainy days
Table 1. HyMeX station names (left column), period ofobservations (middle column) and altitude of the HyMeX station(right column). The acronym SA stands for semi-arid, CO forcoastal, LE for low elevation and HE for high elevation. Asterisksindicate the stations contained in the ECA&D dataset.
Station Observation period Altitude (m)
IS-1/SA* 2003–10 280IS-2/CO 2003–10 265FR-1/CO 2004–10 480FR-2/CO 2004–09 650FR-4/CO 2003–09 60FR-5/CO 2005–09 538FR-6/CO 2003–09 112FR-7/CO 2003–09 499FR-8/CO 2003–09 318FR-9/CO 2005–09 41FR-10/CO 2003–09 30FR-11/CO 2005–09 85FR-12/CO 2003–09 142IT-3/LE 2004–10 560IT-6/LE* 2004–10 254IT-7/LE 2004–10 821IT-9/LE 2004–10 718IT-10/LE 2004–10 948FR-3/LE 2004–09 1240IT-1/HE 2005–09 2669IT-2/HE 2004–09 1716IT-4/HE* 2004–10 1250IT-5/HE 2004–10 1450IT-8/HE 2004–10 1700
are considered, defined as the days with accumulated rainfallexceeding 0.5 mm.
3

Environ. Res. Lett. 7 (2012) 024017 E Flaounas et al
Figure 2. Boxplots showing the CDFs of the near surface temperature ((a) and (b)) and the CDF of the temperature difference between theECA&D dataset and the measurements at the HyMeX stations. The boxplots in red correspond to the stations located in a semi-aridenvironment. The boxplots in green correspond to the coastal stations. The boxplots in brown and in black correspond to the stations locatedat low and high elevation, respectively (below/above 1000 m height; see table 1). The lower and upper limits of the boxes show thetemperature values of the 25th and the 75th quantiles. The horizontal line within the boxes shows the median temperature (50th quantile);the ends of the vertical lines extending below and above the boxes indicate the fifth and the 95th temperature quantiles, respectively. (a)Boxplots of the ECA&D dataset and HyMeX surface stations for winter (for each station the left hand boxplot corresponds to the HyMeXstation data and the right hand boxplot to the ECA&D data). (b) Similar to (a) for summer. (c) Boxplots of the temperature bias for winter(ECA&D temperature minus HyMeX station observation). (d) Similar to (c) for summer.
The significance of the results was tested through a pairedStudent t-test of the null hypothesis that the difference of theECA&D dataset minus the measurements is a random samplefrom a normal distribution with zero mean and unknownvariance, against the alternative that the mean is not zero. Aconfidence level of 95% of rejection of this null hypothesis hasbeen applied. For temperature the null hypothesis is rejectedfor all stations and for both seasons. However, correlationbetween consecutive temperature measurements can be highand invalidate the application of a Student t-test. Indeed,correlation drops below the significant level (around 20% onaverage) after 3 days. The Student t-test has thus been appliedon subsets of the whole temperature dataset, keeping onlythe measurements every 3, 4, 5 and up to 10 days, withoutaffecting the Student t-test. The t-test is thus passed withhigh robustness at all HyMeX stations. On the other hand,for rainfall, the null hypothesis is not rejected for all stations.Non-rejection reflects a rather good performance of theECA&D dataset, showing that the ECA&D analyzed valuesdo not differ significantly, under the null hypothesis, fromthe measurements. Regarding rainfall, time series display highday-to-day variability and so only relatively large differencescan be found significant (Morin 2011).
3. Results
Figures 2 and 3 ((a) and (b)) display, as boxplots, the CDFs ofthe daily 2 m temperature and rainfall, respectively, computedfrom the HyMeX stations and the ECA&D time series. Ina similar way, figures 2 and 3 ((c) and (d)) show the CDFsof the bias between the ECA&D values and the HyMeXmeasurements for temperature and rainfall, respectively. Forrainfall, the ECA&D dataset and the HyMeX measurementsdo not have the same rainy days so a negative bias can bedue to rainfall underestimation or to the absence of rain inECA&D. In order to reduce interpretation problems that mayarise from this sampling effect, the CDF of the rainfall biaswas computed only for the days when rainfall was presentin both ECA&D and at the HyMeX stations. The numberof rainy days in ECA&D and in HyMeX observations isindicated over the boxplots in panels (a) and (b) of figure 3,and the number of common rainy days is indicated over theboxplots in panels (c) and (d) of figure 3.
3.1. Stations in semi-arid environment
The first Israeli station (IS-1) is the only station availablein a semi-arid environment. The ECA&D dataset reproduces
4

Environ. Res. Lett. 7 (2012) 024017 E Flaounas et al
Figure 3. The same as figure 2 for rainfall. The number of rainy days used for computing the CDFs is indicated above the boxplots. If thenumber of rainy days is in brackets, the null hypothesis of the Student t-test is not rejected.
accurately the winter temperature median and extremes withless than 1 ◦C difference (figure 2(a)). In summer the resultsare similarly good (figure 2(b)). The performance of ECA&Dfor station IS-1 should not come as a surprise since this stationis assimilated. Figures 2(c) and (d) show the CDFs of thewinter and summer temperature biases (ECA&D values minusHyMeX observations). Station IS-1 displays a systematicnegative bias. This bias is on average about 1 ◦C but can reachup to 2.5 ◦C.
Regarding winter rainfall (figure 3(a)), the ECA&D CDFfor IS-1 seems to be very close to the HyMeX observations.Accordingly, the rainfall bias for the same station displays avery small interquartile range, centered about 0 (figure 3(c)).As a consequence, the ECA&D dataset captures the seasonalvariability of rainfall and reproduces accurately the rainfallamount. Even though ECA&D seems to perform fairly well,we might be surprised that there are ‘only’ 60–70% commonrainy days with the HyMeX observations. Indeed, there are102 common rainy days, out of 165 events in ECA&D and143 in the observations.
3.2. Coastal stations
At the Israeli station IS-2, the ECA&D dataset temperatureseems to be in fair agreement with the HyMeX observationsonly in winter, while in summer it overestimates the medianby approximately 2.5 ◦C with a systematic positive bias. Atthe French coastal HyMeX stations, the winter temperatureranges from 0 to 10 ◦C with the median value at about 5 ◦C(figure 2(a)). In summer, the temperature CDF is similar,with however a shift of approximately +15 ◦C (figure 2b).
The ECA&D performs fairly well for all stations, exceptfor FR-1, FR-2 and FR-5. Figures 2(c) and (d) display theCDFs of the temperature bias, where results are very similarin winter and summer. Stations FR-4, FR-6, FR-8 and FR-9display an interquartile range lower than 1 ◦C, which iscentered around 0 ◦C in winter, and slightly biased in summer(of the order of 0.5 ◦C). The ECA&D temperatures at theother stations generally display a significant positive bias(>1 ◦C for the median bias); however, the interquartile rangeof temperature bias is always smaller than 2 ◦C, suggestingsmall temperature variability in the ECA&D dataset, exceptfor station FR-1. Station FR-1 is by far the location whereECA&D data compare worst with the HyMeX observations.The bias between the ECA&D temperature and the measuredtemperature is in 50% of the cases lower than −2.5 ◦Cand negative most of the time (95% of the cases in winterand 100% in summer). The absence of assimilated dataimmediately downstream of the Massif Central can explainpart of the strong departure of the ECA&D data from theobservations. Indeed, this region is very peculiar in thepresence of northerly wind, which produces strong, dry andcool orographic channeled flow such as the tramontane andmistral. In these situations, which occur on average 10 daysper month, station FR-1 is in the wake of the Massif Central,which creates a sheltered zone preventing the cold air fromreaching the area (see, e.g., Drobinski et al 2005).
Regarding the CDFs of the ECA&D rainfall at allstations, there is an overall excellent agreement with thelocal measurements for 25th and 50th quantiles, whateverthe season (except in summer for IS-2, where no rainfallis observed by either HyMeX or ECA&D). Regarding the
5

Environ. Res. Lett. 7 (2012) 024017 E Flaounas et al
larger rainfall amount (75th and 95th quantiles), they arealways underestimated by the ECA&D dataset in winter(except for station FR-12 for the 75th quantile) and in slightlybetter agreement with the observations in summer. As fortemperature, station FR-1 shows by far the worst agreementwith the local measurements. In particular, in winter a 10 mmbias is found for the 75th rainfall quantile and a 40 mm bias forthe 95th rainfall quantile. Figures 3(c) and (d) show that the50th quantile of the rainfall bias is almost zero for all stations,while the interquartile range is lower than 5 mm in winterfor stations FR-2, FR-4, FR-5, FR-8, FR-9 and FR-12 and insummer for stations FR-4, FR-5, FR-6, FR-9 and FR-12. Forall other stations it remains within a reasonable range (below10 mm). It is noteworthy that the winter bias for IS-2 is similarin structure to the semi-arid station IS-1, but nevertheless thebias has a wider range, from −25 to 20 mm.
3.3. Low elevation stations
The stations of low altitude, i.e. below 1000 m, are alllocated in Italy (table 1). Figures 2(a) and (b) show thatwhatever the season the temperature from the ECA&D datasetis underestimated with respect to the HyMeX observations atall stations. In winter, the minimum shift is 2 ◦C at stationIT-7 and the maximum is 8 ◦C at station IT-9, with an averageof 5 ◦C. In summer, the temperature underestimation in theECA&D dataset is even larger, with an average shift of 6 ◦C.The CDFs of the temperature bias (figures 2(c) and (d))show evidence of the visible bias in figures 2(a) and (b).However, in contrast to the temperature CDFs, the CDFs ofthe temperature bias totally differ in summer and in winter. Insummer, the interquartile range is very small (about 2 ◦C), andeven accounting for the cold and hot extremes the distributionremains very narrow (figure 2(d)). This suggests a very goodmatch between the temperature time series of the ECA&Ddataset and that measured at the HyMeX weather stations.Conversely, in winter, the boxplots of the temperature biasare very large. The interquartile range is about 5 ◦C and thedifference between the 95th and fifth quantiles is equal to 8 ◦Cfor stations IT-3 and IT-6 and equal to 10 ◦C for stations IT-7,IT-9 and IT-10. Despite the good similarity of the temperaturedistribution in winter (figure 2(a)), the day-to-day comparisonbetween the ECA&D and measured temperatures is not asgood as in summer (figures 2(c) and (d)).
Regarding rainfall, the ECA&D product is also ofbetter quality in summer than in winter, with a perfectagreement of the ECA&D and observed CDFs up to the 75thrainfall quantile (figure 3(b)). The 95th rainfall quantile isunderestimated by about 5 mm at stations IT-3, IT-6 andIT-7 and overestimated by about 5 mm at station IT-9. Atstation IT-10, the ECA&D and observed CDFs are nearlythe same. Generally in this region, the stronger and morefrequent precipitations occur in summer, and hence it is inthis season that the CDFs of the ECA&D rainfall and theHyMeX station rainfall differ more significantly. In contrastto the temperature, the boxplots of the rainfall bias are slightlylarger in summer than in winter, but whatever the season theinterquartile range never exceeds 8 mm, suggesting a fairly
good match between the rainfall time series of the ECA&Ddataset and that measured at the HyMeX weather stations.
Even at relatively low altitude, the proximity of the Alpsinduces a complex environment in which rainfall is veryspatially variable in terms of occurrence and intensity. Thestation location is crucial in this region, where topography isvery complex and forces precipitation (Frei and Schar 1998).It is by the assimilation of a dense observation network thatone may obtain accurate results; however, figure 1 shows arather scarce network. Table 1 shows that the data of stationIT-6 are assimilated in this area. However, the comparisonbetween the closest ECA&D grid and the station locationproduces rather disappointing results, as seen in figures 3(a)and (b). This was not the case for the semi-arid station IS-1,where the regional topography is smoother. The insufficientnumber of assimilated weather stations in such a complex areainduces at all stations an overestimation of the number of rainydays, which generally correspond to a small rainfall amount.For instance, at station IT-7 there is an excess of 113 rainydays (334 days instead of 221) in the ECA&D dataset, whichcorresponds to an overestimation of the lower quantiles (fifthand 25th quantiles) but does not affect the median and the 75thquantile. In contrast, there is an underestimation of the rainfallextremes, probably due to a too strong smoothing effect of theassimilation or interpolation of a too sparse network.
3.4. High elevation stations
For the Italian stations in the Alps (IT-1, IT-2, IT-4, IT-5and IT-8), temperatures are clearly lower with respect tothe stations at low elevation. Hence, winter and summermedian temperatures are approximately −5 ◦C and 10 ◦C,respectively. The CDFs of the temperature from the ECA&Ddataset and the HyMeX observations are in better agreementat high than at low elevation. This is even more evidentduring summer. For instance, at stations IT-1, IT-5 andIT-8, the 50th quantile of the summer ECA&D temperatureoverestimates the 50th quantile of HyMeX observations byat most 2.5 ◦C. This must be compared to the Italian lowelevation stations, where ECA&D underestimation reaches atleast 5 ◦C. Regarding the interquartile range, the shapes of theboxplots are very similar to those of the low elevation stations,while conversely they are much closer to the 0 ◦C temperaturebias (figures 2(c) and (d)). Accordingly, for both seasons theFR-3 station displays similar CDF with respect to the otherFrench coastal stations but with a median value of about 0 ◦Cin winter and 15 ◦C in summer, due to the higher elevation(figures 2(a) and (b)).
Regarding rainfall, the CDFs of ECA&D and HyMeXdata behave very similarly to those at the Italian low elevationstations. In general, the CDFs of ECA&D and HyMeX rainfallare very similar in summer (figure 3(b)), whereas they differsignificantly during winter (figure 3(a)). Special attentionmust be given to station FR-3, which is very close to stationFR-1, identified as a coastal station (table 1). ECA&D datasetrepresents FR-1 and FR-3 rainfall with approximately thesame CDFs for both seasons. However, the measurementsdisplay very different rainfall CDFs, notably for the 75th
6

Environ. Res. Lett. 7 (2012) 024017 E Flaounas et al
quantile and extremes (95th quantiles). This is due to the factthat the two stations are very close and associated with thesame ECA&D grid points, which are not influenced by anynearby assimilated station as shown in figure 1.
4. Conclusion
The ECA&D data in complex environments such as coastalareas and mountainous regions have to be addressed withmuch care. For instance, in Northern Italy, temperature andrainfall biases of ECA&D can take significantly large valuesand day-to-day comparison of temperature and rainfall candisplay large departures. In particular, for rainfall, it has beenshown that the ECA&D and the HyMeX observations do nothave the same rainy days and the amplitude of extreme rainfallis generally significantly smaller than observed at HyMeXstations. However, such differences should be expectedbetween the very local HyMeX observations and the griddeddataset, which are different datasets in nature. One cannotexpect extreme rainfall to be equally represented by a verylocal station and a gridded 25 km × 25 km average, even ifdata assimilation or interpolation is ‘perfect’. In this letter wecompare the rainfall and temperature statistical characteristicsbetween the gridded dataset of ECA&D and local stations toquantify the differences between the ECA&D gridded dataand the closest local weather station data and estimate theassociated uncertainties.
In the context of the MED-CORDEX and HyMeX,simulations have been performed over 1989–2008 and othersimulations will be conducted in the near future over theHyMeX long observation period (2010–20). Furthermore,downscaling of the global simulations of the recent pastand future climates will be conducted in the frame ofthe Fifth Climate Model Intercomparison Project (CMIP5).These simulations will be directly compared to griddeddatasets, and more specifically to the ECA&D dataset for theEuro-Mediterranean region. Especially for SD, the ECA&Dwill also serve to calibrate statistical models. A properinterpretation of downscaling results has to take into accountnot only all sources of model uncertainties but also theuncertainties associated with the validation, or calibration,dataset.
Acknowledgments
We are grateful to the Israeli meteorological service forproviding the Israeli station measurements, as also tothe Ev-K2-CNR Committee, which provided measurementsfrom the Italian stations collected within the SHAREproject thanks to contributions from the Italian NationalResearch Council and the Italian Ministry of Foreign Affairs.This research has received funding from ANR MEDUPand GIS ‘Climat–Environnement–Societe’ MORCE-MEDprojects and from the HyMeX program through INSUMISTRALS support. We acknowledge the E-OBS datasetfrom the EU-FP6 project ENSEMBLES (http://ensembles-eu.metoffice.com) and the data providers in the ECA&D project(http://eca.knmi.nl)
References
Drobinski P, Bastin S, Guenard V, Caccia J L, Dabas A M,Delville P, Protat A, Reitebuch O and Werner C 2005 Summermistral at the exit of the Rhone valley Q. J. R. Meteorol. Soc.131 353–75
Drobinski P, Ducrocq V and Lionello P 2010 Studying thehydrological cycle in the Mediterranean EOS Trans. Am.Geophys. Union 91 373
Drobinski P, Ducrocq V, Lionello P and Homar V 2011 HyMeX,the newest GEWEX regional hydroclimate project GEWEXNewslett. 21 10–1
Drobinski P, Ducrocq V, Lionello P and the HyMeX ISSC 2009aHyMeX, a potential new CEOP RHP in the Mediterraneanbasin GEWEX Newsl. 19 5–6
Drobinski P et al 2009b The HyMeX (Hydrological cycle in theMediterranean Experiment) program: the specific context ofoceanography MERCATOR Newsl. 32 3–4
Frei C, Christensen J H, Deque M, Jacob D, Jones R G andVidale P L 2003 Daily precipitation statistics in regionalclimate models: evaluation and intercomparison for theEuropean Alps J. Geophys. Res. 108 4124
Frei C and Schar C 1998 A precipitation climatology of the Alpsfrom high-resolution rain-gauge observations Int. J. Climatol.18 873–900
Giorgi F 2006 Climate change hot-spots Geophys. Res. Lett.33 L08707
Giorgi F, Jones C and Asrar G 2009 Addressing climate informationneeds at the regional level: the CORDEX framework WorldMeteorol. Org. (WMO) Bull. 58 175–83
Haylock M and Goodess C 2004 Interannual variability of Europeanextreme winter rainfall and links with mean large-scalecirculation Int. J. Climatol. 24 759–76
Haylock M R, Hofstra N, Klein Tank A M G, Klok E J,Jones P D and New M 2008 A European daily high-resolutiongridded data set of surface temperature and precipitation for1950–2006 J. Geophys. Res. 113 D20119
Hertig E and Jacobeit J 2008 Downscaling future climate change:temperature scenarios for the Mediterranean area Glob. Planet.Change 63 127–31
Hofstra N, New M and McSweeney C 2009 The influence ofinterpolation and station network density on the distributionsand trends of climate variables in gridded daily data Clim. Dyn.35 841–58
Jacob D et al 2007 An inter-comparison of regional climate modelsfor Europe: model performance in present-day climate Clim.Change 81 31–52 (Suppl. 1)
Kjellstrom E, Boberg F, Castro M, Christensen J H, Nikulin G andSanchez E 2010 Daily and monthly temperature andprecipitation statistics as performance indicators for regionalclimate models Clim. Res. 44 135–50
Klein Tank A M G et al 2002 Daily dataset of 20th-century surfaceair temperature and precipitation series for the EuropeanClimate Assessment Int. J. Climatol. 22 1441–53
Lavaysse C, Vrac M, Drobinski P, Lengaigne M and Vischel T 2011Statistical downscaling of the French Mediterranean climate:assessment for present and projection in an anthropogenicscenario Nat. Hazards Earth Syst. Sci. 12 651–70
Maraun D et al 2010 Precipitation downscaling under climatechange. Recent developments to bridge the gap betweendynamical models and the end user Rev. Geophys. 48 RG3003
Mitchell T D and Jones P D 2005 An improved method ofconstructing a database of monthly climate observations andassociated high-resolution grids Int. J. Climatol. 25 693–712
Morin E 2011 To know what we cannot know: global mapping ofminimal detectable absolute trends in annual precipitationWater Resour. Res. 47 W07505
7
Environ. Res. Lett. 7 (2012) 024017 E Flaounas et al
Omrani H, Drobinski P and Dubos T 2012a Investigation ofindiscriminate nudging and predictability in a nestedquasi-geostrophic model Q. J. R. Metetorol. Soc. 138 158–69
Omrani H, Drobinski P and Dubos T 2012b Spectral nudging inregional climate modelling: how strongly should we nudge?Q. J. R. Metetorol. Soc. at press (doi:10.1002/qj.1894)
Quadrelli R, Pavan V and Molteni F 2001 Wintertime variability ofMediterranean precipitation and its links with large-scalecirculation anomalies Clim. Dyn. 17 457–66
Quintana Seguı P, Ribes A, Martin E, Habets F and Boe J 2010Comparison of three downscaling methods in simulating theimpact of climate change on the hydrology of Mediterraneanbasins J. Hydrol. 383 111–24
Raisanen J, Hannson U, Ullerstig A, Doscher R, Graham L P,Jones C, Meier H E M, Samuelsson P and Willen U 2004European climate in the late twenty-first century: regionalsimulations with two global models and two forcing scenariosClim. Dyn. 22 13–31
Ruti P et al 2012 MED-CORDEX initiative for MediterraneanClimate studies Bull. Am. Meteorol. Soc. submitted
Salameh T, Drobinski P and Dubos T 2010 The effect ofindiscriminate nudging time on large and small scales in
regional climate modeling: Application to the Mediterraneanbasin Q. J. R. Metetorol. Soc. 136 170–82
Salameh T, Drobinski P, Vrac M and Naveau P 2009 Statisticaldownscaling of near-surface wind over complex terrain insouthern France J. Metetorol. Atmos. Phys. 103 253–65
Santos J A, Corte-Real J, Ulbrich U and Palutikof J 2007 Europeanwinter precipitation extremes and large-scale circulation: acoupled model and its scenarios Theor. Appl. Climatol.87 85–102
Schmidli J, Goodess C M, Frei C, Haylock M R, Hundecha Y,Ribalaygua J and Schmith T 2007 Statistical and dynamicaldownscaling of precipitation: an evaluation and comparison ofscenarios for the European alps J. Geophys. Res. 112 D04105
Vrac M, Drobinski P, Merlo A, Herrmann M, Lavaysse C, Li L andSomot S 2011 Dynamical and statistical downscaling of theFrench Mediterranean climate: uncertainty assessment Nat.Hazards Earth Syst. Sci. at press
Wilby R L, Dawson C W and Barrow E M 2002 SDSM—a decisionsupport tool for the assessment of regional climate changeimpacts Environ. Modelling Softw. 17 145–57
8