assessment of future change in temperature and precipitation over pakistan (simulated by precis rcm...
Post on 21-Dec-2015
214 views
TRANSCRIPT

Assessment of Future Change in Temperature and Precipitation over Pakistan (Simulated by PRECIS RCM for A2 Scenario)
Siraj Ul Islam, Nadia Rehman

Motivation and Objectives
Introduction to Downscaling and PRECIS System
Experiment Design
Data and methods
Results
1. Validation
2. Future Change
Conclusion
Future work
Out Lines
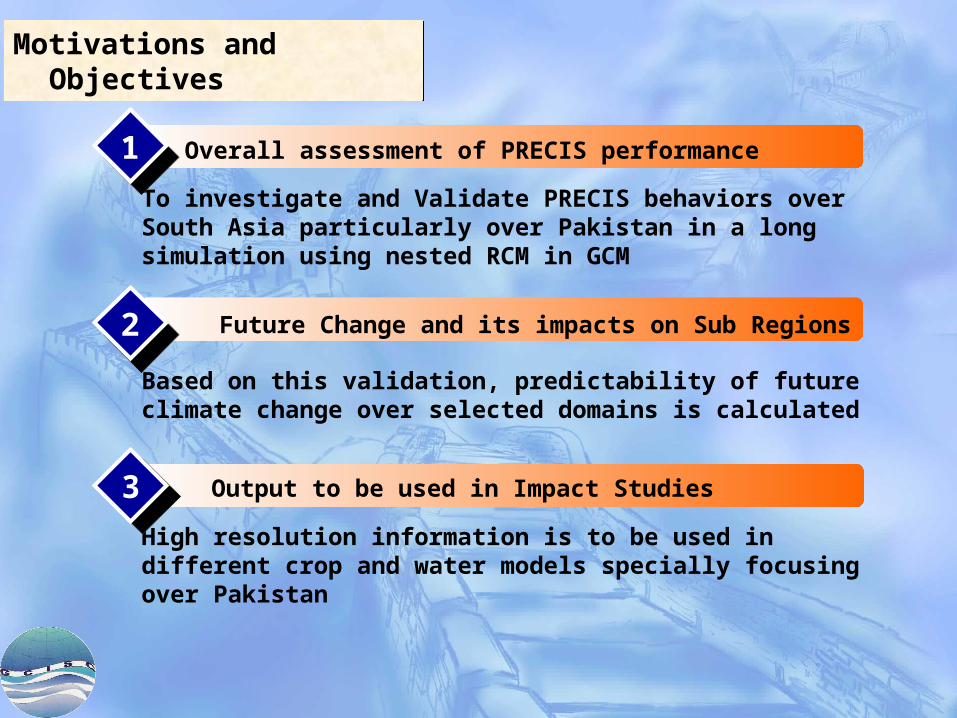
To investigate and Validate PRECIS behaviors over South Asia particularly over Pakistan in a long simulation using nested RCM in GCM
Based on this validation, predictability of future climate change over selected domains is calculated
High resolution information is to be used in different crop and water models specially focusing over Pakistan
Motivations and Objectives
Motivations and Objectives
Overall assessment of PRECIS performance
Future Change and its impacts on Sub Regions
11
22
Output to be used in Impact Studies33

Introduction to Dynamical Downscaling
RCM Model
(Resolution ~ 50 Km)
GCM
Resolution ~ 500km
Downscaling
Adding Local Details
Lateral Boundary
Initial Conditions
Other Forcing
A Regional Climate Model is a tool to add small-scale detailed information of future climate change to the large-scale projections of a GCM. It is a comprehensive physical model, usually of the atmosphere and land surface, containing representations of the important processes in the climate system (e.g. clouds, radiation, rainfall, soil hydrology) as are found in a GCM.
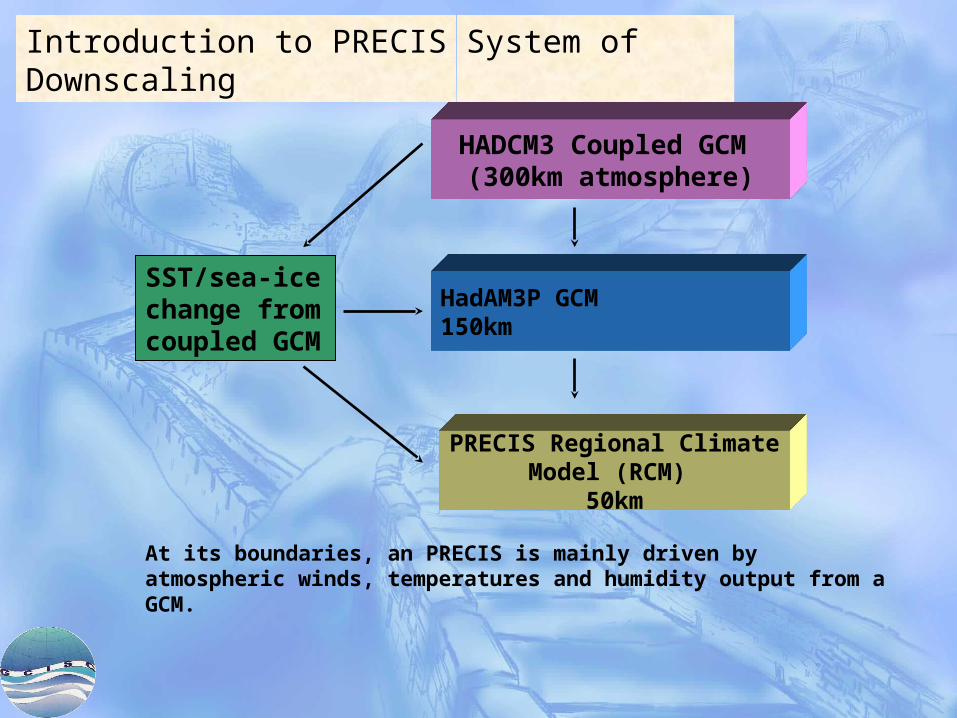
HadAM3P GCM150km
PRECIS Regional Climate Model (RCM)
50km
HADCM3 Coupled GCM (300km atmosphere)
SST/sea-ice change from coupled GCM
At its boundaries, an PRECIS is mainly driven by atmospheric winds, temperatures and humidity output from a GCM.
Introduction to PRECIS System of Downscaling
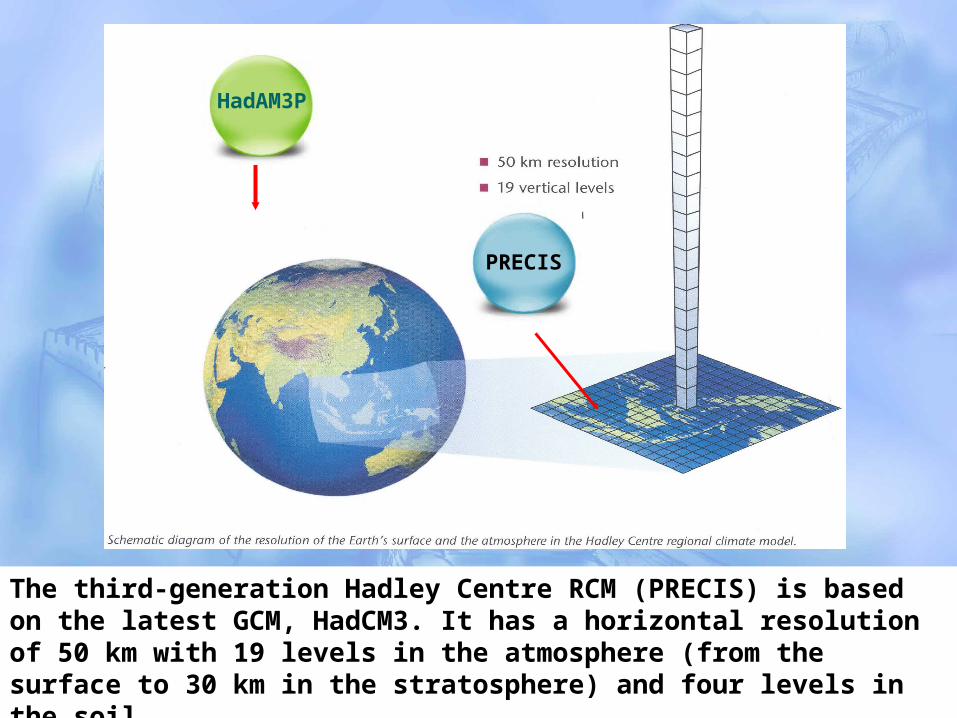
HadAM3P
PRECIS
The third-generation Hadley Centre RCM (PRECIS) is based on the latest GCM, HadCM3. It has a horizontal resolution of 50 km with 19 levels in the atmosphere (from the surface to 30 km in the stratosphere) and four levels in the soil.

Surface and lateral boundary conditions
1. Surface boundary conditions are only required over water, where the model needs time series of
surface temperatures and ice extents.
2. Lateral boundary conditions provide dynamical atmospheric information at the latitudinal and longitudinal edges of the model domain. There is no prescribed constraint at the upper boundary of the model. The lateral boundary conditions comprise the standard atmospheric variables of surface
pressure, horizontal wind components and measures of atmospheric temperature and humidity.
3. These lateral boundary conditions are updated every 6 hours, surface boundary conditions are updated every day.
Sulphur cycle
1. A certain configuration of the PRECIS RCM contain a full representation of the sulphur cycle then a set of boundary conditions (including sulphur dioxide, sulphate aerosols and associated chemical
species) are also required for this.
The model step forward every five minutes of model time (about four seconds of real time), calculating the new state of the climate system at each step.
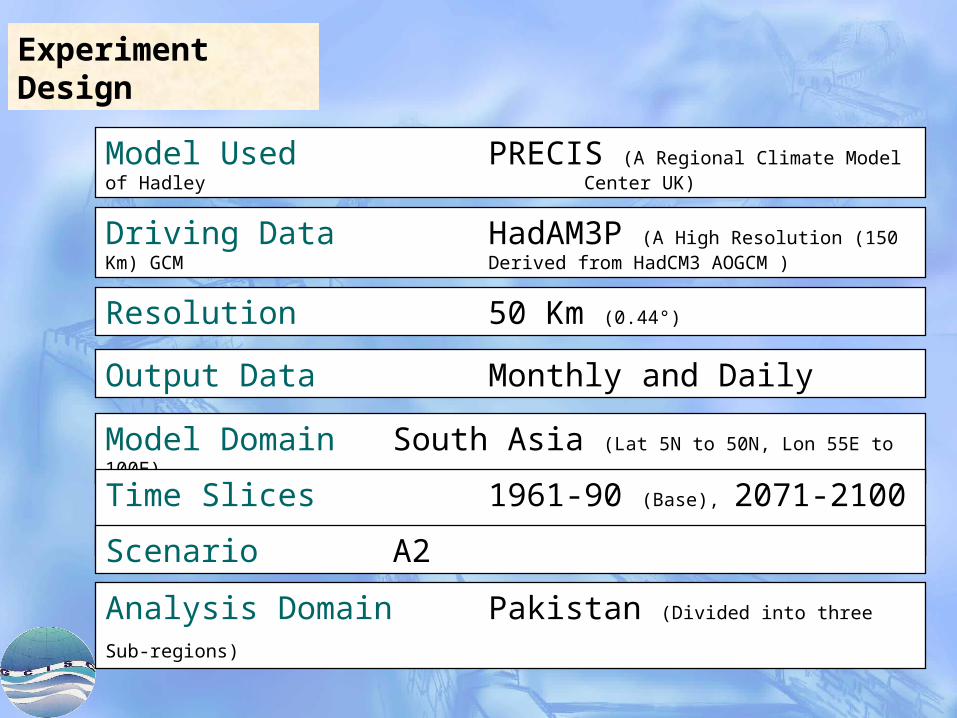
Experiment Design
Model Used PRECIS (A Regional Climate Model of Hadley Center UK)
Driving Data HadAM3P (A High Resolution (150 Km) GCM Derived from HadCM3 AOGCM )
Resolution 50 Km (0.44°)
Model Domain South Asia (Lat 5N to 50N, Lon 55E to 100E)
Time Slices 1961-90 (Base), 2071-2100 (Future)
Scenario A2
Analysis Domain Pakistan (Divided into three Sub-regions)
Output Data Monthly and Daily

A measure of the confidence to be placed on projections of climate change from a particular climate model (global or regional) comes in part from its
ability to simulate recent climate.
Needless to say, no model will give a perfect validation against climatology or observations. It is best to validate two or more climate models (GCM or RCM) as it will then enable a choice to be made of the most appropriate model to be used in
scenario generation for that region.
Validation Results

(a)
(b)
(a) South Asia domain topography showing values of altitude in meters (m).
(b) The standard deviation (S.D) of elevation showing RCM elevations are averaged values for each grid box's area (so peaks will indeed be smoothed out), S.D. is calculated from the original 10 minute resolution global data and then averaged to the grid of the regional model (In meters).
The topography of the domain

Bias over South AsiaBase (1961-1990)

Correlation Maps
Temperature Precipitation
Base (1961-1990)

Model Bias over Pakistan Prec %change=[(base-cru)/cru]*100
Temp Diff =(base-cru)
Base (1961-1990)

RMSE Maps
Temperature Precipitation
Base (1961-1990)

BOX A
BOX B
BOX C

Base (1961-1990)

Scatter Plot of Precipitation (mm/d) BOX-A
y = 0.4047x + 0.2518R2 = 0.8301
0
1
2
3
4
5
6
0 1 2 3 4 5 6
PRECIS
CR
U
Scatter Plot of Temperature (°C) BOX-A
y = 0.7047x + 3.3452R2 = 0.961
-20
-15
-10
-5
0
5
10
15
-20 -15 -10 -5 0 5 10 15
PRECIS
CR
U
Scatter Plot of Precipitation (mm/d) BOX-B
y = 0.5473x + 0.695R2 = 0.6591
0
1
2
3
4
5
6
0 1 2 3 4 5 6
PRECIS
CR
U
Scatter Plot of Temperature (°C) BOX-B
y = 0.7058x + 6.4329R2 = 0.8868
0
5
10
15
20
25
30
35
0 5 10 15 20 25 30 35
PRECIS
CR
U
Scatter Plot of Precipitation (mm/d) BOX-C
y = 0.2826x + 0.2033R2 = 0.7075
0
1
2
3
4
0 1 2 3 4
PRECIS
CR
U
Scatter Plot of Temperature (°C) BOX-C
y = 0.7955x + 4.2002R2 = 0.933
10
15
20
25
30
35
40
10 15 20 25 30 35 40
PRECISC
RU
Base (1961-1990)Annual Cycle profile for scatter plots

BOX A (PREC)
y = 0.2109x + 0.716
R2 = 0.1455
0
2
4
6
8
10
12
0 2 4 6 8 10 12
Model
Obs
erve
d
BOX A (TEMP)
y = 0.6961x + 3.3218
R2 = 0.9336
-25
-20
-15
-10
-5
0
5
10
15
20
25
-25 -15 -5 5 15 25
Model
Obs
erve
d
BOX B (PREC)
y = 0.4843x + 0.7898
R2 = 0.393
0
2
4
6
8
10
0 2 4 6 8 10
ModelO
bser
ved
BOX B (TEMP)
y = 0.6922x + 6.709
R2 = 0.8559
0
10
20
30
40
0 10 20 30 40
Model
Obs
erve
d
BOX C (PREC)
y = 0.2496x + 0.2322
R2 = 0.3168
0
1
2
3
4
5
6
7
0 1 2 3 4 5 6 7
Model
Obs
erve
d
BOX C (TEMP)
y = 0.7771x + 4.6491
R2 = 0.8957
0
10
20
30
40
0 10 20 30 40
Model
Obs
erve
d
Base (1961-1990)Monthly profile of Scatter plot for all three boxes (12 x 30 = 360 months)

PR
EC
IPIT
AT
ION
TE
ME
RA
TU
RE
Monthly profile of Scatter plot for all three boxes (12 x 30 = 360 months)
Base (1961-1990)

Annual Cycle of Precipitation (BOX A)
0
1
2
3
4
5
6
JAN FEB MAR APR MAY JUN JUL AUG SEP OCT NOV DEC
Months
Pre
cip
itat
ion
(m
m/d
)
PRECIS CRU
Annual Cycle of Temperature (BOX A)
-25
-20
-15
-10
-5
0
5
10
15
JAN FEB MAR APR MAY JUN JUL AUG SEP OCT NOV DEC
Months
Tem
per
atu
re (
°C)
PRECIS CRUAnnual Cycle of Precipitation (BOX B)
0
1
2
3
4
5
6
JAN FEB MAR APR MAY JUN JUL AUG SEP OCT NOV DEC
Months
Pre
cip
itat
ion
(m
m/d
)
PRECIS CRU
Annual Cycle of Temperature (BOX B)
0
5
10
15
20
25
30
35
40
JAN FEB MAR APR MAY JUN JUL AUG SEP OCT NOV DEC
Months
Tem
per
atu
re (
°C)
PRECIS CRU
Annual Cycle of Precipitation (BOX C)
0
0.5
1
1.5
2
2.5
3
3.5
4
JAN FEB MAR APR MAY JUN JUL AUG SEP OCT NOV DEC
Months
Pre
cip
itat
ion
(m
m/d
)
PRECIS CRU
Annual Cycle of Temperature (BOX C)
0
5
10
15
20
25
30
35
40
JAN FEB MAR APR MAY JUN JUL AUG SEP OCT NOV DEC
Months
Tem
per
atu
re (
°C)
PRECIS CRU
Bas
e (1
961-
1990
)

Co-efficient of Variation (CV) for Temperature(BOX C)
0
2
4
6
8
10
12
14
JAN FEB MAR APR MAY JUN JUL AUG SEP OCT NOV DEC
Months
CV
(%
)
CRU PRECIS
Co-efficient of Variation (CV) for Precipitation(BOX C)
0
50
100
150
200
250
JAN FEB MAR APR MAY JUN JUL AUG SEP OCT NOV DEC
Months
CV
(%
)
CRU PRECIS
Co-efficient of Variation (CV) for Precipitation(BOX B)
0
20
40
60
80
100
120
140
JAN FEB MAR APR MAY JUN JUL AUG SEP OCT NOV DEC
Months
CV
(%
)
CRU PRECIS
Co-efficient of Variation (CV) for Temperature(BOX B)
0
5
10
15
20
25
JAN FEB MAR APR MAY JUN JUL AUG SEP OCT NOV DEC
Months
CV
(%
)
CRU PRECIS
Co-efficient of Variation (CV) for Precipitation(BOX A)
0
20
40
60
80
100
120
JAN FEB MAR APR MAY JUN JUL AUG SEP OCT NOV DEC
Months
CV
(%
)
CRU PRECIS
Co-efficient of Variation (CV) for Temperature(BOX A)
-150
-100
-50
0
50
100
JAN FEB MAR APR MAY JUN JUL AUG SEP OCT NOV DEC
Months
CV
(%
)
CRU PRECIS
Bas
e (1
961-
1990
)

Annual Cycle of Precipitation (PAK)
0
0.5
1
1.5
2
2.5
3
3.5
4
JAN FEB MAR APR MAY JUN JUL AUG SEP OCT NOV DEC
Months
Pre
cipi
tatio
n (m
m/d
)
PRECIS CRU
Annual Cycle of Temperature (PAK)
0
5
10
15
20
25
30
35
JAN FEB MAR APR MAY JUN JUL AUG SEP OCT NOV DEC
Months
Tem
pera
ture
(°C
)
PRECIS CRU
Co-efficient of Variation (CV) for Temperature(PAK)
0
5
10
15
20
25
JAN FEB MAR APR MAY JUN JUL AUG SEP OCT NOV DEC
Months
CV
(%)
CRU PRECIS
Co-efficient of Variation (CV) for Precipitation(PAK)
0
20
40
60
80
100
120
JAN FEB MAR APR MAY JUN JUL AUG SEP OCT NOV DEC
Months
CV
(%)
CRU PRECIS
Base (1961-1990)

Annual
Summer
Winter
Annual Average Precipitation
0
0.5
1
1.5
2
2.5
BOX - A BOX - B BOX - C PAK
Boxes
Pre
cip
itati
on
(m
m/d
)
CRU PRECISSummer Average Precipitation
0
0.5
1
1.5
2
2.5
3
3.5
4
BOX - A BOX - B BOX - C PAK
Boxes
Pre
cip
itati
on
(m
m/d
)
CRU PRECISWinter Average Precipitation
0
0.5
1
1.5
2
2.5
3
3.5
BOX - A BOX - B BOX - C PAK
Boxes
Pre
cip
itati
on
(m
m/d
)
CRU PRECIS
Annual Average Temperature
-5
0
5
10
15
20
25
30
BOX - A BOX - B BOX - C PAK
Boxes
Tem
pera
ture
(°C
)
CRU PRECISSummer Average Temperature
5
10
15
20
25
30
35
BOX - A BOX - B BOX - C PAK
Boxes
Tem
pera
ture
(°C
)
CRU PRECISWinter Average Temperature
-20
-15
-10
-5
0
5
10
15
20
BOX - A BOX - B BOX - C PAK
Boxes
Tem
pera
ture
(°C
)
CRU PRECIS
Base (1961-1990)

PRECIPITATION
CORR RMSE (mm/d)% diff (mm/d)
(model-cru)/cru *100
BOX A 0.381472 1.95056 96.1434
BOX B 0.62688 1.38729 -0.8917
BOX C 0.562821 1.09698 94.0005
PAK 0.6148 1.0203 49.8928
TEMPERATURE
CORR RMSE (mm/d)Diff (°C)
(model-cru)
BOX A 0.966213 5.74479 -4.1514
BOX B 0.925165 4.26976 -0.4439
BOX C 0.946407 3.10695 0.7832
PAK 0.9502 3.3034 -0.3163
Base (1961-1990)

FUTURE CHANGE

Future Change over South AsiaFuture (2071-2100)

ANNUALPrec %change=[(future-base)/base]*100
Temp Diff =(Future-base)Future (2071-2100)

Future (2071-2100)

Annual Cycle of Precipitation (BOX A)
0
1
2
3
4
5
6
7
JAN FEB MAR APR MAY JUN JUL AUG SEP OCT NOV DEC
Months
Pre
cip
itat
ion
(m
m/d
)
BASE FUTURE
Annual Cycle of Temperature (BOX A)
-25
-20
-15
-10
-5
0
5
10
15
20
JAN FEB MAR APR MAY JUN JUL AUG SEP OCT NOV DEC
Months
Tem
per
atu
re (
°C)
BASE FUTURE
Annual Cycle of Precipitation (BOX B)
0
1
2
3
4
5
6
JAN FEB MAR APR MAY JUN JUL AUG SEP OCT NOV DEC
Months
Pre
cip
itat
ion
(m
m/d
)
BASE FUTURE
Annual Cycle of Temperature (BOX B)
0
5
10
15
20
25
30
35
40
45
JAN FEB MAR APR MAY JUN JUL AUG SEP OCT NOV DEC
Months
Tem
per
atu
re (
°C)
BASE FUTURE
Annual Cycle of Precipitation (BOX C)
0
0.5
1
1.5
2
2.5
3
3.5
4
JAN FEB MAR APR MAY JUN JUL AUG SEP OCT NOV DEC
Months
Pre
cip
itat
ion
(m
m/d
)
BASE FUTURE
Annual Cycle of Temperature (BOX C)
5
10
15
20
25
30
35
40
45
JAN FEB MAR APR MAY JUN JUL AUG SEP OCT NOV DEC
Months
Tem
per
atu
re (
°C)
BASE FUTURE
Fu
ture
(20
71-2
100)

Annual Cycle of Precipitation (PAK)
0
0.5
1
1.5
2
2.5
3
3.5
4
JAN FEB MAR APR MAY JUN JUL AUG SEP OCT NOV DEC
Months
Pre
cip
itat
ion
(m
m/d
)
BASE FUTURE
Annual Cycle of Temperature (PAK)
0
5
10
15
20
25
30
35
40
JAN FEB MAR APR MAY JUN JUL AUG SEP OCT NOV DEC
Months
Tem
per
atu
re (
°C)
BASE FUTURE
Future (2071-2100)

Annual Average Precipitation
0
0.5
1
1.5
2
2.5
3
BOX - A BOX - B BOX - C PAK
Boxes
Pre
cip
itati
on
(m
m/d
)
FUTURE BASESummer Average Precipitation
0
0.5
1
1.5
2
2.5
3
3.5
4
BOX - A BOX - B BOX - C PAK
Boxes
Pre
cip
itati
on
(m
m/d
)
FUTURE BASEWinter Average Precipitation
0
0.5
1
1.5
2
2.5
3
3.5
BOX - A BOX - B BOX - C PAK
Boxes
Pre
cip
itati
on
(m
m/d
)
FUTURE BASE
Annual Average Temperature
-5
0
5
10
15
20
25
30
BOX - A BOX - B BOX - C PAK
Boxes
Tem
pera
ture
(°C
)
FUTURE BASESummer Average Temperature
5
10
15
20
25
30
35
40
BOX - A BOX - B BOX - C PAK
Boxes
Tem
pera
ture
(°C
)
FUTURE BASEWinter Average Temperature
-20
-15
-10
-5
0
5
10
15
20
BOX - A BOX - B BOX - C PAK
Boxes
Tem
pera
ture
(°C
)
FUTURE BASE
Annual
Summer
Winter
Future (2071-2100)

PRECIPITATIONΔP %(mm/d)
Annual Summer (JJAS) Winter (DJFM)
BOX A 11.35 -0.88 20.43
BOX B 0.78 0.97 -7.74
BOX C -0.51 -3.37 -24.53
PAK 3.38 -1.45 9.39
TEMPERATUREΔT(°C)
Annual Summer (JJAS) Winter (DJFM)
BOX A 4.76 4.81 4.97
BOX B 4.98 4.86 5.20
BOX C 4.68 4.56 4.71
PAK 4.77 4.68 4.88
Future (2071-2100)

Work in Progress
Daily data analysis of minimum, maximum and mean temperatures for finding climate indices in future. (Paper to be presented in Young Scientist Conference in November)
Future Work
1. Analysis of more downscaled variables like SLP, Solar Radiation flux etc for impact studies (on Monthly bases only)
2. Compassion of HadAM3P simulation with ERA40 downscaled data set. (instead of CRU)
3. Using these outputs in crop and hydrological models.
4. Comparison of PRECIS with RegCM3 output.