assessment of dissolved-selenium concentrations and … of dissolved-selenium concentrations and...
TRANSCRIPT

U.S. Department of the InteriorU.S. Geological Survey
Scientific Investigations Report 2018–5001
Prepared in cooperation with the Bureau of Reclamation
Assessment of Dissolved-Selenium Concentrations and Loads in the Lower Gunnison River Basin, Colorado, as Part of the Selenium Management Program, from 2011 to 2016

Cover. Map of the lower Gunnison River Basin showing the location of 5 U.S. Geological Survey streamflow-gaging stations and 13 ancillary sites in the LGRB Selenium Management Program. (LGRB, lower Gunnison River Basin; USGS, U.S. Geological Survey.)

Assessment of Dissolved-Selenium Concentrations and Loads in the Lower Gunnison River Basin, Colorado, as Part of the Selenium Management Program, from 2011 to 2016
By Mark F. Henneberg
Prepared in cooperation with the Bureau of Reclamation
Scientific Investigations Report 2018–5001
U.S. Department of the InteriorU.S. Geological Survey

U.S. Department of the InteriorRYAN K. ZINKE, Secretary
U.S. Geological SurveyWilliam H. Werkheiser, Deputy Director exercising the authority of the Director
U.S. Geological Survey, Reston, Virginia: 2018
For more information on the USGS—the Federal source for science about the Earth, its natural and living resources, natural hazards, and the environment—visit https://www.usgs.gov or call 1–888–ASK–USGS.
For an overview of USGS information products, including maps, imagery, and publications, visit https://store.usgs.gov.
Any use of trade, firm, or product names is for descriptive purposes only and does not imply endorsement by the U.S. Government.
Although this information product, for the most part, is in the public domain, it also may contain copyrighted materials as noted in the text. Permission to reproduce copyrighted items must be secured from the copyright owner.
Suggested citation:Henneberg, M.F., 2018, Assessment of dissolved-selenium concentrations and loads in the lower Gunnison River Basin, Colorado, as part of the Selenium Management Program, from 2011 to 2016: U.S. Geological Survey Scientific Investigations Report 2018–5001, 23 p., https://doi.org/10.3133/sir20185001.
ISSN 2328-0328 (online)

iii
ContentsAbstract ...........................................................................................................................................................1Introduction.....................................................................................................................................................1
Purpose and Scope ..............................................................................................................................2Methods...........................................................................................................................................................2
General Approach of the Analysis .....................................................................................................2Flow-Adjusted Trend Analysis ............................................................................................................2Normalized Mean-Daily Streamflow .................................................................................................2Regression Analysis Software ...........................................................................................................4
Assessment of Dissolved-Selenium Concentrations and Loads ...........................................................4Dissolved-Selenium Concentrations .................................................................................................4Dissolved-Selenium Loads ..................................................................................................................4Concentration Percentiles for Dissolved Selenium ........................................................................8
Trend Analysis of Dissolved-Selenium Concentrations and Loads .......................................................8Summary..........................................................................................................................................................8References Cited..........................................................................................................................................12Appendix 1. R-LOADEST Equation Forms, Variable Coefficients,
and Statistical Diagnostics ...........................................................................................................13Appendix 2. Calibration Data For 2015 and 2016 Annual Load
and Trend Regressions ..................................................................................................................15
Figures
1. Map of the lower Gunnison River Basin showing the location of 5U.S. Geological Survey streamflow-gaging stations and 13 ancillary sites in theLGRB Selenium Management Program ....................................................................................3
2. Boxplots of dissolved-selenium concentration, in micrograms per liter,for discrete water-quality samples for water years 2011–2016 ............................................5
3. Boxplots of dissolved-selenium load, in pounds per day, for instantaneouswater-quality samples for water years 2011–2016 ..................................................................7
4. Plot of dissolved-selenium concentration partial residuals and Locally WeightedScatterplot Smoothing (LOWESS) fit line for Whitewater (09152500) for wateryears 1986–2016 ..........................................................................................................................11
5. Plot of dissolved-selenium concentration partial residuals and Locally WeightedScatterplot Smoothing (LOWESS) fit line for Whitewater (09152500) for wateryears 1994–2016 ..........................................................................................................................11
Tables
1. Tasks completed at 18 U.S. Geological Survey sites in the lowerGunnison River Basin ...................................................................................................................4
2. Estimated annual dissolved-selenium load, in pounds per year, calculated usingmultiple linear regression techniques in R-LOADEST (Runkel and others, 2004)at five core sites with U.S. Geological Survey streamflow-gaging stations forwater years 2011–2016 ..................................................................................................................5

iv
3. Median and mean instantaneous dissolved-selenium load, in pounds per day, at 18 sites for water years 2011–2016 ........................................................................................6
4. Changes in median dissolved-selenium loads along the main stem of the Gunnison River based on discrete water-quality samples for water years 2011–2016 ......................7
5. Estimated dissolved-selenium 85th-percentile concentration, in micrograms per liter, from daily dissolved-selenium loads calculated using multiple linear regression techniques in R-LOADEST (Runkel and others, 2004), at five core sites with U.S. Geological Survey streamflow-gaging stations for water years 2011–2016 ............................................................................................................................9
6. Dissolved-selenium 85th-percentile concentrations for 5 core sites with U.S. Geological Survey streamflow-gaging stations and 13 ancillary sites, in micrograms per liter, for discrete water-quality samples collected during water years 2011–2016 .................................................................................................................9
7. Annual dissolved-selenium trend from water year 1986 to water year 2016 at U.S. Geological Survey streamflow-gaging station 09152500, Whitewater ......................10
8. Annual dissolved-selenium trend from water year 1994 to water year 2016 at U.S. Geological Survey streamflow-gaging station 09152500, Whitewater ......................10
1.1. Summary of equation forms used to estimate annual dissolved-selenium load for water year 2015 at five core sites with U.S. Geological Survey streamflow-gaging stations in the lower Gunnison River Basin ........................................13
1.2. Summary of equation forms used to estimate annual dissolved-selenium load for water year 2016 at five core sites with U.S. Geological Survey streamflow-gaging stations in the lower Gunnison River Basin ........................................13
1.3. Regression model coefficients and statistical diagnostics at five core sites with U.S. Geological Survey streamflow-gaging stations in the lower Gunnison River, water year 2015 ..............................................................................................14
1.4. Regression model coefficients and statistical diagnostics at five core sites with U.S. Geological Survey streamflow-gaging stations in the lower Gunnison River Basin, water year 2016 ..................................................................................14
2.1. Calibration data for annual load regression models at selected U.S. Geological Survey streamflow-gaging stations ....................................................................15
2.2. Calibration data for dissolved-selenium trend analysis at U.S. Geological Survey streamflow-gaging station 09152500—Gunnison River near Grand Junction (Whitewater) for water years 1986–2016 ................................................................................18

v
Conversion Factors
U.S. customary units to International System of Units
Multiply By To obtain
Length
foot (ft) 0.3048 meter (m)
Volume
cubic foot (ft3) 0.02832 cubic meter (m3)
Flow rate
cubic foot per second (ft3/s) 0.02832 cubic meter per second (m3/s)
Mass
pound, avoirdupois (lb) 0.4536 kilogram (kg)
International System of Units to U.S. customary units
Multiply By To obtain
Volume
liter (L) 0.2642 gallon (gal)
Mass
gram (g) 0.03527 ounce, avoirdupois (oz)
Concentrations of chemical constituents in water are given in micrograms per liter (µg/L).
Specific conductance is given in microsiemens per centimeter at 25 degrees Celsius (µS/cm at 25 °C).
Water year in this report is defined as the 12-month period from October 1 through September 30 and is designated by the year in which it ends.
Abbreviations EPA U.S. Environmental Protection Agency
LOWESS Locally Weighted Scatterplot Smoothing
NWIS National Water Information System
SMP Selenium Management Program
USGS U.S. Geological Survey
WY water year


Assessment of Dissolved-Selenium Concentrations and Loads in the Lower Gunnison River Basin, Colorado, as Part of the Selenium Management Program, from 2011 to 2016
By Mark F. Henneberg
AbstractThe Gunnison Basin Selenium Management Program
implemented a water-quality monitoring network in 2011 in the lower Gunnison River Basin in Colorado. Selenium is a trace element that bioaccumulates in aquatic food chains and can cause reproductive failure, deformities, and other harmful effects. This report presents the percentile values of selenium because regulatory agencies in Colorado make decisions based on the U.S. Environmental Protection Agency (EPA) Clean Water Act Section 303(d) that uses percentile values of concentration. Also presented are dissolved-selenium loads at 18 sites in the lower Gunnison River Basin for water years (WYs) 2011–2016 (October 1, 2010, through September 30, 2016). Annual dissolved-selenium loads were calculated for five sites with continuous U.S. Geological Survey (USGS) streamflow-gaging stations. Annual dissolved-selenium loads for WY 2011 through WY 2016 ranged from 179 and 391 pounds (lb) at Uncompahgre River at Colona to 11,100 and 17,300 lb at Gunnison River near Grand Junction (herein called Whitewater), respectively.
Instantaneous loads were calculated for five sites with continuous U.S. Geological Survey (USGS) streamflow-gaging stations and 13 ancillary sites where discrete water-quality sampling also took place, using discrete water-quality samples and the associated discharge measurements collected during the period. Median instantaneous loads ranged from 0.01 pound per day (lb/d) at Smith Fork near Lazear to 33.0 lb/d at Whitewater. Mean instantaneous loads ranged from 0.06 lb/d at Smith Fork near Lazear to 36.2 lb/d at Whitewater. Most tributary sites in the basin had a median instantaneous dissolved-selenium load of less than 20.0 lb/day. In general, dissolved-selenium loads at Gunnison River main-stem sites showed an increase from upstream to downstream.
The State of Colorado water-quality standard for dissolved selenium of 4.6 micrograms per liter (µg/L) was compared to the 85th percentiles for dissolved selenium at selected sites. Annual 85th percentiles for dissolved selenium were calculated for the five core sites having USGS streamflow-gaging stations
using estimated dissolved-selenium concentrations from linear regression models. The 85th-percentile concentrations for WYs 2011–2016 based on this method ranged from 0.62 µg/L and 1.1µg/L at Uncompahgre River at Colona to 12.1 µg/L and 18.7 µg/L at Uncompahgre River at Delta.
The 85th percentiles for dissolved selenium also were calculated for sites with sufficient data using water-quality samples collected during WYs 2011–2016. The annual 85th-percentile concentrations based on the discrete samples ranged from 0.16 µg/L and 0.17 µg/L at Gunnison River below Gunnison Tunnel to 62.2 µg/L and 170 µg/L at Loutzenhizer Arroyo at North River Road.
A trend analysis was completed for Whitewater to deter-mine if dissolved-selenium loads are increasing or decreasing. The trend analysis indicates a decrease of 9,100 lb from WY 1986 to WY 2016, a 40.8 percent reduction during the time period. The trend analysis for the annual dissolved-selenium load for WY 1994 to WY 2016 indicates a decrease of 6,300 lb per year, or 33.3 percent.
IntroductionThe Gunnison Basin Selenium Management Program
is a private/public partnership of concerned parties work-ing together to identify and implement solutions to reduce selenium concentration in the Gunnison and Colorado Rivers (Bureau of Reclamation, 2011). Selenium is a trace element that bioaccumulates in aquatic food chains and can cause reproductive failure, deformities, and other harmful effects (Hamilton, 1998; Lemly, 2002). The primary goal of the Selenium Management Program (SMP), as recommended in the U.S. Fish and Wildlife Service’s “Gunnison River Basin Programmatic Biological Opinion” (U.S. Fish and Wildlife Service, 2009), is to meet the State of Colorado water-quality standard for dissolved selenium of 4.6 micrograms per liter (µg/L) at the U.S. Geological Survey (USGS) streamflow-gaging sta-tion number 09152500—Gunnison River near Grand Junction,

2 Assessment of Dissolved-Selenium Concentrations and Loads in the Lower Gunnison River Basin, Colo., from 2011 to 2016
herein referred to as “Whitewater.” A parallel goal is to continue implementation, monitoring, and evaluation of management practices that will maintain or continue to reduce dissolved-selenium concentration in the river. Mayo and Leib (2012) documented a downward trend in dissolved-selenium load from 1986 to 2008 at the Whitewater gage. The SMP’s long-term objective is to improve water quality by reducing dissolved-selenium concentrations sufficiently to assist in the recovery of the Colorado pikeminnow (Ptychocheilus lucius) and razorback sucker (Xyrauchen texanus) (Bureau of Reclamation, 2011).
The SMP implemented a water-quality monitoring network in 2011 at 18 USGS sites (5 with streamflow-gaging stations) in the lower Gunnison River Basin (Bureau of Reclamation, 2011). The USGS had also previously collected water-quality data at several of the 18 sites prior to operation of the SMP network. The USGS, in cooperation with the Bureau of Reclamation, has completed a review of dissolved-selenium data from the 18 sites (fig.1) during water years (WYs) 2011–2016 (October 1, 2010, through September 30, 2016) that included the following four types of analyses, which are further broken down into five tasks (A through E) (table 1).1. Task A. Annual dissolved-selenium loading analyses using
linear regression models within R-LOADEST at five core sites with continuous USGS streamflow-gaging stations.
2. Task B. Instantaneous dissolved-selenium loading analy-ses at 5 core and 13 ancillary sites where discrete water-quality sampling takes place. Instantaneous dissolved-selenium load can be calculated if the dissolved-selenium sample was accompanied by a streamflow measurement.
3. Tasks C and D. Annual (C) and instantaneous (D) 85th-percentile analyses for dissolved selenium at all 18 sites.
4. Task E. Trend analysis of dissolved-selenium concentra-tion and load at Whitewater.
Purpose and Scope
This report presents the percentile values of selenium con-centrations and dissolved-selenium loads at 18 sites in the lower Gunnison River Basin for WYs 2011–2016. Trend analyses of selenium concentration and load also are presented for WY 1986 to WY 2016 and from WY 1994 to WY 2016. The latter trend period is used to focus on recently collected data.
MethodsThis section of the report discusses the technique of flow-
adjusted trend analysis, the methods used for regression analy-sis, and the use of regression analysis software in the study. The concept of normalized streamflow is explained, and the estima-tion of load and concentration trends is shown. Streamflow and water-quality data are available in the USGS National Water Information System (https://doi.org/10.5066/F7P55KJN).
General Approach of the Analysis
Regression analysis is a long-accepted and widely used method for analyzing trends in water-quality constituents (Kircher and others, 1984; Butler, 1996; Richards and Leib, 2011). Variables selected to estimate trends in water-quality constituents in these types of studies commonly include daily streamflow, time, and measured constituent (selenium for this assessment) values. Various transformations are com-monly used to enhance estimation accuracy (logarithmic [log] transformation, quadratic terms, decimal time, centered time, and sinusoidal transformations of time). For this study, daily streamflow, decimal time, and various transformations were used in estimating trends in selenium load and concen-tration (Mayo and Leib, 2012). Calibration datasets included the current and previous water year’s streamflow, specific conductance, and dissolved-selenium concentration for each discrete water-quality sample collected.
Flow-Adjusted Trend Analysis
Trends in loads and concentrations of water-quality constituents can be approached from two perspectives: nonflow-adjusted (which shows the overall influence from both human and natural factors) and flow-adjusted (which removes natural streamflow variability and emphasizes human-caused influences) (Sprague and others, 2006). Only flow-adjusted trend analyses were carried out in this study because the effect of selenium-control efforts over the study period was of primary interest to the cooperator (Mayo and Leib, 2012).
Normalized Mean-Daily Streamflow
Daily streamflow values were averaged to produce a mean-daily streamflow (Qn) for each day of the calendar year over the 31-year period of record. An averaging function available on the USGS National Water Information System (NWIS) website (https://doi.org/10.5066/F7P55KJN) was used to calculate these normalized mean-daily streamflow values. For example, an average of all the January 1 daily streamflow values was calculated for January 1, 1986, through January 1, 2016. This creates a Qn value for January 1 over the 31-year period. By calculating a similar Qn for every day of the year, the year-to-year fluctuations in daily streamflow are removed when computing daily selenium loads. The Qn was only used to compare the changes in selenium load and concentration between WY 1986 and WY 2016. It is important to remember that because the estimated loads and concentrations given for WY 1986 and WY 2016 were based on normalized streamflow, the results were only illustrative of the change in selenium loads and concentra-tions over the period of study. They were not the actual loads and concentrations that occurred in WY 1986 and WY 2016 (Mayo and Leib, 2012).

Methods 3
\\IGSKAHCMVSFX002\Jeff\den18_cmre00_0001_sir_henneberg\report_figures
den18-0001_fig01
18
Delta
Cedaredge
Olathe
Montrose
Ridgway
Delta45
67
8
131415
16
17Cedaredge
Olathe
1
2
3
9
10
11
12
Montrose
Ridgway
107°30'
108°00’108°30'
39°00'
38°30'
38°00'
Loutzenhizer
Arroyo
North Fork
Gunniso
n Rive
r
Smith Fork Creek
Gunnison River
Escalante Cree
k
Roub
idea
u C
reek
CummingsGulch
Dry
Cre
ek
Gunnison River
Uncompahgre River
Cedar Creek
Tong
ue C
reek
EXPLANATION
Irrigated land
Map index number from table 1 for ancillary sites in lower Gunnison River Basin (LGRB) Selenium Management Program water-quality monitoring plan
Map index number from table 1 for core site and USGS streamflow gaging station used in LGRB Selenium Management Program water-quality monitoring plan
9
13
Base modified from U.S. Geological Survey digital data 1:870,000Universe Transverse Mercator projection Zone 13NNorth American Datum of 1983 (NAD83 83)
COLORADO
DENVER
Studyarea
0 20 KILOMETERS5 10 15
0 5 10 15 20 MILES
Figure 1. Map of the lower Gunnison River Basin showing the location of 5 U.S. Geological Survey streamflow-gaging stations and 13 ancillary sites in the LGRB Selenium Management Program. (LGRB, lower Gunnison River Basin; USGS, U.S. Geological Survey).

4 Assessment of Dissolved-Selenium Concentrations and Loads in the Lower Gunnison River Basin, Colo., from 2011 to 2016
Regression Analysis Software
To build the regression model, the software pro-gram R-LOADEST was selected because it is designed to calculate constituent loads using daily streamflow, time, seasonality, and other explanatory variables. R-LOADEST was derived from LOADEST (Runkel and others, 2004). R-LOADEST was used to calculate daily selenium loads and concentrations from measured selenium-concentration calibration data spanning WY 1986 through WY 2016 (Mayo and Leib, 2012).
Assessment of Dissolved-Selenium Concentrations and Loads
Dissolved-Selenium Concentrations
Boxplots of dissolved-selenium concentrations in water-quality samples are plotted from left to right in an upstream to downstream order for WYs 2011–2016 in figure 2. In general, the dissolved-selenium concentra-tion increased from upstream to downstream at Gunnison River main-stem sites (blue boxes in fig. 2; Uncompahgre
River at Delta is designated a Gunnsion River main-stem site to conform with previous selenium studies in the area). Dissolved-selenium concentrations at most sites ranged from 1.0 µg/L to 10.0 µg/L. Gunnison River below Gun-nison Tunnel had the lowest dissolved-selenium concentra-tions (less than 1.0 µg/L) for all samples, and Loutzenhizer Arroyo at North River Road had the highest (greater than 100 µg/L).
Dissolved-Selenium Loads
Annual dissolved-selenium loads in pounds per year (lb/yr) for the five core sites are summarized in table 2. Annual load estimates for WY 2011 through 2016 were lowest at the Uncompahgre River at Colona (179 lb/yr to 391 lb/yr) and highest at Whitewater (11,100 lb/yr to 17,300 lb/yr). Uncompahgre River at Delta and Gunnison River at Delta contributed 66,100 cumulative pounds out of the 78,600 cumulative pounds at Whitewater during the 6-year monitoring period, suggesting the region between Delta and Whitewater contributed approximately 12,500 cumulative pounds. Equation forms, regression model coef-ficients, diagnostics, and calibration datasets are provided in appendixes 1 and 2.
Table 1. Tasks completed at 18 U.S. Geological Survey sites in the lower Gunnison River Basin.
[Tasks are (A) annual dissolved-selenium loading analysis, (B) instantaneous dissolved-selenium loading analysis, (C) annual dissolved-selenium 85th-percentile estimation, (D) instantaneous dissolved-selenium 85th-percentile estimation, and (E) trend analysis of dissolved-selenium concentration and load at Whitewater. USGS, U.S. Geological Survey]
Map index number(fig. 1)
USGS station short name (USGS station number) Site typeAnalysis
types (tasks)
1 Gunnison River below Gunnison Tunnel (09128000) (Sampling terminated after water year 2012) Ancillary B, D2 Smith Fork near Lazear (09129600) Ancillary B, D3 North Fork Gunnison River near Lazear (09136100) Core A, B, C4 Gunnison River at Austin (384624107570701) Ancillary B, D5 Tongue Creek at Cory (09144200) Ancillary B, D6 Gunnison River near Cory (09137500) Ancillary B, D7 Gunnison River near Hartland Dam (384617108022901) Ancillary B, D8 Gunnison River at Delta (09144250) Core A, B, C9 Uncompahgre River at Colona (09147500) Core A, B, C10 Cedar Creek near Mouth (383041107544201) Ancillary B, D11 Loutzenhizer Arroyo at North River Road (383946107595301) Ancillary B, D12 Dry Creek at Mouth near Delta (384202108032001) Ancillary B, D13 Uncompahgre River at Delta (09149500) Core A, B, C14 Cummings Gulch at Mouth (384448108070301) Ancillary B, D15 Roubideau Creek near Mouth (09150500) Ancillary B, D16 Gunnison River above Escalante Creek (384527108152701) Ancillary B, D17 Gunnison River below Dominguez Creek (385011108225401) Ancillary B, D18 Whitewater (09152500) Core A, B, C, E

Assessment of Dissolved-Selenium Concentrations and Loads 5
\\IGSKAHCMVSFX002\Jeff\den18_cmre00_0001_sir_henneberg\report_figures
den18-0001_fig02
n=14
n=31
n=15
n=22
n=27
n=18 n=56
n=8
n=20
n=30
n=24
n=23
n=25
n=16
n=31
n=28
n=14
n=31
0.1
1.0
10
100
Loga
rithm
ic d
isso
lved
-sel
eniu
m c
once
ntra
tion,
in m
icro
gram
s pe
r lite
r
Gunn
ison
Riv
er b
elow
Gun
niso
n Tu
nnel
Whi
tew
ater
Gunn
ison
Riv
er b
elow
Dom
ingu
ez C
reek
Gunn
ison
Riv
er a
bove
Esc
alan
te C
reek
Nor
th F
ork
Gunn
ison
Riv
er n
ear L
azea
r
Roub
idea
u Cr
eek
near
Mou
th
Cum
min
gs G
ulch
at M
outh
Unco
mpa
hgre
Riv
er a
t Del
ta
Dry
Cree
k at
mou
th n
ear D
elta
Lout
zenh
izer A
rroy
o at
Nor
th R
iver
Roa
d
Ceda
r Cre
ek n
ear M
outh
Unco
mpa
hgre
Riv
er a
t Col
ona
Tong
ue C
reek
at C
ory
Gunn
ison
Riv
er n
ear C
ory
Gunn
ison
Riv
er a
t Del
ta
Gunn
ison
Riv
er n
ear H
artla
nd D
am
Gunn
ison
Riv
er a
t Aus
tin
Smith
For
k ne
ar L
azea
r
UncompahgreRiver
n=27
EXPLANATION
Main-stem Gunnison River site, dissolved-selenium concentration water years 2011–2016
Number of values used in boxplot calculation
Interquartilerange
75th percentile
25th percentile
50th percentile(median)
Chronic standard—Dissolved selenium in the State of Colorado (4.6 micrograms per liter)
Outside value—Value is greater than 1.5 times and less than 3 times the interquartile range beyond either end of the box. Blue, main-stem Gunnison River; red, Gunnison River tributary site
Far-out value—Value is greater than or equal to 3 times the interquartile range beyond either end of the box
Gunnison River tributary site, dissolved-selenium concentration water-years 2011–2016
Largest value within 1.5 times interquartile range above 75th percentile
Smallest value within 1.5 times interquartile range below 25th percentile
Figure 2. Boxplots of dissolved-selenium concentration, in micrograms per liter, for discrete water-quality samples for water years 2011–2016.
Table 2. Estimated annual dissolved-selenium load, in pounds per year, calculated using multiple linear regression techniques in R-LOADEST (Runkel and others, 2004) at five core sites with U.S. Geological Survey streamflow-gaging stations for water years 2011–2016.
[USGS, U.S. Geological Survey; WY, water year, defined as the 12-month period from October 1 through September 30 and designated by the year in which it ends; lb, pound; yr, year]
Map index
number
USGS station number
Annual dissolved-selenium load (lbs/yr) Total dissolved-selenium load for WYs 2011–2016
(lb)WY
20111
WY 20121
WY 20131
WY 20141
WY 2015
WY 2016
3 09136100 1,580 1,050 967 1,220 1,250 910 6,9808 09144250 5,880 4,920 4,130 4,540 5,080 4,850 29,4009 09147500 391 194 179 336 348 307 1,76013 09149500 7,920 4,860 4,850 7,190 6,270 5,610 36,70018 09152500 17,300 12,800 11,100 13,300 12,200 11,900 78,600
1Values from Henneberg, 2016.

6 Assessment of Dissolved-Selenium Concentrations and Loads in the Lower Gunnison River Basin, Colo., from 2011 to 2016
Median and mean instantaneous dissolved-selenium loads, in pounds per day (lb/d), for all 18 sites were calculated using discrete water-quality samples and the associated discharge measurements (table 3). Median instantaneous loads ranged from 0.01 lb/d at Smith Fork near Lazear to 33.0 lb/d at Whitewater. Mean instantaneous loads ranged from 0.06 lb/d at Smith Fork near Lazear to 36.2 lb/d at Whitewater. Because there were no dissolved-selenium samples collected since WY 2012 at Gunnison River below Gunnison Tunnel, the calculations for median and mean dissolved-selenium loads include WYs 2011 and 2012 only. Loutzenhizer Arroyo at North River Road, with a median dissolved-selenium load of 10.4 lb/d, contributed 31.5 percent of the median load at Whitewater (33.0 lb/d) during the period WY 2011 through WY 2016. Gunnison River at Delta, with a median dissolved-selenium load of 12.7 lb/d, contributed 38.5 percent during the same period.
Most sites in the basin had a median dissolved-selenium load of less than 20.0 lb/d. In general,
dissolved-selenium loads at main-stem Gunnison River sites increased from upstream to downstream (fig. 3).
Changes in median instantaneous dissolved-selenium load between selected sites along the main-stem Gunni-son River are reported in table 4. The largest increase in dissolved-selenium load occurred between Gunnison River at Delta and Gunnison River above Escalante Creek; the increase is due to the Uncompahgre River, which contrib-utes approximately 16.6 lb/d of dissolved selenium in this reach. A previous study reported a slight decrease (1.8 lb/d) from 2011 to 2014 in dissolved-selenium load between Gunnison River above Escalante Creek and Whitewater (Henneberg, 2016), which was not observed when the WY 2015–2016 samples were included in the dataset. Gunnison River above Escalante Creek had 14 additional samples, and Whitewater had 23, during WYs 2015 and 2016. The dissolved-selenium load increased between these two sites by 1.4 lb/d.
Table 3. Median and mean instantaneous dissolved-selenium load, in pounds per day, at 18 sites for water years 2011–2016.
[USGS, U.S. Geological Survey; WY, water year, defined as the 12-month period from October 1 through September 30 and designated by the year in which it ends; lb/d, pound per day]
Map index number(fig. 1)
USGS station number USGS station short nameSite type
Number of samples WYs
2011–2016
Median selnium load for sample years
(lb/d)
Mean selenium load for sample years
(lb/d)
1 09128000 Gunnison River below Gunnison Tunnel A 81 0.57 1.2
2 09129600 Smith Fork near Lazear A 20 0.01 0.06
3 09136100 North Fork Gunnison River near Lazear C 30 2.7 3.4
4 384624107570701 Gunnison River at Austin A 24 3.9 5.25 09144200 Tongue Creek at Cory A 25 0.56 0.706 09137500 Gunnison River near Cory A 23 8.1 9.4
7 384617108022901 Gunnison River near Hartland Dam A 16 8.6 10.6
8 09144250 Gunnison River at Delta C 31 12.7 14.39 09147500 Uncompahgre River at Colona C 28 0.43 0.7710 383041107544201 Cedar Creek near Mouth A 14 3.5 3.5
11 383946107595301 Loutzenhizer Arroyo at North River Road A 31 10.4 12.2
12 384202108032001 Dry Creek at mouth nr Delta A 14 1.3 1.213 09149500 Uncompahgre River at Delta C 31 16.6 16.814 384448108070301 Cummings Gulch at Mouth A 15 1.0 0.8015 09150500 Roubideau Creek near Mouth A 22 0.48 0.53
16 384527108152701 Gunnison River above Escalante Creek A 27 31.6 34.1
17 385011108225401 Gunnison River below Dominguez Creek A 18 32.1 31.7
18 09152500 Whitewater C 56 33.0 36.21Only includes samples collected in 2011–2012.

Assessment of Dissolved-Selenium Concentrations and Loads 7
\\IGSKAHCMVSFX002\Jeff\den18_cmre00_0001_sir_henneberg\report_figures
den18-0001_fig03
0
20
40
80
60
Gunn
ison
Riv
er b
elow
Gun
niso
n Tu
nnel
Whi
tew
ater
Gunn
ison
Riv
er b
elow
Dom
ingu
ez C
reek
Gunn
ison
Riv
er a
bove
Esc
alan
te C
reek
Nor
th F
ork
Gunn
ison
Riv
er n
ear L
azea
r
Roub
idea
u Cr
eek
near
Mou
th
Cum
min
gs G
ulch
at M
outh
Unco
mpa
hgre
Riv
er a
t Del
ta
Dry
Cree
k at
mou
th n
ear D
elta
Lout
zenh
izer A
rroy
o at
Nor
th R
iver
Roa
d
Ceda
r Cre
ek n
ear M
outh
Unco
mpa
hgre
Riv
er a
t Col
ona
Tong
ue C
reek
at C
ory
Gunn
ison
Riv
er n
ear C
ory
Gunn
ison
Riv
er a
t Del
ta
Gunn
ison
Riv
er n
ear H
artla
nd D
am
Gunn
ison
Riv
er a
t Aus
tin
Smith
For
k ne
ar L
azea
r
Diss
olve
d-se
leni
um lo
ad, i
n po
unds
per
day
n=14
n=31
n=15 n=22
n=27
n=18
n=56
n=8n=20
n=30n=24
n=23
n=25
n=16
n=31
n=28n=14
n=31
UncompahgreRiver
n=27
EXPLANATION
Main-stem Gunnison River site, dissolved- selenium load water years 2011–2016
Number of values used in boxplot calculation
Interquartilerange
75th percentile
25th percentile
50th percentile(median)
Outside value—Value is greater than 1.5 times and less than 3 times the interquartile range beyond either end of the box. Blue, main-stem Gunnison River; red, Gunnison River tributary site
Far-out value—Value is greater than or equal to 3 times the interquartile range beyond either end of the box. Blue, main-stem Gunnison River; red, Gunnison River tributary site
Gunnison River tributary site, dissolved- selenium load water-years 2011–2016
Largest value within 1.5 times interquartile range above 75th percentile
Smallest value within 1.5 times interquartile range below 25th percentile
Figure 3. Boxplots of dissolved-selenium load, in pounds per day, for instantaneous water-quality samples for water years 2011–2016.
Table 4. Changes in median dissolved-selenium loads along the main stem of the Gunnison River based on discrete water-quality samples for water years 2011–2016.
[USGS, U.S. Geological Survey; WY, water year, defined as the 12-month period from October 1 through September 30 and designated by the year in which it ends; lb/d, pound per day]
Map index number(fig. 1)
USGS station number
USGS station short nameNumber of
samples WYs 2011–2016
Median selenium load for 2011–2016
(lb/d)
Change in median dissolved-selenium
load between stations for 2011–2016
(lb/d)
4 384624107570701 Gunnison River at Austin 24 3.9
4.26 09137500 Gunnison River near Cory 23 8.1
0.57 384617108022901 Gunnison River near Hartland Dam 16 8.6
4.18 09144250 Gunnison River at Delta 31 12.7
18.916 384527108152701 Gunnison River above Escalante Creek 27 31.6
1.4
18 09152500 Whitewater 56 33.0

8 Assessment of Dissolved-Selenium Concentrations and Loads in the Lower Gunnison River Basin, Colo., from 2011 to 2016
Concentration Percentiles for Dissolved Selenium
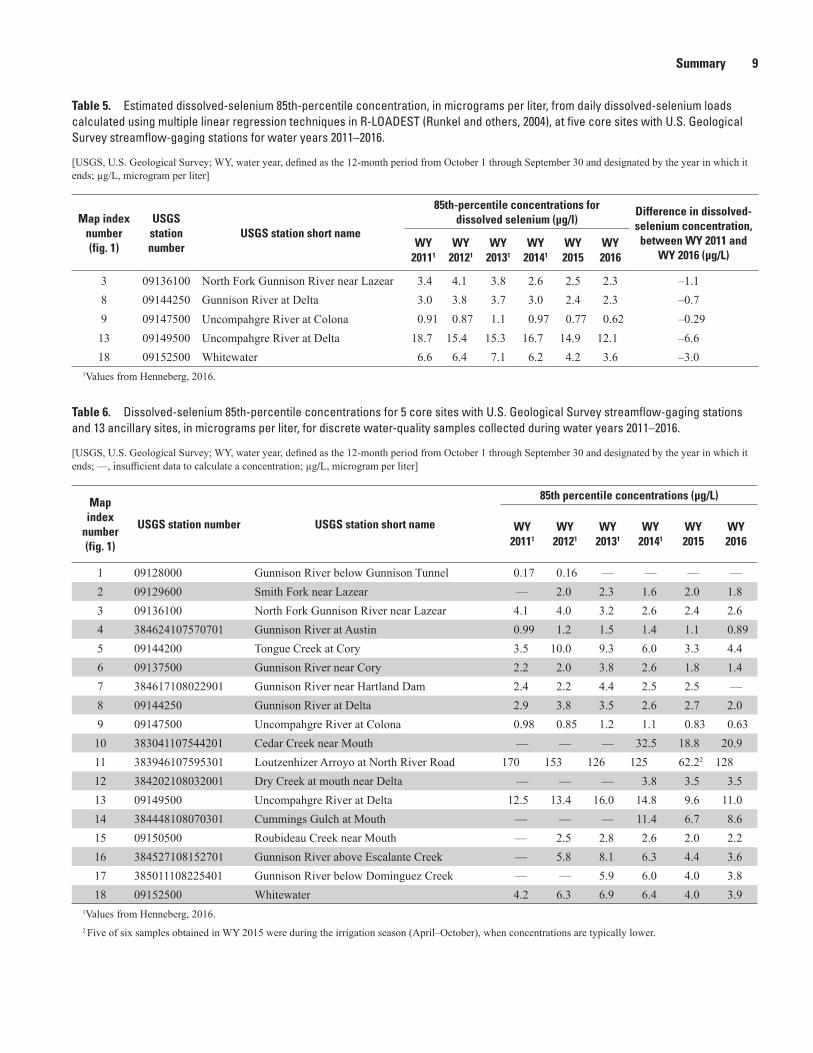
The 85th percentile values of estimated selenium con-centration were calculated for WY 2011 through WY 2016. This report presents the percentile values of selenium because regulatory agencies in Colorado make decisions based on the U.S. Environmental Protection Agency (EPA) Clean Water Act Section 303(d) that uses percentile values of concentra-tion (Mayo and Leib, 2012). The 85th-percentile concentra-tions for dissolved selenium were derived for the 18 sites for WYs 2011–2016 with the exception of Gunnison River below Gunnison Tunnel (09128000), which only had data for WYs 2011–2012. The 85th percentiles presented in table 5 for the five core sites were estimated as part of the R-LOADEST daily load calculations as described by Mayo and Leib (2012). The 85th percentiles for all 18 sites are presented in table 6 and were calculated from the discrete water-quality samples collected in each WY.
The annual 85th-percentile concentrations (table 5) for WYs 2011–2016 based on the R-LOADEST estimated daily loads ranged from 0.62 µg/L to 1.1 µg/L at Uncompahgre River at Colona to 12.1 µg/L to 18.7 µg/L at Uncompahgre River at Delta. The only core sites that exceeded the State of Colorado water-quality standard of 4.6 µg/L during WYs 2011–2016 were Uncompahgre River at Delta and Whitewa-ter; however, Whitewater did not exceed the standard in WY 2015 or WY 2016.
The annual 85th-percentile concentrations based on the discrete samples in table 6 ranged from 0.16 µg/L and 0.17 µg/L at Gunnison River below Gunnison Tunnel to 62.2 µg/L and 170 µg/L at Loutzenhizer Arroyo at North River Road. At Loutzenhizer Arroyo at North River Road, five out of six samples collected in WY 2015 had discharges greater than 50 cubic feet per second (ft3/s) and were collected during the irrigation season (April 1–October 31), when discharges are higher than normal due to irrigation return flows and concen-trations can be lower due to dilution. This explains the low (62.2 µg/L) 85th-percentile concentration value in WY 2015.
The largest 85th-percentile concentrations for WYs 2011–2016 occurred at Loutzenhizer Arroyo at North River Road (table 6). Cedar Creek near Mouth, Loutzenhizer Arroyo at North River Road, Uncompahgre River at Delta, and Cummings Gulch at Mouth were the only sites to exceed the State of Colorado water-quality standard of 4.6 µg/L since WY 2014.
A sample collected on July 19, 2016, at Loutzenhizer Arroyo at North River Road had the lowest dissolved-sele-nium concentration ever measured at that site (14.0 µg/L). Low concentrations also were measured at Smith Fork near Lazear, North Fork Gunnison River near Lazear, Tongue Creek at Cory, Uncompahgre River at Colona, Cedar Creek near Mouth, Dry Creek at Mouth, Uncompahgre River at Delta, Cummings Gulch at Mouth, Roubideau Creek near Mouth, and Whitewater in WY 2015 and (or) WY 2016.
Trend Analysis of Dissolved-Selenium Concentrations and Loads
Using methods described in Mayo and Leib (2012), a trend analysis of dissolved-selenium concentrations and loads was completed using water-quality data collected at White-water. The calibration dataset contained all available discrete water-quality samples from WY 1986 to WY 2016. This pro-cess ensured that all data used by Mayo and Leib (2012) were included in the dataset used for model development through WY 2016. A second period from WY 1994 to WY 2016 is included and used the same methods as Mayo and Leib (2012) to provide emphasis on the more recently collected data.
A continuing downward trend in annual dissolved-selenium load was observed at Whitewater, as indicated in tables 7 and 8. The dissolved-selenium loads decreased from 22,300 pounds (lb) in WY 1986 to 13,200 lb in WY 2016, a decrease of 9,100 lb (table 7). This decrease represents a 40.8 percent reduction during the time period, and an addi-tional 12.3 percent reduction from the 28.6 percent reduction reported through WY 2008 in Mayo and Leib (2012). As shown in table 7, the dissolved-selenium load 95-percent confidence levels for WY 1986 were 19,900 lb (lower) and 24,800 lb (upper); for WY 2016, the dissolved-selenium load 95-percent confidence levels were 12,200 lb (lower) and 14,200 lb (upper). For WY 1994 to WY 2016 (table 8), the annual dissolved-selenium load decreased from 18,900 lb in 1994 to 12,600 lb in 2016, a decrease of 6,300 lb, or 33.3 percent.
The time component was removed from the R-LOADEST regression model to graphically demonstrate the trend in dissolved-selenium concentration so that concentrations were only adjusted for flow (Mayo and Leib, 2012). The calibra-tion dataset was then used to predict dissolved-selenium concentrations for each water sample and a residual was computed by subtracting the predicted concentrations from the measured concentration. The resulting residuals are plot-ted by year with a Locally Weighted Scatterplot Smoothing (LOWESS) fit line in figure 4 for WYs 1986–2016 and in figure 5 for WYs 1994–2016. Both figures 4 and 5 confirm a continuing decrease in dissolved selenium concentration during the trend periods.
SummaryThe Gunnison Basin Selenium Management Program
implemented a water-quality monitoring network in 2011 in the lower Gunnison River Basin in Colorado. Selenium is a trace element that bioaccumulates in aquatic food chains and can cause reproductive failure, deformities, and other harmful effects. This report presents the percentile values of selenium because regulatory agencies in Colorado make decisions based on the U.S. Environmental Protection Agency (EPA)
Summary 9
Table 5. Estimated dissolved-selenium 85th-percentile concentration, in micrograms per liter, from daily dissolved-selenium loads calculated using multiple linear regression techniques in R-LOADEST (Runkel and others, 2004), at five core sites with U.S. Geological Survey streamflow-gaging stations for water years 2011–2016.
[USGS, U.S. Geological Survey; WY, water year, defined as the 12-month period from October 1 through September 30 and designated by the year in which it ends; µg/L, microgram per liter]
Map index number(fig. 1)
USGS station number
USGS station short name
85th-percentile concentrations fordissolved selenium (µg/l)
Difference in dissolved-selenium concentration,
between WY 2011 and WY 2016 (µg/L)
WY 20111
WY 20121
WY 20131
WY 20141
WY 2015
WY 2016
3 09136100 North Fork Gunnison River near Lazear 3.4 4.1 3.8 2.6 2.5 2.3 –1.18 09144250 Gunnison River at Delta 3.0 3.8 3.7 3.0 2.4 2.3 –0.79 09147500 Uncompahgre River at Colona 0.91 0.87 1.1 0.97 0.77 0.62 –0.2913 09149500 Uncompahgre River at Delta 18.7 15.4 15.3 16.7 14.9 12.1 –6.618 09152500 Whitewater 6.6 6.4 7.1 6.2 4.2 3.6 –3.0
1Values from Henneberg, 2016.
Table 6. Dissolved-selenium 85th-percentile concentrations for 5 core sites with U.S. Geological Survey streamflow-gaging stations and 13 ancillary sites, in micrograms per liter, for discrete water-quality samples collected during water years 2011–2016.
[USGS, U.S. Geological Survey; WY, water year, defined as the 12-month period from October 1 through September 30 and designated by the year in which it ends; —, insufficient data to calculate a concentration; µg/L, microgram per liter]
Map index
number(fig. 1)
USGS station number USGS station short name
85th percentile concentrations (µg/L)
WY 20111
WY 20121
WY 20131
WY 20141
WY 2015
WY 2016
1 09128000 Gunnison River below Gunnison Tunnel 0.17 0.16 — — — —2 09129600 Smith Fork near Lazear — 2.0 2.3 1.6 2.0 1.83 09136100 North Fork Gunnison River near Lazear 4.1 4.0 3.2 2.6 2.4 2.64 384624107570701 Gunnison River at Austin 0.99 1.2 1.5 1.4 1.1 0.895 09144200 Tongue Creek at Cory 3.5 10.0 9.3 6.0 3.3 4.46 09137500 Gunnison River near Cory 2.2 2.0 3.8 2.6 1.8 1.47 384617108022901 Gunnison River near Hartland Dam 2.4 2.2 4.4 2.5 2.5 —8 09144250 Gunnison River at Delta 2.9 3.8 3.5 2.6 2.7 2.09 09147500 Uncompahgre River at Colona 0.98 0.85 1.2 1.1 0.83 0.6310 383041107544201 Cedar Creek near Mouth — — — 32.5 18.8 20.911 383946107595301 Loutzenhizer Arroyo at North River Road 170 153 126 125 62.22 12812 384202108032001 Dry Creek at mouth near Delta — — — 3.8 3.5 3.513 09149500 Uncompahgre River at Delta 12.5 13.4 16.0 14.8 9.6 11.014 384448108070301 Cummings Gulch at Mouth — — — 11.4 6.7 8.615 09150500 Roubideau Creek near Mouth — 2.5 2.8 2.6 2.0 2.216 384527108152701 Gunnison River above Escalante Creek — 5.8 8.1 6.3 4.4 3.617 385011108225401 Gunnison River below Dominguez Creek — — 5.9 6.0 4.0 3.818 09152500 Whitewater 4.2 6.3 6.9 6.4 4.0 3.9
1Values from Henneberg, 2016.2 Five of six samples obtained in WY 2015 were during the irrigation season (April–October), when concentrations are typically lower.

10 Assessment of Dissolved-Selenium Concentrations and Loads in the Lower Gunnison River Basin, Colo., from 2011 to 2016
Clean Water Act Section 303(d) that uses percentile values of concentration. Also presented are dissolved-selenium loads at 18 sites in the lower Gunnison River Basin for water years (WYs) 2011–2016 (October 1, 2010, through September 30, 2016). Annual dissolved-selenium loads were calculated for five sites with continuous U.S. Geological Survey (USGS) streamflow-gaging stations. Annual dissolved-selenium loads for WY 2011 through WY 2016 ranged from 179 and 391 pounds (lb) at Uncompahgre River at Colona to 11,100 and 17,300 lb at Gunnison River near Grand Junction, respectively.
Instantaneous loads were calculated for 5 sites with con-tinuous U.S. Geological Survey (USGS) streamflow-gaging stations and 13 ancillary sites where discrete water-quality sampling also took place, using discrete water-quality samples and the associated discharge measurements collected dur-ing the period. Median instantaneous loads ranged from 0.01 pound per day (lb/d) at Smith Fork near Lazear to 33.0 lb/d at Whitewater. Mean instantaneous loads ranged from 0.06 lb/d at Smith Fork near Lazear to 36.2 lb/d at Whitewater. Most tributary sites in the basin had a median instantaneous dissolved-selenium load of less than 20.0 lb/d. In general, dissolved-selenium loads at Gunnison River main-stem sites showed an increase from upstream to downstream.
The State of Colorado water-quality standard for dissolved selenium of 4.6 micrograms per liter (µg/L) was compared to the 85th percentiles for dissolved selenium at selected sites. Annual 85th percentiles for dissolved selenium were calcu-lated for the five core sites having USGS streamflow-gaging stations using estimated dissolved-selenium concentrations from linear regression models. The 85th-percentile concentra-tions for WYs 2011–2016 based on this method ranged from 0.62 µg/L and 1.1 µg/L at Uncompahgre River at Colona to 12.1 µg/L and 18.7 µg/L at Uncompahgre River at Delta.
The 85th percentiles for dissolved selenium also were calculated for sites with sufficient data using water-quality samples collected during WYs 2011–2016. The annual 85th-percentile concentrations based on the discrete samples ranged from 0.16 µg/L and 0.17 µg/L at Gunnison River below Gunnison Tunnel to 62.2 µg/L and 170 µg/L at Loutzenhizer Arroyo at North River Road.
A trend analysis was completed for Whitewater to deter-mine if dissolved-selenium loads are increasing or decreas-ing. The trend analysis indicates a decrease of 9,100 lb from WY 1986 to WY 2016, a 40.8 percent reduction during the time period. The trend analysis for the annual dissolved-selenium load for WY 1994 to WY 2016 indicates a decrease of 6,300 lb per year, or 33.3 percent.
Table 7. Annual dissolved-selenium trend from water year 1986 to water year 2016 at U.S. Geological Survey streamflow-gaging station 09152500, Whitewater.
[Water year defined as the 12-month period from October 1 through September 30 and designated by the year in which it ends. %, percent; —, not applicable; ft3/s, cubic foot per second; lb, pound; µg/L, microgram per liter]
Water year(WY)
Average of the mean daily streamflow
for 1986–2016(ft3/s)
Estimated dissolved-selenium
annual load(lb)
Lower 95%- con-fidence level for estimated annual
dissolved-selenium load(lb)
Upper 95%- con- fidence level for estimated annual
dissolved- selenium load(lb)
Estimated an-nual dissolved-selenium load
reduction(%)
50th percentile of estimated
daily dissolved-selenium
concentration(µg/L)
85th percentile of estimated
daily dissolved-selenium
concentration(µg/L)
1986 2,320 22,300 19,900 24,800 — 6.4 7.12016 2,320 13,200 12,200 14,200 40.9 3.8 4.2
Difference — –9,100 — — — –2.6 –2.9
Table 8. Annual dissolved-selenium trend from water year 1994 to water year 2016 at U.S. Geological Survey streamflow-gaging station 09152500, Whitewater.
[Water year defined as the 12-month period from October 1 through September 30 and designated by the year in which it ends. %, percent; —, not applicable; ft3/s, cubic foot per second; lb, pound; µg/L, microgram per liter]
Water year(WY)
Average of the mean daily
streamflow for 1994 to 2016
(ft3/s)
Estimated dissolved-selenium
annual load (lb)
Lower 95%- con-fidence level for estimated annual dissolved-seleni-
um load(lb)
Upper 95%- con-fidence level for estimated annual dissolved-seleni-
um load(lb)
Estimated an-nual dissolved-selenium load
reduction(%)
50th percentile of estimated
daily dissolved-selenium
concentration(µg/L)
85th percentile of estimated
daily dissolved-selenium
concentration(µg/L)
1994 2,280 18,900 17,200 20,800 — 5.5 6.12016 2,280 12,600 11,600 13,700 33.4 3.8 4.2
Difference — –6,300 — — — –1.7 –1.9

Summary 11
\\IGSKAHCMVSFX002\Jeff\den18_cmre00_0001_sir_henneberg\report_figures
den18-0001_fig04
Diss
olve
d se
leni
um c
once
ntra
tion
parti
al re
sidu
als,
in m
icro
gram
s pe
r lite
r
–5
–1
3
7
1985 2020
Calendar Years
201520102005200019951990
EXPLANATIONDissolved selenium concentration partial residual
LOcally WEighted Scatterplot Smoothing (LOWESS)—Smooth trend line
\\IGSKAHCMVSFX002\Jeff\den18_cmre00_0001_sir_henneberg\report_figures
den18-0001_fig05
Diss
olve
d se
leni
um c
once
ntra
tion
parti
al re
sidu
als,
in m
icro
gram
s pe
r lite
r
3
–1
–5
7
Calendar Years
1996 1998 2000 2002 2004 2006 2008 2012 2014 201620101994
EXPLANATIONDissolved selenium concentration partial residual
LOcally WEighted Scatterplot Smoothing (LOWESS)—Smooth trend line
Figure 4. Plot of dissolved-selenium concentration partial residuals and Locally Weighted Scatterplot Smoothing (LOWESS) fit line for Whitewater (09152500) for water years 1986–2016.
Figure 5. Plot of dissolved-selenium concentration partial residuals and Locally Weighted Scatterplot Smoothing (LOWESS) fit line for Whitewater (09152500) for water years 1994–2016.

12 Assessment of Dissolved-Selenium Concentrations and Loads in the Lower Gunnison River Basin, Colo., from 2011 to 2016
References Cited
Bureau of Reclamation, 2011, Selenium Management Pro-gram—Program formulation document, Gunnison River Basin, Colorado: U.S. Bureau of Reclamation, Selenium Management Program Workgroup, 80 p., accessed February 12, 2012, at http://www.usbr.gov/uc/wcao/progact/smp/docs.html.
Butler, D.L., 1996, Trend analysis of selected water-quality data associated with salinity control projects in the Grand Valley, in the lower Gunnison Basin, and at Meeker Dome, western Colorado: U.S. Geological Survey Water-Resources Investigations Report 95–4274, 38 p. [Also available at https://pubs.er.usgs.gov/publication/wri954274.]
Cohn, T.A., Delong, L.L., Gilroy, E.J., Hirsh, R.M., and Wells, D.K., 1989, Estimating constituent loads: Water Resources Research, v. 25, no. 5, p. 937–942.
Hamilton, S.J., 1998, Selenium effects on endangered fish in the Colorado River Basin, in Frankenberger, W.T., Jr., and Engberg, R.A., eds., Environmental chemistry of selenium: New York, Marcel Dekker, p. 297–314.
Henneberg, M.F., 2016, 2014 annual summary of the lower Gunnison River Basin Selenium Management Program water-quality monitoring, Colorado: U.S. Geological Survey Open-File Report 2016–1129, 25 p., https://doi.org/10.3133/ofr20161129.
Kircher, J.E., Dinicola, R.S., and Middelburg, R.M., 1984, Trend analysis of salt load and evaluation of the frequency of water-quality measurements for the Gunnison, the Colo-rado, and the Dolores Rivers in Colorado and Utah: U.S. Geological Survey Water-Resources Investigations Report 84–4048, 69 p. [Also available at https://pubs.er.usgs.gov/publication/wri844048.]
Lemly, A.D., 2002, Selenium assessment in aquatic ecosys-tems—A guide for hazard evaluation and water quality criteria: New York, Springer-Verlag, 162 p.
Mayo, J.W., and Leib, K.J., 2012, Flow-adjusted trends in dissolved selenium load and concentration in the Gunnison and Colorado Rivers near Grand Junction, Colorado, water years 1986–2008: U.S. Geological Survey Scientific Investigations Report 2012–5088, 33 p. [Also available at https://pubs.er.usgs.gov/publication/sir20125088.]
Richards, R.J., and Leib, K.J., 2011, Characterization of hydrology and salinity in the Dolores project area, McElmo Creek Region, southwest Colorado, 1978–2006: U.S. Geological Survey Scientific Investigations Report 2010–5218, 38 p. [Also available at https://pubs.er.usgs.gov/publication/sir20105218.]
Runkel, R.L., Crawford, C.G., and Cohn, T.A., 2004, Load estimator (LOADEST)—A FORTRAN program for estimating constituent loads in streams and rivers: U.S. Geological Survey Techniques and Methods, book 4, chap. A5, 69 p. [Also available at https://pubs.usgs.gov/tm/2005/tm4A5/.]
Sprague, L.A., Clark, M.L., Rus, D.L., Zelt, R.B., Flynn, J.L., and Davis, J.V., 2006, Nutrient and suspended-sediment trends in the Missouri River Basin, 1993–2003: U.S. Geological Survey Scientific Investigations Report 2006–5231, 80 p. [Also available at https://pubs.usgs.gov/sir/2006/5231/.]
U.S. Fish and Wildlife Service, 2009, Final Gunnison River Basin programmatic biological opinion: U.S. Fish and Wildlife Service, 123 p., accessed January 4, 2012, at http://www.usbr.gov/uc/wcao/rm/aspeis/pdfs/aspinallpbo_final.pdf.
U.S. Geological Survey, 2016, National Water Information System: U.S. Geological Survey database, accessed May 01, 2017, at https://doi.org/10.5066/F7P55KJN.
Publishing support provided by the Science Publishing Network, Denver Publishing Service Center
For more information concerning the research in this report, contact theCenter Director, USGS Geology, Geophysics, and Geochemistry
Science Center
Box 25046, Mail Stop 973Denver, CO 80225(303) 236-1800
Or visit Geology, Geophysics, and Geochemistry Science Center website at
https://minerals.cr.usgs.gov/This publication is available online athttps://doi.org/10.3133/sir20185001

Appendix 1 13
Appendix 1. R-LOADEST Equation Forms, Variable Coefficients, and Statistical Diagnostics
A summary of the equation forms used to estimate annual dissolved-selenium load at the five core sites in the lower Gunnison River Basin for water year 2015 is presented in table 1.1 and water year 2016 in table 1.2. Tables 1.3 and 1.4 provide regression model coefficients and statistical diagnostics for the five core sites for water years 2015 and 2016, respectively.
Table 1.1. Summary of equation forms used to estimate annual dissolved-selenium load for water year 2015 at five core sites with U.S. Geological Survey streamflow-gaging stations in the lower Gunnison River Basin.
[USGS, U.S. Geological Survey; ln, natural logarithm; load, dissolved-selenium load in pounds per day (lb/d); β0, intercept of the regression on the y-axis; β1–β5, regression coefficients; Q, centered daily streamflow in cubic feet per second (ft3/s); sin(2πdectime), sine function of a Fourier Series; π, approximately 3.141593; dectime, centered decimal time in decimal years; cos(2πdectime), cosine function of a Fourier Series; ε, remaining unexplained variability in the data (error); SC, daily mean specific conductance in microsiemens per centimeter at 25 degrees Celsius (µS/cm at 25 °C)]
USGS station number
Equation form1
09136100 ln(load) = β0 + β1ln(Q) + β2sin(2πdectime) + β3cos(2πdectime) + ε09144250 ln(load) = β0 + β1ln(Q) + β2sin(2πdectime) + β3cos(2πdectime) + ε091475002 ln(load) = β0 + β1ln(Q) + β2SC + ε091475003 ln(load) = β0 + β1ln(Q) + β2sin(2πdectime) + β3cos(2πdectime) + ε09149500 ln(load) = β0 + β1ln(Q) + β2sin(2πdectime) + β3cos(2πdectime) + ε091525002 ln(load) = β0 + β1ln(Q) + β2SC + ε091525003 ln(load) = β0 + β1ln(Q) + β2ln(Q)2 + β3dectime + β4sin(2πdectime) + β5cos(2πdectime) + ε
1Any bias that is introduced by the log transformation needs to be corrected if the results are transformed out of log space (Cohn and others, 1989), but this correction is automatically applied by the statistical software used for the regression analysis (Mayo and Leib, 2012).
2Equation form used when specific conductance data were available.3Equation form used when specific conductance data were absent.
Table 1.2. Summary of equation forms used to estimate annual dissolved-selenium load for water year 2016 at five core sites with U.S. Geological Survey streamflow-gaging stations in the lower Gunnison River Basin.
[USGS, U.S. Geological Survey; ln, natural logarithm; load, dissolved-selenium load in pounds per day (lb/d); β0, intercept of the regression on the y-axis; β1–β5, regression coefficients; Q, centered daily streamflow in cubic feet per second (ft3/s); sin(2πdectime), sine function of a Fourier Series; π, approximately 3.141593; dectime, centered decimal time in decimal years; cos(2πdectime), cosine function of a Fourier Series; ε, remaining unexplained variability in the data (error); SC, daily mean specific conductance in microsiemens per centimeter at 25 degrees Celsius (µS/cm at 25 °C)]
USGS station number
Equation form1
09136100 ln(load) = β0 + β1ln(Q) + β2 dectime + β3sin(2π dectime) + β4cos(2π dectime) + ε09144250 ln(load) = β0 + β1ln(Q) + β2sin(2πdectime) + β3cos(2πdectime) + ε09147500 ln(load) = β0 + β1ln(Q) + ε09149500 ln(load) = β0 + β1ln(Q) + β2sin(2πdectime) + β3cos(2πdectime) + ε09152500 ln(load) = β0 + β1ln(Q) + β2SC + ε091525002 ln(load) = β0 + β1ln(Q) + β2ln(Q)2 + β3dectime + β4(dectime)2 + β5sin(2πdectime) + β6cos(2πdectime) + ε091525003 ln(load) = β0 + β1ln(Q) + β2ln(Q)2 + β3dectime + β4(dectime)2 + β5sin(2πdectime) + β6cos(2πdectime) + ε
1Any bias that is introduced by the log transformation needs to be corrected if the results are transformed out of log space (Cohn and others, 1989), but this correction is automatically applied by the statistical software used for the regression analysis (Mayo and Leib, 2012).
2Equation form used for 1986–2016 trend analysis.3Equation form used for 1994–2016 trend analysis.

14 Assessment of Dissolved-Selenium Concentrations and Loads in the Lower Gunnison River Basin, Colo., from 2011 to 2016
Table 1.3. Regression model coefficients and statistical diagnostics at five core sites with U.S. Geological Survey streamflow-gaging stations in the lower Gunnison River, water year 2015.
[USGS, U.S. Geological Survey; ln, natural logarithm; Q, centered daily streamflow in cubic feet per second (ft3/s); dectime, centered decimal time in decimal years; sin(2πdectime), sine function of a Fourier Series; π, approximately 3.141593; cos(2πdectime), cosine function of a Fourier Series; SC, daily mean specific conductance in microsiemens per centimeter at 25 degrees Celsius (µS/cm at 25 °C); ERV, estimated residual variance; R2, coefficient of determination; SCR, serial correlation of the residuals; —, no coefficient available]
USGS station Number
Y-axisIntercept
ln(Q) ln(Q)2 1/Q dectime sin(2pdectime) cos(2pdectime) SC ERV R2 SCR
09136100 1.386 0.569 — — — –0.137 –0.079 — 0.003 99.46 0.59809144250 2.793 0.4816 — — — –0.163 –0.059 — 0.054 84.44 –0.763091475001 –11.56 1.441 — — — — — 0.007 0.043 95.85 –0.763091475002 –0.483 1.071 — — — 0.373 0.178 — 0.071 94.47 –0.66809149500 2.814 0.564 — — — 0.189 0.180 — 0.030 73.98 –0.273091525001 –3.093 0.729 — — — — — 0.001 0.021 83.09 –0.057091525002 3.807 0.389 –0.221 — –0.263 –0.145 0.020 — 0.032 78.52 –0.292
1Coefficients and diagnostics when specific conductance data were available.2Coefficients and diagnostics when specific conductance data were absent.
Table 1.4. Regressiostations in the lower G
n model coefficients and statistical diagnostics at five core sites with U.S. Geological Survey streamflow-gaging unnison River Basin, water year 2016.
[USGS, U.S. Geological Survey; ln, natural logarithm; Q, centered daily streamflow in cubic feet per second (ft3/s); dectime, centered decimal time in decimal years; sin(2πdectime), sine function of a Fourier Series; π, approximately 3.141593; cos(2πdectime), cosine function of a Fourier Series; SC, daily mean specific conductance in microsiemens per centimeter at 25 degrees Celsius (µS/cm at 25 °C); ERV, estimated residual variance; R2, coefficient of determination; SCR, serial correlation of the residuals; —-, no coefficient available]
USGS station Number
Y-axisIntercept
ln(Q) ln(Q)2 dectime (dectime)2 sin(2pdectime) cos(2pdectime) SC ERV R2 SCR
09136100 1.187 0.4193 — –0.284 — –0.089 –0.241 — 0.029 96.03 0.28609144250 2.548 0.508 — — — –0.241 –0.128 — 0.043 71.86 –0.22509147500 –0.369 0.958 — — — — — — 0.107 89.86 –0.29909149500 2.721 0.556 — — — 0.006 0.217 — 0.041 52.93 –0.17109152500 –2.390 0.662 — — — — — 0.001 0.010 82.75 –0.285091525001 3.919 0.352 0.062 –0.019 –0.0003 –0.217 0.049 — 0.054 65.09 0.195091525002 3.887 0.362 0.083 –0.019 –0.001 –0.212 0.051 — 0.052 63.74 0.228
1Coefficients and diagnostics for 1986–2016 trend analysis.2Coefficients and diagnostics for 1994–2016 trend analysis.3Coefficient reported in R-LOADEST was -0.0004, reported to 3 significant figures in table 1.4.

Appendix 2 15
Appendix 2. Calibration Data For 2015 and 2016 Annual Load and Trend Regressions
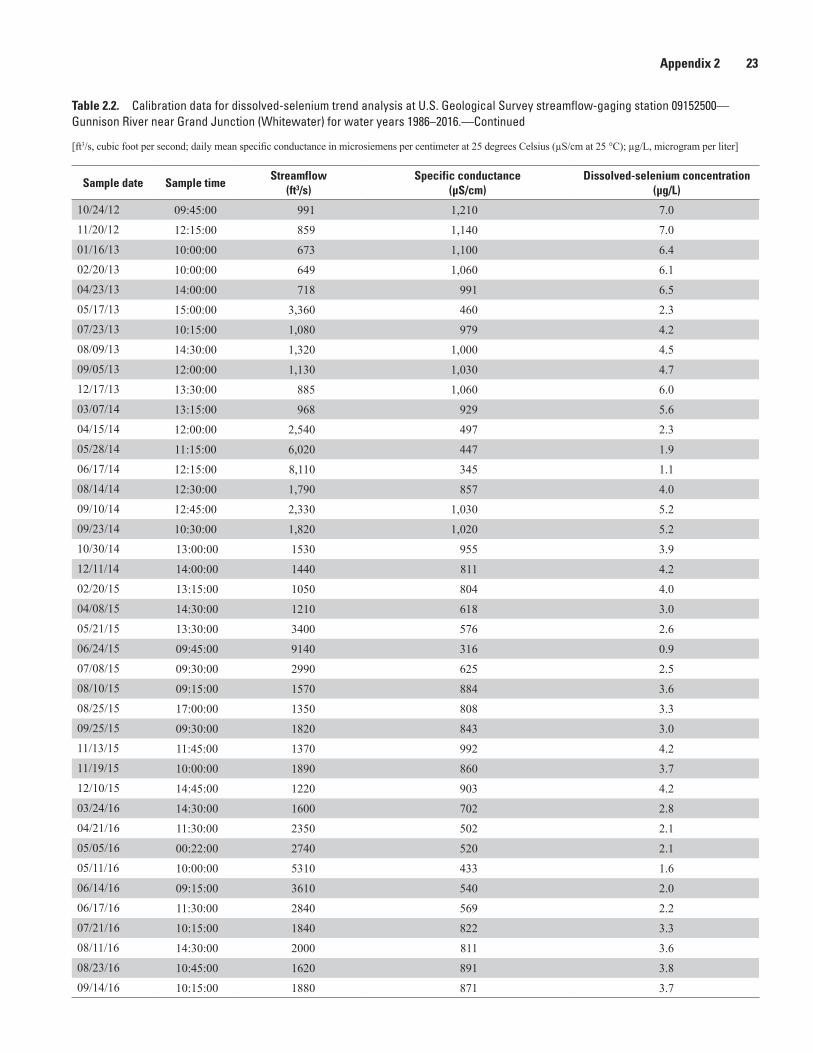
Table 2.1 provides calibration data for annual load regression models at selected sites. Calibration data for dissolved-selenium trend analysis at the U. S. Geological Survey streamflow-gaging station Gunnison River near Grand Junction (Whitewater) are presented in table 2.2.
Table 2.1. Calibration data for annual load regression models at selected U.S. Geological Survey streamflow-gaging stations.—Continued
[ft3/s, cubic foot per second; daily mean specific conductance in microsiemens per centimeter at 25 degrees Celsius (µS/cm at 25 °C); µg/L, microgram per liter]
Sample date Sample timeStreamflow
(ft3/s)Specific conductance
(µS/cm)Dissolved-selenium concentration
(µg/L)
North Fork Gunnison River near Lazear (09136100)
12/09/2013 13:00:00 189 951 2.203/05/2014 10:30:00 312 685 1.506/11/2014 07:30:00 1,520 344 0.8908/11/2014 11:00:00 131 1,350 2.910/27/2014 11:15:00 285 945 1.902/17/2015 11:00:00 164 821 2.005/20/2015 12:30:00 1,780 371 0.8409/21/2015 12:30:00 180 1,260 2.812/07/2015 13:20:00 157 983 2.003/21/2016 12:30:00 340 585 1.206/13/2016 14:30:00 1,760 278 0.507/18/2016 14:15:00 104 1290 3.0
Gunnison River at Delta (09144250)
12/12/13 10:30:00 463 840 3.003/05/14 13:15:00 799 675 2.206/13/14 09:00:00 8,510 269 0.608/13/14 10:00:00 1,030 628 2.110/29/14 09:15:00 806 814 3.102/20/15 08:45:00 869 543 1.505/21/15 09:45:00 2,400 460 1.708/24/15 14:30:00 957 630 2.211/19/15 13:35:00 1,500 551 1.512/09/15 13:20:00 913 640 2.003/23/16 12:30:00 1,070 506 1.405/04/16 11:15:00 1,760 460 1.306/15/16 10:10:00 2,610 394 1.106/15/16 12:45:00 2,510 392 1.107/21/16 12:30:00 1,250 575 1.908/10/16 11:50:00 1,400 610 2.7

16 Assessment of Dissolved-Selenium Concentrations and Loads in the Lower Gunnison River Basin, Colo., from 2011 to 2016
Table 2.1. Calibration data for annual load regression models at selected U.S. Geological Survey streamflow-gaging stations.—Continued
[ft3/s, cubic foot per second; daily mean specific conductance in microsiemens per centimeter at 25 degrees Celsius (µS/cm at 25 °C); µg/L, microgram per liter]
Sample date Sample timeStreamflow
(ft3/s)Specific conductance
(µS/cm)Dissolved-selenium concentration
(µg/L)
Uncompahgre River at Colona (09147500)
12/11/2013 13:00:00 56 626 0.7903/03/14 16:30:00 62 618 1.006/09/14 12:45:00 647 471 0.7208/11/14 16:00:00 334 407 0.4410/27/14 11:30:00 132 510 0.5802/17/15 11:40:00 68 586 0.6505/18/15 11:45:00 263 498 0.9709/21/15 16:00:00 189 452 0.3712/07/15 13:10:00 59 584 0.5603/22/16 09:15:00 284 586 0.6906/13/16 14:25:00 1,030 454 0.5307/18/16 12:00:00 407 392 0.4
Uncompahgre River at Delta (09149500)
12/12/13 00:00:00 238 1,660 13.703/04/14 13:30:00 191 1,650 16.406/10/14 13:45:00 753 866 5.208/13/14 10:45:00 368 1,210 7.810/29/14 09:00:00 508 1,010 6.402/18/15 12:45:00 166 1,430 12.805/20/15 11:00:00 660 895 7.408/24/15 11:45:00 338 1,160 6.109/23/15 09:45:00 532 1,100 5.811/19/15 10:00:00 335 1,650 11.212/09/15 11:15:00 270 1,540 11.503/23/16 10:15:00 368 1,040 6.005/04/16 13:35:00 338 1,080 7.506/15/16 10:00:00 656 896 4.306/16/16 11:45:00 677 872 4.007/20/16 14:40:00 313 1,220 7.008/10/16 14:15:00 585 1,100 6.0

Appendix 2 17
Table 2.1. Calibration data for annual load regression models at selected U.S. Geological Survey streamflow-gaging stations.—Continued
[ft3/s, cubic foot per second; daily mean specific conductance in microsiemens per centimeter at 25 degrees Celsius (µS/cm at 25 °C); µg/L, microgram per liter]
Sample date Sample timeStreamflow
(ft3/s)Specific conductance
(µS/cm)Dissolved-selenium concentration
(µg/L)
Gunnison River near Grand Junction (Whitewater) (09152500)
12/17/13 00:00:00 885 1,060 6.003/07/14 13:15:00 968 929 5.604/15/14 12:00:00 2,540 497 2.305/28/14 11:15:00 6,020 447 1.906/17/14 12:15:00 8,110 345 1.107/18/14 09:00:00 1,470 855 4.308/14/14 12:30:00 1,790 857 4.009/10/14 12:45:00 2,330 1,030 5.209/23/14 10:30:00 1,820 1,020 5.210/30/14 13:00:00 1,530 955 3.912/11/14 14:00:00 1,440 811 4.202/20/15 13:15:00 1,050 804 4.004/08/15 14:30:00 1,210 618 3.005/21/15 13:30:00 3,400 576 2.606/24/15 09:45:00 9,140 316 0.907/08/15 09:30:00 2,990 625 2.508/10/15 09:15:00 1,570 884 3.608/25/15 17:00:00 1,350 808 3.309/25/15 09:30:00 1,820 843 3.011/13/15 11:45:00 1,370 992 4.211/19/15 10:00:00 1,890 860 3.712/10/15 14:45:00 1,220 903 4.203/24/16 14:30:00 1,600 702 2.804/21/16 11:30:00 2,350 502 2.105/05/16 00:22:00 2,740 520 2.105/11/16 10:00:00 5,310 433 1.606/14/16 09:15:00 3,610 540 2.006/17/16 11:30:00 2,840 569 2.207/21/16 10:15:00 1,840 822 3.308/11/16 14:30:00 2,000 811 3.608/23/16 10:45:00 1,620 891 3.89/14/2016 10:15:00 1,880 871 3.7

18 Assessment of Dissolved-Selenium Concentrations and Loads in the Lower Gunnison River Basin, Colo., from 2011 to 2016
Table 2.2. Calibration data for dissolved-selenium trend analysis at U.S. Geological Survey streamflow-gaging station 09152500—Gunnison River near Grand Junction (Whitewater) for water years 1986–2016.—Continued
[ft3/s, cubic foot per second; daily mean specific conductance in microsiemens per centimeter at 25 degrees Celsius (µS/cm at 25 °C); µg/L, microgram per liter]
Sample date Sample timeStreamflow
(ft3/s)Specific conductance
(µS/cm)Dissolved-selenium concentration
(µg/L)
11/26/85 13:00:00 2,660 880 603/26/86 13:00:00 3,480 518 405/30/86 11:00:00 7,970 340 207/16/86 12:00:00 5,630 600 309/24/86 12:30:00 3,710 790 511/20/86 13:05:00 4,480 780 507/16/87 14:30:00 1,990 838 608/11/87 13:30:00 2,180 908 809/22/87 13:30:00 1,960 1,090 711/10/87 08:00:00 2,340 905 604/05/88 14:20:00 2,460 598 208/16/88 11:30:00 737 1,410 1009/22/88 14:50:00 1,800 1,220 811/02/88 13:20:00 924 1,400 1104/12/89 11:10:00 2,550 510 207/18/89 12:00:00 650 1,400 1108/29/89 12:05:00 941 1,370 1011/07/89 10:00:00 1,390 1,220 903/27/90 13:15:00 766 977 705/02/90 10:00:00 1,740 1,110 808/28/90 12:45:00 780 1,440 1003/26/91 12:30:00 997 942 807/31/91 12:30:00 1,600 970 509/24/91 09:50:00 1,510 1,200 911/13/91 12:00:00 2,100 837 512/03/91 11:20:00 2,000 797 701/16/92 11:00:00 1,300 855 502/26/92 12:45:00 1,130 881 503/18/92 09:45:00 1,390 894 704/21/92 12:20:00 2,950 538 306/24/92 12:30:00 1,910 826 608/19/92 13:00:00 1,720 1,030 712/01/92 13:00:00 1,140 1,150 905/26/93 10:20:00 15,500 274 107/27/93 09:55:00 1,800 888 609/08/93 12:35:00 2,290 967 511/23/93 10:25:00 2,270 812 602/24/94 11:05:00 977 1,030 705/25/94 11:30:00 5,510 423 2

Appendix 2 19
Table 2.2. Calibration data for dissolved-selenium trend analysis at U.S. Geological Survey streamflow-gaging station 09152500—Gunnison River near Grand Junction (Whitewater) for water years 1986–2016.—Continued
[ft3/s, cubic foot per second; daily mean specific conductance in microsiemens per centimeter at 25 degrees Celsius (µS/cm at 25 °C); µg/L, microgram per liter]
Sample date Sample timeStreamflow
(ft3/s)Specific conductance
(µS/cm)Dissolved-selenium concentration
(µg/L)
06/23/94 11:20:00 2,460 865 508/17/94 09:25:00 1,260 1,120 609/07/94 12:30:00 1,790 1,110 810/27/94 12:10:00 1,730 1,060 612/19/94 13:00:00 1,400 920 601/24/95 10:15:00 1,080 860 605/17/95 10:33:00 11,400 350 206/19/95 14:00:00 13,900 348 210/30/95 11:20:00 2,800 794 512/12/95 12:00:00 2,750 651 401/23/96 10:15:00 1,670 806 502/21/96 11:15:00 2,020 755 503/26/96 12:00:00 2,710 553 305/20/96 10:30:00 6,990 336 205/29/96 10:45:00 2,740 686 406/11/96 14:30:00 2,700 627 407/03/96 13:15:00 3,620 530 307/16/96 11:30:00 2,310 675 408/07/96 12:30:00 1,230 992 708/21/96 11:50:00 1,410 1,040 709/05/96 11:40:00 1,500 1,030 709/16/96 15:35:00 2,170 1,010 709/17/96 07:30:00 2,120 1,020 710/04/96 13:00:00 2,910 1,120 611/13/96 13:00:00 2,070 794 512/20/96 10:30:00 2,000 692 501/17/97 13:00:00 2,310 572 302/24/97 13:30:00 2,510 540 203/31/97 12:45:00 5,610 386 104/25/97 10:30:00 5,890 384 104/28/97 12:45:00 6,490 382 205/16/97 08:30:00 9,170 302 105/24/97 15:40:00 10,600 358 206/12/97 12:30:00 9,240 412 207/03/97 12:40:00 5,610 376 207/18/97 11:30:00 2,780 616 308/12/97 11:40:00 3,240 880 509/05/97 12:15:00 2,790 888 510/20/97 11:15:00 3,200 652 4

20 Assessment of Dissolved-Selenium Concentrations and Loads in the Lower Gunnison River Basin, Colo., from 2011 to 2016
Table 2.2. Calibration data for dissolved-selenium trend analysis at U.S. Geological Survey streamflow-gaging station 09152500—Gunnison River near Grand Junction (Whitewater) for water years 1986–2016.—Continued
[ft3/s, cubic foot per second; daily mean specific conductance in microsiemens per centimeter at 25 degrees Celsius (µS/cm at 25 °C); µg/L, microgram per liter]
Sample date Sample timeStreamflow
(ft3/s)Specific conductance
(µS/cm)Dissolved-selenium concentration
(µg/L)
11/07/97 12:20:00 2,780 649 312/15/97 13:45:00 2,660 585 301/08/98 10:30:00 2,600 519 302/11/98 10:00:00 2,130 612 303/12/98 09:30:00 1,740 645 404/08/98 13:50:00 2,660 613 305/18/98 13:00:00 6,670 367 106/03/98 10:00:00 5,120 397 206/11/98 09:40:00 2,960 590 307/09/98 10:10:00 2,030 841 508/11/98 11:30:00 1,450 1,040 409/11/98 13:10:00 1,710 1,040 710/16/98 10:00:00 1,840 948 511/18/98 12:15:00 1,800 1,010 701/20/99 11:10:00 1,350 896 603/10/99 10:30:00 1,110 852 504/16/99 13:15:00 948 740 304/30/99 10:00:00 2,750 743 506/10/99 10:00:00 3,020 605 306/30/99 14:20:00 3,360 593 307/29/99 10:00:00 2,430 914 409/09/99 12:40:00 3,170 722 410/06/99 13:00:00 4,790 484 211/17/99 15:00:00 1,880 831 601/19/00 09:30:00 1,520 888 6.603/09/00 12:30:00 1,170 904 6.803/21/00 12:50:00 1,670 632 4.103/22/00 09:15:00 1,700 706 4.704/13/00 10:30:00 3,430 439 2.505/10/00 10:00:00 4,280 477 2.006/06/00 10:50:00 2,390 627 3.807/24/00 10:35:00 1,410 872 3.708/29/00 13:45:00 1,890 866 4.910/25/00 12:40:00 1,800 995 5.712/14/00 13:30:00 1,440 920 8.302/13/01 11:35:00 1,050 825 7.503/15/01 12:00:00 1,240 958 6.904/20/01 11:45:00 2,060 540 3.305/22/01 13:45:00 3,480 479 2.6

Appendix 2 21
Table 2.2. Calibration data for dissolved-selenium trend analysis at U.S. Geological Survey streamflow-gaging station 09152500—Gunnison River near Grand Junction (Whitewater) for water years 1986–2016.—Continued
[ft3/s, cubic foot per second; daily mean specific conductance in microsiemens per centimeter at 25 degrees Celsius (µS/cm at 25 °C); µg/L, microgram per liter]
Sample date Sample timeStreamflow
(ft3/s)Specific conductance
(µS/cm)Dissolved-selenium concentration
(µg/L)
06/28/01 13:40:00 1,300 949 5.707/27/01 11:30:00 1,260 1,040 5.908/23/01 10:30:00 2,140 1,400 7.510/26/01 10:45:00 1,650 1,020 6.912/14/01 13:15:00 1,200 965 8.403/11/02 13:55:00 1,030 828 8.703/29/02 11:00:00 1,200 792 6.804/25/02 11:05:00 687 925 7.005/31/02 09:00:00 946 1,090 8.506/26/02 13:00:00 828 915 6.008/13/02 13:00:00 818 1,130 6.009/24/02 10:00:00 1,010 1,250 8.010/18/02 11:15:00 1,070 1,200 11.612/17/02 14:00:00 715 1,260 13.202/20/03 12:45:00 607 1,180 16.403/13/03 12:00:00 669 1,050 9.604/25/03 13:45:00 1,150 642 4.905/20/03 08:45:00 4,570 488 2.906/11/03 10:35:00 1,840 724 3.707/22/03 09:15:00 1,010 883 4.608/04/03 11:05:00 1,040 981 6.010/22/03 09:40:00 1,070 1,200 8.412/11/03 11:20:00 771 1,300 13.602/26/04 08:55:00 706 1,170 12.003/24/04 09:15:00 1,460 688 4.904/23/04 10:20:00 1,510 734 5.305/13/04 11:30:00 2,830 526 2.906/28/04 11:55:00 1,010 1,090 6.907/14/04 11:00:00 997 974 6.808/17/04 10:50:00 1,010 1,070 6.911/16/04 12:00:00 1,090 1,180 7.912/28/04 11:00:00 926 1,060 6.501/24/05 13:35:00 1,210 860 5.202/15/05 12:15:00 1,570 685 4.004/08/05 11:30:00 2,980 484 2.005/23/05 11:15:00 11,900 287 1.806/02/05 13:18:00 5,990 454 1.907/12/05 09:20:00 1,630 876 4.609/22/05 09:50:00 1,570 1,110 5.7

22 Assessment of Dissolved-Selenium Concentrations and Loads in the Lower Gunnison River Basin, Colo., from 2011 to 2016
Table 2.2. Calibration data for dissolved-selenium trend analysis at U.S. Geological Survey streamflow-gaging station 09152500—Gunnison River near Grand Junction (Whitewater) for water years 1986–2016.—Continued
[ft3/s, cubic foot per second; daily mean specific conductance in microsiemens per centimeter at 25 degrees Celsius (µS/cm at 25 °C); µg/L, microgram per liter]
Sample date Sample timeStreamflow
(ft3/s)Specific conductance
(µS/cm)Dissolved-selenium concentration
(µg/L)
10/31/05 13:30:00 1,560 1,120 6.601/05/06 14:30:00 998 1,050 5.703/17/06 14:15:00 1,210 834 3.805/26/06 14:00:00 3,390 512 1.908/24/06 11:45:00 1,930 794 3.611/30/06 15:15:00 2,170 671 3.503/01/07 11:20:00 1,440 743 4.004/04/07 10:45:00 2,630 480 2.207/09/07 14:15:00 1,270 981 4.909/05/07 18:40:00 1,790 923 5.012/13/07 11:42:00 1,810 752 5.204/28/08 13:39:00 7,130 321 1.105/20/08 12:15:00 12,500 307 1.108/13/08 11:35:00 2,050 816 4.510/15/08 14:00:00 1,840 962 5.401/27/09 11:30:00 1,520 907 6.503/17/09 11:45:00 1,410 653 3.706/02/09 13:25:00 5,660 466 2.109/28/09 14:15:00 1,880 904 6.311/10/09 15:10:00 1,350 991 7.202/03/10 14:20:00 1,330 732 4.404/08/10 12:15:00 1,460 800 5.106/03/10 15:15:00 3,160 537 2.807/20/10 12:30:00 1,230 985 5.402/15/11 15:15:00 1,480 707 4.203/25/11 09:30:00 2,520 544 2.605/13/11 13:20:00 6,150 390 1.607/13/11 12:45:00 5,930 695 2.408/08/11 12:00:00 1,970 830 4.309/20/11 11:30:00 2,430 828 4.211/21/11 09:20:00 1,460 936 6.412/06/11 10:15:00 2,160 629 3.601/05/12 10:45:00 1,610 682 4.102/21/12 13:45:00 1,050 846 5.503/16/12 12:20:00 1,270 709 3.905/25/12 11:15:00 1,140 842 4.306/19/12 09:30:00 1,010 899 4.707/11/12 09:30:00 896 1,010 6.808/27/12 09:45:00 1,210 1,070 6.1
Appendix 2 23
Table 2.2. Calibration data for dissolved-selenium trend analysis at U.S. Geological Survey streamflow-gaging station 09152500—Gunnison River near Grand Junction (Whitewater) for water years 1986–2016.—Continued
[ft3/s, cubic foot per second; daily mean specific conductance in microsiemens per centimeter at 25 degrees Celsius (µS/cm at 25 °C); µg/L, microgram per liter]
Sample date Sample timeStreamflow
(ft3/s)Specific conductance
(µS/cm)Dissolved-selenium concentration
(µg/L)
10/24/12 09:45:00 991 1,210 7.011/20/12 12:15:00 859 1,140 7.001/16/13 10:00:00 673 1,100 6.402/20/13 10:00:00 649 1,060 6.104/23/13 14:00:00 718 991 6.505/17/13 15:00:00 3,360 460 2.307/23/13 10:15:00 1,080 979 4.208/09/13 14:30:00 1,320 1,000 4.509/05/13 12:00:00 1,130 1,030 4.712/17/13 13:30:00 885 1,060 6.003/07/14 13:15:00 968 929 5.604/15/14 12:00:00 2,540 497 2.305/28/14 11:15:00 6,020 447 1.906/17/14 12:15:00 8,110 345 1.108/14/14 12:30:00 1,790 857 4.009/10/14 12:45:00 2,330 1,030 5.209/23/14 10:30:00 1,820 1,020 5.210/30/14 13:00:00 1530 955 3.912/11/14 14:00:00 1440 811 4.202/20/15 13:15:00 1050 804 4.004/08/15 14:30:00 1210 618 3.005/21/15 13:30:00 3400 576 2.606/24/15 09:45:00 9140 316 0.907/08/15 09:30:00 2990 625 2.508/10/15 09:15:00 1570 884 3.608/25/15 17:00:00 1350 808 3.309/25/15 09:30:00 1820 843 3.011/13/15 11:45:00 1370 992 4.211/19/15 10:00:00 1890 860 3.712/10/15 14:45:00 1220 903 4.203/24/16 14:30:00 1600 702 2.804/21/16 11:30:00 2350 502 2.105/05/16 00:22:00 2740 520 2.105/11/16 10:00:00 5310 433 1.606/14/16 09:15:00 3610 540 2.006/17/16 11:30:00 2840 569 2.207/21/16 10:15:00 1840 822 3.308/11/16 14:30:00 2000 811 3.608/23/16 10:45:00 1620 891 3.809/14/16 10:15:00 1880 871 3.7


Henneberg—Assessm
ent of Dissolved-Selenium Concentrations and Loads in the Low
er Gunnison River Basin, Colo., From 2011 to 2016—
SIR 2018–5001
ISSN 2328-0328 (online)https://doi.org/10.3133/sir20185001