assessment of channel width disparity at · pdf fileinternational journal of geology, earth...
TRANSCRIPT

International Journal of Geology, Earth & Environmental Sciences ISSN: 2277-2081 (Online)
An Open Access, Online International Journal Available at http://www.cibtech.org/jgee.htm
2014 Vol. 4 (3) September-December, pp. 231-243/Soumen
Research Article
© Copyright 2014 | Centre for Info Bio Technology (CIBTech) 231
ASSESSMENT OF CHANNEL WIDTH DISPARITY AT DIFFERENT
STRETCHES OF REGULATED RIVER DAMODAR USING
REMOTE SENSING AND GIS
*Soumen Dey
Department of Geography, Visva Bharati, Santiniketan
*Author for Correspondence
ABSTRACT
Remote sensing images can be effective medium to determine river bank shifting at different time phase.
The paper aims to understand asymmetric pattern of channel width distribution at different stretches of
river Damodar from Damodar Barakar confluence to Paikpara. Three time phase data i.e. AMS toposheet
1943, SOI toposheet 1969- 70, LANDSAT 8 satellite 2014 data are used in this study. The observation
shows that average width of river has been decrease from source to mouth. Strong human intervention is
largely responsible for asymmetric pattern of channel width of river Damodar.
Keywords: Channel Width, River Bank, Erosion, Deposition, Bar, Char
INTRODUCTION
River width depends on slope, discharge, bank material, velocity etc. Moriswa (1985) has explained that
the morphology of river channels is function of discharge, width, depth and velocity. But now a day’s
Man induced factor is one of the key component which stress on River morphology.
Bridge construction across river without providing enough space for through passing, regulated
discharges from barrages and dam, river bank cultivation and bank failure etc. are some human cultivated
causes of site and river specific change of river width (Pal et al., 2012).
W.M. Davis has established the fact that the width of a river gradually increases downstream due to
increase volume of water. Many studies has documented extraordinary stream channel enlargement as a
result of increase discharge (Moriswa, 1985).
In spite of such stage wise rhythm of width, due to local causes there may be some variations in width
pattern from source to mouth (Moriswa, 1968). Temporal variation of width pattern provides a brief idea
about velocity, discharge status (Richards, 1973), shifting of river course and status of bank erosion or in
a word the stability of river course.
The Damodar River is a subsystem of Ganges River system of India and the river has its own
morphological character, trend and evolution. The river is a present drainage of state of Jharkhand and
West Bengal.
Study Area
The River Damodar originates in the Chotanagpur water shed approximately at 23◦37’N and 84
◦41’E and
the geographical boundary of the basin lies between 22◦15’ to 24
◦30’N latitude and 84
◦30’ to 88
◦15’E
longitude. The entire drainage basin resembles a tadpole in shape with the head to the west. The main
tributaries are the Barakar, Tilaiya, and Konar.
Below the confluence of the Barakar and Damodar there are a few insignificant tributaries such as the
Nunia and Sali. Once the main distributaries were the Khari, Banka, Behula, and Gangur, but now they
look more like independent rivers.
Near Palla the river takes a sharp southerly bend (Bhattacharyya, 2011). Its funnel shape basin area is
about 23,370.98 km2, spreading in the states of Jharkhand (73.7 per cent) and West Bengal (26.3 per
cent) (Majumder et al., 2010).
International Journal of Geology, Earth & Environmental Sciences ISSN: 2277-2081 (Online)
An Open Access, Online International Journal Available at http://www.cibtech.org/jgee.htm
2014 Vol. 4 (3) September-December, pp. 231-243/Soumen
Research Article
© Copyright 2014 | Centre for Info Bio Technology (CIBTech) 232
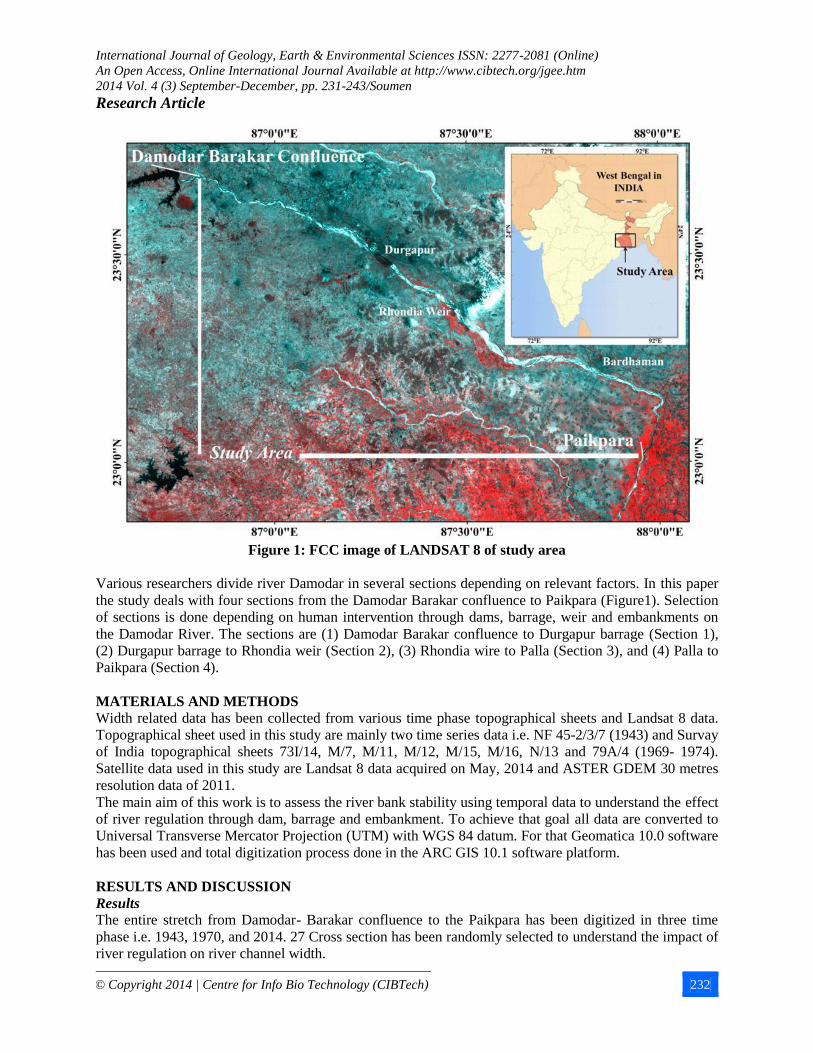
Figure 1: FCC image of LANDSAT 8 of study area
Various researchers divide river Damodar in several sections depending on relevant factors. In this paper
the study deals with four sections from the Damodar Barakar confluence to Paikpara (Figure1). Selection
of sections is done depending on human intervention through dams, barrage, weir and embankments on
the Damodar River. The sections are (1) Damodar Barakar confluence to Durgapur barrage (Section 1),
(2) Durgapur barrage to Rhondia weir (Section 2), (3) Rhondia wire to Palla (Section 3), and (4) Palla to
Paikpara (Section 4).
MATERIALS AND METHODS
Width related data has been collected from various time phase topographical sheets and Landsat 8 data.
Topographical sheet used in this study are mainly two time series data i.e. NF 45-2/3/7 (1943) and Survay
of India topographical sheets 73I/14, M/7, M/11, M/12, M/15, M/16, N/13 and 79A/4 (1969- 1974).
Satellite data used in this study are Landsat 8 data acquired on May, 2014 and ASTER GDEM 30 metres
resolution data of 2011.
The main aim of this work is to assess the river bank stability using temporal data to understand the effect
of river regulation through dam, barrage and embankment. To achieve that goal all data are converted to
Universal Transverse Mercator Projection (UTM) with WGS 84 datum. For that Geomatica 10.0 software
has been used and total digitization process done in the ARC GIS 10.1 software platform.
RESULTS AND DISCUSSION
Results The entire stretch from Damodar- Barakar confluence to the Paikpara has been digitized in three time
phase i.e. 1943, 1970, and 2014. 27 Cross section has been randomly selected to understand the impact of
river regulation on river channel width.

International Journal of Geology, Earth & Environmental Sciences ISSN: 2277-2081 (Online)
An Open Access, Online International Journal Available at http://www.cibtech.org/jgee.htm
2014 Vol. 4 (3) September-December, pp. 231-243/Soumen
Research Article
© Copyright 2014 | Centre for Info Bio Technology (CIBTech) 233
Damodar Barakar Confluence to Durgapur Barrage
In this section (section 1) nine locations are established to identify the change in river during the last 70
years. The total length of this section is nearly 59 km (Figure 2, 3). The dam construction by DVC
(Damodar Valley Corporation) was completed in 1957. It is observed that river bank shifting is more
occurred in the first phase of study i.e. 1943 to 1970 than 1970 to 2014 (Second Phase). The major
shifting of river occurred in the first phase at Dishergarh nearly 20 metres per year where negative erosion
observed in the second phase (Table 1).
Table 1: Width Distribution of Damodar River (Section 1)
Loca
tion
ID
Site
Distance in
km
(From
Damodar
Barakar
Confluence)
Distance in
km
From
Damodar
Barakar
Confluence
River Width in
Metres
Rate of
Widening (metre
/year)
1943 1970 2014
1943
to
1970
1970
to
2014
1 Near Dishergarh 0 0 927 1446 689 19.96 -17.20
2 Near Radhanagar 5 5 732 783 629 1.96 -3.5
3
Near Dihika(after
the South eastern
railway Bridge)
12 12 775 718 534 -2.19 -4.18
4 Near Apisgram 18 18 871 824 771 -1.80 -1.20
5 Near Bakulia
Village 25 25 646 897 656 9.65 -5.47
6 Near Damalia
Village 31 31 694 751 689 2.19 -1.40
7 Near Gangajalghati
Protected Forest 38 38 1395 1351 1474 -1.69 2.79
8 Near Parsha
Market 52 52 1644 1459 1522 -7.11 1.43
9 Durgapur Barrage 58.5 58.5 1812 1832 1832 0.76 0
(-)Negative signs indicate Deposition or Aggradation of river Bank
Data Source: Toposheet (AMS & SOI) 1943, 1969-70 and LANDSAT 8 satellite data

International Journal of Geology, Earth & Environmental Sciences ISSN: 2277-2081 (Online)
An Open Access, Online International Journal Available at http://www.cibtech.org/jgee.htm
2014 Vol. 4 (3) September-December, pp. 231-243/Soumen
Research Article
© Copyright 2014 | Centre for Info Bio Technology (CIBTech) 234
Figure 2: Damodar Barakar confluence to Durgapur barrage (Part A).

International Journal of Geology, Earth & Environmental Sciences ISSN: 2277-2081 (Online)
An Open Access, Online International Journal Available at http://www.cibtech.org/jgee.htm
2014 Vol. 4 (3) September-December, pp. 231-243/Soumen
Research Article
© Copyright 2014 | Centre for Info Bio Technology (CIBTech) 235
Figure 3: Damodar Barakar confluence to Durgapur barrage (Part B).

International Journal of Geology, Earth & Environmental Sciences ISSN: 2277-2081 (Online)
An Open Access, Online International Journal Available at http://www.cibtech.org/jgee.htm
2014 Vol. 4 (3) September-December, pp. 231-243/Soumen
Research Article
© Copyright 2014 | Centre for Info Bio Technology (CIBTech) 236
Durgapur Barrage to Rhondia Weir
The length of this section is nearly 19 km (Figure 4). Near Keneti Mana only where prominent positive
erosion takes place during the first phase of the study find out from the 5 observation station. Stagnation
of river water between Durgapur barrage and Rhondia weir were caused this types deposition.
Bara Mana (Figure 5) and Chhota Mana are one the major example of negative erosion caused due to
Anderson Weir or Rhondia Weir. The major deposition rate is observed just below the Durgapur barrage
at the first phase (Table 2).
Table 2: Width Distribution of Damodar River (Section 2)
Loca
tion
ID
Site
Distance in km
(From
Damodar
Barakar
Confluence)
Distance in
km
From
Durgapur
barrage
River Width in
Metres
Rate of Widening
(metre /year)
1943 1970 2014
1943
to
1970
1970
to
2014
10 Down Stream from
Durgapur Barrage 62 3.5 2320 1191 798 -43.42 -8.93
11 Chota Manna start
point 67.5 5.5 2626 2060 930 -21.76 -25.68
12 Near Radhakantapur 73.5 11.5 2704 2580 1207 -4.76 -31.20
13 Silampur 76.5 14.5 1854 1861 1810 0.26 -1.15
14 Keneti Mana 80.5 18.5 1449 2455 1776 38.6 -15.41
(-)Negative signs indicate Deposition or Aggradation of river Bank
Data Source: Toposheet (AMS & SOI) 1943, 1969-70 and LANDSAT 8 satellite data
Rhondia Weir to Palla (Figure 6)
At this section (section 3) where major river bank shift occurred to the right bank as left bank of river
Damodar is protected trough embankment. Out of 9 stations positive erosion of bank shifting are very
much prominent in the later phase (1970 -2014). It is observed that near Dadpur village where negative
rate of erosion at first phase (36metre/ year) but at the second phase positive erosion at a rate of 18 metres
/ year. Same type of erosion also very dominates at near Fakirpur Village (Table 3). The total length of
this section is nearly 58 km. Figure 7 shows how stabilization of Satyanandapur, Simultala and Kamalpur
char takes place since 1969 to 2014.
Table 3: Width Distribution of Damodar River (Section 3)
Loca
tion
ID
Site
Distance in km
(From
Damodar
Barakar
Confluence)
Distance in
km
From
Rhoindia
Weir
River Width in
Metres
Rate of Widening
(metre /year)
1943 1970 2014
1943
to
1970
1970
to
2014
15 Near Fatepur Mana 84.5 2 1728 1674 1254 -2.07 -9.54
16 Near kasba Mana 90.5 6 841 1113 1421 10.46 7
17 Near Silla Village 97.5 13 834 1778 1794 36.30 0.36
18 At Sali Nadi
Junction 105.5 21 819 695 1387 -4.76 15.72
19 Near Dadpur Village 114.5 30 1751 799 1611 -36.61 18.45
20 Near Kalimahanpur/
Satyanandapur 118.5 34 1672 1655 705 -0.65 -21.59
21 Fakirpur Village 125.5 41 1280 424 1095 -32.92 15.25
22 Kalinagar Village 138.5 54 758 398 639 -13.84 5.47
23 Near Palla 142.5 58 631 908 844 10.65 -1.45
(-)Negative signs indicate Deposition or Aggradation of river Bank
Data Source: Toposheet (AMS & SOI) 1943, 1969-70 and LANDSAT 8 satellite data

International Journal of Geology, Earth & Environmental Sciences ISSN: 2277-2081 (Online)
An Open Access, Online International Journal Available at http://www.cibtech.org/jgee.htm
2014 Vol. 4 (3) September-December, pp. 231-243/Soumen
Research Article
© Copyright 2014 | Centre for Info Bio Technology (CIBTech) 237
Figure 4: Damodar River at Durgapur barrage to Rhondia weir

International Journal of Geology, Earth & Environmental Sciences ISSN: 2277-2081 (Online)
An Open Access, Online International Journal Available at http://www.cibtech.org/jgee.htm
2014 Vol. 4 (3) September-December, pp. 231-243/Soumen
Research Article
© Copyright 2014 | Centre for Info Bio Technology (CIBTech) 238
Figure 5: Stabilization of south of Baramana is very prominent in last 11 years. Fig. B and C, the
SPOT image represents the Bar condition in 11/11/2003 and 18/04/2014 respectively. The channel of
southern side has gradually obsolete due to bar encroachment to the bank. Topographical Map of
1969 has shows prominent channel (Fig. A)

International Journal of Geology, Earth & Environmental Sciences ISSN: 2277-2081 (Online)
An Open Access, Online International Journal Available at http://www.cibtech.org/jgee.htm
2014 Vol. 4 (3) September-December, pp. 231-243/Soumen
Research Article
© Copyright 2014 | Centre for Info Bio Technology (CIBTech) 239
Palla to Paikpara
Palla is a very important location in case of Damodar River. From where the river takes a right angle bent
to southward. The tributaries of Damodar River i.e. Behula Nadi, Kana Nadi, Kunti Nadi were mainly
originate in this section. The tributary rivers are now totally regulated through left- bank embankment.
Major change in river bank is observed at Paikpara (Table 4).
Figure 6: Damodar River at Rhondia wire to Palla

International Journal of Geology, Earth & Environmental Sciences ISSN: 2277-2081 (Online)
An Open Access, Online International Journal Available at http://www.cibtech.org/jgee.htm
2014 Vol. 4 (3) September-December, pp. 231-243/Soumen
Research Article
© Copyright 2014 | Centre for Info Bio Technology (CIBTech) 240
Figure 7: The width of river Damodar decreases at rapid rate at Satyanandapur, Kalimahanpur,
Simultala and Kamalpur char area where these bar are united to form a single Bar. Figure B and C
was taken on 15/11/2001 and 30/03/2014 respectively (SPOT image). Some rivers cut off are totally
stabilized due to sedimentation. Red Circle indicates the stabilized portion of the bar occurred
during last 44 years

International Journal of Geology, Earth & Environmental Sciences ISSN: 2277-2081 (Online)
An Open Access, Online International Journal Available at http://www.cibtech.org/jgee.htm
2014 Vol. 4 (3) September-December, pp. 231-243/Soumen
Research Article
© Copyright 2014 | Centre for Info Bio Technology (CIBTech) 241
Table 4: Width Distribution of Damodar River (Section 4)
Loca
tion
ID
Site
Distance in
km
(From
Damodar
Barakar
Confluence)
Distance in
km
From Palla
River Width in
Metres
Rate of
Widening (metre
/year)
1943 1970 2014
1943
to
1970
1970
to
2014
24 5 km from Palla 147.5 5 466 432 692 -1.30 5.90
25 Near Selimabad 155.5 13 753 657 665 -3.69 0.18
26 Near
Haragobindapur 163.5 21 431 514 727 3.19 4.84
27 At Paikpara 165.5 23 1587 1729 816 5.46 -20.75
(-)Negative signs indicate Deposition or Aggradation of river Bank
Data Source: Toposheet (AMS & SOI) 1943, 1969-70 and LANDSAT 8 satellite data
Figure 8: Damodar River at Palla to Paikpara

International Journal of Geology, Earth & Environmental Sciences ISSN: 2277-2081 (Online)
An Open Access, Online International Journal Available at http://www.cibtech.org/jgee.htm
2014 Vol. 4 (3) September-December, pp. 231-243/Soumen
Research Article
© Copyright 2014 | Centre for Info Bio Technology (CIBTech) 242
Figure 9: Cross section of Damodar at Pre Dam period (1888 and 1956) at Jamalpur
Figure 10: Profile showing present situation of Damodar at Jamalpur, 2011
Figure 11: Longitudinal Profile of Damodar River (Data source ASTER GDEM, 2011)

International Journal of Geology, Earth & Environmental Sciences ISSN: 2277-2081 (Online)
An Open Access, Online International Journal Available at http://www.cibtech.org/jgee.htm
2014 Vol. 4 (3) September-December, pp. 231-243/Soumen
Research Article
© Copyright 2014 | Centre for Info Bio Technology (CIBTech) 243
Conclusion
From very ancient time Damodar River interact with control structures to protect the intense flood. Since
the agricultural prosperity in the region continued for centuries, the Damodar flood plain populated even
in the distance historical past. The paper aims to study of last 60 years, how river were adjusted through
the recent intervention. It’s observed that maximum deposition on bank is located in the second section
and maximum erosion occurred at third section of river. Several mana or river bars are formed due to lack
of water. In those areas, rigorous sand quarrying and agricultural activities (i.e. bars and islands) are
aggravated bank erosion problem (Bhattacharyya, 2011).It is also observed that the wetted perimeter of
river gets decreases at several stretches of the river. Figure 9 & 10 represents the cross section of several
time phases. Year 1888 and 1956 represents prominent erosion but recent profile of 2011 (ASTER
GDEM) represents narrow profile. The trend line of Damodar at selected cross section represents positive
relationship with R2 =0.9946 (Figure 11).
REFERENCES
Bhattacharyya K (2011). The Lower Damodar River, India: Understanding the Human Role in
Changing Fluvial Environment (Springer, New York).
Pal S, Let S and Das P (2012). Assessment of channel width disparity of the major rivers within
Mayurakshi River basin. International Journal of Geology, Earth and Environmental Science 2(3) 1-10.
Morisawa ME (1968). Streams Their Dynamics and Morphology (McGraw-Hill Book Company New
York) 175.
Morisawa M (1985). Rivers (Forms and Processes) (Longman London, New York).
Ghosh S (2012). Identification of fluvial aggradation and degradation using Remote Sensing and GIS: a
case study of Damodar River west Bengal India. International Journal of Geology, Earth and
Environmental Science 2(3) 57-74.
Ghosh S (2013). Flood Hydrology and Risk Assessment- Flood study in a Dam- Controlled River of India
(Lambert, Germany) 137.
Richards KS (1973). Hydraulic geometry and channel roughness – a non-linear system. American
Journal of Science 273 877-896.
Sen PK (1985). The Genesis of Floods in the Lower Damodar Catchment. In: The Concepts and Methods
in Geography, edited by Sen PK (The University of Burdwan, Burdwan) 71-85.
Sen PK (1991). Flood hazards and river bank erosion in the lower Damodar Basin. In: Indian
Geomorphology, edited by Sharma HS (Concept Publishing Company, New Delhi) 95-108.