assessment of business ideas for the productive use of … · assessment of business ideas for the...
TRANSCRIPT
Integrated Southern Africa Business Advisory (INSABA)
Assessment of Business ideas for the productive use of RE in Botswana Report for Deliverable 3.2 and 3.3 Prepared by BOTEC and Gerrit Jacobs, Solar International Botswana Disclaimer: The sole responsibility for the content of this report lies with the authors. It does not necessarily reflect the opinion of the European Communities. The European Commission is not responsible for any use that may be made of the information contained therein.
The authors endeavour to supply reliable analysis and believe that the material it presents is accurate, however, they will not be liable for any claim by any party acting on such information.
Business ideas for productive use of RE in Botswana
INSABA Business ideas 1
Table of Contents Table of Contents ........................................................................................................1 1. Identifying Business ideas for productive use of RE in Botswana ....................2
1.1 Process of identifying project ideas:..............................................................2 1.2 Development of business plans ....................................................................2 1.3 Financing of business ideas..........................................................................3 1.4 Implementation of business plans.................................................................3 1.5 RE Technologies in business ideas ..............................................................4 1.6 Replication ....................................................................................................4
2. Business Plans 2.1 Mobile photo & printing shop - 2.2 Payphone charging - 2.3 Vegetable farm with irrigation - 2.4 Barber shop - 2.5 Khutse lodge with SWH - 2.6 Mobile fruit juice vendor

Business ideas for productive use of RE in Botswana
INSABA Business ideas 2
1. Identifying Business ideas for productive use of RE in Botswana
1.1 Process of identifying project ideas: Some of the initial business ideas had to be abandoned because they did reveal not
to be financially or technically feasible. For example the possibility of installing a solar
water pump in a horticulture project operated by a women’s group was considered.
Unfortunately this was not pursued further as CEDA, the then the only financing
partner in the project (as a member of IAT), does not finance projects owned by
cooperative organizations.
Another ideas followed was an Ostrich farm in Molepolole. However, it has been
established that the energy demand for this project is beyond the capability of solar
energy. The farm uses an incubator for hatching eggs. The farm has no electricity (it
would cost about 375K to connect to the grid) and as a result the incubator is kept in
the nearest village, Molepolole which is about 5km away.
It has been noted that INSABA services need to be marketed rigorously in the
country for entrepreneurs to consider RETs as useful alternatives to conventional
power. Although INSABA-BOTSWANA was advertised in both the media, responses
received were quite low. New partners like the Board of Trade and other vocational
training institutions should be involved.
1.2 Development of business plans After some of the initial business ideas had to be abandoned for reasons as those
mentioned above, business plans have been developed with support if the IA Gerrit
Jacobs from Solar International Botswana. In order to systematically assess the
potential of business ideas, BOTEC developed project descriptions on business
ideas like barber shop, pay-phone charging, vegetable farm with irrigation, tourist
lodge with SWH, battery charging station, chicken farm lighting and PV pumping for
cattle farm. These business ideas were then discussed with potential SME-GS and
data were collected from existing businesses such as horticulture, barber shop, pay
phone. From this information complete business plans have been prepared for the
productive use of renewable energy in:

Business ideas for productive use of RE in Botswana
INSABA Business ideas 3
- Mobile photo & printing shop
- barber shop
- payphone charging
- vegetable farm with irrigation
- Khutse lodge with SWH
- Mobile fruit juice vendor
The development of business plans was considered a breakthrough. The plans
indeed support the concept of productive use of RETs.
1.3 Financing of business ideas Many of the potential businesses assessed during the project would have been
involved in INSABA related projects if funding to purchase RETs systems was readily
available, particularly for very small businesses that require loans less than €1000.
It is understood that financial support is vital for any economic activity and that is why
there are banks and other financial institutions in place. This is mainly true, however,
for small and even medium enterprises because most of them start economic
activities for the first time (Start ups). Generally in most developing countries no
financial institutions are ready to give loans to small and medium sized start-up
enterprises. That is why financial considerations are generally part of RE-strategies.
1.4 Implementation of business plans From all the INSABA-Botswana accepted business, only one i.e. the “Photoshop”
was realized in time e.g. before the official end of the INSABA-projects. The mobile
photo business, which is operating from the bus rank, has been Botswana’s INSABA
success story. The entrepreneur has now started to pay back the loan he acquired to
purchase the photo and solar PV equipment.
It can be stated however, that all projects are very likely to be put in action still 2008
or latest 2009.
The irrigation project could not be realized, because solar pumping presented
physical barriers to the project, but this, by no means, does not mean that Solar

Business ideas for productive use of RE in Botswana
INSABA Business ideas 4
Irrigation will not applied when better conditions are present e.g. a ground-water table
below 100 m.
The INSABA Fresh Fruit Juice Business was stopped by municipal authorities, as
sale of fresh food produced in the street for public consumption is not allowed for
health reasons. Though that type of business is quite frequent in other countries, it
can not be realized in Botswana for the time being.
1.5 RE Technologies in business ideas One can observe a certain concentration by INSABA-Botswana on Solar-Energy
applications. This can be explained by the fact that solar applications are currently
the most supported and mature renewable energy applications in Botswana. From
the group of IATs, INSABA-Botswana worked closely together with the enterprise
Solar International Botswana (SIB) (Pty.) Ltd.
The circumstances are relatively obvious because Botswana is a relatively dry
country where Solar Energy applications have a fair chance in the local energy
market. Furthermore SIB advised INSABA-Zambia as consultant. This intervention is
understood by InWEnt as one of the INSABA success-stories. Additionally a very
fruitful cooperation between Botswana and Namibia started on the Solar-Energy field
as one further positive element in the South-South Cooperation.
Botswana has started investigations in the Biomass-sector1. Jatropha is a topic, but
might have few chances due to high water demand. Probably other autochthones oil-
containing plants may have a better chance to be used as bio-fuel.
1.6 Replication Replication is important for INSABA type of projects. This could be possible if there
are several businesses that are running that other entrepreneurs can copy from.
Entrepreneurs should be encouraged to advise other entrepreneurs. It is very difficult
for individuals and organisations that do not, for instance, have vested interest such
as suppliers or manufacturers, to mentor entrepreneurs.
1 The Feasibility study for the production and use of Biofuels in Botswana, EECG, Box 402339, Gabarone,
Botswana, E-Mail: [email protected]

Business ideas for productive use of RE in Botswana
INSABA Business ideas 5
Organisations such as the Local Enterprise Authority should be lobbied to integrate
INSABAs way of business analysis in their functions. This would go a long way in
marketing the use of Renewable in businesses. BOTEC and Solar International
Botswana could lead this task.
BOTEC will also lead production of a manual with tools, who entrepreneurs can
contact for advice and where the advisors can be located. This will require advising
institutions to commit themselves that they will be available to assist entrepreneurs.

1
Mobile Photo Shop Business Proposal
Business DescriptionMobile Photo Shop business
ProponentArnold Tshwaranang Moleofi is a young motivated entrepreneur who is interested in running amobile photo shop business. He has undergone a Business Studies course and has started acar wash financed through own resources, which is run by family members. He does not have abank account but is considering opening one. Mr. Moleofi has no experience with formal loansbut is well acquainted with cost calculations and marketing since this was part of hisprofessional training.
LocationThe photo shop business is mobile and can be located at shopping malls, bus ranks, trainstations, public and sporting events and other locations where there is a likely market for sellingphotos.
Business FactorsIn Botswana there are no mobile photo shops. Photoshops operate from fixed locations in town centres.However, there are people with instant cameras thatmainly take passport photograph size photos.
The proposed mobile photo shop consists of a digitalcamera and a printer/copier/scanner, which arelocated in a mobile stall. Photos are taken and are printed at the spot. The camera connectsdirectly to the printer, so there is no need for a computer. Other services that are provided areindicated in the box on the right.
Since the business operation is entirely mobile, it can besituated at a location where the market potential is highest. Theequipment is powered from a solar panel and battery.Measurements of the printer show that the power consumptionwhen printing is approximately 300W and when on standby it isapproximately 25W. One 50Wp panel and one 100Ah batteryare sufficient to power the printer. The photos are laminatedusing plastic foil, rather than a thermal process because of thelimited energy that is available from the solar system.
The primary business activity is taking photos. However, theprinter has copying and scanning capabilities, therefore theseservices are also offered.
The photographer will offer different backgrounds for photossuch as the Eiffel Tower and Statue of Liberty when takingphotos. There will also be life size cut-out pictures of popularsoccer and movie stars.
Draft: 31 August 2007
Mobile photo shop services
� Taking photos� Printing photos A4, A5 and A6 size� Laminating photos� Making copies� Scanning documents

2
Pre-AssessmentThe general feasibility of the business idea is established in a pre-feasibility assessment. Anestimation of business requirements and costs is given in the following sections.
Inventory: P1,310 Stall on wheels, chair, umbrella, stand, studio curtains, life sizecut-outs
Equipment: P2,770 Camera and printer/copier, memory card, camera stand
Solar system: P3,660 1x 50Wp solar panel, 1x100Ah battery, Regulator, AA Batterycharger, Inverter
Advertisingmaterial:
P1,200 Advertising display, price list, business cards
Total equipment cost is P8,940. Furthermore, there are variable costs such photo paper,photocopying paper, laminating foil, and printing ink.
Production:A quick estimation of the required number of photos is based on the following parameters.
The highlighted parameters are variables. The expense per photo is an estimate. Based on theabove figures, the operator has to sell 14 photos per day (300 days per year) to cover expensesand pay back the investment.
Operational expenses:� Variable costs that are accounted for in the unit cost.� Storage space is rented for the equipment. Estimated costs P50/month.� The salary of the operator is P1000/month.� Insurance of equipment is P110/month.
Investment live span is taken as 5 years. The solar panels have an estimated life span of 20years but the other equipment such as the camera and printer have a life span which isconsiderably less.
Table1 (pre-assessment) contains all above data. Sensitivity analysis using data in Table 1shows the impact of the various cost factors. Most sensitive elements are price per unit and costper unit. A sensitivity analysis has been carried out using the goal seek function in Excel. Whenselling 10 photos per day, the payback period is 1 year with ROI of 80%, whereas selling 15photos per day gives a payback period of ½ year and ROI of 180%. However, selling 9 photosper day gives a ROI of 30% and a payback period of 2 years. It can be concluded that theproposed business has the potential of being profitable.
Operator income 1,000 P/month
Payback 750 P/month
Income to be generated 1,750 P/month
Days working per month 25 Days/month
Profit to be made per day 70 P/day
Selling price per photo 15 P/photo
Expenses per photo 10 P/photo
Profit per photo 5 P/photo
Photos to be made 14 Photos/day

3
Market AssessmentThere are currently no mobile photo shops operating in the country. Having a mobile photo shophas a great advantage over a shop that has a fixed location since a market can be establishedat a place where it has the highest potential for success e.g. near the National Stadium duringpopular football matches.
The entrepreneur has interviewed owners of photo shops to obtain an idea of possible turnoverand selling prices of photos. He has also interviewed persons that take photos with instantcameras and it appears that producing 10 photos per day with an average selling price of P15per photo is achievable.
Apart from being mobile, it is believed that this business format has another positive edgecompared to a business at a fixed location. Taking photos of people next to a life size cut-out of amovie star or soccer player will attract the attention of people and form a crowd, boosting thenumber of photos that are taken.
Table 2 shows a comparison between the photo business using a solar system and the samebusiness recharging the battery from grid electricity through a commercial operator. In thissituation there is a reduced investment capital since there is no solar equipment required. Alsothere is less equipment to insure and therefore the insurance cost goes down (P600/year).However, due to the deeper discharge of the battery and the higher boost charge from gridelectricity, the battery lifetime is reduced. This has been accounted for (annual replacement costP500, instead of P350). The cost of charging the battery, including transportation is estimated atP20 per charge. The comparison shows that it is more cost effective to charge the battery fromgrid electricity through a commercial operator. The higher ROI is caused by the reduced cost ofcharging the battery. The cost of the solar technology is much higher compared to the recurrentcost of charging the battery and therefore has a negative impact on the ROI. However, it shouldbe noted that charging the battery every two days is very cumbersome since the battery has tobe dropped off in the evening and collected in the morning. If not, two batteries are required. Alsothere are few places where batteries can be charged and transportation costs will be high andthere is an opportunity cost associated with the time that it takes to charge the batteries.
Operational PlanThe business strategy relies on the mobility of the business and the ability of printing photosinstantly. The business should be run in a professional manner in order to succeed. The operatorshould wear a branded uniform and the stall should look neat.
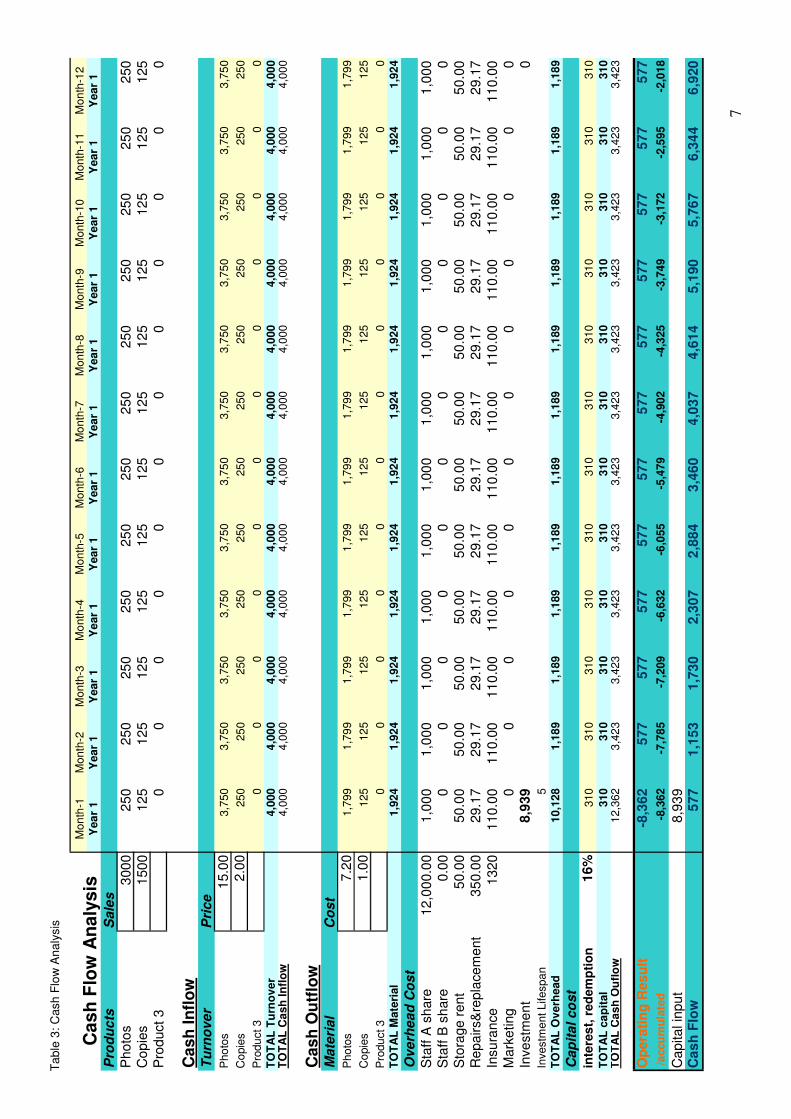
Table 3 gives the cash flow during the first three years of operation. The cash flow analysisindicates clearly, how much financing would be required. Under the prevalent conditions, capitalinfusion of P8,940 would be sufficient. The graphs visualize this business development for thefirst year, and for three years, respectively.
Note that making copies has been added as a second income stream.
Finally, Table 4 gives the profitability forecast and balance for the business start-up.
4
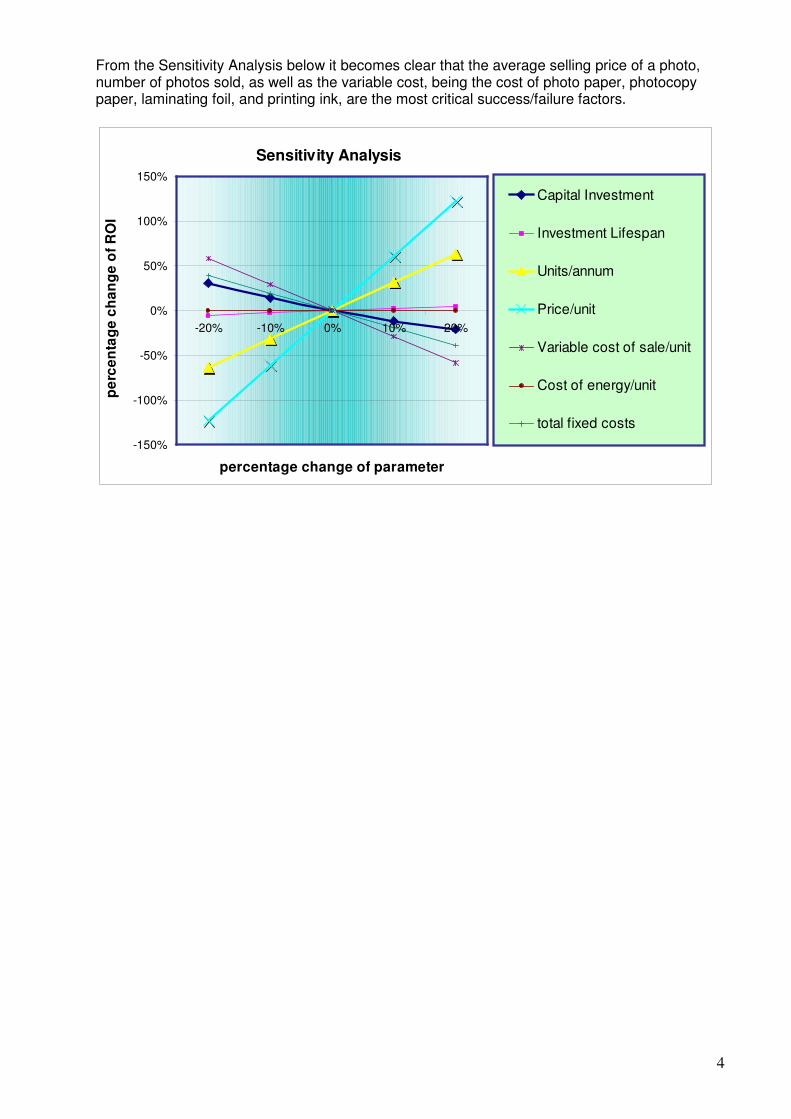
From the Sensitivity Analysis below it becomes clear that the average selling price of a photo,number of photos sold, as well as the variable cost, being the cost of photo paper, photocopypaper, laminating foil, and printing ink, are the most critical success/failure factors.
Sensitivity Analysis
-150%
-100%
-50%
0%
50%
100%
150%
-20% -10% 0% 10% 20%
percentage change of parameter
pe
rce
nta
ge
ch
an
ge
of
RO
I
Capital Investment
Investment Lifespan
Units/annum
Price/unit
Variable cost of sale/unit
Cost of energy/unit
total fixed costs

5
Table 1: Pre-Assessment of the Mobile Photo Shop business described above
INSABA Preassessment of Project Proposals
Country: Botswana
Pilot Region: Gaborone / Main Mall
RE Technology: Solar PV Electricity
Business Idea:
Mobile photo, copying and laminating
busines
Proponent name, contact Mr. Arnold Tshwaranang Moleofi
Years of experience as owner of business 1
Number of employees w/contract 1
Proponent uses bank acount (yes=5, No=0) 0
Experience with formal loan (received=5, applied=3, no=0) 0
Experience in cost calculations, business plans (no=0, several=5) 5
Practice in maintaining/operating equipment (RET) (none yet=0, regularly=5) 3
Total 10
Calculation of ROIDetermination of parameters Definitions
Investment Capital Inventory Stall on wheels, chair, umbrella, stand, studio
curtains, life size cut-outs
Investment Capital EquipmentCamera and printer/copier, memory card, camera
stand
Investment Capital PV solar system1x 50Wp solar panel, 1x100Ah battery, Regulator,
AA Battery charger, Inverter
Investment Capital Advertising material Advertising display, price list, business cards
Investment Capital Total of stall, inventory, equipment and PV Total cost of investment
Investment
LifespanConservative average life
Life of the investment - i.e. period before it must
be replaced
Photos Photos per day
Production Photos per year Operational 300 days per year
Price/unit Average sales price per photo
Revenue BWP This is net revenue
Variable cost/unit Average cost per photoCost per unit produced e.g. material, processing
packaging
Cost of energy/unit No other energy Costs of power, fuel added to variable cost
Fixed costRent for storage space to store the table, chair
and umbrellaRent
Insurance of equipment
Fixed cost Battery replacement Battery replaced once every 2 years
Salary for employee Wages
Fixed cost Salary for owner/operator Wages
Total fixed costsAnnual indirect costs such as rent, telephones,
salaries
Amortization/unit: 0.60 1,788 Amount needed per unit to cover investment in
lifetime
Direct costs per
unit:7.79 23,376
Variable costs plus amortization plus cost of
energy
Gross Margin/unit 7.21 Sales price per unit less the direct costs per unit
Fixed costs/unit 4.76Total fixed costs divided by the number of units
produced
Total costs 12.55 37,646 Direct costs plus fixed costs
Net Margin 2.45 7,354 Revenue less total costs
ROIReturn on Investment = net margin divided by
capital investment
Payback period
years
capital investment divided by cash flow until intial
expenses are compensated by the net margin
82%
14,270.00
0.98
Photo Shop BWP
8,938.85
5
3000
1,310.00
3,659.95
2,768.90
10
1,200.00
600
12,000.00
350.00
15.00
45,000
7.20
0
0.00
1320

6
Table 2: Competitive Analysis: Comparison between the mobile photo shop business using solarPV electricity and the same business recharging the battery from grid electricity
INSABA Verification & Market-Assessment of Project Proposals
Country: Botswana
Pilot Region: Gaborone
RE Technology: Solar PV Electricity
Business Idea: Mobile photo, copying and laminating business
Market Context : describeMarket Size & Potential
Market Need, Risk
Competitor
Competing Technology
Appropriateness of RET
Market Segment
Main Differentiator
Sustainable Production
Photo shop charging on grid electricity
Calculation of Competitiveness Compared to photo shop with solarDescription of Alternative
Investment Capital Photo shop charging battery with grid electricity
Investment
LifespanLifespan of equipment
Production Production is not effected by energy source
Price/unit
Revenue BWP
Variable cost/unit
Cost of energy/unit Battery is charged once every 2 days at a cost
of P20 per charge, including transportation
Fixed costs Wages, rent and replacement costs are not
effected by how the battery is charged
Total fixed costs Total fixed costs
Amortization/unit: 0.60 1,788 0.35 1,056
Direct costs per
unit:7.79 23,376 8.55 25,644
Gross Margin/unit 7.21 6.45
Fixed costs/unit 4.57 4.57
Total costs 12.36 37,076 13.11 39,344
Net Margin 2.64 7,924 1.89 5,656
ROI
Payback period
years
13,700 13,700
15.00
45,000
7.20
1.00
15.00
45,000
7.20
0
Alternative: no solar
5,279
5
3,000
13,700
The higher ROI is caused by the reduced cost
of charging the battery. The cost of the solar
technology is much higher compared to the
recurrent cost of charging the battery and
therefor has a negative impact on the ROI.
However, it should be noted that charging the
battery every two days is very cumbersome
since the battery has to be dropped off in the
evening and collected in the morning. If not,
two batteries are required. Also there are few
places where batteries can be charged and
transportation costs will be high and there is an
opportunity cost associated with the time that it
takes to charge the batteries.
89%
0.92
13,700
107%
0.79
Photo shop
8,939
5
3,000
Because the photo shop is powered by solar energy, it makes it mobile. Shop can
operate in villages where there is no grid electricity.
Photo shops with grid electricity may operate cheaper. Risk of RE system being stolen.
Ease of operation since there is no need for recharging the battery using grid electricity.
The shop is mobile.
Battery needs recycling but this also applies to system that does not use RE.
There are no mobile photo shops in Gaborone. Due to the mobility of the shop the
entrepreneur can go to places where the likelyhood of a sufficient market is highest.
This model can be replicated for any locations in Botswana, where there is sufficient
market. If more photos per day are required, an additional solar panel may be added to
supply the energy.
There is a risk that the Town Council will not allow the photo shop to operate at plublic
places.
There are a number of people operating with instant cameras. There is also cometition
from people working from fixed locations.
See above
7
Ta
ble
3:
Cash
Flo
w A
na
lysis
Mon
th-1
Month
-2M
onth
-3M
onth
-4M
onth
-5M
onth
-6M
onth
-7M
on
th-8
Month
-9M
onth
-10
Month
-11
Mon
th-1
2
Yea
r 1
Year
1Y
ear
1Y
ear
1Y
ear
1Y
ear
1Y
ear
1Y
ea
r 1
Year
1Y
ear
1Y
ea
r 1
Year
1
Pro
du
cts
Sale
s
Ph
oto
s3
00
02
50
25
025
02
50
25
02
50
25
02
50
250
25
02
50
250
Co
pie
s1
50
01
25
12
512
51
25
12
51
25
12
51
25
125
12
51
25
125
Pro
duct
30
00
00
00
00
00
0
Cas
h I
nfl
ow
Tu
rno
ve
rP
ric
e
Pho
tos
15.0
03,7
50
3,7
50
3,7
50
3,7
50
3,7
50
3,7
50
3,7
50
3,7
50
3,7
50
3,7
50
3,7
50
3,7
50
Co
pie
s2.0
0250
25
0250
250
250
25
0250
250
25
0250
250
25
0
Pro
du
ct 3
00
00
00
00
00
00
TO
TA
L T
urn
ov
er
4,0
00
4,0
00
4,0
00
4,0
00
4,0
00
4,0
00
4,0
00
4,0
00
4,0
00
4,0
00
4,0
00
4,0
00
TO
TA
L C
ash
In
flo
w4,0
00
4,0
00
4,0
00
4,0
00
4,0
00
4,0
00
4,0
00
4,0
00
4,0
00
4,0
00
4,0
00
4,0
00
Cas
h O
utf
low
Mate
rial
Co
st
Pho
tos
7.2
01,7
99
1,7
99
1,7
99
1,7
99
1,7
99
1,7
99
1,7
99
1,7
99
1,7
99
1,7
99
1,7
99
1,7
99
Co
pie
s1.0
0125
12
5125
125
125
12
5125
125
12
5125
125
12
5
Pro
du
ct 3
00
00
00
00
00
00
TO
TA
L M
ate
rial
1,9
24
1,9
24
1,9
24
1,9
24
1,9
24
1,9
24
1,9
24
1,9
24
1,9
24
1,9
24
1,9
24
1,9
24
Ov
erh
ea
d C
os
t
Sta
ff A
sh
are
12
,00
0.0
01,0
00
1,0
00
1,0
00
1,0
00
1,0
00
1,0
00
1,0
00
1,0
00
1,0
00
1,0
00
1,0
00
1,0
00
Sta
ff B
sh
are
0.0
00
00
00
00
00
00
0
Sto
rage r
en
t5
0.0
050
.00
50
.00
50
.00
50
.00
50
.00
50
.00
50.0
05
0.0
05
0.0
05
0.0
050
.00
50
.00
Re
pa
irs&
rep
lace
me
nt
35
0.0
029
.17
29
.17
29
.17
29
.17
29
.17
29
.17
29.1
72
9.1
72
9.1
72
9.1
729
.17
29
.17
Insu
ran
ce
132
01
10
.00
11
0.0
01
10
.00
110
.00
11
0.0
01
10
.00
11
0.0
011
0.0
01
10
.00
11
0.0
01
10
.00
11
0.0
0
Mark
eting
00
00
00
00
00
00
Inve
stm
en
t8,9
39
0In
vestm
ent Lifespa
n5
TO
TA
L O
verh
ead
10,1
28
1,1
89
1,1
89
1,1
89
1,1
89
1,1
89
1,1
89
1,1
89
1,1
89
1,1
89
1,1
89
1,1
89
Ca
pit
al
co
st
inte
res
t, r
ed
em
pti
on
16
%310
31
0310
310
310
31
0310
310
31
0310
310
31
0
TO
TA
L c
ap
ital
310
31
0310
310
310
31
0310
310
31
0310
310
31
0T
OT
AL
Ca
sh
Ou
flo
w1
2,3
62
3,4
23
3,4
23
3,4
23
3,4
23
3,4
23
3,4
23
3,4
23
3,4
23
3,4
23
3,4
23
3,4
23
Op
era
tin
g R
es
ult
-8,3
62
57
757
75
77
57
75
77
57
75
77
577
57
75
77
577
/a
ccu
mu
late
d-8
,362
-7,7
85
-7,2
09
-6,6
32
-6,0
55
-5,4
79
-4,9
02
-4,3
25
-3,7
49
-3,1
72
-2,5
95
-2,0
18
Ca
pita
l in
pu
t8,9
39
Ca
sh
Flo
w5
77
1,1
53
1,7
30
2,3
07
2,8
84
3,4
60
4,0
37
4,6
14
5,1
90
5,7
67
6,3
44
6,9
20
Cash
Flo
w A
naly
sis
8
Ca
sh
Flo
w A
na
lys
is:
Fir
st
Ye
ar
0
10,0
00
20,0
00
30,0
00
40,0
00
50,0
00
60,0
00
Month
-1M
onth
-2M
onth
-3M
onth
-4M
onth
-5M
onth
-6M
onth
-7M
onth
-8M
onth
-9M
onth
-10
Month
-11
Month
-12
-10,0
00
-8,0
00
-6,0
00
-4,0
00
-2,0
00
02,0
00
4,0
00
6,0
00
8,0
00
TO
TA
L C
ash Inflow
, acc
TO
TA
L C
ash O
utf
low
, acc
Opera
ting R
esult
Opera
ting R
esult, acc
Cash F
low

9
Cash
Flo
w A
naly
sis
: 1st
- 3rd
Year
0
10,0
00
20,0
00
30,0
00
40,0
00
50,0
00
60,0
00
Year
1Y
ear
2Y
ear
3
-5,0
00
05,0
00
10,0
00
15,0
00
20,0
00
25,0
00
TO
TA
L C
ash Inflow
TO
TA
L C
ash O
utf
low
Opera
ting R
esult
Opera
ting R
esult, acc
Cash F
low

10
Ta
ble
4:
Pro
fita
bili
ty a
nd
Ba
lan
ce F
ore
cast
Pro
fita
bil
ity P
revie
wB
ala
nce
Year
1Y
ear
2Y
ear
3Y
ear
1
48,0
00
48,0
00
48,0
00
Asse
tsL
iab
ilitie
s
23,0
88
23,0
88
23,0
88
fixe
d a
sse
ts7
,15
1sh
are
ho
lde
rs e
qu
ity
8,1
12
24
,91
22
4,9
12
24
,91
2cu
rre
nt
asse
ts6
,92
0lia
bili
tie
s5
,95
9
00
0S
14
,07
2S
14
,07
2
12,0
00
12,0
00
12,0
00
00
0Y
ear
2
350
350
350
Asse
tsL
iab
ilitie
s
1,3
20
1,3
20
1,3
20
fixe
d a
sse
ts5
,36
3sh
are
ho
lde
rs e
qu
ity
16
,22
5
00
0cu
rre
nt
asse
ts1
3,8
41
liab
ilitie
s2
,98
0
600
600
600
S1
9,2
04
S1
9,2
04
742
742
742
1,7
88
1,7
88
1,7
88
Year
3
00
0A
sse
tsL
iab
ilitie
s16,8
00
16,8
00
16,8
00
fixe
d a
sse
ts3
,57
6sh
are
ho
lde
rs e
qu
ity
24
,33
7
8,1
12
8,1
12
8,1
12
cu
rre
nt
asse
ts2
0,7
61
liab
ilitie
s0
/accum
ula
ted
8112.3
116224.6
124336.9
2S
24
,33
7S
24
,33
7
Sa
les
Co
st
of
Sa
les
Gro
ss
pro
fit
oth
er
opera
ting incom
e
pe
rso
nn
el co
sts
hire
ch
arg
es
co
mm
un
ica
tio
n
ve
hic
le
ma
rke
tin
g
off
ice
an
nu
al
su
rplu
s/d
efi
cit
inte
rest
de
pre
cia
tio
n
oth
er
exp
en
se
s
TO
TA
L E
xp
en
ses
1
Business Proposal Barber Shop
Business DescriptionPayphone Business
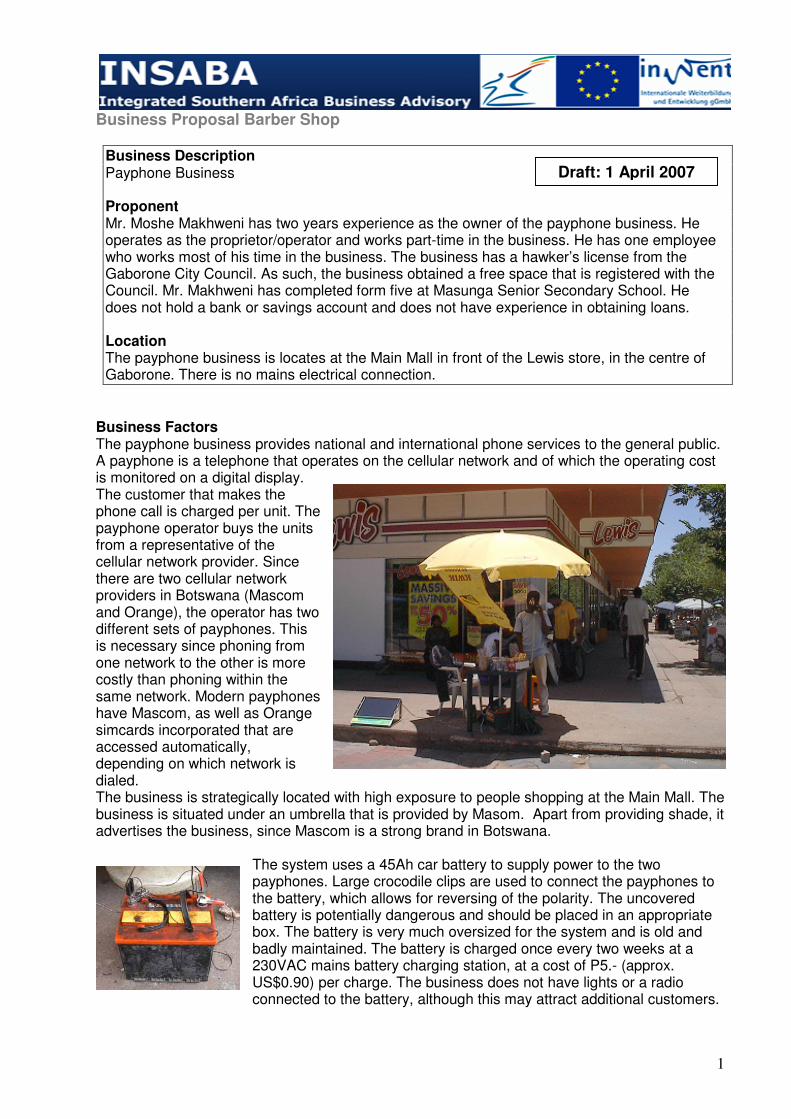
ProponentMr. Moshe Makhweni has two years experience as the owner of the payphone business. Heoperates as the proprietor/operator and works part-time in the business. He has one employeewho works most of his time in the business. The business has a hawker’s license from theGaborone City Council. As such, the business obtained a free space that is registered with theCouncil. Mr. Makhweni has completed form five at Masunga Senior Secondary School. Hedoes not hold a bank or savings account and does not have experience in obtaining loans.
LocationThe payphone business is locates at the Main Mall in front of the Lewis store, in the centre ofGaborone. There is no mains electrical connection.
Business FactorsThe payphone business provides national and international phone services to the general public.A payphone is a telephone that operates on the cellular network and of which the operating costis monitored on a digital display.The customer that makes thephone call is charged per unit. Thepayphone operator buys the unitsfrom a representative of thecellular network provider. Sincethere are two cellular networkproviders in Botswana (Mascomand Orange), the operator has twodifferent sets of payphones. Thisis necessary since phoning fromone network to the other is morecostly than phoning within thesame network. Modern payphoneshave Mascom, as well as Orangesimcards incorporated that areaccessed automatically,depending on which network isdialed.The business is strategically located with high exposure to people shopping at the Main Mall. Thebusiness is situated under an umbrella that is provided by Masom. Apart from providing shade, itadvertises the business, since Mascom is a strong brand in Botswana.
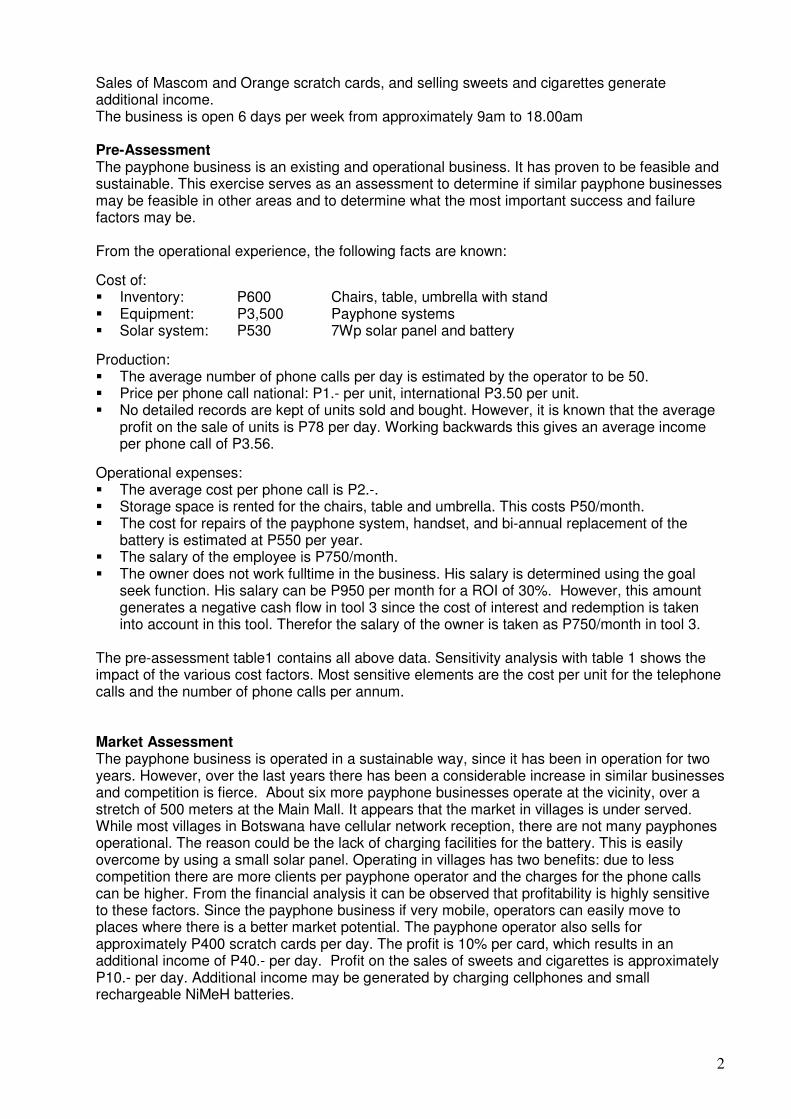
The system uses a 45Ah car battery to supply power to the twopayphones. Large crocodile clips are used to connect the payphones tothe battery, which allows for reversing of the polarity. The uncoveredbattery is potentially dangerous and should be placed in an appropriatebox. The battery is very much oversized for the system and is old andbadly maintained. The battery is charged once every two weeks at a230VAC mains battery charging station, at a cost of P5.- (approx.US$0.90) per charge. The business does not have lights or a radioconnected to the battery, although this may attract additional customers.
Draft: 1 April 2007
2
Sales of Mascom and Orange scratch cards, and selling sweets and cigarettes generateadditional income.The business is open 6 days per week from approximately 9am to 18.00am
Pre-AssessmentThe payphone business is an existing and operational business. It has proven to be feasible andsustainable. This exercise serves as an assessment to determine if similar payphone businessesmay be feasible in other areas and to determine what the most important success and failurefactors may be.
From the operational experience, the following facts are known:
Cost of:� Inventory: P600 Chairs, table, umbrella with stand� Equipment: P3,500 Payphone systems� Solar system: P530 7Wp solar panel and battery
Production:� The average number of phone calls per day is estimated by the operator to be 50.� Price per phone call national: P1.- per unit, international P3.50 per unit.� No detailed records are kept of units sold and bought. However, it is known that the average
profit on the sale of units is P78 per day. Working backwards this gives an average incomeper phone call of P3.56.
Operational expenses:� The average cost per phone call is P2.-.� Storage space is rented for the chairs, table and umbrella. This costs P50/month.� The cost for repairs of the payphone system, handset, and bi-annual replacement of the
battery is estimated at P550 per year.� The salary of the employee is P750/month.� The owner does not work fulltime in the business. His salary is determined using the goal
seek function. His salary can be P950 per month for a ROI of 30%. However, this amountgenerates a negative cash flow in tool 3 since the cost of interest and redemption is takeninto account in this tool. Therefor the salary of the owner is taken as P750/month in tool 3.
The pre-assessment table1 contains all above data. Sensitivity analysis with table 1 shows theimpact of the various cost factors. Most sensitive elements are the cost per unit for the telephonecalls and the number of phone calls per annum.
Market AssessmentThe payphone business is operated in a sustainable way, since it has been in operation for twoyears. However, over the last years there has been a considerable increase in similar businessesand competition is fierce. About six more payphone businesses operate at the vicinity, over astretch of 500 meters at the Main Mall. It appears that the market in villages is under served.While most villages in Botswana have cellular network reception, there are not many payphonesoperational. The reason could be the lack of charging facilities for the battery. This is easilyovercome by using a small solar panel. Operating in villages has two benefits: due to lesscompetition there are more clients per payphone operator and the charges for the phone callscan be higher. From the financial analysis it can be observed that profitability is highly sensitiveto these factors. Since the payphone business if very mobile, operators can easily move toplaces where there is a better market potential. The payphone operator also sells forapproximately P400 scratch cards per day. The profit is 10% per card, which results in anadditional income of P40.- per day. Profit on the sales of sweets and cigarettes is approximatelyP10.- per day. Additional income may be generated by charging cellphones and smallrechargeable NiMeH batteries.
3
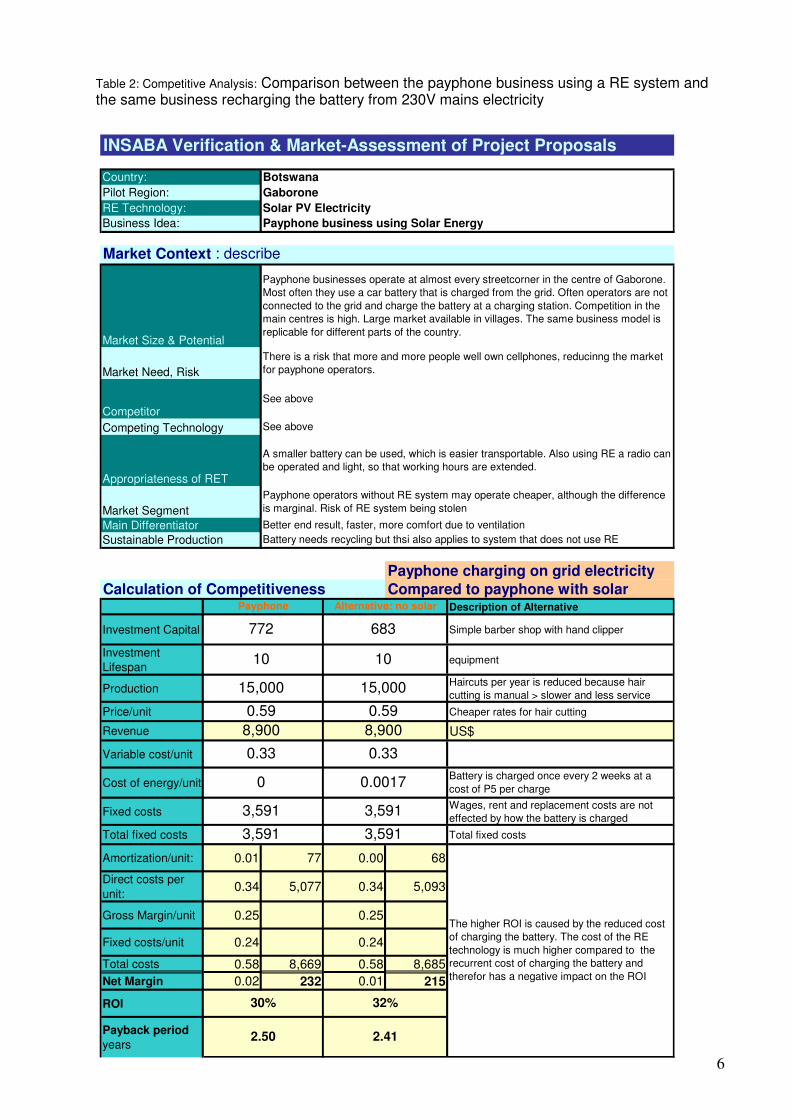
Table 2 shows a comparison between the payphone business using an RE system and the samebusiness recharging the battery from 230VAC mains electricity. The higher ROI for the latter iscaused by the reduced cost of charging the battery. The cost of the RE technology is muchhigher compared to the recurrent cost of charging the battery and therefor has a negative impacton the ROI.
Operational PlanIt appears that awareness regarding the possibility of charging batteries using a solar panel islacking with many payphone operators. Most entrepreneurs use a car battery that they chargeevery number of days. What is required is a product package that offers a the payphone systemtogether with one or two 12VDC lights, a 10Wp solar panel and a 20Ah battery with regulator,that can be offered to the potential users. Therefor what is necessary is:� awareness creation� technology package
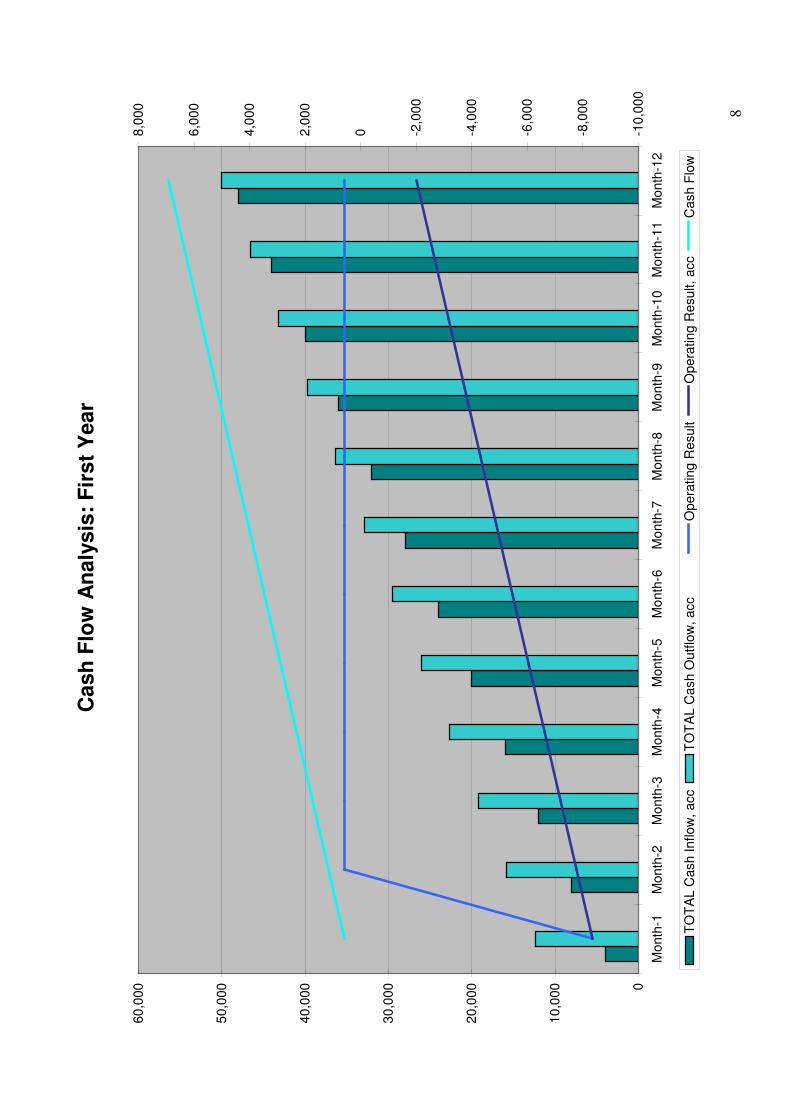
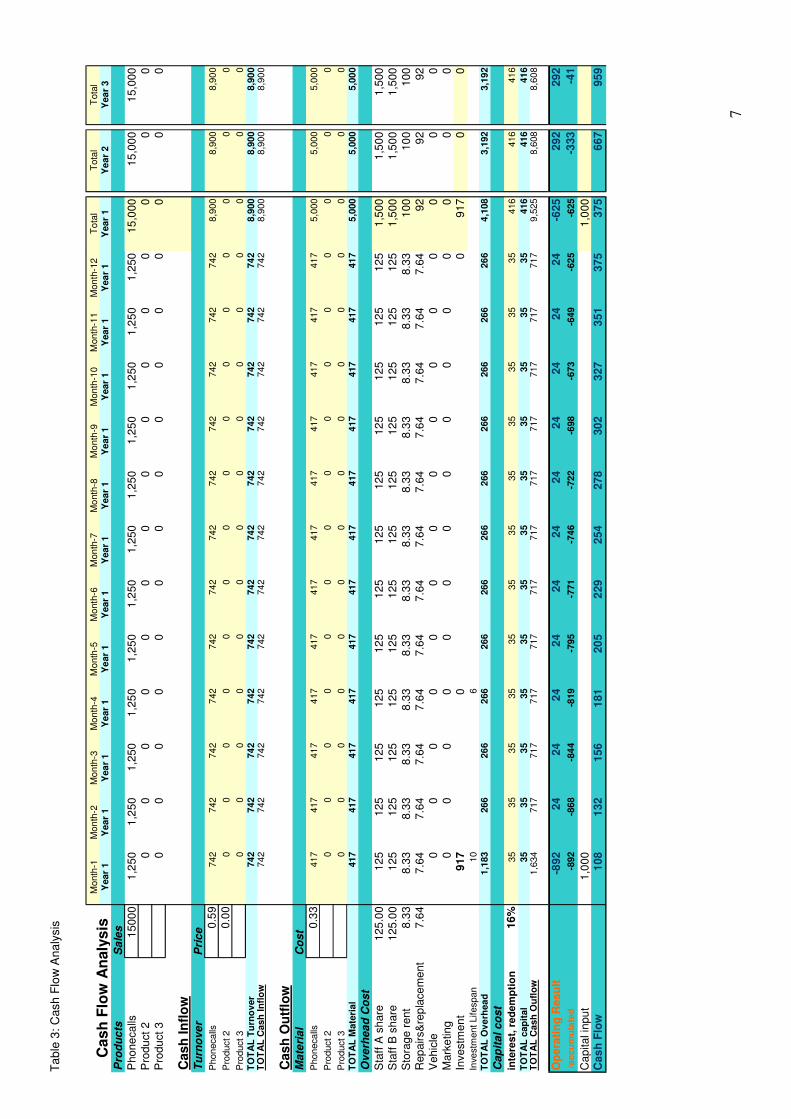
Table 3 gives the cash flow during the first three years of operation. The cash flow analysis at thebottom of the table indicates clearly, how much financing would be required. Under the prevalentconditions, capital infusion of US$1000 would be sufficient. The graphs 4a and 4b visualize thisbusiness development for the first year, and for three years, respectively.Table 4 finally, gives the profitability forecast and balance for the business start-up.
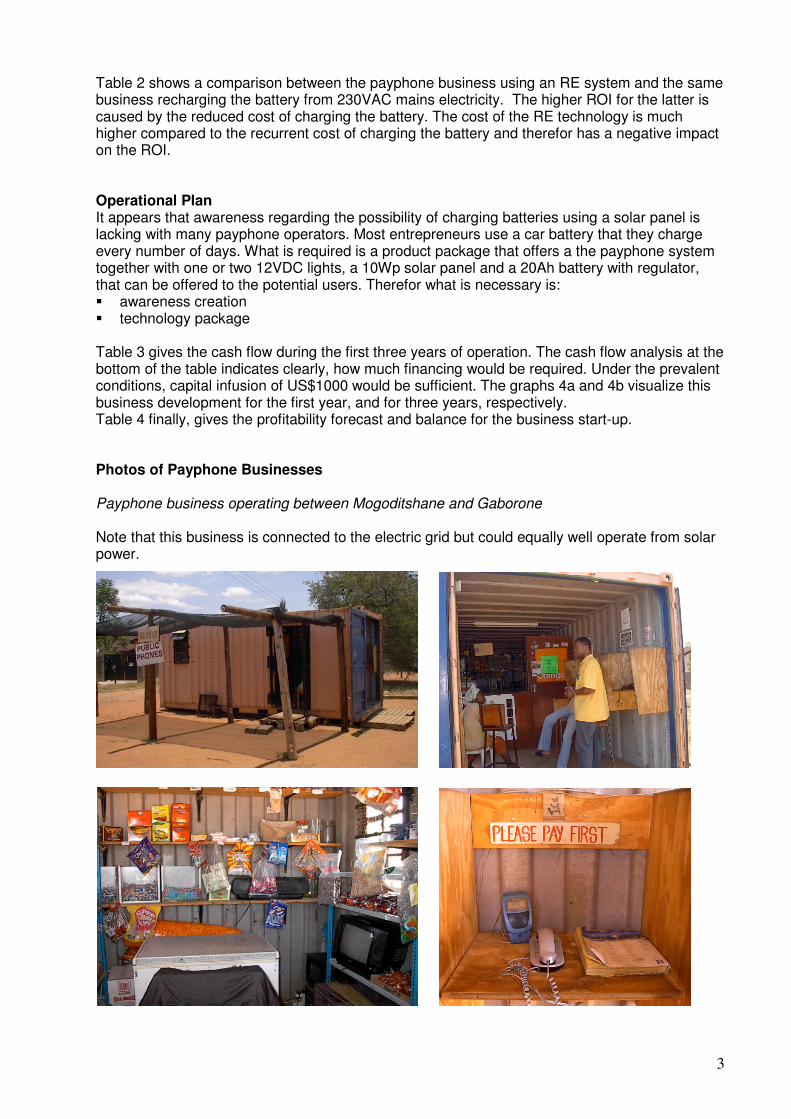
Photos of Payphone Businesses
Payphone business operating between Mogoditshane and Gaborone
Note that this business is connected to the electric grid but could equally well operate from solarpower.

4
Payphone business operating in Mogonye village

5
Table 1: Pre-Assessment of the existing payphone business described above
INSABA Preassessment of Project Proposals
Country: Botswana
Pilot Region: Gaborone / Main Mall
RE Technology: Solar PV Electricity
Business Idea:
Payphone shop shop using Solar
Energy
Proponent name, contact Mr. Moshe Makhweni tel: 71241813 / 71451105
Years of experience as owner of business 2
Number of employees w/contract 0
Proponent uses bank acount (yes=5, No=0) 0
Experience with formal loan (received=5, applied=3, no=0) 0
Experience in cost calculations, business p(no=0, several=5) 2
Practice in maintaining/operating equipment (RET) (none yet=0, regularly=5) 2
Total 6
ROE BW Pula to US$ 6
Calculation of ROIDetermination of parameters Definitions
Investment Capital Inventory The payphone shop operates from under a shade,
2 chairs, table
Investment Capital Equipment Payphone system
Investment Capital PV solar system1x 7Wp solar panel, solar panel stand, 1x50Ah
battery
Investment Capital Total of shop, inventory, equipment and PV Total cost of investment
Investment
LifespanConservative average life
Life of the investment - i.e. period before it must
be replaced
Phonecalls Phonecalls per day
Production Phonecalls per year
Price/unit Average sales price per phonecall
Revenue US$ This is net revenue
Variable cost/unit Average cost per phonecallCost per unit produced e.g. material, processing
packaging
Cost of energy/unit no other energy costs of power, fuel added to variable cost
Fixed costRent for storage space to staore the table,
chairs and umbrellaRent
Fixed costRepairs of system, handset, replacement of the
batteryRepairs and replacements of the battery
Salary for employee Wages
Fixed cost Salary for owner/operator Wages
Total fixed costsAnnual indirect costs such as rent, telephones,
salaries
Amortization/unit: 0.01 77 Amount needed per unit to cover investment in
lifetime
Direct costs per
unit:0.34 5,077
Variable costs plus amortization plus cost of
energy
Gross Margin/unit 0.25 Sales price per unit less the direct costs per unit
Fixed costs/unit 0.24Total fixed costs divided by the number of units
produced
Total costs 0.58 8,669 Direct costs plus fixed costs
Net Margin 0.02 232 Revenue less total costs
ROIReturn on Investment = net margin divided by
capital investment
Payback period
years
capital investment divided by cash flow until intial
expenses are compensated by the net margin
30%
3,591.33
2.50
The salary of the operator was obtained by
using the goalseek function for a ROI of 30%
However, when adding interest and redemption
in Tool 3, this will lead to a negative cashflow.
Therefore monthly salary for the
owner/operator in Tool 3 is taken as
US$1500/yr. Note that the owner only operates
the business part-time.
Payphone Shop US$
771.67
10
15000
100.00
88.33
583.33
50
100
1899.67
91.67
0.59
8,900
0.33
0
1500.00
6
Table 2: Competitive Analysis: Comparison between the payphone business using a RE system andthe same business recharging the battery from 230V mains electricity
INSABA Verification & Market-Assessment of Project Proposals
Country: Botswana
Pilot Region: Gaborone
RE Technology: Solar PV Electricity
Business Idea: Payphone business using Solar Energy
Market Context : describe
Market Size & Potential
Market Need, Risk
Competitor
Competing Technology
Appropriateness of RET
Market Segment
Main Differentiator
Sustainable Production
Payphone charging on grid electricity
Calculation of Competitiveness Compared to payphone with solarDescription of Alternative
Investment Capital Simple barber shop with hand clipper
Investment
Lifespanequipment
ProductionHaircuts per year is reduced because hair
cutting is manual > slower and less service
Price/unit Cheaper rates for hair cutting
Revenue US$
Variable cost/unit
Cost of energy/unitBattery is charged once every 2 weeks at a
cost of P5 per charge
Fixed costs Wages, rent and replacement costs are not
effected by how the battery is charged
Total fixed costs Total fixed costs
Amortization/unit: 0.01 77 0.00 68
Direct costs per
unit:0.34 5,077 0.34 5,093
Gross Margin/unit 0.25 0.25
Fixed costs/unit 0.24 0.24
Total costs 0.58 8,669 0.58 8,685
Net Margin 0.02 232 0.01 215
ROI
Payback period
years
Payphone businesses operate at almost every streetcorner in the centre of Gaborone.
Most often they use a car battery that is charged from the grid. Often operators are not
connected to the grid and charge the battery at a charging station. Competition in the
main centres is high. Large market available in villages. The same business model is
replicable for different parts of the country.
There is a risk that more and more people well own cellphones, reducinng the market
for payphone operators.
See above
See above
A smaller battery can be used, which is easier transportable. Also using RE a radio can
be operated and light, so that working hours are extended.
Payphone operators without RE system may operate cheaper, although the difference
is marginal. Risk of RE system being stolen
Better end result, faster, more comfort due to ventilation
Battery needs recycling but thsi also applies to system that does not use RE
Payphone
772
10
15,000
3,591
The higher ROI is caused by the reduced cost
of charging the battery. The cost of the RE
technology is much higher compared to the
recurrent cost of charging the battery and
therefor has a negative impact on the ROI
30%
2.50
3,591
32%
2.41
Alternative: no solar
683
10
15,000
3,591 3,591
0.59
8,900
0.33
0.0017
0.59
8,900
0.33
0
7
Ta
ble
3:
Cash
Flo
w A
na
lysis
Month
-1M
on
th-2
Mon
th-3
Mo
nth
-4M
onth
-5M
onth
-6M
on
th-7
Mo
nth
-8M
onth
-9M
onth
-10
Month
-11
Mon
th-1
2
Year
1Y
ear
1Y
ea
r 1
Ye
ar
1Y
ear
1Y
ear
1Y
ear
1Y
ea
r 1
Ye
ar
1Y
ear
1Y
ear
1Y
ea
r 1
Pro
du
cts
Sa
les
Phone
calls
1500
01
,250
1,2
50
1,2
50
1,2
50
1,2
50
1,2
50
1,2
50
1,2
50
1,2
50
1,2
50
1,2
50
1,2
50
Pro
du
ct 2
00
00
00
00
00
00
Pro
du
ct 3
00
00
00
00
00
00
Cash
In
flo
wT
urn
ov
er
Pri
ce
Phon
eca
lls0
.59
742
742
74
27
42
742
742
74
27
42
742
742
742
74
2
Pro
duct 2
0.0
00
00
00
00
00
00
0
Pro
duct 3
00
00
00
00
00
00
TO
TA
L T
urn
ov
er
742
742
74
27
42
742
742
74
27
42
742
742
742
74
2T
OT
AL
Cash
In
flo
w742
742
74
27
42
742
742
74
27
42
742
742
742
74
2
Cas
h O
utf
low
Mate
rial
Co
st
Phon
eca
lls0
.33
417
417
41
74
17
417
417
41
74
17
417
417
417
41
7
Pro
duct 2
00
00
00
00
00
00
Pro
duct 3
00
00
00
00
00
00
TO
TA
L M
ate
ria
l417
417
41
74
17
417
417
41
74
17
417
417
417
41
7
Ov
erh
ea
d C
ost
Sta
ff A
share
125
.00
125
125
125
125
12
51
25
125
125
12
51
25
125
125
Sta
ff B
share
125
.00
125
125
125
125
12
51
25
125
125
12
51
25
125
125
Sto
rage r
ent
8.3
38.3
38.3
38.3
38
.33
8.3
38.3
38.3
38.3
38
.33
8.3
38.3
38.3
3
Rep
airs&
rep
lace
ment
7.6
47.6
47.6
47.6
47
.64
7.6
47.6
47.6
47.6
47
.64
7.6
47.6
47.6
4
Vehic
le0
00
00
00
00
00
0
Mark
eting
00
00
00
00
00
00
Investm
en
t9
17
00
Inve
stm
en
t Lifespan
10
6
TO
TA
L O
ve
rhea
d1
,183
266
26
62
66
266
266
26
62
66
266
266
266
26
6
Cap
ital
co
st
inte
res
t, r
ed
em
pti
on
16%
35
35
35
35
35
35
35
35
35
35
35
35
TO
TA
L c
ap
ital
35
35
35
35
35
35
35
35
35
35
35
35
TO
TA
L C
ash
Ou
flo
w1
,634
717
71
77
17
717
717
71
77
17
717
717
717
71
7
Op
era
tin
g R
esu
lt-8
92
24
24
24
24
24
24
24
24
24
24
24
/a
ccu
mu
late
d-8
92
-868
-84
4-8
19
-795
-771
-74
6-7
22
-698
-673
-649
-62
5
Cap
ital in
pu
t1
,000
Cas
h F
low
108
132
156
181
20
52
29
254
278
30
23
27
351
375
Cash
Flo
w A
naly
sis
To
tal
Tota
lT
ota
l
Year
1Y
ear
2Y
ea
r 3
15
,000
15
,00
01
5,0
00
00
0
00
0
8,9
00
8,9
00
8,9
00
00
0
00
0
8,9
00
8,9
00
8,9
00
8,9
00
8,9
00
8,9
00
5,0
00
5,0
00
5,0
00
00
0
00
0
5,0
00
5,0
00
5,0
00
1,5
00
1,5
00
1,5
00
1,5
00
1,5
00
1,5
00
100
10
0100
92
92
92
00
0
00
09
17
00
4,1
08
3,1
92
3,1
92
416
416
41
6
416
416
41
69
,525
8,6
08
8,6
08
-625
29
2292
-625
-333
-41
1,0
00
375
66
7959

8
Ca
sh
Flo
w A
naly
sis
: F
irst
Year
0
2,0
00
4,0
00
6,0
00
8,0
00
10,0
00
12,0
00
Mo
nth
-1M
onth
-2M
onth
-3M
onth
-4M
onth
-5M
onth
-6M
onth
-7M
onth
-8M
on
th-9
Mon
th-1
0M
onth
-11
Mo
nth
-12
-1,0
00
-800
-600
-400
-200
0200
400
600
TO
TA
L C
ash In
flow
, acc
TO
TA
L C
ash O
utf
low
, a
cc
Ope
rating
Re
sult
Opera
ting R
esult,
acc
Cash
Flo
w

9
Ca
sh
Flo
w A
naly
sis
: 1
st
- 3rd
Yea
r
8,0
00
8,2
00
8,4
00
8,6
00
8,8
00
9,0
00
9,2
00
9,4
00
9,6
00
Year
1Y
ea
r 2
Year
3
-800
-600
-400
-200
0200
400
600
800
1,0
00
1,2
00
TO
TA
L C
ash Inflow
TO
TA
L C
ash O
utf
low
Opera
ting R
esult
Opera
ting R
esult, acc
Cash F
low

10
Ta
ble
4:
Pro
fita
bili
ty a
nd
Ba
lan
ce F
ore
cast
Pro
fita
bilit
y P
revie
wB
ala
nce
Year
1Y
ear
2Y
ear
3Y
ear
1
8,9
00
8,9
00
8,9
00
Asse
tsL
iab
ilitie
s
5,0
00
5,0
00
5,0
00
fixe
d a
ssets
82
5sh
are
ho
lders
equity
53
4
3,9
00
3,9
00
3,9
00
cu
rre
nt
asse
ts3
75
liab
ilitie
s6
67
00
0S
1,2
00
S1
,20
0
3,0
00
3,0
00
3,0
00
00
0Y
ear
2
92
92
92
Asse
tsL
iab
ilitie
s
00
0fixe
d a
ssets
73
3sh
are
ho
lders
equity
1,0
67
00
0cu
rre
nt
asse
ts6
67
liab
ilitie
s3
33
100
10
01
00
S1
,40
1S
1,4
01
83
83
83
92
92
92
Year
3
00
0A
sse
tsL
iab
ilitie
s3,3
66
3,3
66
3,3
66
fixe
d a
ssets
64
2sh
are
ho
lders
equity
1,6
01
53
45
34
53
4cu
rre
nt
asse
ts9
59
liab
ilitie
s0
/accum
ula
ted
533.6
710
67.3
31
601.0
0S
1,6
01
S1
,60
1
Sa
les
Co
st
of
Sa
les
Gro
ss
pro
fit
oth
er
opera
ting inco
me
pers
onn
el co
sts
hire
char g
es
com
mu
nic
atio
n
ve
hic
le
ma
rke
tin
g
off
ice
an
nu
al
su
rplu
s/d
efi
cit
inte
rest
de
pre
cia
tio
n
oth
er
exp
en
ses
TO
TA
L E
xp
en
ses
1
Vegetable Farm using Drip Irrigation Business Proposal
Business DescriptionVegetable farm using drip irrigation
ProponentMrs. Sibanda has only one year experience as the owner of the vegetable farm named “KhodaAgencies”. She is assisted by a team from the National Masterplan for the Arable Agricultureand Dairy (Nampaad), who also developed the business plan for the vegetable farm. Mrs.Sibanda is chairlady of the Glenvaley farmers association. She managed to develop the farmand turn it into a profitable business within one year. She was a paid employee before shestarted the vegetable farm and has a diploma in marketing. The farm is financed through theCitizen Entrepreneurial Development Agency (CEDA) and has 6 employees.
LocationThe vegetable farm is located on the outskirts of Otse (55km from Gaborone), South-East ofthe village centre.
Business FactorsThe vegetable farm consists of threedistinct areas:� Open field with drip irrigation� Net house with drip irrigation� Covered area with hydroponics
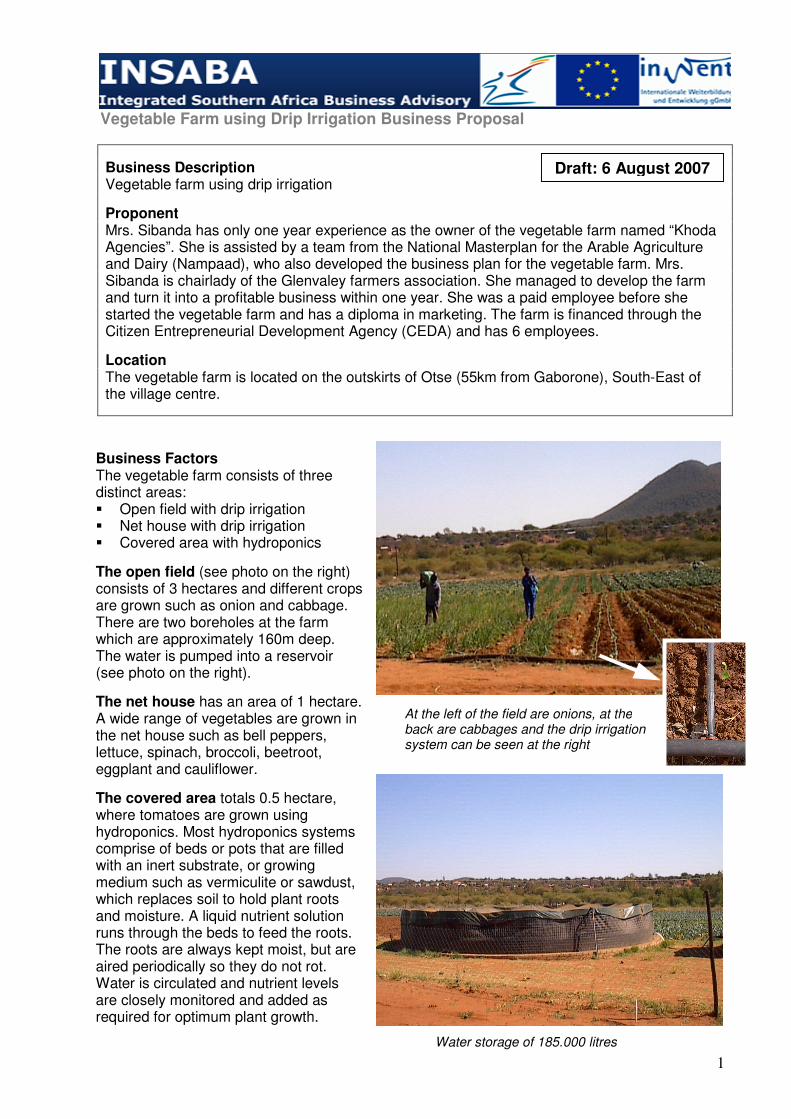
The open field (see photo on the right)consists of 3 hectares and different cropsare grown such as onion and cabbage.There are two boreholes at the farmwhich are approximately 160m deep.The water is pumped into a reservoir(see photo on the right).
The net house has an area of 1 hectare.A wide range of vegetables are grown inthe net house such as bell peppers,lettuce, spinach, broccoli, beetroot,eggplant and cauliflower.
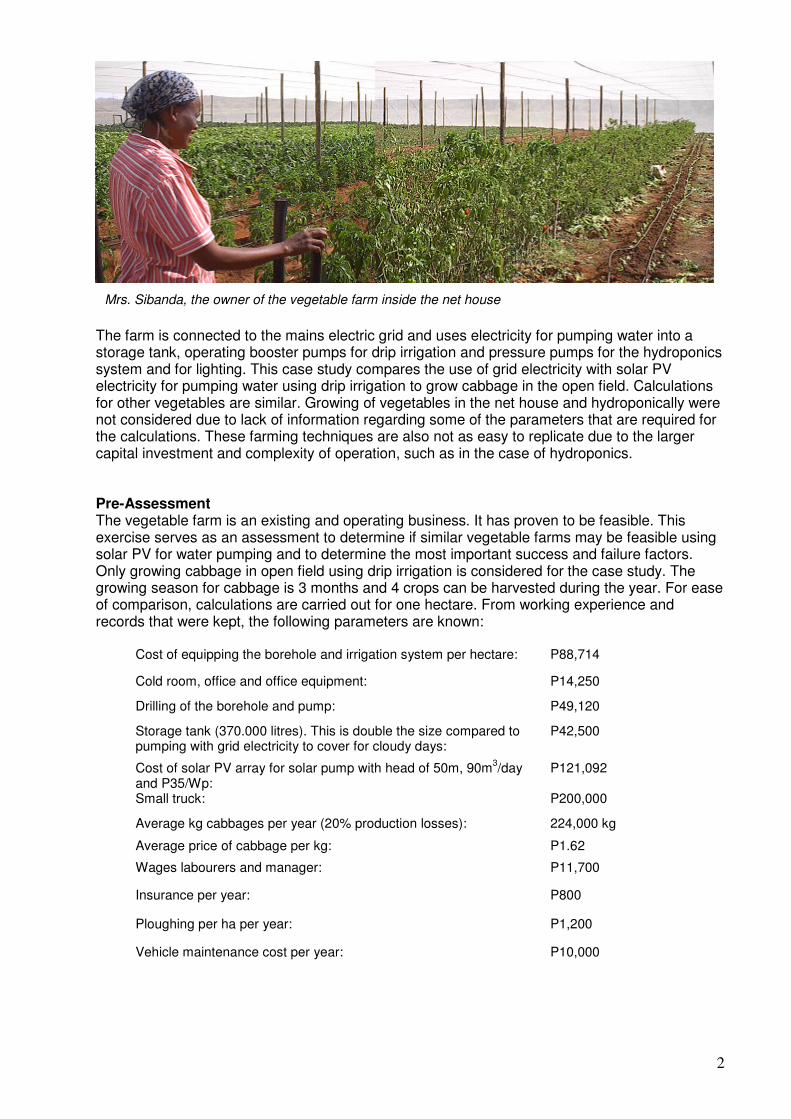
The covered area totals 0.5 hectare,where tomatoes are grown usinghydroponics. Most hydroponics systemscomprise of beds or pots that are filledwith an inert substrate, or growingmedium such as vermiculite or sawdust,which replaces soil to hold plant rootsand moisture. A liquid nutrient solutionruns through the beds to feed the roots.The roots are always kept moist, but areaired periodically so they do not rot.Water is circulated and nutrient levelsare closely monitored and added asrequired for optimum plant growth.
Draft: 6 August 2007
At the left of the field are onions, at theback are cabbages and the drip irrigationsystem can be seen at the right
Water storage of 185.000 litres
2
The farm is connected to the mains electric grid and uses electricity for pumping water into astorage tank, operating booster pumps for drip irrigation and pressure pumps for the hydroponicssystem and for lighting. This case study compares the use of grid electricity with solar PVelectricity for pumping water using drip irrigation to grow cabbage in the open field. Calculationsfor other vegetables are similar. Growing of vegetables in the net house and hydroponically werenot considered due to lack of information regarding some of the parameters that are required forthe calculations. These farming techniques are also not as easy to replicate due to the largercapital investment and complexity of operation, such as in the case of hydroponics.
Pre-AssessmentThe vegetable farm is an existing and operating business. It has proven to be feasible. Thisexercise serves as an assessment to determine if similar vegetable farms may be feasible usingsolar PV for water pumping and to determine the most important success and failure factors.Only growing cabbage in open field using drip irrigation is considered for the case study. Thegrowing season for cabbage is 3 months and 4 crops can be harvested during the year. For easeof comparison, calculations are carried out for one hectare. From working experience andrecords that were kept, the following parameters are known:
Cost of equipping the borehole and irrigation system per hectare: P88,714
Cold room, office and office equipment: P14,250
Drilling of the borehole and pump: P49,120
Storage tank (370.000 litres). This is double the size compared topumping with grid electricity to cover for cloudy days:
P42,500
Cost of solar PV array for solar pump with head of 50m, 90m3/day
and P35/Wp:P121,092
Small truck: P200,000
Average kg cabbages per year (20% production losses): 224,000 kg
Average price of cabbage per kg: P1.62
Wages labourers and manager: P11,700
Insurance per year: P800
Ploughing per ha per year: P1,200
Vehicle maintenance cost per year: P10,000
Mrs. Sibanda, the owner of the vegetable farm inside the net house

3
Based on these figures a Pre-Assessment of the vegetable farm using drip irrigation with solarPV was carried out. Results are shown in Table 1. Also calculations were carried out comparinggrid electricity with PV solar electricity. Results of this assessment are shown in Table 2.
Table 3 below shows a comparison between the two sources of energy.
Solar PV Electricity GridElectricity
ROI 44% 63%
Paybackperiod (yrs) 1.81 1.35
It can be observed that growing vegetables in both cases is highly profitable. The largeinvestment for the solar panels has a limited impact on the ROI. The reason for this can beobserved from the sensitivity analysis below Table 3. The cost of energy/unit has only a limitedinfluence on the change of ROI.
Market AssessmentMost of the vegetables are sold to the supermarketchains in Gaborone. Limited amounts are sold from thefarm to local customers. The vegetables aretransported in a small truck (bakkie). Since Mrs.Sibanda resides in Gaborone, she drives backward andforward between Otse and Gaborone and takes loadsof vegetables with her. There is not a plannedmarketing strategy and marketing is mostly donethrough word-of-mouth. The demand is currently higherthan supply therefore there are no problems selling thevegetables the market. Late payments for the sales ofvegetables sometimes cause problems.
Seedlings are bought and readily available. To reducecosts, the farm will grow their own seedlings from seedsfor most vegetables in the future.
The cost of chemicals and fertilisers is perceived as very high and it was expressed thatgovernment should subsidise these items to help farmers.
Covered areas where tomatoes are grown using hydroponics
Harvested and packed cabbagesready to be marketed

4
Operational PlanThe vegetable farm managed to develop into a successful business within a year, mainly due theenergetic input from Mrs. Sibanda. Although she did not have any prior farming experience, shestarted the business, and through her background in marketing and good communication skills,she managed to access the market easily and obtain information from experts as required.
Strategic choices have been made to spread risk. Farming is carried out using differenttechnologies, e.g. open field with drip irrigation, net house with drip irrigation and covered areawith hydroponics. Risk is further spread through growing different type of crops.
With the feasibility and viability firmly established in Tables 1 to 3, table 4 gives the dynamicdevelopment of income and cost during the first three years of operation. The cash flow analysisshows how much financing is required, which is P511,000. The graphs visualize this businessdevelopment for the first year and the first 3 years. Finally, Table 5 gives the profitability forecastand balance for the business.

5
Table 1: Pre-Assessment of vegetable farm using drip irrigation with solar PV electricity
INSABA Preassessment of Project Proposals
Country: Botswana
Pilot Region: South East district, Otse
RE Technology: Solar PV pump
Business Idea: Vegetable Farm with drip irrigation
Proponent name, contact Mrs Sibanda
Years of experience as owner of business 1
Number of employees w/contract 6
Proponent uses bank acount (yes=5, No=0) 5
Experience with formal loan (received=5, applied=3, no=0) 5
Experience in cost calculations, business plans (no=0, several=5) 3
Practice in maintaining/operating equipment (RET) (none yet=0, regularly=5) 0
Total 20
Calculation of ROIDetermination of parameters Definitions
Investment Capital Cost of equipping the borehole and irrigation
system per hectare
Investment Capital Cold room, office and office equipment
Investment Capital Drilling of the borehole and pump Depth of b.h. is 162 m
Investment Capital Storage tank (370.000 litres). This is double the
size compared to pumping with grid electricity
to cover for cloudy days.
Investment Capital Cost of solar PV array for solar pump with head
of 50m, 90m3/day and P35/Wp
Investment Capital Small truck
Total Investment
Capital Total cost of investment
Investment
Lifespan7 year loan period plus 2 years grace period for
CEDA loan
Life of the investment - i.e. period before it must
be replaced
ProductionAverage kg cabbages per year (20%
production losses)Units produced per year
Price/unit Average price of cabbage per kg Sales price per unit produced and sold
Revenue Pula/year Sales price multiplied by number of units sold
Variable cost/unit Cabbage seedlings
Variable cost/unit Fertiliser
Variable cost/unit Pest control
Variable cost/unit Transport cost
Total Variable
cost/unit
Cost per unit produced e.g. material, processing
packaging
Cost of energy/unit Cost of electricity per kg producedCosts solar PV averaged over 20 yr, fuel for car
added to variable cost
Fixed costs Wages labourers and manager Annnual
Fixed costs Insurance per year Annnual
Fixed costs Ploughing per ha per year Annnual
Fixed costs Vehicle maintenance Annnual
Total fixed costs Total fixed costs per yearAnnual indirect costs such as rent, telephones,
salaries
Amortization/unit: 0.26 57,297 Amount needed per unit to cover investment in
lifetime
Direct costs per
unit:0.55 122,349
Variable costs plus amortization plus cost of
energy
Gross Margin/unit 1.07 Sales price per unit less the direct costs per unit
Fixed costs/unit 0.11Total fixed costs divided by the number of units
produced
Total costs 0.65 146,049 Direct costs plus fixed costs
Net Margin 0.97 216,831 Revenue less total costs
BWP
515,676
88,714
49,120
14,250
42,500
121,092
200,000
Note that all calculations are per hectare
with the exception of the drilling and
equiping of the borehole
11,700
800
23,700
1,200
10,000
0.00
0.1714
0.0301
9
224000
1.62
362,880
0.0536
0.0354
0.29

6
Table 2: Pre-Assessment of vegetable farm using drip irrigation with grid electricity
INSABA Preassessment of Project Proposals
Country: Botswana
Pilot Region: South East district, Otse
RE Technology: Grid Electricity
Business Idea: Vegetable Farm with drip irrigation
Proponent name, contact Mrs Sibanda
Years of experience as owner of business 1
Number of employees w/contract 6
Proponent uses bank acount (yes=5, No=0) 5
Experience with formal loan (received=5, applied=3, no=0) 5
Experience in cost calculations, business plans (no=0, several=5) 3
Practice in maintaining/operating equipment (RET) (none yet=0, regularly=5) 0
Total 20
Calculation of ROI for Grid ElectricityDetermination of parameters Definitions
Investment Capital Cost of equipping the borehole and irrigation
system per hectare
Investment Capital Cold room, office and office equipment
Investment Capital Drilling of the borehole and pump Depth of b.h. is 162 m
Investment Capital Storage tank (185.000 litres)
Total Investment
Capital Small truck
Total Investment
Capital Total cost of investment
Investment
Lifespan
7 year loan period plus 2 years grace period for
CEDA loan
Life of the investment - i.e. period before it must
be replaced
ProductionAverage kg cabbages per year (20%
production losses)Units produced per year
Price/unit Average price of cabbage per kg Sales price per unit produced and sold
Revenue Pula/year Sales price multiplied by number of units sold
Variable cost/unit Cabbage seedlings
Variable cost/unit Fertiliser
Variable cost/unit Pest control
Variable cost/unit Transport cost
Total Variable
cost/unit
Cost per unit produced e.g. material, processing
packaging
Cost of energy/unit Cost of electricity per kg producedCosts of electric energy, fuel for car added to
variable cost
Fixed costs Wages labourers and manager Annnual
Fixed costs Insurance per year Annnual
Fixed costs Ploughing per ha per year Annnual
Fixed costs Vehicle maintenance Annnual
Total fixed costs Total fixed costs per yearAnnual indirect costs such as rent, telephones,
salaries
Amortization/unit: 0.19 41,482 Amount needed per unit to cover investment in
lifetime
Direct costs per
unit:0.51 113,734
Variable costs plus amortization plus cost of
energy
Gross Margin/unit 1.11 Sales price per unit less the direct costs per unit
Fixed costs/unit 0.11Total fixed costs divided by the number of units
produced
Total costs 0.61 137,434 Direct costs plus fixed costs
Net Margin 1.01 225,446 Revenue less total costs
ROIReturn on Investment = net margin divided by
capital investment
0.0321
0.1714
0.0301
9
224000
1.62
362,880
0.0536
0.0354
0.29
Note that all calculations are per hectare
with the exception of the drilling and
equiping of the borehole
11,700
800
60%
23,700
1,200
10,000
BWP
373,334
88,714
49,120
14,250
21,250
200,000

7
Table 3: Competitive Analysis
INSABA Verification & Market-Assessment of Project Proposals
Country: Botswana
Pilot Region: South East district, Otse
RE Technology: Mains Electricity
Business Idea: Vegetable Farm with drip irrigation
Market Context : describeMarket Size & Potential
Market Need, Risk
Competitor
Competing Technology
Appropriateness of RET
Market Segment
Main Differentiator
Sustainable Production
Irrigation with solar PV pump
Calculation of Competitiveness Compared to irrigation with grid el.Description of Alternative
Investment Capital Pump that operates on grid electricity
Investment
Lifespan7 year loan period plus 2 years grace period for
CEDA loan
ProductionAverage kg cabbages per year (20%
production losses)
Price/unit Average price of cabbage per kg
Revenue BWP
Variable cost/unit
Cost of energy/unitCost of grid electricity per cabbage produced
Fixed costs Wages labourers and manager
Fixed costs Insurance per year
Fixed costs Ploughing per ha per year
Total fixed costs Total fixed costs
Amortization/unit: 0.26 57,297 0.19 41,482
Direct costs per
unit:0.55 122,349 0.51 113,734
Gross Margin/unit 1.07 1.11
Fixed costs/unit 0.06 0.06
Total costs 0.61 136,049 0.57 127,434
Net Margin 1.01 226,831 1.05 235,446
ROI
There appears sufficient potential for vegatable gardening using drip irrigation. The
business is scalable to a certain degree. When more energy is required due to an
increase of cultivated land area, solar panels may be added as long as the pump can
handle the increased power, provided this has been considered when purchasing the
pump. The same business model is replicable for different parts of the country.
However, pumping head is an important parameter deteriming the Wp of solar panels
required.
The demand for fresh vegetables overrides the supply in Botswana and there is a large
market for fresh vegetables. Presently fresh vegetables are imported from South
Africa, where the conditions of growing vegetables may be better, due to better climatic
and topographic conditions.
There is competition from vegetable farms that are connedted to the mains electric
grid. Also competition from imports from South Africa.
Mains electricity (subsidized) and diesel/petrol pumping.
The water requirement matches the availability of solar energy. In Botswana irrigation is
required almost throughout the year since rainfall is erratic. There is a limitation to the
quantity and head that a solar pump is able to handle.
Pumping with grid electricity and diesel/petrol pump is on demand and therefore less
storage of water is required.
Compared to diesel/petrol pump easier to operate since operation is automatic and no
need for hauling fuel.
n.a.
Solar PV Electricity
515,676
9
224000
1.62
362,880
0.29
0.000
13,700
Due to the high cost of the solar panels the ROI
is less compared to using grid electricity for
water pumping. However, in both cases the
farming of vegetables is very profitable.
44%
13,700
63%
Grid Electricity
373,334
9
224000
1.62
362,880
0.29
0.032
11,700
800
1,200
11,700
800
1,200

8
Cash Flow Analysis: First Year
0
100,000
200,000
300,000
400,000
500,000
600,000
700,000
800,000
900,000
Month-1 Month-2 Month-3 Month-4 Month-5 Month-6 Month-7 Month-8 Month-9 Month-10 Month-11 Month-12
-600,000
-500,000
-400,000
-300,000
-200,000
-100,000
0
100,000
TOTAL Cash Inflow, acc TOTAL Cash Outflow, acc Operating Result Operating Result, acc Cash Flow
Cash Flow Analysis: 1st - 3rd Year
0
100,000
200,000
300,000
400,000
500,000
600,000
700,000
800,000
900,000
Year 1 Year 2 Year 3
-500,000
-400,000
-300,000
-200,000
-100,000
0
100,000
200,000
300,000
TOTAL Cash Inflow TOTAL Cash Outflow Operating Result Operating Result, acc Cash Flow
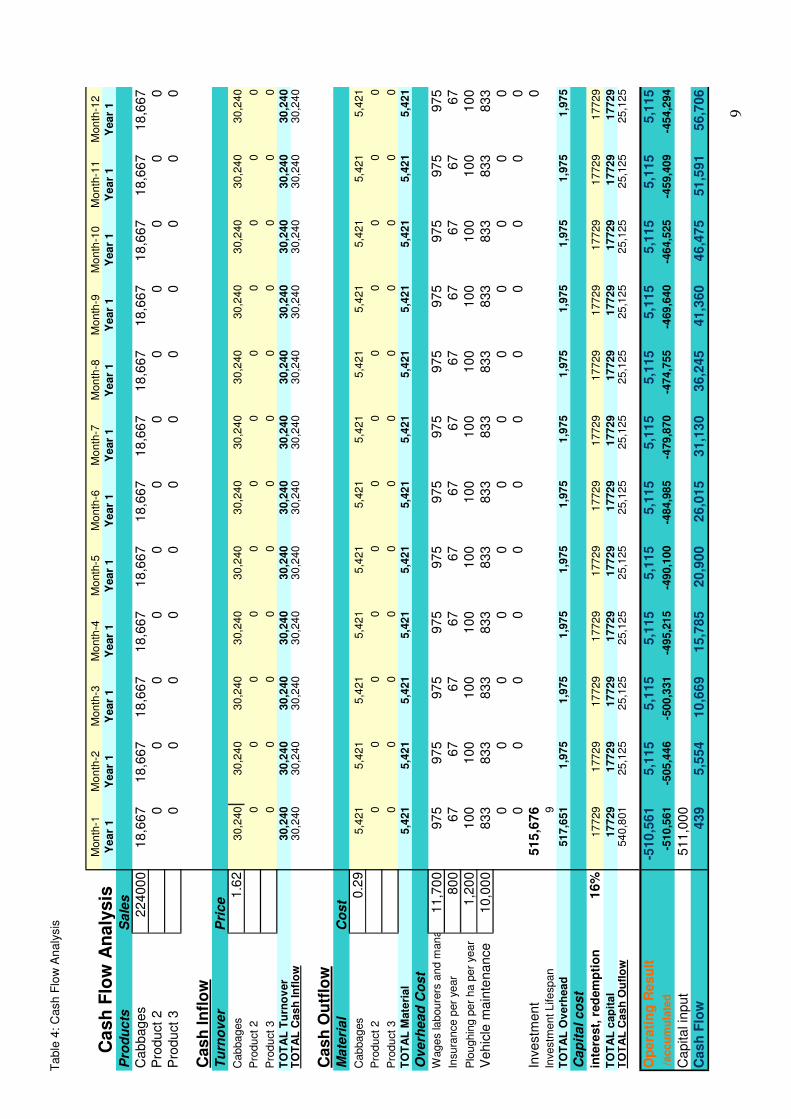
9
Ta
ble
4:
Cash
Flo
w A
na
lysis
Mon
th-1
Mo
nth
-2M
on
th-3
Mo
nth
-4M
onth
-5M
on
th-6
Mo
nth
-7M
on
th-8
Mo
nth
-9M
on
th-1
0M
onth
-11
Mon
th-1
2
Ye
ar
1Y
ear
1Y
ea
r 1
Ye
ar
1Y
ea
r 1
Ye
ar
1Y
ear
1Y
ea
r 1
Ye
ar
1Y
ea
r 1
Ye
ar
1Y
ea
r 1
Pro
du
cts
Sa
les
Ca
bb
ag
es
22
40
00
18
,66
71
8,6
67
18
,66
71
8,6
67
18
,66
71
8,6
67
18
,66
71
8,6
67
18
,66
71
8,6
67
18
,66
71
8,6
67
Pro
du
ct
20
00
00
00
00
00
0
Pro
du
ct
30
00
00
00
00
00
0
Cas
h I
nfl
ow
Tu
rno
ve
rP
ric
e
Ca
bba
ges
1.6
23
0,2
40
30
,24
03
0,2
40
30,2
40
30
,240
30,2
40
30
,24
03
0,2
40
30
,24
03
0,2
40
30,2
40
30
,24
0
Pro
du
ct
20
00
00
00
00
00
0
Pro
du
ct
30
00
00
00
00
00
0
TO
TA
L T
urn
ov
er
30,2
40
30
,24
03
0,2
40
30,2
40
30
,240
30,2
40
30
,24
03
0,2
40
30
,24
03
0,2
40
30,2
40
30
,24
0T
OT
AL
Ca
sh
In
flo
w3
0,2
40
30
,24
03
0,2
40
30,2
40
30
,240
30,2
40
30
,24
03
0,2
40
30
,24
03
0,2
40
30,2
40
30
,24
0
Cas
h O
utf
low
Ma
teri
al
Co
st
Ca
bba
ges
0.2
95
,421
5,4
21
5,4
21
5,4
21
5,4
21
5,4
21
5,4
21
5,4
21
5,4
21
5,4
21
5,4
21
5,4
21
Pro
du
ct
20
00
00
00
00
00
0
Pro
du
ct
30
00
00
00
00
00
0
TO
TA
L M
ate
ria
l5
,421
5,4
21
5,4
21
5,4
21
5,4
21
5,4
21
5,4
21
5,4
21
5,4
21
5,4
21
5,4
21
5,4
21
Ov
erh
ea
d C
os
tW
ag
es la
bou
rers
an
d m
an
age
r 11
,70
09
75
97
59
75
97
59
75
97
59
75
97
59
75
97
59
75
97
5In
su
ran
ce
per
year
80
06
76
76
76
76
76
76
76
76
76
76
76
7
Plo
ugh
ing p
er
ha p
er
yea
r1
,20
01
00
10
01
00
10
01
00
10
01
00
10
01
00
10
01
00
10
0
Ve
hic
le m
ain
ten
an
ce
10
,00
08
33
83
38
33
83
38
33
83
38
33
83
38
33
83
38
33
83
3
00
00
00
00
00
00
00
00
00
00
00
00
Inve
stm
en
t5
15
,67
60
Inve
stm
en
t L
ife
sp
an
9
TO
TA
L O
ve
rhea
d51
7,6
51
1,9
75
1,9
75
1,9
75
1,9
75
1,9
75
1,9
75
1,9
75
1,9
75
1,9
75
1,9
75
1,9
75
Ca
pit
al
co
st
inte
rest,
red
em
pti
on
16
%17
729
177
29
17
729
17
72
91
77
29
17
72
91
77
29
17
729
177
29
17
729
17
72
91
77
29
TO
TA
L c
ap
ita
l 17
729
177
29
17
729
17
72
91
77
29
17
72
91
77
29
17
729
177
29
17
729
17
72
91
77
29
TO
TA
L C
as
h O
ufl
ow
54
0,8
01
25
,12
52
5,1
25
25,1
25
25
,125
25,1
25
25
,12
52
5,1
25
25
,12
52
5,1
25
25,1
25
25
,12
5
Op
era
tin
g R
es
ult
-51
0,5
61
5,1
15
5,1
15
5,1
15
5,1
15
5,1
15
5,1
15
5,1
15
5,1
15
5,1
15
5,1
15
5,1
15
/ac
cu
mu
late
d-5
10
,561
-505
,44
6-5
00
,331
-49
5,2
15
-49
0,1
00
-48
4,9
85
-479
,87
0-4
74
,755
-469
,64
0-4
64
,525
-45
9,4
09
-45
4,2
94
Ca
pita
l in
pu
t5
11
,00
0
Ca
sh
Flo
w4
39
5,5
54
10
,66
91
5,7
85
20
,90
02
6,0
15
31
,13
03
6,2
45
41
,36
04
6,4
75
51
,59
15
6,7
06
Ca
sh
Flo
w A
naly
sis
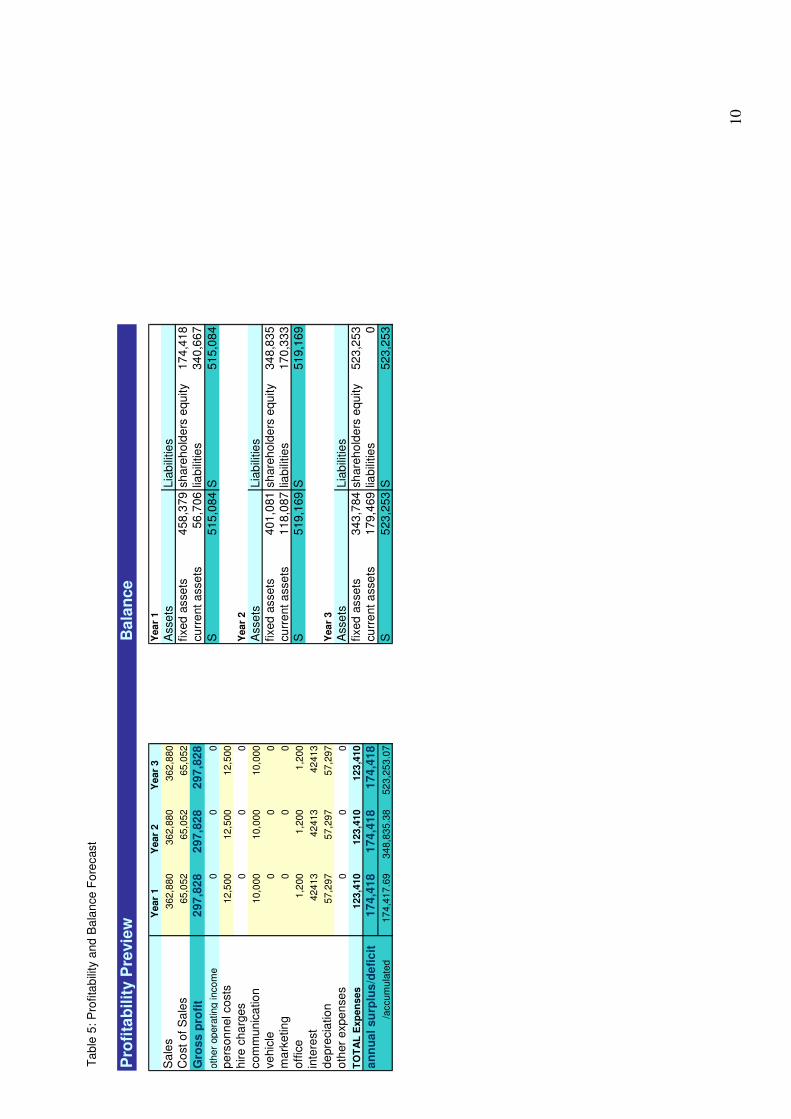
10
Ta
ble
5:
Pro
fita
bili
ty a
nd
Ba
lan
ce
Fo
recast
Pro
fita
bilit
y P
revie
wB
ala
nce
Year
1Y
ear
2Y
ear
3Y
ea
r 1
362,8
80
362,8
80
362
,880
Asse
tsLia
bili
tie
s
65,0
52
65,0
52
65,0
52
fixed
assets
458
,379
sh
are
ho
lde
rs e
quity
17
4,4
18
297
,82
82
97
,82
82
97
,82
8cu
rre
nt
asse
ts56
,706
liab
ilitie
s34
0,6
67
00
0S
515
,084
S51
5,0
84
12,5
00
12,5
00
12,5
00
00
0Y
ea
r 2
10,0
00
10,0
00
10,0
00
Asse
tsLia
bili
tie
s
00
0fixed
assets
401
,081
sh
are
ho
lde
rs e
quity
34
8,8
35
00
0cu
rre
nt
asse
ts1
18
,087
liab
ilitie
s17
0,3
33
1,2
00
1,2
00
1,2
00
S5
19
,169
S51
9,1
69
424
13
42
413
42
413
57,2
97
57,2
97
57,2
97
Yea
r 3
00
0A
sse
tsLia
bili
tie
s
123,4
10
123,4
10
123
,410
fixed
assets
343
,784
sh
are
ho
lde
rs e
quity
52
3,2
53
174
,41
81
74
,41
81
74
,41
8cu
rre
nt
asse
ts1
79
,469
liab
ilitie
s0
/accum
ula
ted
17
4,4
17
.69
34
8,8
35
.38
52
3,2
53
.07
S5
23
,253
S52
3,2
53
Sa
les
Co
st
of
Sa
les
Gro
ss p
rofi
t
oth
er
opera
ting inco
me
pe
rson
nel costs
hire
cha
rges
com
mu
nic
atio
n
ve
hic
le
ma
rke
tin
g
off
ice
an
nu
al
su
rplu
s/d
efi
cit
inte
rest
de
pre
cia
tio
n
oth
er
expe
nse
s
TO
TA
L E
xp
en
ses

1
Business Proposal Barber Shop
Business Description Barber Shop Proponent Mr. Onalenna Ramontshonyana has seven years experience as the owner of the barber shop. He has 3 employees that work on a part-time basis. The shop is registered with the Gaborone Town Council. Mr. Ramontshonyana has accounts with BBS and BSB and has secondary education up to form 2. Location The barber shop is located at the corner of the Kagiso Mall parking lot, opposite the private hospital, in the centre of Gaborone. Although the barber shop is located in Gaborone, there is no mains electrical connection.
Business Factors The barber shop renders barber services such as cutting of hair and shaving. The business is strategically located with high exposure to people shopping at the Kagiso Mall and people visiting the private hospital. The barber shop is housed in a portocabin which the owner obtained on a cash basis in 1999. This portocabin was paid from savings. The barber shop initially used a small generator for powering the business but it was found that the generator had high running costs and was constantly breaking down. In 2000 a solar system was purchased for approximately P5000, consisting of two 50Wp solar panels and one 100Ah batteries and a regulator and inverter. In 2006 the solar panels were stolen since they were not fixed properly on the roof. After this a portable solar panel was used that was placed outside during daytime and taken inside during the night to prevent theft. In December 2006 a new system was installed with four solar panels and four 100Ah batteries. This system is capable of providing sufficient energy for the barber shop, as well as lighting advertising located at the outside of the barber shop. The business is open 7 days per week from 8am to 19.00am There is a good opportunity to generate additional income from payphone operation and cell phone charging. Also the service may be increased by installing ceiling fans to make it more comfortable for the clients. Pre-Assessment The barber shop is an existing and operating business. It has proven to be feasible. This exercise serves as an assessment to determine if similar barber shops may be feasible in other areas and to determine what the most important success and failure factors may be. From the operational experience, the following facts are known: Cost of: Portocabin: P20.000 Inventory: P5.000 solar system: P8.000

2
Production: Number of hair cuts per day: 5/day start of the month, 20/day towards the end of the month Price per haircut: plain P15/cut style P20/cut Number of shaving per month is 50 at P5/shaving
Operational expenses: The owner has 2 to 3 helpers who are paid depending on the number of clients that they serve. It is not
clear how much these helpers earn. They are well known / relatives of the business owner. There is no payment for rent since the portocabin is owned by the entrepreneur. The portocabin is not
insured. Advertising is by word of mouth Approximately P200 is spent on shaving cream, powders, creams, etc. on a monthly basis.
The pre-assessment table1 contains all above data. Then sensitivity analysis with table 1 shows the impact of the various cost factors. Most sensitive elements are the number of haircuts per month, the price per haircut and the wages. Market Assessment There seems sufficient demand for the services that the barber shop is offering since the business has been in operation for over 7 years. Income could increase considerably if there would be more customers earlier in the month. The barber shop serves 20 persons towards the end of the month. This is four times more than in the first half of the month. A better marketing effort could improve this situation. Also there could be a price setting with a discount earlier in the month to attract more customers, to avoid working under-capacity for most of the time. Furthermore a customer loyalty programme could be established where a customer gets a free haircut say every 5th haircut. The existing barber shop is not a typical shop that is normally found in rural villages in Botswana. Most often barber shops operate either from private premises or are set up under a tree with an additional shade. An assessment has also been made for this type of operation and the results are shown in table 2. This operation is further assessed (simple barber shop). Table 3 shows a comparison between the simple barber shop that uses solar energy and a barber shop that uses hand clippers. The comparison shows that the barber shop with hand clippers has less investment cost but also fewer clients due to slower operation of the hand clippers, and as a result fewer clients can be served. Since there is a high sensitivity towards number of clients, this barber shop is not viable. It appears that the investment in a solar powered clipper pays off. Operational Plan It appears that awareness regarding the possibility of using a solar powered hair clipper is lacking with many small barber entrepreneurs. There are a number of entrepreneurs that use a car battery that they charge every number of days. Also there are no 12VDC clippers available in Botswana. What is required is a product package that offers a 12VDC clipper with one or two 12VDC lights, two 50Wp solar panels and two 100Ah batteries that can be offered to the potential users. Therefor what is required is: awareness creation technology package
Table 4 gives the cash flow during the first three years of operation. The cash flow analysis at the bottom of the table indicates clearly, how much financing would be required. Under the prevalent conditions, capital infusion of 1000 Euro would be sufficient. The graphs 4a and 4b visualize this business development for the first year, and for three years, respectively. Table 5 finally, gives the profitability forecast and balance for the business start-up.
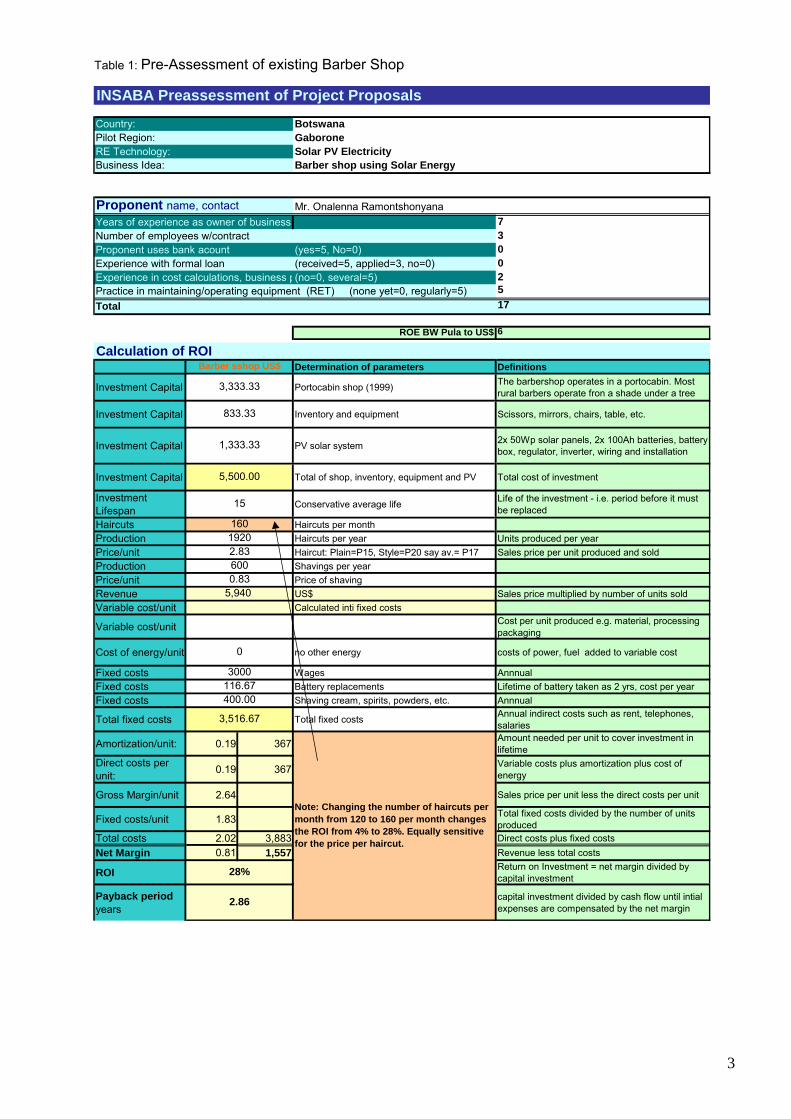
3
Table 1: Pre-Assessment of existing Barber Shop
INSABA Preassessment of Project Proposals
Country: BotswanaPilot Region: GaboroneRE Technology: Solar PV ElectricityBusiness Idea: Barber shop using Solar Energy
Proponent name, contact Mr. Onalenna RamontshonyanaYears of experience as owner of business 7Number of employees w/contract 3Proponent uses bank acount (yes=5, No=0) 0Experience with formal loan (received=5, applied=3, no=0) 0Experience in cost calculations, business p(no=0, several=5) 2Practice in maintaining/operating equipment (RET) (none yet=0, regularly=5) 5Total 17
ROE BW Pula to US$ 6
Calculation of ROIDetermination of parameters Definitions
Investment Capital Portocabin shop (1999) The barbershop operates in a portocabin. Most rural barbers operate fron a shade under a tree
Investment Capital Inventory and equipment Scissors, mirrors, chairs, table, etc.
Investment Capital PV solar system 2x 50Wp solar panels, 2x 100Ah batteries, battery box, regulator, inverter, wiring and installation
Investment Capital Total of shop, inventory, equipment and PV Total cost of investment
Investment Lifespan Conservative average life Life of the investment - i.e. period before it must
be replacedHaircuts Haircuts per monthProduction Haircuts per year Units produced per year Price/unit Haircut: Plain=P15, Style=P20 say av.= P17 Sales price per unit produced and soldProduction Shavings per yearPrice/unit Price of shavingRevenue US$ Sales price multiplied by number of units soldVariable cost/unit Calculated inti fixed costs
Variable cost/unit Cost per unit produced e.g. material, processing packaging
Cost of energy/unit no other energy costs of power, fuel added to variable cost
Fixed costs Wages Annnual Fixed costs Battery replacements Lifetime of battery taken as 2 yrs, cost per yearFixed costs Shaving cream, spirits, powders, etc. Annnual
Total fixed costs Total fixed costs Annual indirect costs such as rent, telephones, salaries
Amortization/unit: 0.19 367 Amount needed per unit to cover investment in lifetime
Direct costs per unit: 0.19 367 Variable costs plus amortization plus cost of
energy
Gross Margin/unit 2.64 Sales price per unit less the direct costs per unit
Fixed costs/unit 1.83 Total fixed costs divided by the number of units produced
Total costs 2.02 3,883 Direct costs plus fixed costsNet Margin 0.81 1,557 Revenue less total costs
ROI Return on Investment = net margin divided by capital investment
Payback period years
capital investment divided by cash flow until intial expenses are compensated by the net margin
3000
400.00
28%
3,516.67
116.67
2.86
Note: Changing the number of haircuts per month from 120 to 160 per month changes the ROI from 4% to 28%. Equally sensitive for the price per haircut.
Barber sshop US$
5,500.00
15
1920
3,333.33
1,333.33
833.33
160
2.83
5,940
0
6000.83

4
Table 2: Pre-Assessment of simple Barber Shop
INSABA Preassessment of Project Proposals
Country: BotswanaPilot Region: Rural AreaRE Technology: Solar PV ElectricityBusiness Idea: Barber shop using Solar Energy
Proponent name, contact Cheaper alternativeYears of experience as owner of business 1Number of employees w/contract 1Proponent uses bank acount (yes=5, No=0) 0Experience with formal loan (received=5, applied=3, no=0) 0Experience in cost calculations, business p(no=0, several=5) 2Practice in maintaining/operating equipment (RET) (none yet=0, regularly=5) 0Total 4
ROE BW Pula to US$ 6
Calculation of ROIDetermination of parameters Definitions
Investment Capital Operates under nylon shade Small shade fixed permanently
Investment Capital Inventory and equipment Scissors, mirrors, chairs, table, etc.
Investment Capital PV solar system 1x 50Wp solar panels, 1x 100Ah batteries, battery box, regulator, inverter, wiring and installation
Investment Capital Total of shop, inventory, equipment and PV Total cost of investment
Investment Lifespan Conservative average life Life of the investment - i.e. period before it must
be replacedHaircuts Haircuts per monthProduction Haircuts per year Units produced per year Price/unit Haircut: Plain=P15, Style=P20 say av.= P17 Sales price per unit produced and soldProduction Shavings per yearPrice/unit Price of shavingRevenue US$ Sales price multiplied by number of units soldVariable cost/unit Calculated inti fixed costs
Variable cost/unit Cost per unit produced e.g. material, processing packaging
Cost of energy/unit no other energy costs of power, fuel added to variable cost
Fixed costs Wages Annnual Fixed costs Battery replacements Lifetime of battery taken as 2 yrs, cost per yearFixed costs Shaving cream, spirits, powders, etc. Annnual
Total fixed costs Total fixed costs Annual indirect costs such as rent, telephones, salaries
Amortization/unit: 0.07 61 Amount needed per unit to cover investment in lifetime
Direct costs per unit: 0.07 61 Variable costs plus amortization plus cost of
energy
Gross Margin/unit 2.77 Sales price per unit less the direct costs per unit
Fixed costs/unit 2.51 Total fixed costs divided by the number of units produced
Total costs 2.58 2,319 Direct costs plus fixed costsNet Margin 0.26 231 Revenue less total costs
ROI Return on Investment = net margin divided by capital investment
Payback period years
capital investment divided by cash flow until intial expenses are compensated by the net margin
1800
400.00
25%
2,258.33
58.33
3.14
Barber Shop US$
916.67
15
900
166.67
583.33
166.67
75
2.83
2,800
0
3000.83

5
Table 3: Competitive Analysis
INSABA Verification & Market-Assessment of Project Proposals
Country: BotswanaPilot Region: GaboroneRE Technology: Solar PV ElectricityBusiness Idea: Barber shop using Solar Energy
Market Context : describe
Market Size & Potential
Market Need, Risk
CompetitorCompeting Technology
Appropriateness of RET
Market SegmentMain DifferentiatorSustainable Production
Manual hand clippersCalculation of Competitiveness Compared to simple Barber Shop
Description of Alternative
Investment Capital Simple barber shop with hand clipper
Investment Lifespan equipemnt
Production Haircuts per year is reduced because hair cutting is manual > slower and less service
Price/unit Cheaper rates for hair cutting
Production Shavings not effected by hair clipper
Price/unit Price of shaving
Revenue US$
Variable cost/unit
Cost of energy/unitdrying of 10 kg lasts 10 h, stove needs 1 kW, price of power is 0,22 €/kWh, therefore costs for power are 2,2 €/kg
Fixed costs Wages not effected by technology
Fixed costs Battery replacements > no batteries
Fixed costs Shaving cream, spirits, powders, etc.
Total fixed costs Total fixed costs
Amortization/unit: 0.07 61 0.04 22 Direct costs per unit: 0.07 61 0.04 22
Gross Margin/unit 2.77 1.96
Fixed costs/unit 2.51 3.50
Total costs 2.58 2,319 3.54 2,122 Net Margin 0.26 231 -1.54 -922 ROI
Payback period years
There appears sufficient potential for Barber Shops. The business is scalable to a certain degree. When more energy is required due to an increase of customers, solar panels and batteries may be added, provided this has been considered when purchasing the regulator and inverter. The same business model is replicable for different parts of the country.
Market needs barbers and with the correct service and price setting there appears little risk
There in competition with barbers that use either clippers opereted from the electric grid, where grid connections are available and hand clippers.
Electricity (subsidized) and human operated hair clippers
Using solar powered clippers compared to hand clippers give better end result and increased speed. Solar system may power light for extended business hours and ventalation for improved comfort.
Barbers with hand clippers may operate cheaper
Better end result, faster, more comfort due to ventilationn.a.
Barber Shop
917
15
9002.83
2,800
0
3000.83
2,258
ROI of alternative barber shop with manual hair clippers is negative due to less customers and reduced price per hair cut. Because of the high sensitivity to these to factors there is a large change in the ROI comparing the two different businesses.
25%
3.14
2,100
-277%
-0.37
Alternative
333
15
6002.00
1,450
0
3000.83
1,80058
400
1,800.000.00
300.00

6
Table 4: Cash Flow Analysis
Month-1 Month-2 Month-3 Month-4 Month-5 Month-6 Month-7 Month-8 Month-9 Month-10 Month-11 Month-12Year 1 Year 1 Year 1 Year 1 Year 1 Year 1 Year 1 Year 1 Year 1 Year 1 Year 1 Year 1
Products SalesHair cuts 50 75 75 75 75 75 75 75 75 75 75 100Shavings 15 25 25 25 25 25 25 25 25 25 25 35Product 3 0 0 0 0 0 0 0 0 0 0 0 0
Cash InflowTurnover PriceHair cuts 2.83 142 212 212 212 212 212 212 212 212 212 212 283Shavings 0.83 12 21 21 21 21 21 21 21 21 21 21 29Product 3 0 0 0 0 0 0 0 0 0 0 0 0TOTAL Turnover 154 233 233 233 233 233 233 233 233 233 233 312TOTAL Cash Inflow 154 233 233 233 233 233 233 233 233 233 233 312
Cash OutflowMaterial CostHair cuts 25 25 25 25 25 25 25 25 25 25 25 25Shavings 8 8 8 8 8 8 8 8 8 8 8 8Product 3 0 0 0 0 0 0 0 0 0 0 0 0TOTAL Material 33 33 33 33 33 33 33 33 33 33 33 33Overhead CostStaff A share 150 150 150 150 150 150 150 150 150 150 150 150Staff BOffice share 0 0 0 0 0 0 0 0 0 0 0 0Communication 0 0 0 0 0 0 0 0 0 0 0 0Vehicle 0 0 0 0 0 0 0 0 0 0 0 0Marketing 0 0 0 0 0 0 0 0 0 0 0 0Investment 917 0 0Investment Lifespan 15 6TOTAL Overhead 1,067 150 150 150 150 150 150 150 150 150 150 150Capital costinterest, redemption 16% 35 35 35 35 35 35 35 35 35 35 35 35TOTAL capital 35 35 35 35 35 35 35 35 35 35 35 35TOTAL Cash Ouflow 1,135 218 218 218 218 218 218 218 218 218 218 218
Operating Result -981 15 15 15 15 15 15 15 15 15 15 94 /accumulated -981 -966 -951 -936 -921 -906 -891 -876 -861 -846 -831 -737Capital input 1,000Cash Flow 19 34 49 64 79 94 109 124 139 154 169 263
Cash Flow Analysis
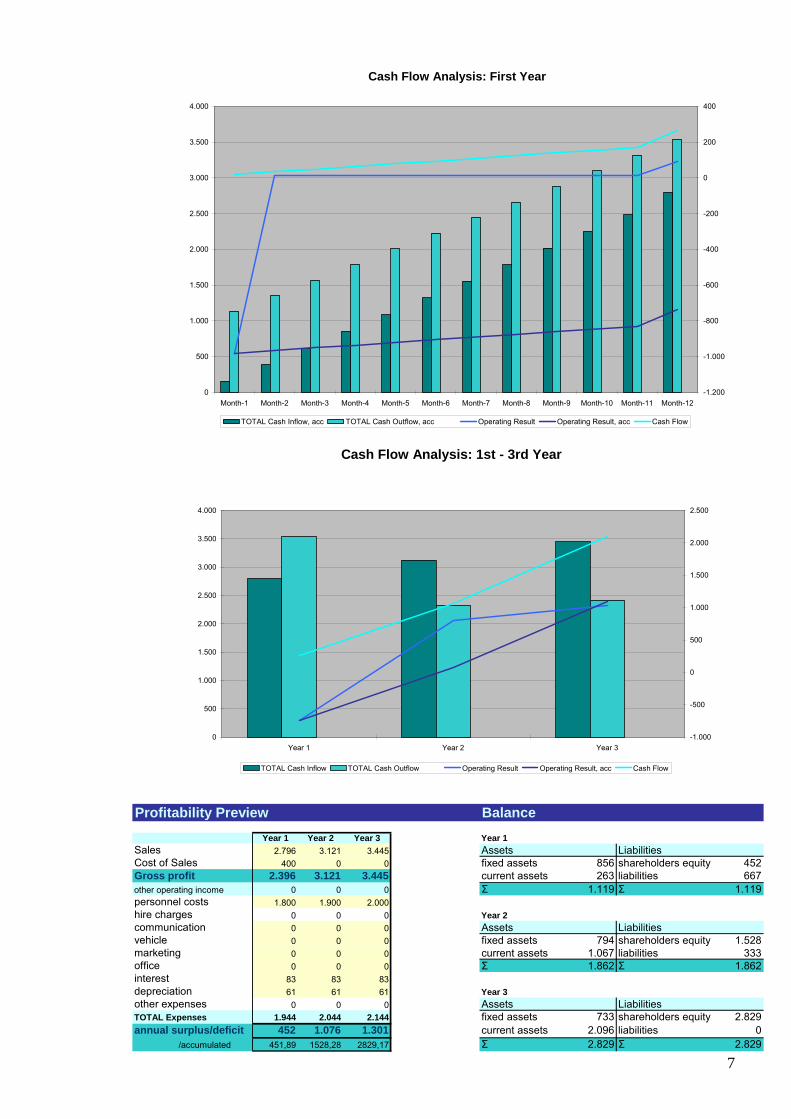
7
Cash Flow Analysis: First Year
0
500
1.000
1.500
2.000
2.500
3.000
3.500
4.000
Month-1 Month-2 Month-3 Month-4 Month-5 Month-6 Month-7 Month-8 Month-9 Month-10 Month-11 Month-12-1.200
-1.000
-800
-600
-400
-200
0
200
400
TOTAL Cash Inflow, acc TOTAL Cash Outflow, acc Operating Result Operating Result, acc Cash Flow
Cash Flow Analysis: 1st - 3rd Year
0
500
1.000
1.500
2.000
2.500
3.000
3.500
4.000
Year 1 Year 2 Year 3-1.000
-500
0
500
1.000
1.500
2.000
2.500
TOTAL Cash Inflow TOTAL Cash Outflow Operating Result Operating Result, acc Cash Flow
Profitability Preview Balance
Year 1 Year 2 Year 3 Year 12.796 3.121 3.445 Assets Liabilities
400 0 0 fixed assets 856 shareholders equity 4522.396 3.121 3.445 current assets 263 liabilities 667
0 0 0 Σ 1.119 Σ 1.1191.800 1.900 2.000
0 0 0 Year 20 0 0 Assets Liabilities0 0 0 fixed assets 794 shareholders equity 1.5280 0 0 current assets 1.067 liabilities 3330 0 0 Σ 1.862 Σ 1.862
83 83 8361 61 61 Year 30 0 0 Assets Liabilities
1.944 2.044 2.144 fixed assets 733 shareholders equity 2.829452 1.076 1.301 current assets 2.096 liabilities 0
/accumulated 451,89 1528,28 2829,17 Σ 2.829 Σ 2.829
marketingoffice
annual surplus/deficit
interestdepreciationother expensesTOTAL Expenses
personnel costshire chargescommunicationvehicle
SalesCost of SalesGross profitother operating income
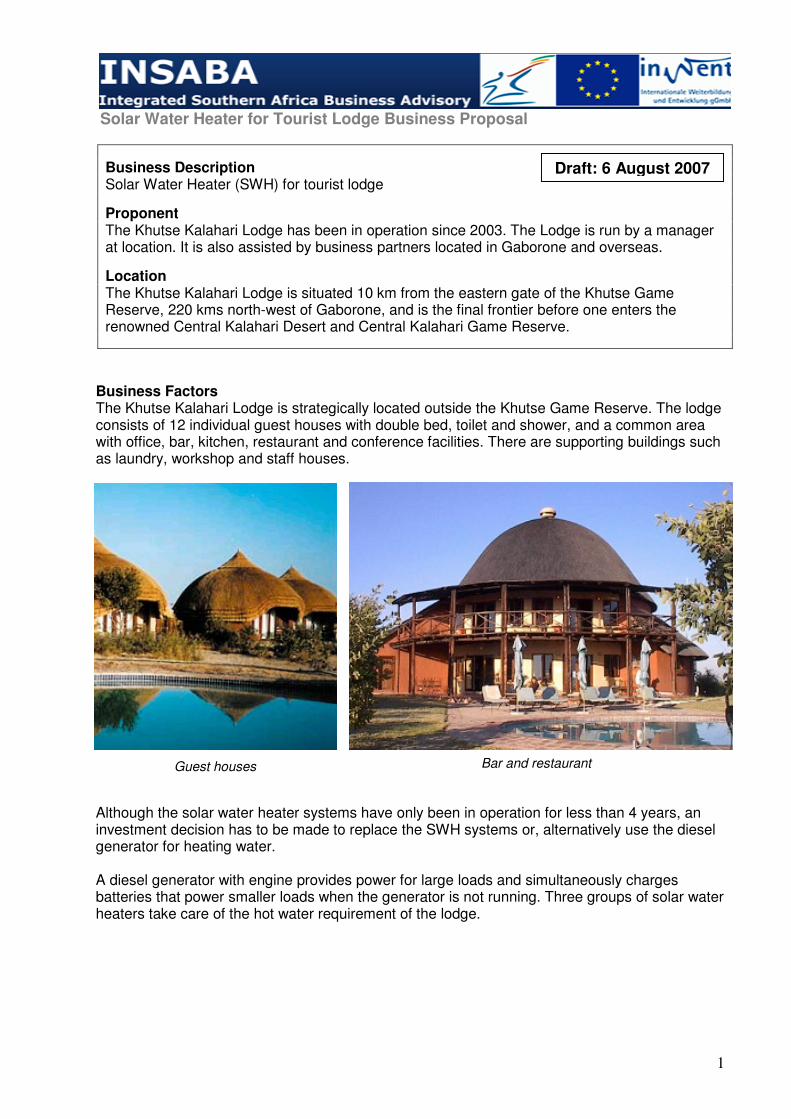
1
Solar Water Heater for Tourist Lodge Business Proposal
Business DescriptionSolar Water Heater (SWH) for tourist lodge
ProponentThe Khutse Kalahari Lodge has been in operation since 2003. The Lodge is run by a managerat location. It is also assisted by business partners located in Gaborone and overseas.
LocationThe Khutse Kalahari Lodge is situated 10 km from the eastern gate of the Khutse GameReserve, 220 kms north-west of Gaborone, and is the final frontier before one enters therenowned Central Kalahari Desert and Central Kalahari Game Reserve.
Business FactorsThe Khutse Kalahari Lodge is strategically located outside the Khutse Game Reserve. The lodgeconsists of 12 individual guest houses with double bed, toilet and shower, and a common areawith office, bar, kitchen, restaurant and conference facilities. There are supporting buildings suchas laundry, workshop and staff houses.
Although the solar water heater systems have only been in operation for less than 4 years, aninvestment decision has to be made to replace the SWH systems or, alternatively use the dieselgenerator for heating water.
A diesel generator with engine provides power for large loads and simultaneously chargesbatteries that power smaller loads when the generator is not running. Three groups of solar waterheaters take care of the hot water requirement of the lodge.
Draft: 6 August 2007
Bar and restaurantGuest houses
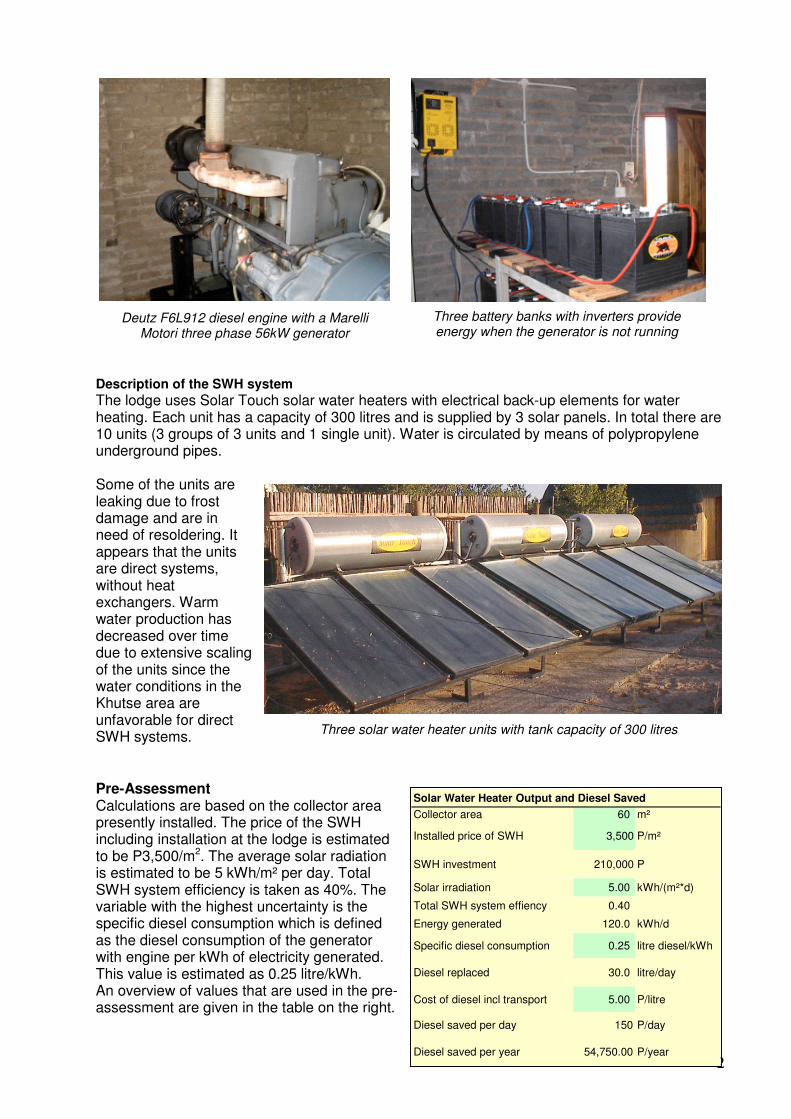
2
Description of the SWH system
The lodge uses Solar Touch solar water heaters with electrical back-up elements for waterheating. Each unit has a capacity of 300 litres and is supplied by 3 solar panels. In total there are10 units (3 groups of 3 units and 1 single unit). Water is circulated by means of polypropyleneunderground pipes.
Some of the units areleaking due to frostdamage and are inneed of resoldering. Itappears that the unitsare direct systems,without heatexchangers. Warmwater production hasdecreased over timedue to extensive scalingof the units since thewater conditions in theKhutse area areunfavorable for directSWH systems.
Pre-AssessmentCalculations are based on the collector areapresently installed. The price of the SWHincluding installation at the lodge is estimatedto be P3,500/m2. The average solar radiationis estimated to be 5 kWh/m² per day. TotalSWH system efficiency is taken as 40%. Thevariable with the highest uncertainty is thespecific diesel consumption which is definedas the diesel consumption of the generatorwith engine per kWh of electricity generated.This value is estimated as 0.25 litre/kWh.An overview of values that are used in the pre-assessment are given in the table on the right.
Three battery banks with inverters provideenergy when the generator is not running
Deutz F6L912 diesel engine with a MarelliMotori three phase 56kW generator
Three solar water heater units with tank capacity of 300 litres
Solar Water Heater Output and Diesel Saved
Collector area 60 m²
Installed price of SWH 3,500 P/m²
SWH investment 210,000 P
Solar irradiation 5.00 kWh/(m²*d)
Total SWH system effiency 0.40
Energy generated 120.0 kWh/d
Specific diesel consumption 0.25 litre diesel/kWh
Diesel replaced 30.0 litre/day
Cost of diesel incl transport 5.00 P/litre
Diesel saved per day 150 P/day
Diesel saved per year 54,750.00 P/year
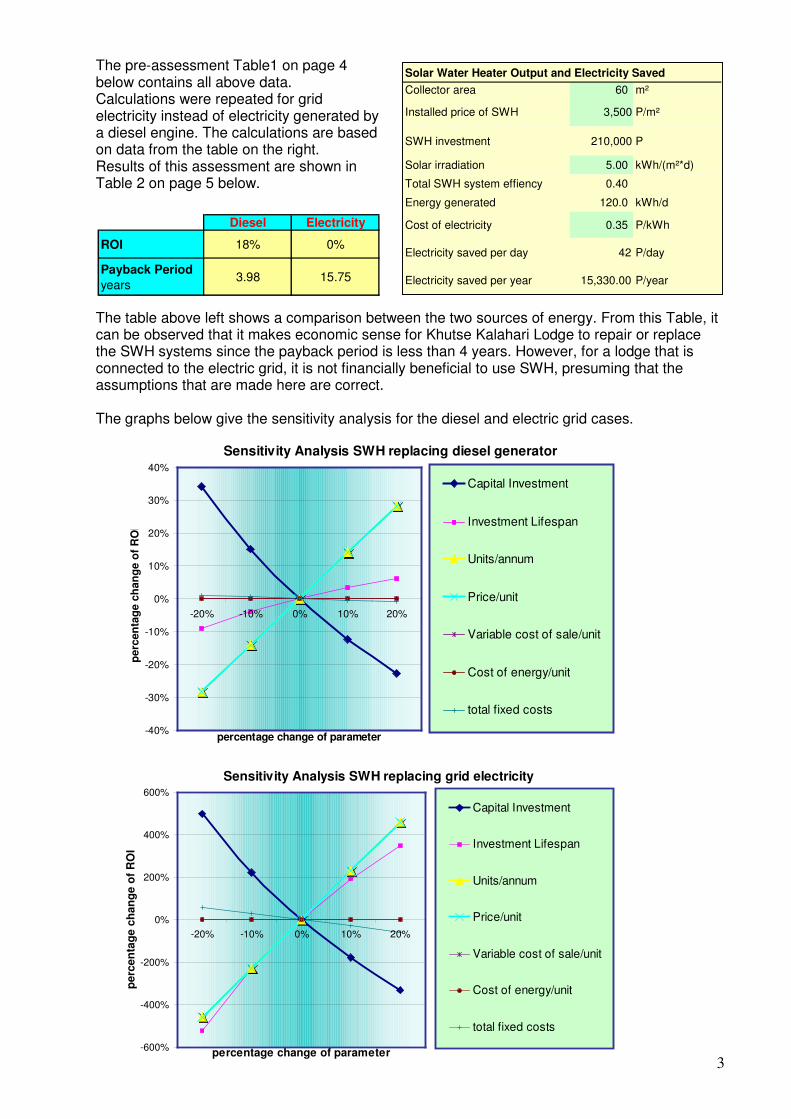
3
Solar Water Heater Output and Electricity Saved
Collector area 60 m²
Installed price of SWH 3,500 P/m²
SWH investment 210,000 P
Solar irradiation 5.00 kWh/(m²*d)
Total SWH system effiency 0.40
Energy generated 120.0 kWh/d
Cost of electricity 0.35 P/kWh
Electricity saved per day 42 P/day
Electricity saved per year 15,330.00 P/year
The pre-assessment Table1 on page 4below contains all above data.Calculations were repeated for gridelectricity instead of electricity generated bya diesel engine. The calculations are basedon data from the table on the right.Results of this assessment are shown inTable 2 on page 5 below.
The table above left shows a comparison between the two sources of energy. From this Table, itcan be observed that it makes economic sense for Khutse Kalahari Lodge to repair or replacethe SWH systems since the payback period is less than 4 years. However, for a lodge that isconnected to the electric grid, it is not financially beneficial to use SWH, presuming that theassumptions that are made here are correct.
The graphs below give the sensitivity analysis for the diesel and electric grid cases.
Diesel Electricity
ROI 18% 0%
Payback Period
years3.98 15.75
Sensitivity Analysis SWH replacing diesel generator
-40%
-30%
-20%
-10%
0%
10%
20%
30%
40%
-20% -10% 0% 10% 20%
percentage change of parameter
perc
en
tag
e c
han
ge o
f R
OI
Capital Investment
Investment Lifespan
Units/annum
Price/unit
Variable cost of sale/unit
Cost of energy/unit
total fixed costs
Sensitivity Analysis SWH replacing grid electricity
-600%
-400%
-200%
0%
200%
400%
600%
-20% -10% 0% 10% 20%
percentage change of parameter
perc
en
tag
e c
han
ge o
f R
OI
Capital Investment
Investment Lifespan
Units/annum
Price/unit
Variable cost of sale/unit
Cost of energy/unit
total fixed costs
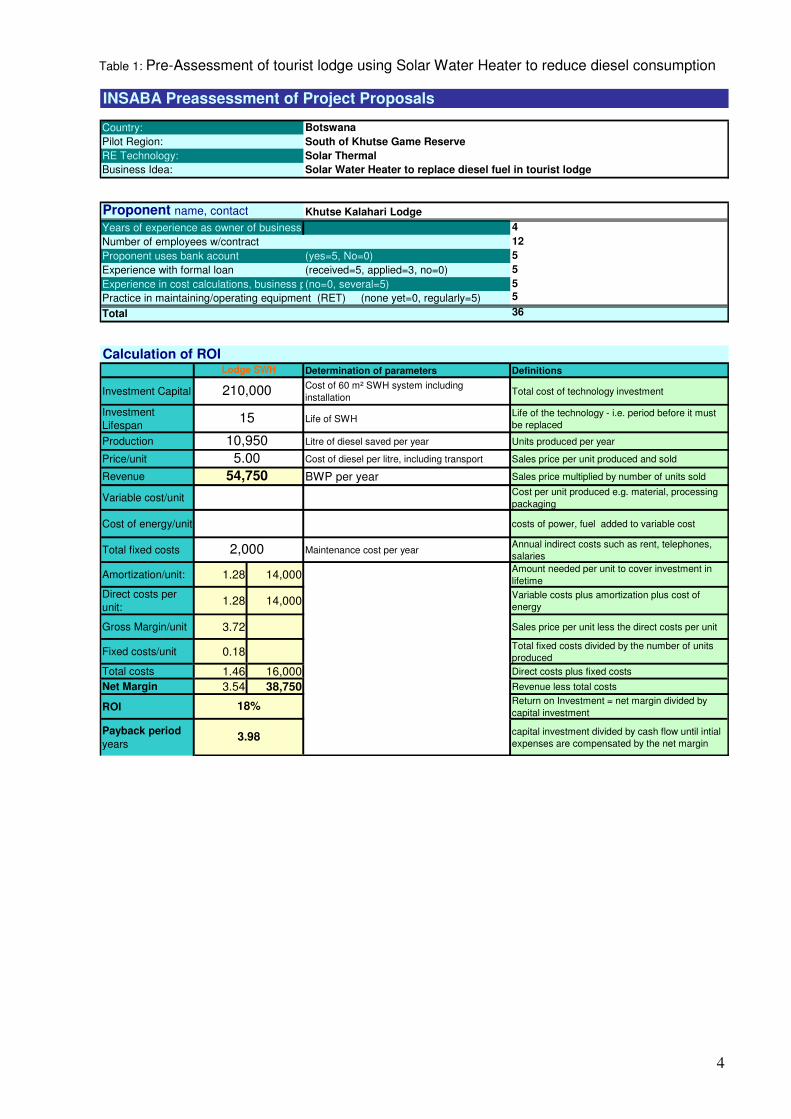
4
Table 1: Pre-Assessment of tourist lodge using Solar Water Heater to reduce diesel consumption
INSABA Preassessment of Project Proposals
Country: Botswana
Pilot Region: South of Khutse Game Reserve
RE Technology: Solar Thermal
Business Idea: Solar Water Heater to replace diesel fuel in tourist lodge
Proponent name, contact Khutse Kalahari Lodge
Years of experience as owner of business 4
Number of employees w/contract 12
Proponent uses bank acount (yes=5, No=0) 5
Experience with formal loan (received=5, applied=3, no=0) 5
Experience in cost calculations, business plans (no=0, several=5) 5
Practice in maintaining/operating equipment (RET) (none yet=0, regularly=5) 5
Total 36
Calculation of ROIDetermination of parameters Definitions
Investment Capital Cost of 60 m² SWH system including
installationTotal cost of technology investment
Investment
LifespanLife of SWH
Life of the technology - i.e. period before it must
be replaced
Production Litre of diesel saved per year Units produced per year
Price/unit Cost of diesel per litre, including transport Sales price per unit produced and sold
Revenue BWP per year Sales price multiplied by number of units sold
Variable cost/unitCost per unit produced e.g. material, processing
packaging
Cost of energy/unit costs of power, fuel added to variable cost
Total fixed costs Maintenance cost per yearAnnual indirect costs such as rent, telephones,
salaries
Amortization/unit: 1.28 14,000 Amount needed per unit to cover investment in
lifetime
Direct costs per
unit:1.28 14,000
Variable costs plus amortization plus cost of
energy
Gross Margin/unit 3.72 Sales price per unit less the direct costs per unit
Fixed costs/unit 0.18Total fixed costs divided by the number of units
produced
Total costs 1.46 16,000 Direct costs plus fixed costs
Net Margin 3.54 38,750 Revenue less total costs
ROIReturn on Investment = net margin divided by
capital investment
Payback period
years
capital investment divided by cash flow until intial
expenses are compensated by the net margin
54,750
18%
3.98
Lodge SWH
210,000
15
10,950
5.00
2,000
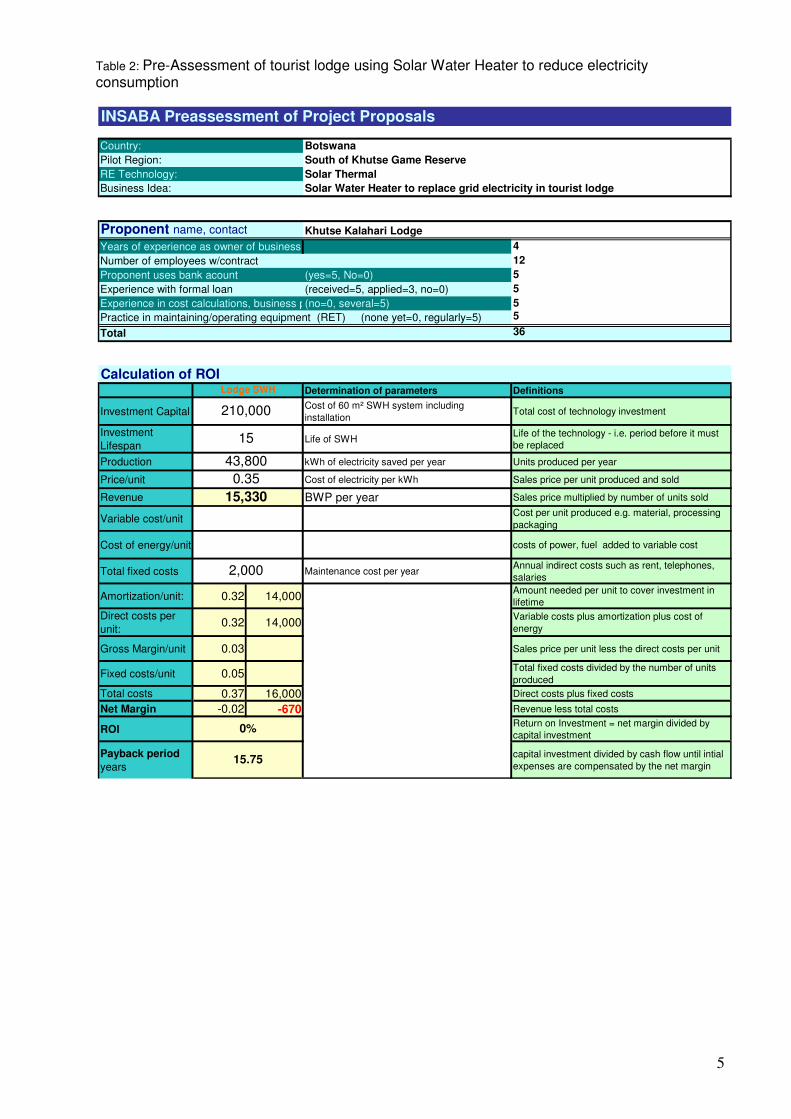
5
Table 2: Pre-Assessment of tourist lodge using Solar Water Heater to reduce electricityconsumption
INSABA Preassessment of Project Proposals
Country: Botswana
Pilot Region: South of Khutse Game Reserve
RE Technology: Solar Thermal
Business Idea: Solar Water Heater to replace grid electricity in tourist lodge
Proponent name, contact Khutse Kalahari Lodge
Years of experience as owner of business 4
Number of employees w/contract 12
Proponent uses bank acount (yes=5, No=0) 5
Experience with formal loan (received=5, applied=3, no=0) 5
Experience in cost calculations, business plans (no=0, several=5) 5
Practice in maintaining/operating equipment (RET) (none yet=0, regularly=5) 5
Total 36
Calculation of ROIDetermination of parameters Definitions
Investment Capital Cost of 60 m² SWH system including
installationTotal cost of technology investment
Investment
LifespanLife of SWH
Life of the technology - i.e. period before it must
be replaced
Production kWh of electricity saved per year Units produced per year
Price/unit Cost of electricity per kWh Sales price per unit produced and sold
Revenue BWP per year Sales price multiplied by number of units sold
Variable cost/unitCost per unit produced e.g. material, processing
packaging
Cost of energy/unit costs of power, fuel added to variable cost
Total fixed costs Maintenance cost per yearAnnual indirect costs such as rent, telephones,
salaries
Amortization/unit: 0.32 14,000 Amount needed per unit to cover investment in
lifetime
Direct costs per
unit:0.32 14,000
Variable costs plus amortization plus cost of
energy
Gross Margin/unit 0.03 Sales price per unit less the direct costs per unit
Fixed costs/unit 0.05Total fixed costs divided by the number of units
produced
Total costs 0.37 16,000 Direct costs plus fixed costs
Net Margin -0.02 -670 Revenue less total costs
ROIReturn on Investment = net margin divided by
capital investment
Payback period
years
capital investment divided by cash flow until intial
expenses are compensated by the net margin
210,000
15
43,800
0.35
2,000
15,330
0%
15.75
Lodge SWH
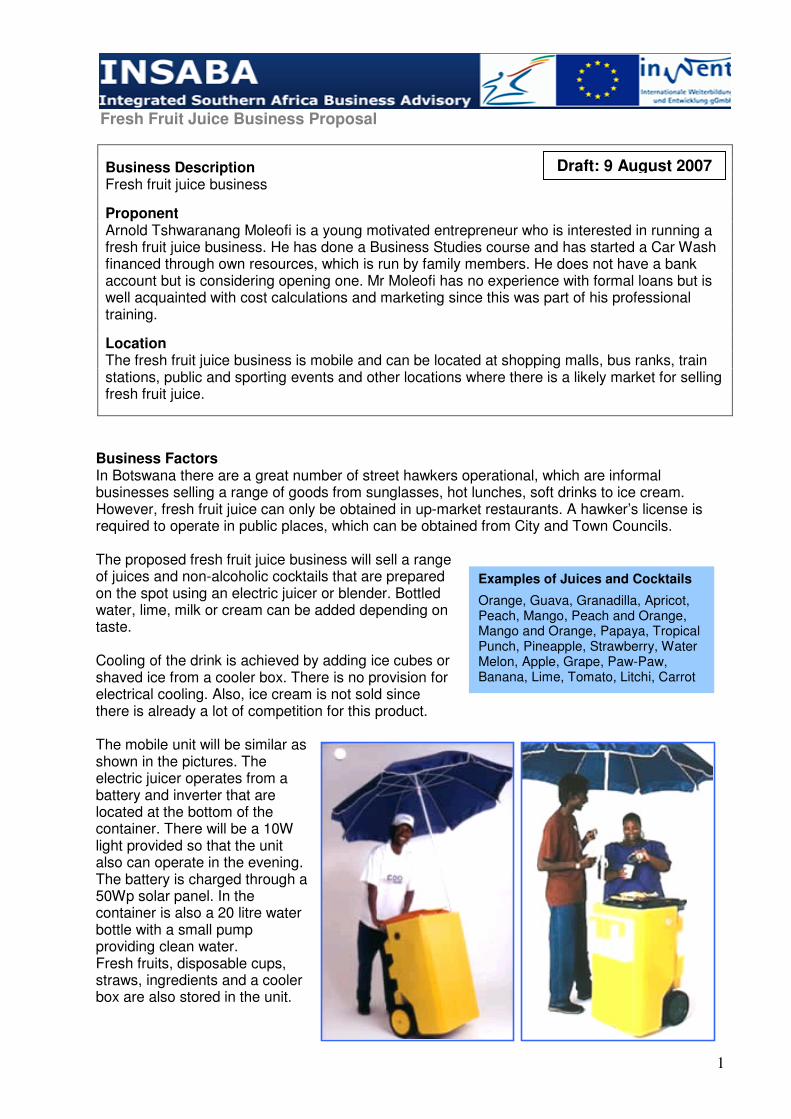
1
Fresh Fruit Juice Business Proposal
Business DescriptionFresh fruit juice business
ProponentArnold Tshwaranang Moleofi is a young motivated entrepreneur who is interested in running afresh fruit juice business. He has done a Business Studies course and has started a Car Washfinanced through own resources, which is run by family members. He does not have a bankaccount but is considering opening one. Mr Moleofi has no experience with formal loans but iswell acquainted with cost calculations and marketing since this was part of his professionaltraining.
LocationThe fresh fruit juice business is mobile and can be located at shopping malls, bus ranks, trainstations, public and sporting events and other locations where there is a likely market for sellingfresh fruit juice.
Business FactorsIn Botswana there are a great number of street hawkers operational, which are informalbusinesses selling a range of goods from sunglasses, hot lunches, soft drinks to ice cream.However, fresh fruit juice can only be obtained in up-market restaurants. A hawker’s license isrequired to operate in public places, which can be obtained from City and Town Councils.
The proposed fresh fruit juice business will sell a rangeof juices and non-alcoholic cocktails that are preparedon the spot using an electric juicer or blender. Bottledwater, lime, milk or cream can be added depending ontaste.
Cooling of the drink is achieved by adding ice cubes orshaved ice from a cooler box. There is no provision forelectrical cooling. Also, ice cream is not sold sincethere is already a lot of competition for this product.
The mobile unit will be similar asshown in the pictures. Theelectric juicer operates from abattery and inverter that arelocated at the bottom of thecontainer. There will be a 10Wlight provided so that the unitalso can operate in the evening.The battery is charged through a50Wp solar panel. In thecontainer is also a 20 litre waterbottle with a small pumpproviding clean water.Fresh fruits, disposable cups,straws, ingredients and a coolerbox are also stored in the unit.
Draft: 9 August 2007
Examples of Juices and Cocktails
Orange, Guava, Granadilla, Apricot,Peach, Mango, Peach and Orange,Mango and Orange, Papaya, TropicalPunch, Pineapple, Strawberry, WaterMelon, Apple, Grape, Paw-Paw,Banana, Lime, Tomato, Litchi, Carrot
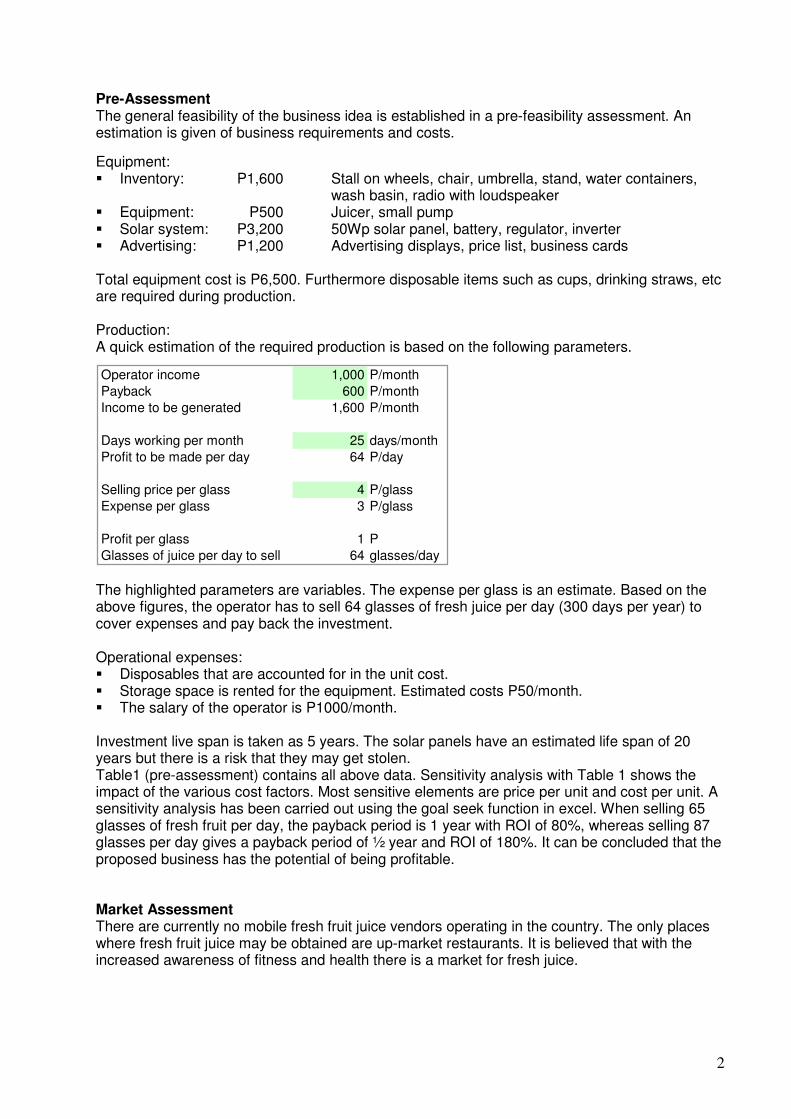
2
Pre-AssessmentThe general feasibility of the business idea is established in a pre-feasibility assessment. Anestimation is given of business requirements and costs.
Equipment:� Inventory: P1,600 Stall on wheels, chair, umbrella, stand, water containers,
wash basin, radio with loudspeaker� Equipment: P500 Juicer, small pump� Solar system: P3,200 50Wp solar panel, battery, regulator, inverter� Advertising: P1,200 Advertising displays, price list, business cards
Total equipment cost is P6,500. Furthermore disposable items such as cups, drinking straws, etcare required during production.
Production:A quick estimation of the required production is based on the following parameters.
The highlighted parameters are variables. The expense per glass is an estimate. Based on theabove figures, the operator has to sell 64 glasses of fresh juice per day (300 days per year) tocover expenses and pay back the investment.
Operational expenses:� Disposables that are accounted for in the unit cost.� Storage space is rented for the equipment. Estimated costs P50/month.� The salary of the operator is P1000/month.
Investment live span is taken as 5 years. The solar panels have an estimated life span of 20years but there is a risk that they may get stolen.Table1 (pre-assessment) contains all above data. Sensitivity analysis with Table 1 shows theimpact of the various cost factors. Most sensitive elements are price per unit and cost per unit. Asensitivity analysis has been carried out using the goal seek function in excel. When selling 65glasses of fresh fruit per day, the payback period is 1 year with ROI of 80%, whereas selling 87glasses per day gives a payback period of ½ year and ROI of 180%. It can be concluded that theproposed business has the potential of being profitable.
Market AssessmentThere are currently no mobile fresh fruit juice vendors operating in the country. The only placeswhere fresh fruit juice may be obtained are up-market restaurants. It is believed that with theincreased awareness of fitness and health there is a market for fresh juice.
Operator income 1,000 P/month
Payback 600 P/month
Income to be generated 1,600 P/month
Days working per month 25 days/month
Profit to be made per day 64 P/day
Selling price per glass 4 P/glass
Expense per glass 3 P/glass
Profit per glass 1 P
Glasses of juice per day to sell 64 glasses/day

3
Fresh fruits can be obtained from a number of supermarket outlets such as Fruit and Veg City,Payless, Choppies, and others. When purchased fresh, fruits will hold for a number of days.Table 2 shows a comparison between the fresh fruit juice business using a RE system and thesame business recharging the battery from grid electricity through a commercial operator. Thecost of charging the battery, including transportation is estimated at P10 per charge. Thecomparison shows that it is more cost effective to charge the battery with solar energy.
Operational PlanThe business strategy relies on the special appeal of fresh fruit consumption to the customers, asa healthy product. It is important to generate a brand for the fresh fruit business. The businessshould be run in a professional manner in order to succeed. The operator should wear a uniformand cleanliness of the stall and personal hygiene would be critical.
Table 3 gives the cash flow during the first three years of operation. The cash flow analysisindicates clearly, how much financing would be required. Under the prevalent conditions, capitalinfusion of P6500 would be sufficient. The graphs visualize this business development for thefirst year, and for three years, respectively.
Finally, Table 4 gives the profitability forecast and balance for the business start-up.
From the Sensitivity Analysis below it becomes clear that he selling cost of a glass of juice aswell as the variable cost -being the cost of ingredients- are two critical success/failure factors.Since the maximum selling price is determined by competing soft drinks, it is of essence tocontrol the costs of the ingredients to make the business a success.
Sensitivity Analysis
-400%
-300%
-200%
-100%
0%
100%
200%
300%
400%
-20% -10% 0% 10% 20%
percentage change of parameter
perc
en
tag
e c
han
ge o
f R
OI
Capital Investment
Investment Lifespan
Units/annum
Price/unit
Variable cost of sale/unit
Cost of energy/unit
total fixed costs

4
Table 1: Pre-Assessment of the fresh fruit juice business described above
INSABA Preassessment of Project Proposals
Country: Botswana
Pilot Region: Gaborone / Main Mall
RE Technology: Solar PV Electricity
Business Idea:
Proponent name, contact Mr. Arnold Tshwaranang Moleofi
Years of experience as owner of business 1
Number of employees w/contract 1
Proponent uses bank acount (yes=5, No=0) 0
Experience with formal loan (received=5, applied=3, no=0) 0
Experience in cost calculations, business plans (no=0, several=5) 5
Practice in maintaining/operating equipment (RET) (none yet=0, regularly=5) 3
Total 10
Calculation of ROIDetermination of parameters Definitions
Investment Capital Inventory Stall on wheels, chair, umbrella, stand, water
containers, wash basin, radio with loudspeaker
Investment Capital Equipment Blender, small pump
Investment Capital PV solar system 50Wp solar panel, battery, regulator, inverter
Investment Capital Advertising Advertising displays, price list, business cards
Investment Capital Total of shop, inventory, equipment and PV Total cost of investment
Investment
LifespanConservative average life
Life of the investment - i.e. period before it must
be replaced
Production Glasses sold per day
Production Glasses sold per year 300 days per year
Price/unit Average sales price per glass
Revenue BWP This is net revenue
Variable cost/unit Average cost per glass Cost of fruit, ice, disposable cups, straw, etc.
Cost of energy/unit No other energy Costs of power, fuel added to variable cost
Fixed cost Rent for storage space to store equipment Rent per year
Fixed cost Hawker license
Fixed cost Replacement of the battery 3 yrs of battery lifetime
Fixed cost Annual salary for operator Wages
Fixed cost Salary for owner Wages
Total fixed costsAnnual indirect costs such as rent, telephones,
salaries
Amortization/unit: 0.07 1,300 Amount needed per unit to cover investment in
lifetime
Direct costs per
unit:3.07 59,800
Variable costs plus amortization plus cost of
energy
Gross Margin/unit 0.93 Sales price per unit less the direct costs per unit
Fixed costs/unit 0.66Total fixed costs divided by the number of units
produced
Total costs 3.73 72,750 Direct costs plus fixed costs
Net Margin 0.27 5,250 Revenue less total costs
ROIReturn on Investment = net margin divided by
capital investment
Payback period
years
Capital investment divided by cash flow until intial
expenses are compensated by the net margin
Fresh Fruit Juice Stall using PV Solar Electricity
3,200
100
81%
12,950
600
0
250
4.00
78,000
Using the goal seek function it can be
established that when selling 66 glasses of
fresh fruit juice per day, the payback period is 1
year and ROI is 80% When 86 glasses per day
are sold the payback period is half a year and
the ROI is 180%
Fresh Fruit Juice
6,500
5
19500
1,600
500
65
1,200
3.00
0
12,000
0.99

5
Table 2: Competitive Analysis: Comparison between the fresh fruit juice business using solar PVelectricity and the same business recharging the battery grid electricity
INSABA Verification & Market-Assessment of Project Proposals
Country: Botswana
Pilot Region: Gaborone
RE Technology: Solar PV Electricity
Business Idea:
Market Context : describeMarket Size & Potential
Market Need, Risk
Competitor
Competing Technology
Appropriateness of RET
Market Segment
Main Differentiator
Sustainable Production
Fresh Fruit Stall with solar PV electricity
Calculation of Competitiveness Compared to battery charged from gridDescription of Alternative
Investment Capital Battery charged with grid electricity instead of
solar PV electricity
Investment
LifespanEquipment lifetime
Production Energy source does not effect turnover
Price/unit Energy source does not effect sales price
Revenue BWP
Variable cost/unit
Cost of energy/unit
Battery is charged at a commercial charging
centre once every day at a cost of P10 per
charge including transport
Fixed costs Fixed costs are not effected by how the battery
is charged
Total fixed costs Total fixed costs
Amortization/unit: 0.07 1,300 0.04 780
Direct costs per
unit:3.07 59,800 3.19 62,280
Gross Margin/unit 0.93 0.81
Fixed costs/unit 0.66 0.66
Total costs 3.73 72,750 3.86 75,230
Net Margin 0.27 5,250 0.14 2,770
ROI
Payback period
years
Solar Pv Grid electricity
Fresh Fruit Juice Stall using PV Solar Electricity
Presently there are no mobile fresh fruit juice vendors operating. The only places where
fresh fruit juice may be obtained are up-market restaurants. It is believed that with the
increased awareness of fitness and health there is a market for fresh juice. Probably
little to no market available in villages. The same business model is replicable for
different parts of the country.
The idea of buying a fresh and healthy drink may not catch on. Many people see a can
still as a fashionable drink.
See above
Charging the battery with grid electricity. Hand press for orange juice.
Using RE a radio can be operated attracking customers and light, so that working
hours are extended.
Using RE creates a business opportunity that previously did not exist.
Fresh fruit juice is healthier and more tasteful than juice from cans.
Battery needs recycling but thsi also applies to system that does not use RE
6,500
5
3,900
5
19,500
12,950
81%
0.99
12,950
71%
1.10
19,500
12,950 12,950
4.00
78,000
3.00
0.1538
4.00
78,000
3.00
0

6
Ta
ble
3:
Cash
Flo
w A
na
lysis
Month
-1M
onth
-2M
onth
-3M
onth
-4M
onth
-5M
onth
-6M
onth
-7M
onth
-8M
onth
-9M
onth
-10
Mo
nth
-11
Mo
nth
-12
Ye
ar
1Y
ear
1Y
ear
1Y
ear
1Y
ear
1Y
ear
1Y
ea
r 1
Yea
r 1
Yea
r 1
Yea
r 1
Yea
r 1
Yea
r 1
Pro
du
cts
Sa
les
Fre
sh
Fru
it J
uic
e19
500
1,6
25
1,6
25
1,6
25
1,6
25
1,6
25
1,6
25
1,6
25
1,6
25
1,6
25
1,6
25
1,6
25
1,6
25
Pro
du
ct
20
00
00
00
00
00
0
Pro
du
ct
30
00
00
00
00
00
0
Cash
In
flo
wT
urn
ov
er
Pri
ce
Fre
sh F
ruit J
uic
e4.0
06,5
00
6,5
00
6,5
00
6,5
00
6,5
00
6,5
00
6,5
00
6,5
00
6,5
00
6,5
00
6,5
00
6,5
00
Pro
duct 2
00
00
00
00
00
00
Pro
duct 3
00
00
00
00
00
00
TO
TA
L T
urn
ov
er
6,5
00
6,5
00
6,5
00
6,5
00
6,5
00
6,5
00
6,5
00
6,5
00
6,5
00
6,5
00
6,5
00
6,5
00
TO
TA
L C
ash
In
flo
w6,5
00
6,5
00
6,5
00
6,5
00
6,5
00
6,5
00
6,5
00
6,5
00
6,5
00
6,5
00
6,5
00
6,5
00
Cash
Ou
tflo
wM
ate
ria
lC
os
t
Fre
sh F
ruit J
uic
e3.0
04,8
75
4,8
75
4,8
75
4,8
75
4,8
75
4,8
75
4,8
75
4,8
75
4,8
75
4,8
75
4,8
75
4,8
75
Pro
duct 2
00
00
00
00
00
00
Pro
duct 3
00
00
00
00
00
00
TO
TA
L M
ate
rial
4,8
75
4,8
75
4,8
75
4,8
75
4,8
75
4,8
75
4,8
75
4,8
75
4,8
75
4,8
75
4,8
75
4,8
75
Ov
erh
ead
Co
st
An
nu
al
Sta
ff A
sha
re1
2,0
00
1,0
00
1,0
00
1,0
00
1,0
00
1,0
00
1,0
00
1,0
00
1,0
00
1,0
00
1,0
00
1,0
00
1,0
00
Sta
ff B
sha
re0
00
00
00
00
00
0
Sto
rage
ren
t6
00.0
05
0.0
05
0.0
05
0.0
05
0.0
05
0.0
05
0.0
05
0.0
050
.00
50
.00
50
.00
50
.00
50
.00
Ha
wker
Lic
ense
10
0.0
08.3
38.3
38.3
38.3
38.3
38.3
38
.33
8.3
38
.33
8.3
38
.33
8.3
3
Re
pairs&
repla
ce
men
t2
50.0
02
0.8
32
0.8
32
0.8
32
0.8
32
0.8
32
0.8
32
0.8
320
.83
20
.83
20
.83
20
.83
20
.83
Ve
hic
le0
00
00
00
00
00
0
Mark
eting
00
00
00
00
00
00
Inve
stm
en
t6
,500
0In
ve
stm
en
t Life
span
5
TO
TA
L O
verh
ead
7,5
79
1,0
79
1,0
79
1,0
79
1,0
79
1,0
79
1,0
79
1,0
79
1,0
79
1,0
79
1,0
79
1,0
79
Ca
pit
al
co
st
inte
rest,
re
dem
pti
on
16
%226
226
226
226
226
226
226
226
226
226
226
226
TO
TA
L c
ap
ita
l 226
226
226
226
226
226
226
226
226
226
226
226
TO
TA
L C
ash
Ou
flo
w12,6
80
6,1
80
6,1
80
6,1
80
6,1
80
6,1
80
6,1
80
6,1
80
6,1
80
6,1
80
6,1
80
6,1
80
Op
era
tin
g R
es
ult
-6,1
80
320
320
320
320
320
320
32
032
032
032
032
0
/ac
cu
mu
late
d-6
,180
-5,8
59
-5,5
39
-5,2
19
-4,8
98
-4,5
78
-4,2
58
-3,9
37
-3,6
17
-3,2
97
-2,9
76
-2,6
56
Ca
pita
l in
pu
t6
,500
Ca
sh
Flo
w3
20
641
961
1,2
81
1,6
02
1,9
22
2,2
42
2,5
63
2,8
83
3,2
03
3,5
24
3,8
44
Ca
sh
Flo
w A
na
lysis
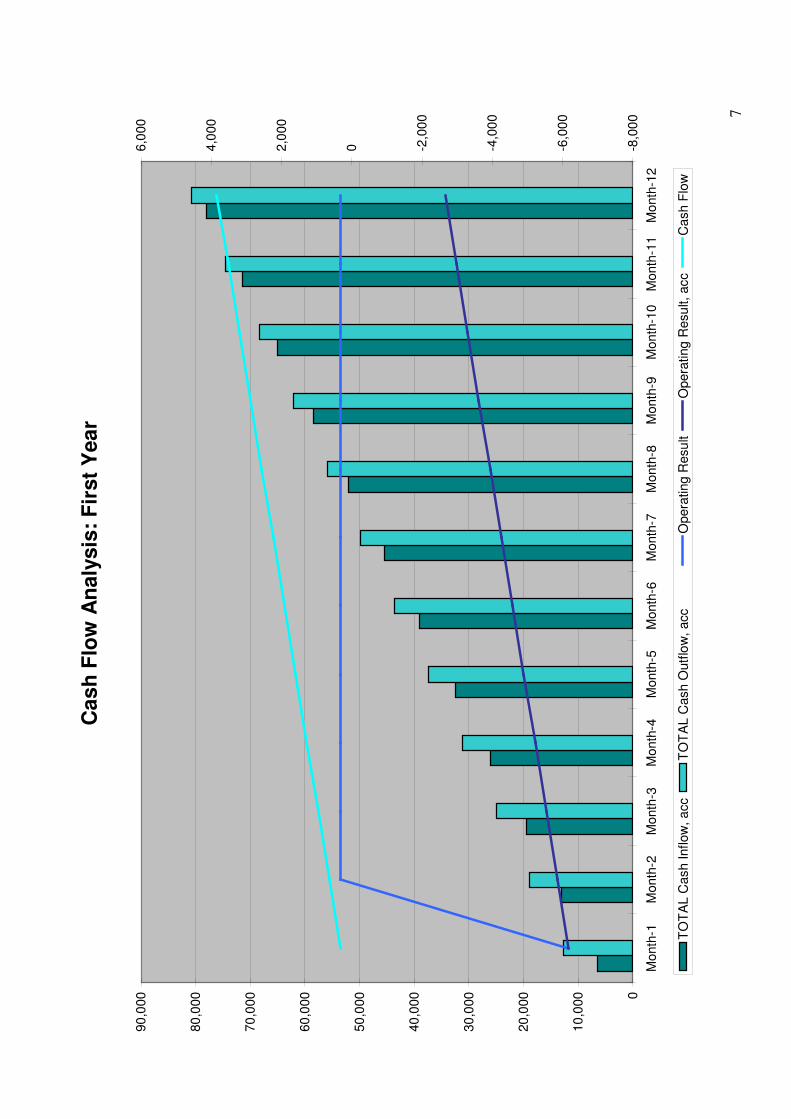
7
Ca
sh
Flo
w A
naly
sis
: F
irst
Yea
r
0
10
,000
20
,000
30
,000
40
,000
50
,000
60
,000
70
,000
80
,000
90
,000
Month
-1M
onth
-2M
onth
-3M
onth
-4M
onth
-5M
onth
-6M
onth
-7M
onth
-8M
onth
-9M
onth
-10
Month
-11
Month
-12
-8,0
00
-6,0
00
-4,0
00
-2,0
00
02,0
00
4,0
00
6,0
00
TO
TA
L C
ash Inflow
, a
cc
TO
TA
L C
ash O
utf
low
, acc
Opera
ting R
esu
ltO
pera
ting R
esu
lt, acc
Ca
sh F
low

8
Cash
Flo
w A
naly
sis
: 1st
- 3rd
Year
70,0
00
72,0
00
74,0
00
76,0
00
78,0
00
80,0
00
82,0
00
Year
1Y
ear
2Y
ear
3
-4,0
00
-2,0
00
02,0
00
4,0
00
6,0
00
8,0
00
10,0
00
12,0
00
14,0
00
TO
TA
L C
ash Inflow
TO
TA
L C
ash O
utf
low
Opera
ting R
esult
Opera
ting R
esult, acc
Cash F
low
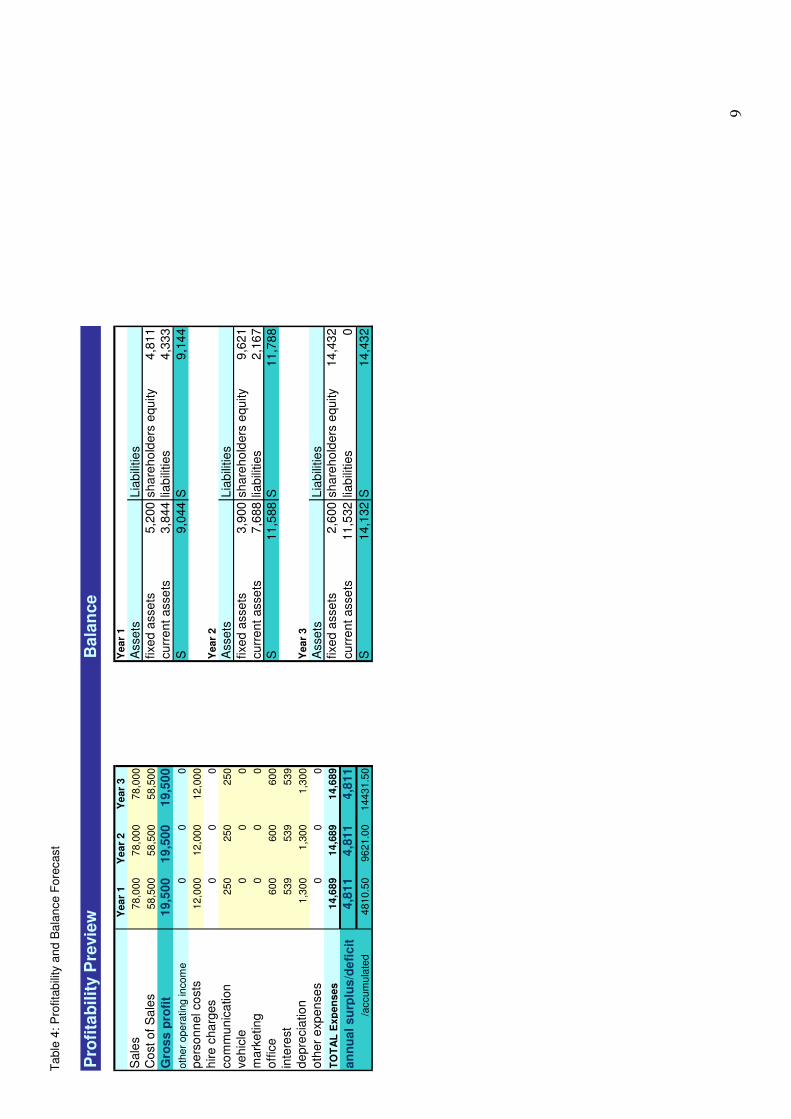
9
Ta
ble
4:
Pro
fita
bili
ty a
nd
Ba
lan
ce F
ore
cast
Pro
fita
bil
ity P
revie
wB
ala
nce
Year
1Y
ear
2Y
ear
3Y
ear
1
78,0
00
78,0
00
78,0
00
Asse
tsL
iab
ilitie
s
58,5
00
58,5
00
58,5
00
fixe
d a
sse
ts5
,200
sh
are
ho
lders
equity
4,8
11
19,5
00
19
,50
01
9,5
00
cu
rre
nt
asse
ts3
,844
liab
ilities
4,3
33
00
0S
9,0
44
S9
,14
4
12,0
00
12,0
00
12,0
00
00
0Y
ear
2
250
250
250
Asse
tsL
iab
ilitie
s
00
0fixe
d a
sse
ts3
,900
sh
are
ho
lders
equity
9,6
21
00
0cu
rre
nt
asse
ts7
,688
liab
ilities
2,1
67
600
600
600
S11
,588
S1
1,7
88
539
539
539
1,3
00
1,3
00
1,3
00
Year
3
00
0A
sse
tsL
iab
ilitie
s
14,6
89
14,6
89
14,6
89
fixe
d a
sse
ts2
,600
sh
are
ho
lders
equity
14
,43
2
4,8
11
4,8
11
4,8
11
cu
rre
nt
asse
ts11
,532
liab
ilities
0
/accum
ula
ted
4810.5
09621.0
014431.5
0S
14
,132
S1
4,4
32
Sale
s
Co
st
of
Sa
les
Gro
ss
pro
fit
oth
er
opera
ting incom
e
pe
rso
nn
el co
sts
hire
cha
rges
co
mm
un
ica
tion
ve
hic
le
ma
rke
tin
g
off
ice
an
nu
al s
urp
lus
/de
fic
it
inte
rest
de
pre
cia
tio
n
oth
er
exp
en
se
s
TO
TA
L E
xp
en
ses