assessment of biochemical process controls for reduction of
TRANSCRIPT

New York State Energy Research and Development Authority
Assessment of Biochemical Process Controls for Reduction of Hydrogen Sulfide Concentrations in Biogas from Farm Digesters
Final Report February 2012
No. 12-20

NYSERDA’s Promise to New Yorkers:New Yorkers can count on NYSERDA for objective, reliable, energy-related solutions delivered by accessible, dedicated professionals.
OurMission: Advance innovative energy solutions in ways that improve New York’s economy and environment.
OurVision: Serve as a catalyst—advancing energy innovation and technology, transforming New York’s economy, and empowering people to choose clean and efficient energy as part of their everyday lives.
OurCoreValues: Objectivity, integrity, public service, and innovation.
Our PortfoliosNYSERDA programs are organized into five portfolios, each representing a complementary group of offerings with common areas of energy-related focus and objectives.
Energy Efficiency & Renewable Programs Helping New York to achieve its aggressive clean energy goals –
including programs for consumers (commercial, municipal, institutional, industrial, residential, and transportation), renewable power suppliers, and programs designed to support market transformation.
Energy Technology Innovation & Business Development
Helping to stimulate a vibrant innovation ecosystem and a clean energy economy in New York – including programs to support product research, development, and demonstrations, clean-energy business development, and the knowledge-based community at the Saratoga Technology + Energy Park®.
Energy Education and Workforce Development
Helping to build a generation of New Yorkers ready to lead and work in a clean energy economy – including consumer behavior, youth education, and workforce development and training programs for existing and emerging technologies.
Energy and the Environment
Helping to assess and mitigate the environmental impacts of energy production and use – including environmental research and development, regional initiatives to improve environmental sustainability, and West Valley Site Management.
Energy Data, Planning and Policy
Helping to ensure that policy-makers and consumers have objective and reliable information to make informed energy decisions – including State Energy Planning, policy analysis to support the Regional Greenhouse Gas Initiative, and other energy initiatives; and a range of energy data reporting including Patterns and Trends.
Assessment of BiochemicAl Process controls for reduction of hydrogen sulfide concentrAtions in BiogAs from fArm digesters
Final Report
Prepared for the
new york stAte energy reseArch And
develoPment Authority
Albany, NYnyserda.ny.gov
Kathleen O’ConnorSenior Project Manager
Prepared by:environmentAl mAnAgement grouP internAtionAl, inc.
mediA, PA
Manaf H. Farhan, Ph.D., P.E., Project Director Yassar Farhan, Ph.D., P.E., Project Manager
NYSERDA NYSERDA 10082 February 2012Report 12-20
ii
TABLE OF CONTENTS SECTION Page
TABLE OF CONTENTS ...................................................................................................ii
1.0 INTRODUCTION .................................................................................................. 3
2.0 BACKGROUND .................................................................................................... 4
2.1 DESCRIPTION OF ANAEROBIC DIGESTION AND SULFIDE PRODUCTION ....................................................................................... 4
2.2 CURRENTLY-AVAILABLE TECHNOLOGIES FOR BIOGAS HYDROGEN SULFIDE CONTROL ........................................................ 5
2.3 PROJECT TECHNOLOGY DESCRIPTION ........................................... 6
3.0 DESCRIPTION OF FARM OPERATIONS AND DIGESTER SYSTEM ................ 7
5.0 LABORATORY DOSING EXPERIMENTATION ................................................. 13
6.0 FIELD DOSING SYSTEM DESIGN AND FABRICATION .................................. 19
6.1 SYSTEM DESIGN ................................................................................ 19
6.2 FIELD DOSING EXPERIMENTATION RESULTS ................................ 20
6.3 ECONOMIC EVALUATION OF PROPOSED TECHNOLOGY ............. 27
7.0 SUMMARY AND CONCLUSIONS ..................................................................... 29
8.0 REFERENCES ................................................................................................... 31

3
1.0 INTRODUCTION Use of anaerobic digestion for animal manure treatment at dairy farms in New York State (NYS) has considerably increased over the past decade. In addition to reduction in odors, anaerobic digestion generates biogas and provides a viable option for nutrient management at farms. It is estimated that up to 280 Gega Watt-Hours can be generated from manure digestion at dairy farms in NYS (Zicari, 2003). Typically, biogas produced by farm digesters is used to generate energy for farm use and sale to the power grid. One of the main difficulties associated with biogas utilization at dairy farms is the presence of relatively high hydrogen sulfide (H2S) concentrations in the biogas stream. Hydrogen sulfide present in biogas corrodes engine parts in the combustion chamber, exhaust system, and in various bearings throughout an engine. The presence of water vapor in the biogas stream along with hydrogen sulfide exasperates this problem by producing pure hydrogen, which accelerates cracking and blistering of steel parts. Furthermore, combustion of biogas with hydrogen sulfide generates sulfur dioxide which, upon reaction with water droplets, forms sulfuric acid. Like hydrogen sulfide, sulfuric acid is also highly corrosive to biogas handling equipment. In general, the operational hydrogen sulfide concentration limit for most biogas utilization systems is below 800 parts per million on a volumetric basis (ppmv) in the gas stream. The typical composition of biogas generated from a dairy farm digester is provided in Table 1 below. The primary two components of biogas are Methane (CH4) (at approximately 60%) and Carbon Dioxide (CO2) (at approximately 40%). Although H2S constitutes only a small fraction of the biogas (0.2% to 0.45% or 2,000 to 4,500 ppmv), it is the compound of most concern when using digester biogas. Development of a reliable, cost-effective technology for control of H2S concentrations in farm digesters is vital for wide-spread application of manure digesters in NYS. This project assessed the use of simple, low maintenance biochemical process controls to reduce biogas H2S concentrations in manure digesters. Table 1: Typical Composition of Anaerobic Digester Biogas at Dairy Farms
Parameter Concentration Methane 55% - 60% Carbon dioxide 40% - 45% Hydrogen sulfide 2,000 - 4,500 ppmv*
* ppmv is part per million on a volumetric basis The goal of this project was to assess the effects of dissolved iron addition to dairy manure digesters on H2S concentrations in the biogas stream. This was achieved by completing the following investigation steps: 1. Measure baseline bulk liquid and biogas hydrogen sulfide concentrations in an
operational manure digester in NYS; 2. Complete a laboratory experimental investigation designed to estimate the
dissolved iron dosage necessary to reduce dissolved hydrogen sulfide concentrations to desired levels; and

4
3. Complete a field-scale assessment of H2S reduction in the biogas stream due to the addition of dissolved iron compounds to an operational dairy farm digester in NYS.
2.0 BACKGROUND
2.1 DESCRIPTION OF ANAEROBIC DIGESTION AND SULFIDE PRODUCTION Anaerobic digestion is a complex, multi-step biological process during which the organic portion of the waste is converted into bacterial cells, carbon dioxide, and methane gas while sulfates are converted into H2S. The conversion of the organic portion of the waste is often described as having the following three basic stages: (i) hydrolysis, liquefaction and fermentation; (ii) hydrogen and acetic acid (or acetate-CH3COOH) formation; and (iii) methane formation. This three-stage process involves possibly five groups of bacteria: fermentation bacteria; hydrogen-producing bacteria; hydrogen-consuming bacteria; carbon dioxide (CO2) -reducing methanogens; and aceticlastic methanogens. Methane (CH4) is generated by the latter two groups of bacteria (CO2-reducing and acid-utilizing methanogens). Acetate cleavage by aceticlastic methanogens is responsible for the majority of methane production, and takes place according to the following reaction:
CH3COOH → CH4 + CO2 Methanogenic bacteria can only use a specific group of substrates as an energy source. This group includes formic acid, acetic acid, methanol, hydrogen, and carbon dioxide (Parkin and Owen, 1986; and Zeikus et al., 1985). Jeris and McCarty (1975) employed tracer studies to evaluate the direct contribution of acetate to methane production for anaerobic digestion of various substrates. They estimated that 67-100% of the methane production from fatty substrates is directly due to acetate cleavage. Carbohydrates, which are easier to digest than fats, showed 67% methane production from acetate. Proteins and sewage sludge had approximately 70% of their methane production directly attributable to acetic acid. The remainder of produced methane is a result of carbon dioxide reduction using hydrogen as an energy source, according to the following reaction:
CO2 + 4H2 → CH4 + 2H2O Conversion of sulfates (SO4
-2) and sulfur-containing compounds into H2S in anaerobic digesters is carried out by sulfate-reducing bacteria (SRB). SRB use the same sources of energy (acetic acid and hydrogen) as methane producing bacteria (MPB) (Karhadkar et al., 1987). SRB can usually out-compete MPB for the carbon source (Thiele, 1991). Yoda et al., (1987) observed that, in the presence of sulfate, SRB out-compete MPB at low acetate concentrations but MPB out-compete SRB at high acetate concentrations. The reactions involved in H2S production are as follows (Speece, 1996):
5
4H2 + SO42- + H+ → HS- + 4H2O
CH3COO- + SO4
2-→ HS- + 2HCO3-
4 CH3CH2COO- + 3 SO42-→ 4[CH3COO-] + 4HCO3
- + 3HS-
2 CH3CH2CH2COO- + SO42-→ 4[CH3COO-] + HS- + H+
Where: CH3COO- is Acetate, CH3CH2COO- is Propionate, and CH3CH2CH2COO- is Butyrate. In general, sulfur-containing compounds are reduced in anaerobic environments to sulfide compounds as follow:
SO42- + Organic Matter —— Anaerobic Bacteria → S2- + H2O + CO2
HS- ↔ S2- + H+
H2S ↔ HS- + H+
Thus, the production of H2S in farm digesters is inevitable given the abundance of sulfur-containing compounds in manure and the ability of SRB to compete with MPB for acetate and hydrogen in anaerobic environments. 2.2 CURRENTLY AVAILABLE TECHNOLOGIES FOR BIOGAS HYDROGEN
SULFIDE CONTROL The majority of currently available biogas H2S control technologies focus on the removal of H2S from the biogas stream prior to or after combustion. Control technologies are generally based on physical, chemical, or biological treatment of the biogas stream. Physical control technologies of H2S include sorption onto solid media, dissolution into water or other solvents, or membrane or micro-filtration processes. Adsorption of H2S onto solid surfaces from the gas stream often uses granular activated carbon (GAC) combined with alkalines; oxides; zeolits; or specially-designed resins that have an affinity to absorb H2S. Dissolution of H2S in water or other solvents capitalizes on the higher gas-liquid partition coefficient for H2S than the other biogas constituents. The Henry’s law partition coefficient for H2S is 1.0 x 10⁻¹ Mole/L/atm, as compared to 1.0 x 10⁻³ Mole/L/atm for CH4 and 3.4 x 10⁻² Mole/L/atm for CO2. Although physical control technologies can be effective in reducing H2S, they frequently generate a waste stream of “spent” material that requires special management and disposal. Chemical control technologies are generally based on promotion of chemical reactions between metal oxides (or less commonly; caustic) and H2S to remove the latter from the biogas stream. Hydrogen sulfide reaction with metal oxides forms a metal sulfide precipitate that coats the metal oxide surface. One of the most commonly used metal
6
oxides is iron oxide (e.g. iron sponge). Zinc and nickel oxides have also been used for these systems. Although effective in removing H2S, the efficiency of these systems decreases over time due to the build-up of metal-sulfide precipitates on the reactive oxide surfaces. This necessitates regular replacement of the metal oxide and disposal of the spent material (which may be classified as hazardous). Regeneration of the spent material can also be employed to minimize costs, but such a process generally requires specific training and handling due to the presence of high sulfur concentrations in the spent material. Biological H2S control technologies include aerobic conversion of sulfur into its oxidized forms using bioreactors, biofilters, or similar systems, or the addition of chemicals to selectively deactivate SRB in the digester. These technologies can be effective in removing H2S from the biogas stream but often have high capital and/or chemical usage costs and, in the case of aerobic treatment, require control of sulfuric acid buildup in the reactors. 2.3 PROJECT TECHNOLOGY DESCRIPTION This investigation evaluated a sulfide removal technology based on control of H2S in the digester (i.e., at the source) to reduce its concentrations in the biogas stream. More specifically, this project evaluated the addition of dissolved iron compounds to the digester to precipitate sulfur as insoluble iron sulfides. This method is used successfully to control H2S levels in sludge digesters at municipal wastewater treatment plants. The basic chemical reaction for two commonly used dissolved iron compounds and H2S are as follows:
FeCl2 + H2S → FeS ↓+ 2 HCl
2 FeCl3 + 3 H2S → Fe2S3 ↓+ 6 HCl McFarland and Jewell (1989) evaluated the addition of iron phosphate to anaerobic digesters and concluded that this approach could be an effective method for H2S control. In their laboratory study, the addition of iron phosphate to an anaerobic digester reduced hydrogen sulfide concentrations in the biogas from approximately 2,500 ppmv to 100 ppmv. This decrease was accompanied with a rise in the pH from 6.7 to 8.2 and an increase in soluble sulfide concentrations from 18 to 61 mg/L. The formation of stable, insoluble metal sulfides in anaerobic environments is favored at pH levels of 6.0 and above (Ehrlich, 1996). The addition of iron compounds to anaerobic manure digesters for H2S control has been attempted over the past decade but has yielded mixed results (Zicari, 2003). This is likely due to the complex relationship between iron and sulfur in anaerobic digestion. While sulfur and iron are needed as trace nutrients to maintain a healthy digestion process, accumulation of dissolved hydrogen sulfide in the digester to levels between 150-200 mg/L can adversely affect the anaerobia digestion process (Speece, 1996). Also, dissolved hydrogen sulfide readily binds with iron (and other trace metals) to form
7
highly insoluble metal sulfides. Under such conditions, trace metals needed for the digestion process (such as iron, nickel, and cobalt) become unavailable to the digestion process. Thus, a balance must be established in the addition of iron whereby sufficient iron is added to the digester to: (i) bind with dissolved hydrogen sulfide; and (ii) supply the digestion process with iron as a micronutrient, without wastage or overdosing. In addition to causing hydrogen sulfide to decrease in the biogas, addition of iron may improve process efficiency by making needed trace metals (e.g. iron, cobalt, and nickel) more “bioavailable” for utilization by anaerobic bacteria. The potential benefits of direct addition of dissolved iron to dairy digesters stems from the relatively low cost of these compounds (e.g., 30% FeCl2 solution costs approximately $0.08/lb) and the significant impact of removing dissolved H2S from the digester liquid matrix on the biogas H2S concentrations. Based on the partition coefficient for H2S, approximately 26 mg/L in the dissolved phase correspond to 10,000 ppmv in the gas phase (Speece, 1996). Thus, reducing the dissolved-phase H2S concentration by 1 mg/L would result in a reduction of 380 ppmv of the H2S concentration in the biogas stream. Therefore, dissolved H2S concentrations in dairy digesters only need to be reduced by 5 to 7 mg/L to obtain a significant reduction in H2S concentrations in the biogas stream. While this approach is not expected to reduce H2S concentrations to single-digit ppmv levels, it has the potential to reduce H2S in the biogas by 50%. Such a reduction would greatly mitigate the adverse effects of H2S on biogas utilization equipment and improve their efficiency in utilizing biogas from dairy digesters. 3.0 DESCRIPTION OF FARM OPERATIONS AND DIGESTER SYSTEM EMG selected AA Dairy, LLC, in Candor NY (the Farm) as the site for completing this investigation. The Farm has an operational anaerobic digester for manure treatment and electricity generation. EMG performed an onsite assessment and a review of available records and reports relating to the Farm’s digester and its operation. AA Dairy is a 600-cow dairy farm located in the town of Candor in Tioga County, NY. In 1998, AA Dairy decided to build and operate and anaerobic digester to: 1) address odor complaints from the surrounding community; 2) benefit from the electricity and heat generated from the biogas; 3) compost the post-digested separated solids; and 4) potentially use liquid from the separated digested effluent for irrigation. The electricity produced from powering the generator set is used for on-farm needs. Excess electricity produced is sold to New York State Electric and Gas (NYSEG) under provisions of the New York State Net Metering laws. The post-digestion separated solids are cured and marketed as compost to local buyers. The separated liquid effluent is mixed with milk house wastewater and allowed to flow by gravity to a lined long-term storage pond, and is eventually land applied by tanker truck or used for irrigation by way of underground piping.

8
The AA Digester system is a plug-flow digester designed to handle manure from a 1,000-cow dairy farm. The digester is a below-grade cast-in-place concrete digester structure that is 130 feet long, 30 feet wide and 14 feet deep. The digester is equipped with an airtight, flexible dome to trap biogas (made from Hypalon 45). The manure is kept at approximately 100oF in the digester for optimal biogas production. A 7.5-Hp piston pump sends raw manure mixed with bedding (sawdust) to the digester, and operates for a period of four to six hours per day. Wastewater from the milking parlor or liquid effluent from the solid-liquid separator is used to dilute the manure stream as needed. Approximately 11,000 gallons of influent manure are fed to the digester each day. Based on the dimensions of the digester, the current hydraulic retention time (HRT) for the AA Dairy digester is approximately 37 to 40 days. The anaerobic digester produces between 13,200 and 48,500 Standard Cubic Feet per Day (SCFD) of biogas with an average daily biogas production of 34,700 SCFD. The produced biogas contains 34% to 40% CO2, with an average CO2 content of 34.7%. Methane gas (CH4) accounts for the balance of the biogas content. Therefore, the produced biogas stream contains roughly 60% to 66% CH4, with an average CH4 concentration of 65.3%. The biogas stream also contains approximately 4,000 ppmv (or 0.4%) H2S (based on Sensidyne Tube testing). The produced biogas stream is converted into electricity using a Caterpillar engine generator (Gooch and Pronto, 2008). Photographs of the AA Dairy Digester system are provided below (see Photos 3-1 through 3-4).
Photo 3-1―AA Dairy Digester in Operation

9
Photo 3-2―Houle Piston Pump Used to Deliver Raw Manure into the Digester
Photo 3-3― EMG Sampling of the Raw Manure Stream Fed into the AA Dairy Digester
10
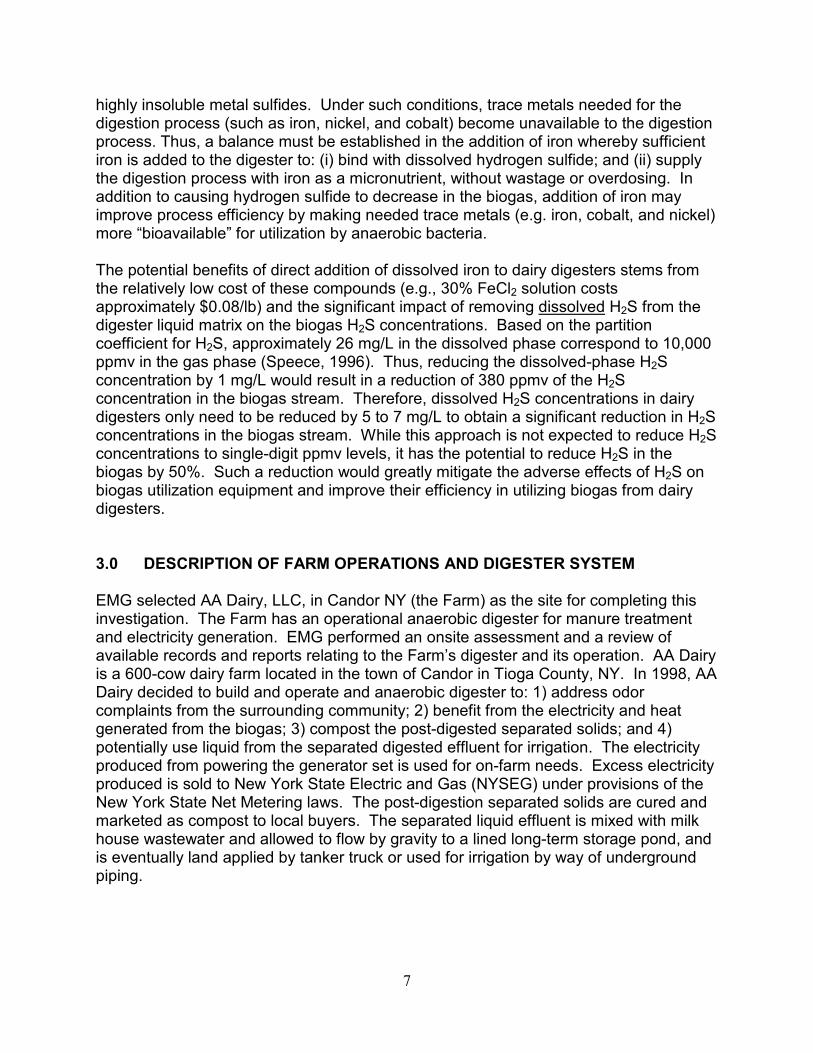
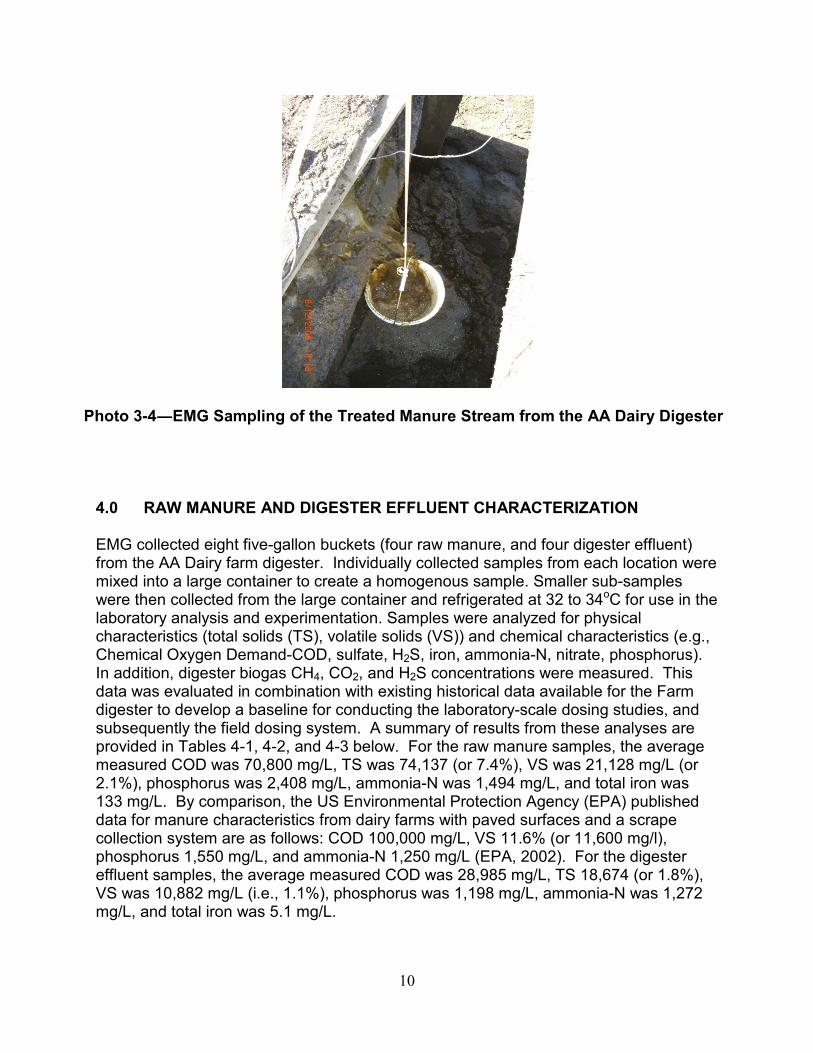
Photo 3-4―EMG Sampling of the Treated Manure Stream from the AA Dairy Digester
4.0 RAW MANURE AND DIGESTER EFFLUENT CHARACTERIZATION EMG collected eight five-gallon buckets (four raw manure, and four digester effluent) from the AA Dairy farm digester. Individually collected samples from each location were mixed into a large container to create a homogenous sample. Smaller sub-samples were then collected from the large container and refrigerated at 32 to 34oC for use in the laboratory analysis and experimentation. Samples were analyzed for physical characteristics (total solids (TS), volatile solids (VS)) and chemical characteristics (e.g., Chemical Oxygen Demand-COD, sulfate, H2S, iron, ammonia-N, nitrate, phosphorus). In addition, digester biogas CH4, CO2, and H2S concentrations were measured. This data was evaluated in combination with existing historical data available for the Farm digester to develop a baseline for conducting the laboratory-scale dosing studies, and subsequently the field dosing system. A summary of results from these analyses are provided in Tables 4-1, 4-2, and 4-3 below. For the raw manure samples, the average measured COD was 70,800 mg/L, TS was 74,137 (or 7.4%), VS was 21,128 mg/L (or 2.1%), phosphorus was 2,408 mg/L, ammonia-N was 1,494 mg/L, and total iron was 133 mg/L. By comparison, the US Environmental Protection Agency (EPA) published data for manure characteristics from dairy farms with paved surfaces and a scrape collection system are as follows: COD 100,000 mg/L, VS 11.6% (or 11,600 mg/l), phosphorus 1,550 mg/L, and ammonia-N 1,250 mg/L (EPA, 2002). For the digester effluent samples, the average measured COD was 28,985 mg/L, TS 18,674 (or 1.8%), VS was 10,882 mg/L (i.e., 1.1%), phosphorus was 1,198 mg/L, ammonia-N was 1,272 mg/L, and total iron was 5.1 mg/L.
11
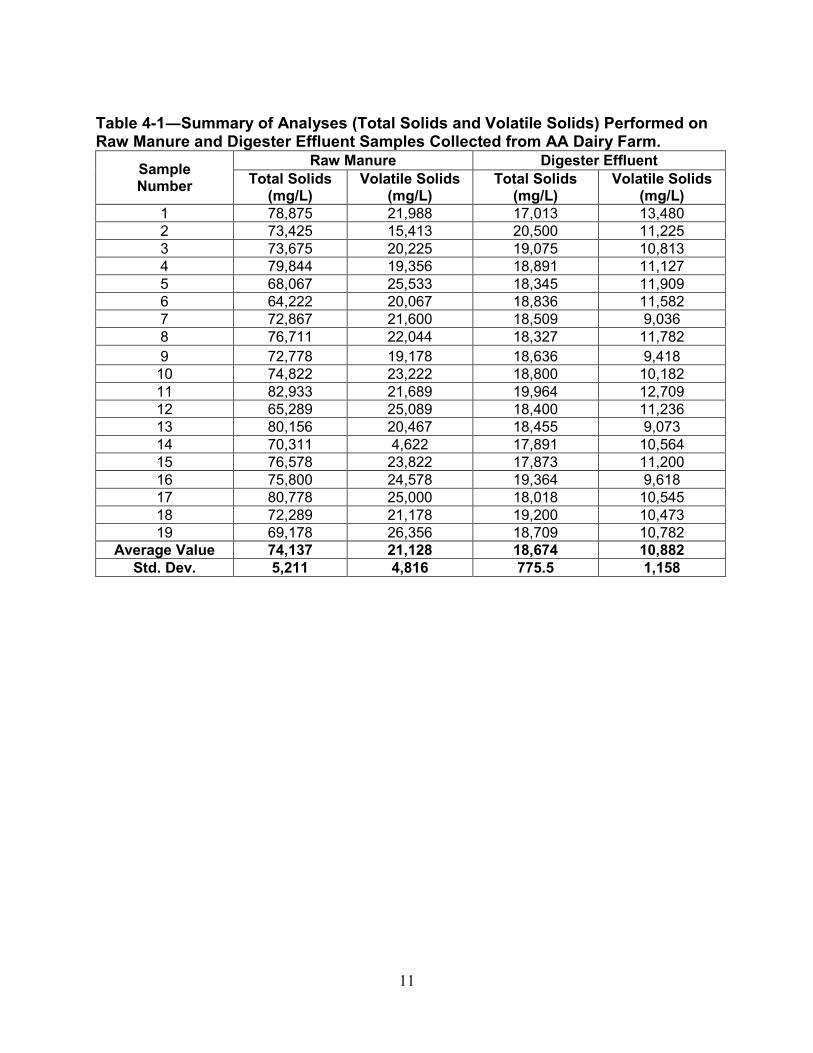
Table 4-1―Summary of Analyses (Total Solids and Volatile Solids) Performed on Raw Manure and Digester Effluent Samples Collected from AA Dairy Farm.
Sample Number
Raw Manure Digester Effluent Total Solids
(mg/L) Volatile Solids
(mg/L) Total Solids
(mg/L) Volatile Solids
(mg/L) 1 78,875 21,988 17,013 13,480 2 73,425 15,413 20,500 11,225 3 73,675 20,225 19,075 10,813 4 79,844 19,356 18,891 11,127 5 68,067 25,533 18,345 11,909 6 64,222 20,067 18,836 11,582 7 72,867 21,600 18,509 9,036 8 76,711 22,044 18,327 11,782 9 72,778 19,178 18,636 9,418 10 74,822 23,222 18,800 10,182 11 82,933 21,689 19,964 12,709 12 65,289 25,089 18,400 11,236 13 80,156 20,467 18,455 9,073 14 70,311 4,622 17,891 10,564 15 76,578 23,822 17,873 11,200 16 75,800 24,578 19,364 9,618 17 80,778 25,000 18,018 10,545 18 72,289 21,178 19,200 10,473 19 69,178 26,356 18,709 10,782
Average Value 74,137 21,128 18,674 10,882 Std. Dev. 5,211 4,816 775.5 1,158

12
Table 4-2―Summary of Chemical Characteristics Measured in Raw Manure Samples Collected from AA Dairy Farm.
Sample Number
COD (mg/L)
Ammonia (mg/L)
Nitrate (mg/L)
Phosphorous (mg/L)
Sulfate (mg/L)
Sulfide (mg/L)
Total Iron (mg/L)
1 54,700 1,630 1,520 2,470 800 51.2 145 2 74,550 1,610 1,780 2,365 600 52.2 135 3 77,350 1,480 920 2,630 540 49.7 139.5 4 73,300 1,320 1,490 2,480 3,400 53 95 5 71,800 1,440 1,260 2,570 3,700 51.1 144 6 72,650 1,490 1,140 2,210 3,900 48.2 134 7 72,400 1,530 1,010 2,680 4,000 49.1 142.5 8 61,800 1,400 1,010 2,395 4,300 46.2 143 9 77,800 1,390 1,620 2,315 3,600 50.1 138.5 10 71,650 1,650 1,220 1,965 3,900 49.1 110
Avg. Value 70,800 1,494 1,297 2,408 2,874 50.0 132.7 Std. Dev. 7,150.2 110.9 291.2 212 1,557 2.0 16.7
Table Notes: • COD denotes Chemical Oxygen Demand • Nitrate analysis is based on NO3-N concentration measurement • Phosphorous analysis is based on PO4 concentration measurement • Sulfate analysis is based on SO4 concentration measurement • Ammonia is based on NH3-N concentration measurement • Total iron is mg Fe per L Table 4-3―Summary of Chemical Characteristics Measured in Digester Effluent Samples Collected from AA Dairy Farm.
Sample Number
COD (mg/L)
Ammonia (mg/L)
Nitrate (mg/L)
Phosphorous (mg/L)
Sulfate (mg/L)
Sulfide (mg/L)
Total Iron (mg/L)
1 25,400 940 410 1,372 4,200 29.9 7 2 30,150 1,407 210 1,142 4,400 29.3 6 3 29,700 1,600 200 1,000 4,300 31.9 1 4 30,550 1,110 230 1,335 3,900 30.2 8 5 30,200 1,040 220 1,129 4,400 -- 9.5 6 31,050 1,110 210 1,132 3,900 -- 3 7 30,350 2,010 240 1,156 4,800 -- 7.5 8 27,700 1,630 220 1,422 5,300 -- 4.5 9 28,100 1,040 260 1,100 4,700 -- 2.5 10 26,650 830 540 1,197 4,000 -- 2
Avg. Value 28,985 1,271.7 274 1,198.5 4,390 30.3 5.1 Std. Dev. 1,905 374.8 111.6 134.2 443.4 1.1 2.9
Table Notes: • COD denotes Chemical Oxygen Demand • Nitrate analysis is based on NO3-N concentration measurement • Phosphorous analysis is based on PO4 concentration measurement • Sulfate analysis is based on SO4 concentration measurement • Ammonia is based on NH3-N concentration measurement • Total iron is mg Fe per L

13
5.0 LABORATORY DOSING EXPERIMENTATION An experimental investigation designed to evaluate the dose of dissolved iron needed to reduce dissolved hydrogen sulfide (H2S) levels in the digester effluent was completed at EMG’s laboratory facility in Aston, PA. Based on H2S and sulfate levels measured in samples collected from the Farm, the theoretical dosing amounts of iron solution needed to reduce H2S levels in the digester bulk liquid were calculated. The chemical reaction used to estimate the theoretical iron amount needed is as follows:
FeCl2 + H2S → FeS ↓+ 2 HCl
FeCl2 + SO42- → FeSO4↓+ 2Cl-
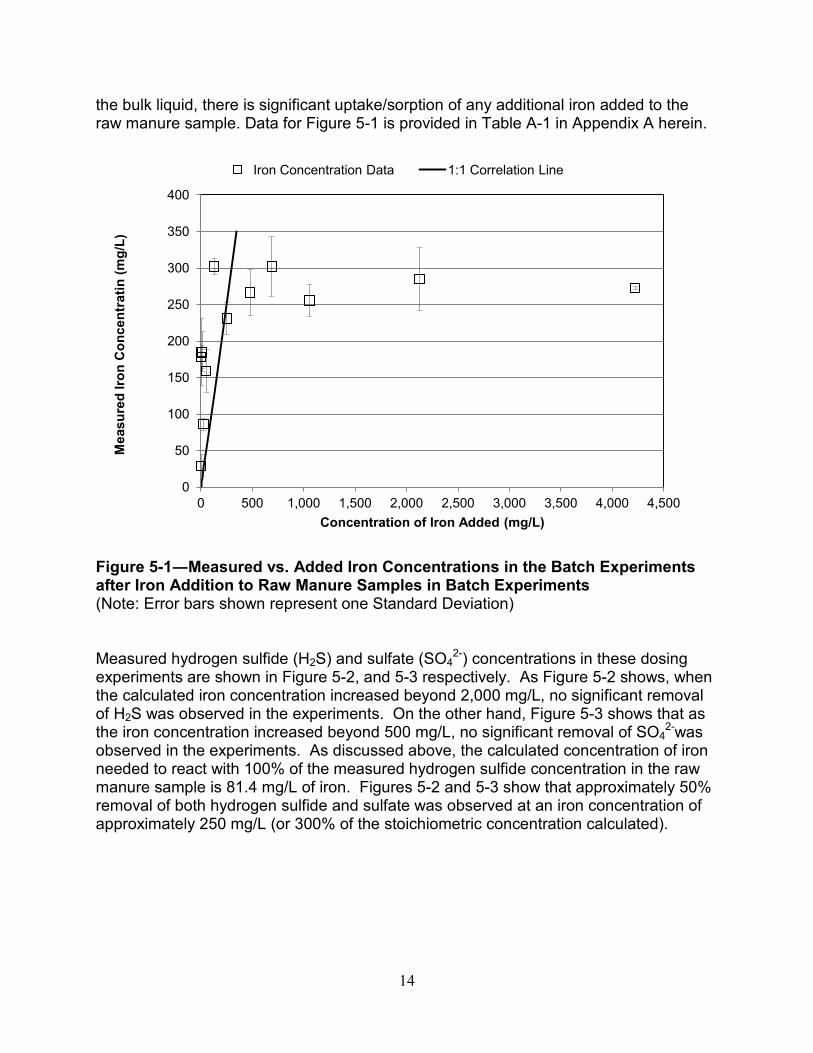
Based on this reaction, 1.63 mg/L of iron (Fe) is needed to react with 1 mg/L of hydrogen sulfide. Using the average measured liquid hydrogen sulfide concentration of 50 mg/L in the raw manure (Table 4-2), the calculated required iron dose is 81.5 mg Fe/L. This value was used as a reference point for dissolved iron addition given that other sinks for iron are likely present in the digester bulk liquid matrix. Dosing experiments were performed using triplicate batch experiments. For each experiment, a 250 milliliters bottle was filled with a raw (unfiltered) manure sample collected from the Farm. Each bottle contained a magnetic stirrer to maintain well-mixed conditions in the batch. Using an iron chloride stock solution, 13 dosing amounts that would result in the following iron concentrations were evaluated: 1.0, 2.5, 7.0, 13, 25, 50, 130, 250, 480, 700, 1,000, 2,100, and 4,200 mg Fe/L. These concentrations represent approximately 1.5%, 3%, 8%, 15%, 30%, 65%, 160%, 300%, 600%, 850%, 1,300%, 2,600%, and 5,200%, respectively, of the stoichiometrically-calculated iron dose needed to react with the measured hydrogen sulfide amount in the raw manure. Sulfate and total sulfides concentrations in each experiment were analyzed before and after iron addition. Each sample was mixed for a minimum of one hour after iron addition and prior to analysis. Results obtained from these iron dosing experiments are shown in Figures 5-1, 5-2, and 5-3 below. The measured iron concentration in the batch bottles, as compared to the calculated iron concentration, is shown in Figure 5-1. As Figure 5-1 shows, the iron concentrations in the experiments initially increased proportionally with the amount of iron chloride added then reached a plateau of approximately 300 mg/L regardless of the amount of iron chloride added. The data shown in Figure 5-1 was expected to have a 1:1 correlation. However, the observed correlation as measured by analytical data was clearly different from a 1:1 correlation. This discrepancy is likely due to the presence of high concentrations of suspended solids and organic material in the bulk liquid matrix, as well as the highly-reductive/reactive anaerobic environment in the liquid matrix in the batches. Low Oxidation-Reduction Potential (ORP) combined with high suspended and organic solids in the bulk liquid matrix can result in significant uptake and loss of available iron ions due to chemical binding and absorption to solid surfaces. The results in Figure 5-1 show that, after the initial increase in the measured iron concentration in
14
the bulk liquid, there is significant uptake/sorption of any additional iron added to the raw manure sample. Data for Figure 5-1 is provided in Table A-1 in Appendix A herein.
Figure 5-1―Measured vs. Added Iron Concentrations in the Batch Experiments after Iron Addition to Raw Manure Samples in Batch Experiments (Note: Error bars shown represent one Standard Deviation) Measured hydrogen sulfide (H2S) and sulfate (SO4
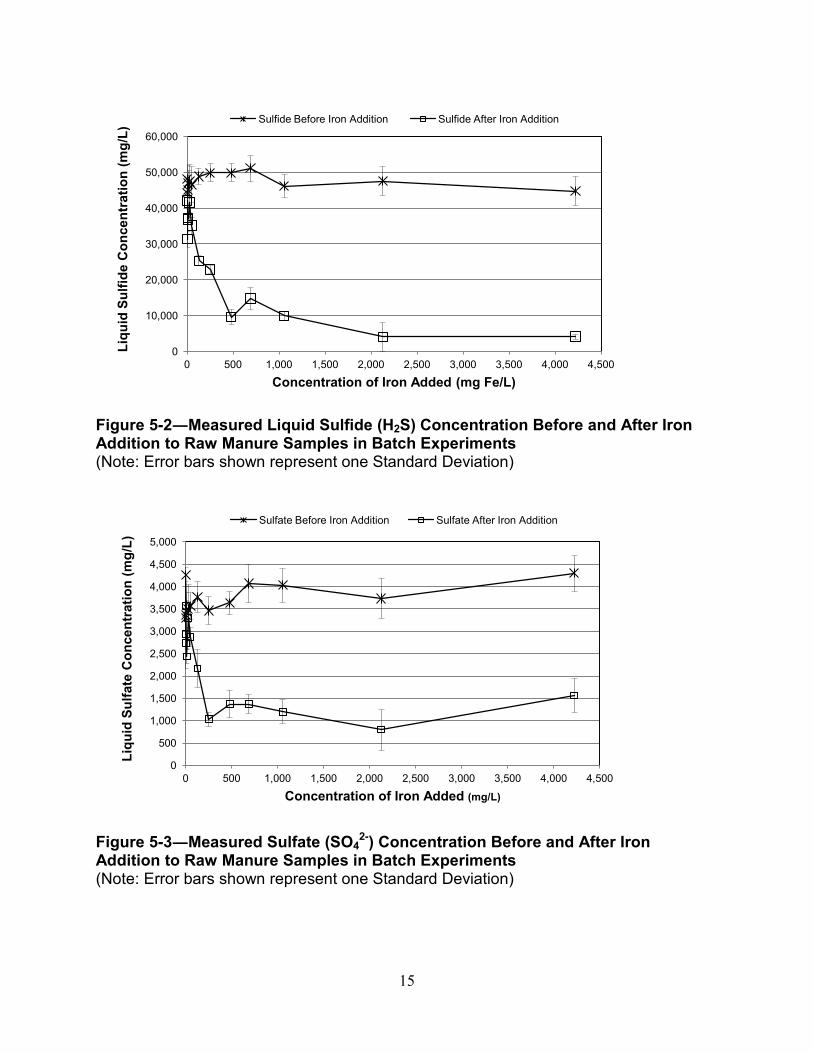
2-) concentrations in these dosing experiments are shown in Figure 5-2, and 5-3 respectively. As Figure 5-2 shows, when the calculated iron concentration increased beyond 2,000 mg/L, no significant removal of H2S was observed in the experiments. On the other hand, Figure 5-3 shows that as the iron concentration increased beyond 500 mg/L, no significant removal of SO4
2-was observed in the experiments. As discussed above, the calculated concentration of iron needed to react with 100% of the measured hydrogen sulfide concentration in the raw manure sample is 81.4 mg/L of iron. Figures 5-2 and 5-3 show that approximately 50% removal of both hydrogen sulfide and sulfate was observed at an iron concentration of approximately 250 mg/L (or 300% of the stoichiometric concentration calculated).
0
50
100
150
200
250
300
350
400
0 500 1,000 1,500 2,000 2,500 3,000 3,500 4,000 4,500
Mea
sure
d Iro
n C
once
ntra
tin (m
g/L)
Concentration of Iron Added (mg/L)
Iron Concentration Data 1:1 Correlation Line
15
Figure 5-2―Measured Liquid Sulfide (H2S) Concentration Before and After Iron Addition to Raw Manure Samples in Batch Experiments (Note: Error bars shown represent one Standard Deviation)
Figure 5-3―Measured Sulfate (SO4
2-) Concentration Before and After Iron Addition to Raw Manure Samples in Batch Experiments (Note: Error bars shown represent one Standard Deviation)
0
10,000
20,000
30,000
40,000
50,000
60,000
0 500 1,000 1,500 2,000 2,500 3,000 3,500 4,000 4,500
Liqu
id S
ulfid
e C
once
ntra
tion
(mg/
L)
Concentration of Iron Added (mg Fe/L)
Sulfide Before Iron Addition Sulfide After Iron Addition
0
500
1,000
1,500
2,000
2,500
3,000
3,500
4,000
4,500
5,000
0 500 1,000 1,500 2,000 2,500 3,000 3,500 4,000 4,500
Liqu
id S
ulfa
te C
once
ntra
tion
(mg/
L)
Concentration of Iron Added (mg/L)
Sulfate Before Iron Addition Sulfate After Iron Addition
16
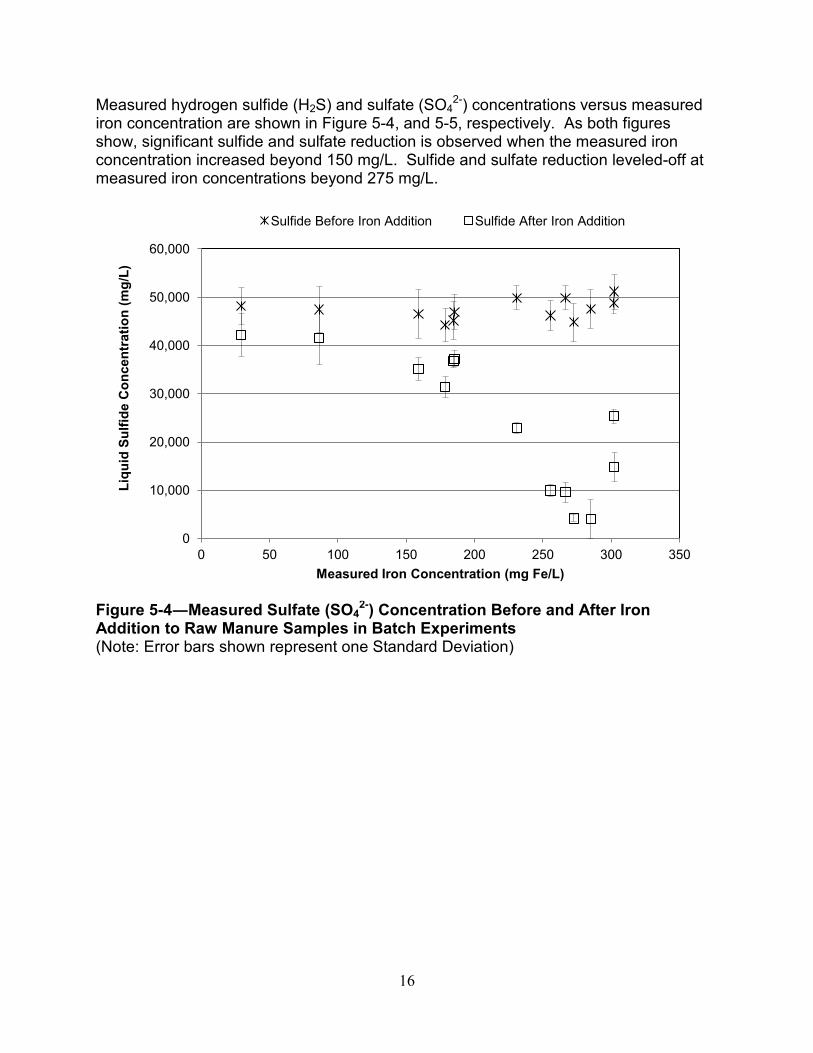
Measured hydrogen sulfide (H2S) and sulfate (SO42-) concentrations versus measured
iron concentration are shown in Figure 5-4, and 5-5, respectively. As both figures show, significant sulfide and sulfate reduction is observed when the measured iron concentration increased beyond 150 mg/L. Sulfide and sulfate reduction leveled-off at measured iron concentrations beyond 275 mg/L.
Figure 5-4―Measured Sulfate (SO42-) Concentration Before and After Iron
Addition to Raw Manure Samples in Batch Experiments (Note: Error bars shown represent one Standard Deviation)
0
10,000
20,000
30,000
40,000
50,000
60,000
0 50 100 150 200 250 300 350
Liqu
id S
ulfid
e C
once
ntra
tion
(mg/
L)
Measured Iron Concentration (mg Fe/L)
Sulfide Before Iron Addition Sulfide After Iron Addition

17
Figure 5-5―Measured Sulfate (SO4
2-) Concentration Before and After Iron Addition to Raw Manure Samples in Batch Experiments (Note: Error bars shown represent one Standard Deviation) Based on the data observed in Figures 5-2 and 5-3, the percent reduction in sulfide and sulfate concentrations were calculated as follows:
% reduction = (starting concentration - ending concentration) x 100 starting concentration
The calculated reductions in sulfide and sulfate are shown in Figure 5-6. As the figure shows, as the added iron concentration increased to 500 mg/L, the percent reduction in both sulfides and sulfates increased to approximately 80%. These results were used to design the field dosing system for the AA Dairy digester.
0
500
1,000
1,500
2,000
2,500
3,000
3,500
4,000
4,500
5,000
0 50 100 150 200 250 300 350
Liqu
id S
ulfa
te C
once
ntra
tion
(mg/
L)
Measured Iron Concentration (mg/L)
Sulfate Before Iron Addition Sulfate After Iron Addition

18
Figure 5-6― Reduction in Sulfate and Sulfide Concentrations at the Different Iron Concentrations in the Dosing Batch Samples in Batch Experiments (Note: Error bars shown represent one Standard Deviation)
0%
10%
20%
30%
40%
50%
60%
70%
80%
90%
100%
0 500 1,000 1,500 2,000 2,500 3,000 3,500 4,000 4,500
Red
uctio
n (%
)
Calculated Iron Concentration (mg/L)
Sulfate Sulfide
19
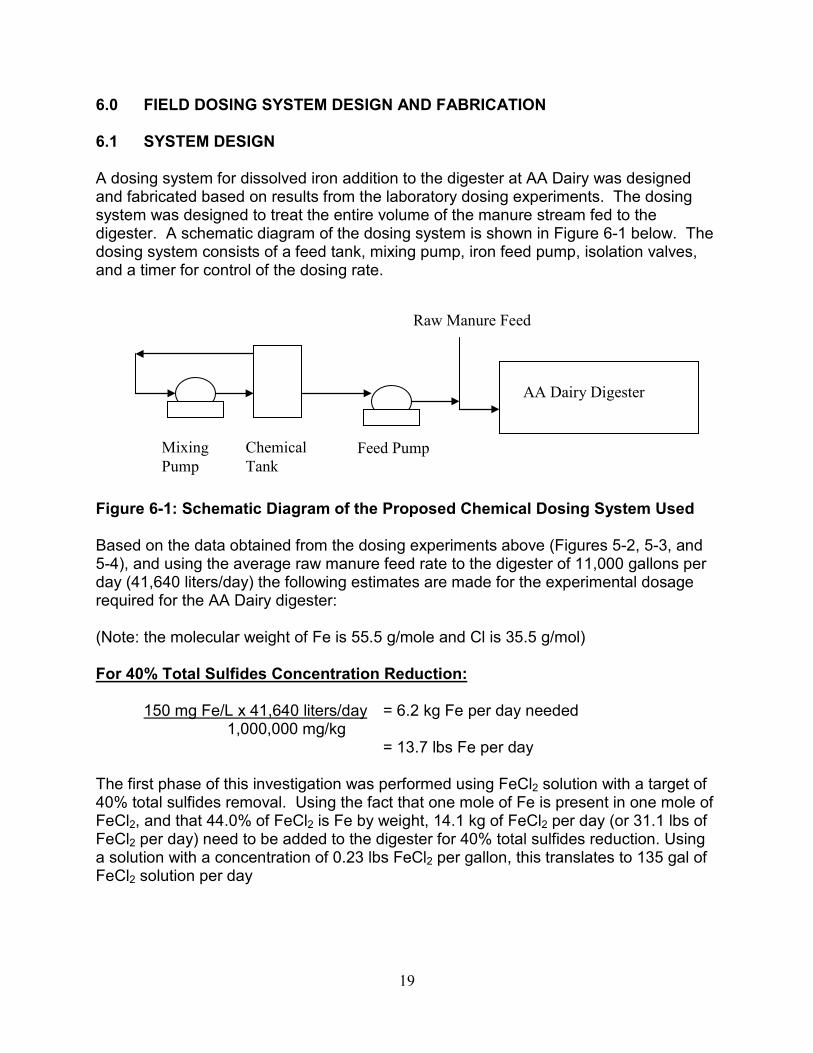
6.0 FIELD DOSING SYSTEM DESIGN AND FABRICATION 6.1 SYSTEM DESIGN A dosing system for dissolved iron addition to the digester at AA Dairy was designed and fabricated based on results from the laboratory dosing experiments. The dosing system was designed to treat the entire volume of the manure stream fed to the digester. A schematic diagram of the dosing system is shown in Figure 6-1 below. The dosing system consists of a feed tank, mixing pump, iron feed pump, isolation valves, and a timer for control of the dosing rate. Figure 6-1: Schematic Diagram of the Proposed Chemical Dosing System Used
Raw Manure Feed
Chemical Tank
Feed Pump
AA Dairy Digester
Mixing Pump
Based on the data obtained from the dosing experiments above (Figures 5-2, 5-3, and 5-4), and using the average raw manure feed rate to the digester of 11,000 gallons per day (41,640 liters/day) the following estimates are made for the experimental dosage required for the AA Dairy digester: (Note: the molecular weight of Fe is 55.5 g/mole and Cl is 35.5 g/mol) For 40% Total Sulfides Concentration Reduction:
150 mg Fe/L x 41,640 liters/day = 6.2 kg Fe per day needed 1,000,000 mg/kg
= 13.7 lbs Fe per day The first phase of this investigation was performed using FeCl2 solution with a target of 40% total sulfides removal. Using the fact that one mole of Fe is present in one mole of FeCl2, and that 44.0% of FeCl2 is Fe by weight, 14.1 kg of FeCl2 per day (or 31.1 lbs of FeCl2 per day) need to be added to the digester for 40% total sulfides reduction. Using a solution with a concentration of 0.23 lbs FeCl2 per gallon, this translates to 135 gal of FeCl2 solution per day

20
For 60% Total Sulfides Concentration Reduction:
250 mg Fe/L x 41,640 liters/day = 10.4 kg Fe per day needed 1,000,000 mg/kg
= 22.9 lbs Fe per day The second phase of this investigation was performed using FeCl3 solution since it would provide a less costly alternative for farm digester applications (calculated on a pound for pound basis), with a target of 60% total sulfides removal. Using the fact that one mole of Fe is present in one mole of FeCl3, and that 34.4% of FeCl3 is Fe by weight, 30.3 kg of FeCl3 per day (or 66.6 lbs of FeCl3 per day) need to be added to the digester for 60% total sulfides reduction. Using a solution with a concentration of 0.48 lbs FeCl3 per gallon, this translates to 139 gal of FeCl3 solution per day. Therefore, the field chemical dosing system was designed to deliver a maximum of 180 Gallons per Day (GPD) of iron solution. A diaphragm pump (Pulsafeeder E series) was used to deliver the required dose to the digester. The dosing pump was operated on a timer to deliver the desired amounts of FeCl2 or FeCl3 to the digester over a 24-hour period. Data obtained from field operation of the demonstration dosing system was evaluated to determine the effects of iron dosing on sulfides reduction in the produced biogas stream from the anaerobic digester at AA Dairy. 6.2 FIELD DOSING EXPERIMENTATION RESULTS The field dosing system was installed and operated at AA Dairy for approximately 80 days. Prior to starting the chemical feed system, samples were collected from the digester for a period of one week to establish base line H2S concentrations in the biogas and digester effluent streams. Iron solution was fed to the digester over a time period that represented approximately two hydraulic retention times (HRTs). Samples were collected from the raw manure feed line, the digester effluent, and the biogas stream to determine the effects of the dosing system on H2S concentrations in the biogas stream. Analytical results of the field samples are shown in Tables 6-1, and 6-2.

21
Table 6-1. Summary of Measured Parameters for the Influent Raw Manure Stream at AA Dairy. Table Notes:
Percent Total Dissolved COD Total Suspended Total Iron Dissolved Total Alkalinity (as Day Solids Sulfides Sulfides pH (mg/L) Solids (mg/L) (mg/kg) Iron (mg/kg) CaCO3) (mg/L) (%) (mg/kg) (mg/kg)
0 36,000 38,500 8.65% 208 < 100 63 3.9 7.31 8,830
9 232,000 25,500 10.3% 176 112 61 6.1 7.48 15,520
19 168,000 49,400 14.1% 256 128 52 3.6 7.06 12,120
29 116,352 30,000 15.8% 128 < 100 61 7.4 7.2 12,560
39 160,000 23,000 13.0% 176 < 100 45 < 2.0 7.42 11,920
49 152,000 89,000 20.3% 288 < 100 63 3.5 7.74 11,840
59 79,992 35,000 13.0% 192 < 100 55 3.6 7.50 1,184
69 53,328 30,000 12.0% 208 < 100 20 4.5 7.72 1,092
79 44,440 29,000 12.0% 160 < 100 31 2.0 7.65 960
• Experimental investigation started on Day 0 • COD denotes Chemical Oxygen Demand • pH measured in water (at 25oC) • < denotes "Below Analytical Detection Limit" • Total Sulfides measured as S2-
S2-• Dissolved Sulfides measured as • Alkalinity measured as CaCO3 • Total Sulfate and Dissolved Sulfate were analyzed but they were both below the detection limits of 2,500mg/Kg and 500 mg/Kg, respectively, for the
duration of the study.

22
Table 6-2. Summary of Measured Parameters for the Digester Effluent at AA Dairy. Table Notes:
Day COD (mg/L)
Total Suspended Solids (mg/L)
Percent Solids (%)
Total Sulfides (mg/kg)
Total Iron (mg/kg)
Dissolved Iron (mg/kg) pH Total Alkalinity (as
CaCO3) (mg/L)
0 20,000 36,500 7.7% 232 65 12.0 8.01 17,200
9 72,000 23,500 7.2% 112 74 15.0 7.97 18,160
19 48,000 28,200 8.4% 176 89 35.0 7.99 16,560
29 50,904 20,666 7.7% 100 111 30.0 8.08 18,020
39 48,000 19,333 9.0% 160 115 30.0 8.20 17,400
49 64,000 21,333 7.5% 176 148 35.0 8.22 17,440
59 35,600 25,300 10.0% 176 171 37.0 8.10 1,656
69 35,552 25,333 8.0% 144 166 37.0 8.31 1,688
79 35,552 21,333 9.0% 144 142 14.0 8.24 780
• Experimental investigation started on Day 0 • COD denotes Chemical Oxygen Demand • pH measured in water (at 25oC) • < denotes "Below Analytical Detection Limit" • Total Sulfides measured as S2- • Dissolved Sulfides measured as S2- • Alkalinity measured as CaCO3 • Total Sulfate, Dissolved Sulfate, and Dissolved Sulfides were analyzed, but they were all below the detection limits of 2,500 mg/Kg for Total Sulfates, 500
mg/Kg for Dissolved Sulfate, and 100 mg/Kg for Dissolved Sulfides for the duration of the study.
23
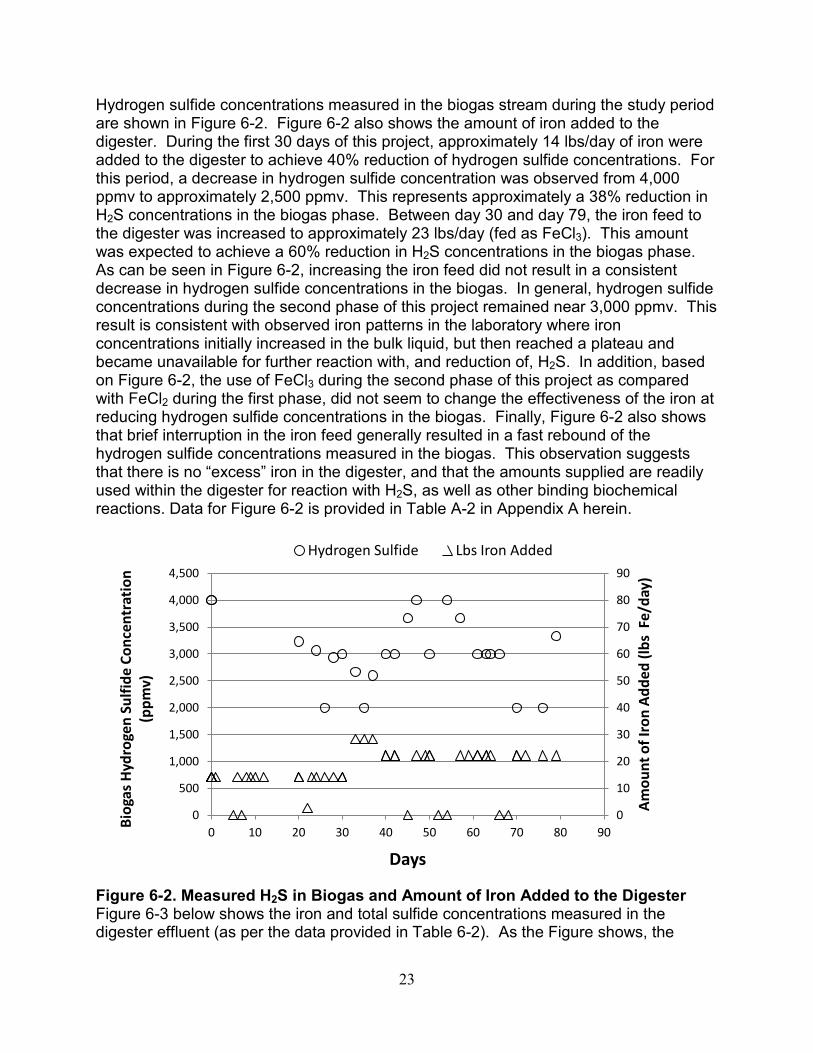
Hydrogen sulfide concentrations measured in the biogas stream during the study period are shown in Figure 6-2. Figure 6-2 also shows the amount of iron added to the digester. During the first 30 days of this project, approximately 14 lbs/day of iron were added to the digester to achieve 40% reduction of hydrogen sulfide concentrations. For this period, a decrease in hydrogen sulfide concentration was observed from 4,000 ppmv to approximately 2,500 ppmv. This represents approximately a 38% reduction in H2S concentrations in the biogas phase. Between day 30 and day 79, the iron feed to the digester was increased to approximately 23 lbs/day (fed as FeCl3). This amount was expected to achieve a 60% reduction in H2S concentrations in the biogas phase. As can be seen in Figure 6-2, increasing the iron feed did not result in a consistent decrease in hydrogen sulfide concentrations in the biogas. In general, hydrogen sulfide concentrations during the second phase of this project remained near 3,000 ppmv. This result is consistent with observed iron patterns in the laboratory where iron concentrations initially increased in the bulk liquid, but then reached a plateau and became unavailable for further reaction with, and reduction of, H2S. In addition, based on Figure 6-2, the use of FeCl3 during the second phase of this project as compared with FeCl2 during the first phase, did not seem to change the effectiveness of the iron at reducing hydrogen sulfide concentrations in the biogas. Finally, Figure 6-2 also shows that brief interruption in the iron feed generally resulted in a fast rebound of the hydrogen sulfide concentrations measured in the biogas. This observation suggests that there is no “excess” iron in the digester, and that the amounts supplied are readily used within the digester for reaction with H2S, as well as other binding biochemical reactions. Data for Figure 6-2 is provided in Table A-2 in Appendix A herein.
Figure 6-2. Measured H2S in Biogas and Amount of Iron Added to the Digester Figure 6-3 below shows the iron and total sulfide concentrations measured in the digester effluent (as per the data provided in Table 6-2). As the Figure shows, the
0
10
20
30
40
50
60
70
80
90
0
500
1,000
1,500
2,000
2,500
3,000
3,500
4,000
4,500
0 10 20 30 40 50 60 70 80 90
Am
ount
of I
ron
Add
ed (l
bs F
e/da
y)
Biog
as H
ydro
gen
Sulfi
de C
once
ntra
tion
(p
pmv)
Days
Hydrogen Sulfide Lbs Iron Added

24
dissolved total sulfide concentration in the digester effluent decreased from approximately 230 mg/L to approximately 150 mg/L during this study. This decrease coincided with an increase in the measured iron concentration in the digester effluent from approximately 60 mg/L to approximately 160 mg/L. Based on the reaction ratio presented in Section 5.0 herein (i.e., 1.63 mg/L iron reacts with 1 mg/L of H2S), the measured increase in iron concentration in the digester of 100 mg/L should have resulted in a 61.3 mg/L decreased in H2S concentration in the liquid phase. This calculated amount is comparable to the observed 80 mg/L decrease in the liquid H2S concentration in the digester effluent. Note again that the actual measured iron concentration in the digester effluent was lower than the expected (or calculated) increase in iron concentration. This is attributable to the highly reductive anaerobic environment and the high total solids concentration in the bulk liquid matrix. These two factors create sinks that bind/absorb some of the added iron ions from the bulk liquid matrix before they react with available sulfide compounds.
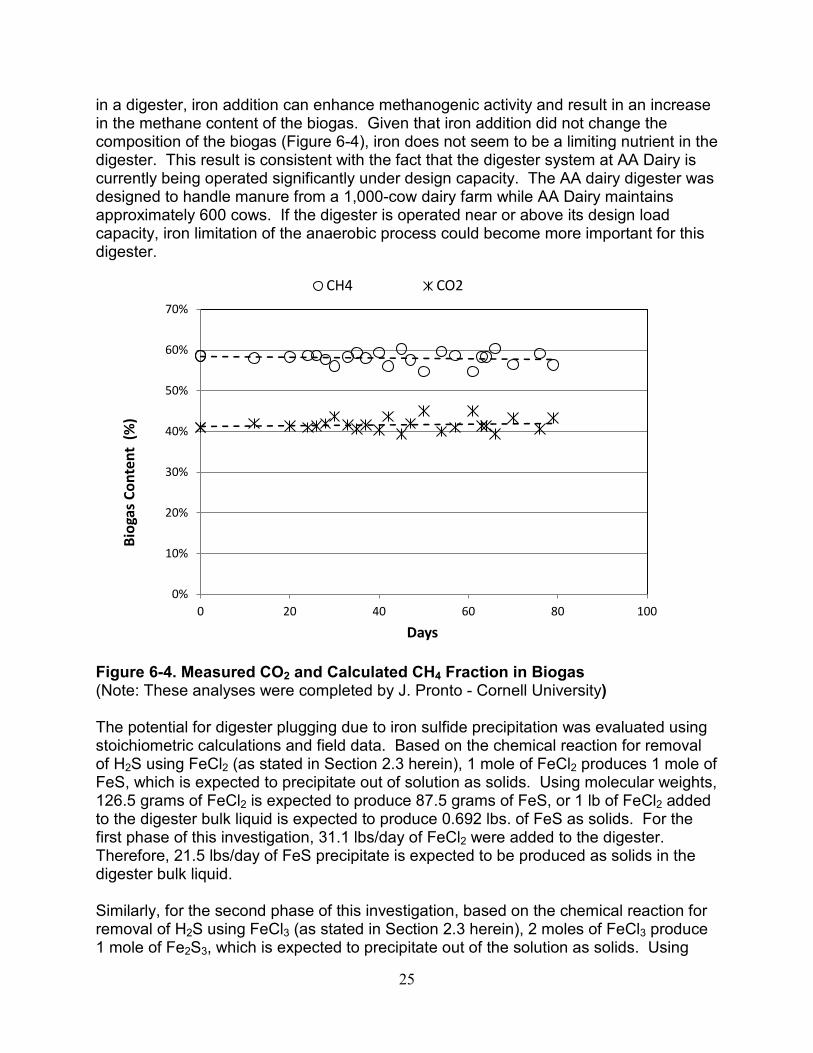
Figure 6-3. Measured Iron & Total Sulfide Concentrations in the Digester Effluent Methane (CH4) and Carbon Dioxide (CO2) composition in the biogas stream produced by the AA Dairy digester was measured during this investigation. Results of these analyses are presented in Figure 6-4 below. As the figure shows, the biogas CH4 and CO2 levels remained relatively steady around 58% and 42%, respectively, with no clear trend of concentration increase or decrease. In general, when iron is a limited nutrient
300
250
) L/g 200
(m notiatr 150
necnoC 100
diuqiL 50
0 0 10 20 30 40 50 60 70 80 90
Days
Effluent Total Iron Effluent Sulfide
Target Fe loading increased from 14.2 lbs./day to 22.1 lbs./day
25
in a digester, iron addition can enhance methanogenic activity and result in an increase in the methane content of the biogas. Given that iron addition did not change the composition of the biogas (Figure 6-4), iron does not seem to be a limiting nutrient in the digester. This result is consistent with the fact that the digester system at AA Dairy is currently being operated significantly under design capacity. The AA dairy digester was designed to handle manure from a 1,000-cow dairy farm while AA Dairy maintains approximately 600 cows. If the digester is operated near or above its design load capacity, iron limitation of the anaerobic process could become more important for this digester.
Figure 6-4. Measured CO2 and Calculated CH4 Fraction in Biogas (Note: These analyses were completed by J. Pronto - Cornell University) The potential for digester plugging due to iron sulfide precipitation was evaluated using stoichiometric calculations and field data. Based on the chemical reaction for removal of H2S using FeCl2 (as stated in Section 2.3 herein), 1 mole of FeCl2 produces 1 mole of FeS, which is expected to precipitate out of solution as solids. Using molecular weights, 126.5 grams of FeCl2 is expected to produce 87.5 grams of FeS, or 1 lb of FeCl2 added to the digester bulk liquid is expected to produce 0.692 lbs. of FeS as solids. For the first phase of this investigation, 31.1 lbs/day of FeCl2 were added to the digester. Therefore, 21.5 lbs/day of FeS precipitate is expected to be produced as solids in the digester bulk liquid. Similarly, for the second phase of this investigation, based on the chemical reaction for removal of H2S using FeCl3 (as stated in Section 2.3 herein), 2 moles of FeCl3 produce 1 mole of Fe2S3, which is expected to precipitate out of the solution as solids. Using
0%
10%
20%
30%
40%
50%
60%
70%
0 20 40 60 80 100
Bio
gas
Cont
ent
(%)
Days
CH4 CO2

26
molecular weights, 324 grams of FeCl3 is expected to produce 207 grams of Fe2S3, or 1 lb of FeCl3 added to the digester bulk liquid is expected to produce 0.639 lbs of Fe2S3 as solids. For the second phase of this investigation, 66.6 lbs/day of FeCl3 were added to the digester. Therefore, 42.6 lbs/day of Fe2S3 precipitate is expected to be produced as solids in the digester bulk liquid. By comparison, using the average total solids concentration of 74,137 mg/L (see 4-1 herein), and a flow rate of 11,000 gallons per day, the incoming raw manure stream introduces 6,805 lbs of solids per day into the AA Dairy digester. Thus, the expected additional solids loading from the H2S removal technology under investigation, is a negligible 0.32% and 0.63% for phase 1 and phase 2 respectively. The potential for digester plugging due to iron sulfide precipitation was also evaluated using field data (total suspended solids analyses shown in Table 6-2). As noted in Section 3.0 herein, the AA Dairy digester is a plug flow reactor with a 37 to 40 day Hydraulic Retention Time. Thus, for the digester bulk liquid, the effects of iron addition at the inlet point would be seen approximately 40 days later at the effluent point. Based on this understanding, an evaluation of the effect of iron addition on the bulk liquid total suspended solids content is presented in Table 6-3 below. Table 6-3. Affect of Iron Addition on Digester Effluent Total Suspended Solids
HRT PERIOD
TSS at T0
(mg/L) TSS at TF
(mg/L) REDUCTION IN TSS
(%) Day 0 — Day 39 36,500 19,333 47.0%
Day 9 — Day 49 23,500 21,333 9.2%
Day 19 — Day 59 28,200 25,300 10.3%
Day 29 — Day 69 20,666 25,333 -22.6%
Day 39 — Day 79 19,333 21,333 -10.4%
AVERAGE 6.7% Table Notes: • TSS Denotes Total Suspended Solids • T0 denotes beginning day in HRT Period • Tf denotes ending day in HRT Period
As shown in Table 6-3, the average reduction in effluent total suspended solids for the duration of this study was 6.7%. Since the calculated reduction in effluent TSS for the period from day 0 to day 39 is significantly higher than the remaining periods observed, this measurement appears to have been skewed by sampling irregularity/error. If the values for the period from day 0 to day 39 are not included in the calculations, the change in the effluent total suspended solids content over the duration of this study is negligible. Based on stoichiometric calculations and the results shown in Table 6-3, iron addition and precipitation are not expected to affect digester plugging.

27
6.3 ECONOMIC EVALUATION OF PROPOSED TECHNOLOGY Based on results obtained under this investigation, an economic analysis comparing iron chloride addition to the digester for hydrogen sulfide removal with conventional hydrogen sulfide removal from the biogas stream is presented below. This analysis was conducted for a digester system sized to handle 1,000 cows (i.e., similar to the digester at AA Dairy). The target H2S removal chosen for this comparison is 50%. Three technologies were evaluated: Iron Sponge, Granular Activated Carbon, and a Caustic Scrubber. Iron sponge use for hydrogen sulfide removal relies on media, typically steel wool or impregnated wood-chips (such as pine), which forms a reaction bed that selectively interacts with, and removes, hydrogen sulfide. Due to the fact that wood chips have a greater surface area and thus higher binding capacity than steel wool, they are generally preferred for the reaction bed material. The primary active ingredients are hydrated iron oxides (Fe2O3) of alpha and gamma crystalline structures. This process is highly effective, resulting in insoluble iron sulfides that can be rinsed off the media, and then easily filtered out of the aqueous solution. A typical iron sponge system handling a biogas flow rate of 30 SCFM is capable of reducing the hydrogen sulfide concentration to less than 300 ppm and costs typically range between $40,000 and $50,000. The media typically requires replacement every four to six months. Granular activated carbon (GAC) particles have a highly porous adsorptive surface, which is the reason they are utilized in the removal of hydrogen sulfide. The GAC particles are typically impregnated with alkaline or oxide coatings to specifically enhance the efficiency of the removal of hydrogen sulfide. The coatings enhance the physical adsorptive characteristics of the carbon. Sodium hydroxide, sodium carbonate, potassium hydroxide, potassium iodide, and metal oxides are the most common coatings employed in such industrial applications. Activated carbon has a very high surface area (4,400 to 5,300 square inches per ounce), a wide variety of pore sizes, and a slightly charged nature, which attracts both inorganic and organic compounds. Typically, the carbon is loaded into two or more sequential pressure vessels and the biogas is pumped through the packed beds. As the surface area of the carbon becomes saturated with sulfur, the H2S begins to appear in the gaseous effluent, which indicates that one of the vessels needs to be recharged or regenerated. For a 30-SCFM GAC system, equipment costs are approximately $12,000 to $14,000. Replacement GAC, expected to be needed twice per year, is sold in 35-pound bags at $1.50 - $2.00 per pound. A Caustic Scrubber process uses reactions between sodium hydroxide and hydrogen sulfide gas to remove hydrogen sulfide from biogas streams by forming sodium hydrosulfide and water. The general chemical reaction of this process is as follows:
NaOH + H2S → NaSH + H2O Typically, a caustic scrubber system can reduce hydrogen sulfide concentrations from 4,000 ppmv to approximately 500 ppmv. For a 30-SCFM caustic scrubber system,

28
equipment costs are approximately $12,000 to $14,000. Caustic usage for such a unit is expected to range between 600 to 900 gallons per year, at a cost of approximately $4.25 per gallon. Table 6-4. Cost Comparison of Different Hydrogen Sulfide Removal Technologies
Technology Capital Investment Costs
Annual O&M Costs
Total Cost NPV*1
5 Yrs 10 Yrs Iron Chloride Addition
$1,500 - $2,000 $8,000 - $10,000 ($45,815) ($91,012)
Iron Sponge System
$40,000 - $50,000 $1,500 - $2,000 ($52,268) ($61,056)
Carbon Filter System
$12,000 - $14,000 $3,500 - $4,500 ($32,229) ($52,316)
Caustic Scrubber System
$12,000 - $15,000 $2,500 - $3,800 ($28,548) ($44,366)
Table Notes: *1 "Total Cost NPV" denotes the net present value of the capital investment and annual O&M costs for each technology, calculated as an average for the range of values shown. As shown in Table 6-4, iron chloride addition has the lowest capital costs, but also has the highest operational/chemical costs. Based on the five and ten-year Net Present Value (NPV), carbon filter and caustic scrubber systems are less costly than iron chloride addition and iron sponge systems.

29
7.0 SUMMARY AND CONCLUSIONS One of the main difficulties associated with digester biogas use at dairy farms is the presence of relatively high hydrogen sulfide (H2S) concentrations. Hydrogen sulfide present in biogas streams corrodes engine parts in the combustion chamber, exhaust system, and in various bearings within the engine. The primary goal of this project was to assess the affect of dissolved iron addition to dairy farm digesters on H2S concentrations in the biogas stream. A farm in NYS with an operational anaerobic plug-flow digester was selected for this project. Laboratory dosing experiments were completed to determine the relationship between the amount of iron added and the decrease in dissolved sulfide concentrations in the bulk liquid matrix. These experiments were used to design and construct a field chemical-dosing system at the selected farm. The dosing system was operated for approximately two digester hydraulic retention periods. Hydrogen sulfide levels in the liquid and biogas were monitored during the experimental period. Based on results observed from this investigation, the following observations and conclusions are noted: 1. The raw feed manure stream to the Farm digester and the treated effluent stream
from the digester had the following physical and chemical properties prior to commencing this investigation:
Parameter
Raw Feed Manure Stream
Digester Treated Effluent Stream
Average Value
Standard Deviation
Average Value
Standard Deviation
TS 74,137 mg/L 5,211 18,674 mg/L 775 VS 21,128 mg/L 4,816 10,882 mg/L 1,158 COD 70,800 mg/L 7,150 28,985 mg/L 1,905 NH3-N 1,494 mg/L 111 1,272 mg/L 375 NO3-N 1,297 mg/L 291 274 mg/L 112 PO4 2,408 mg/L 212 1,198 mg/L 134 SO4 2,874 mg/L 1,557 4,390 mg/L 443 Sulfides 50 mg/L 2 30 mg/L 1.1 Total Iron 133 mg/L 16.7 5.1 mg/L 2.9
2. Addition of ferric chloride to manure samples in laboratory experiments resulted in significant reduction in H2S and sulfate concentrations in the liquid phase.
3. In the laboratory-scale experiments, a Fe concentration of 150 mg/L in the raw manure bulk liquid resulted in approximately 40% reduction in total sulfide concentration in the liquid matrix.
4. In the on-farm demonstration, an iron chloride concentration of 150 mg/L resulted in a reduction of approximately 40% of the sulfide concentration in the biogas stream.
30
5. Further reduction in sulfide biogas concentration (60% or above) was not readily achievable, likely due to significant sinks/binding of iron ions in the digester bulk liquid matrix. For example, in order to achieve a 70% reduction in the total sulfides concentration in the liquid matrix a Fe concentration of 250 mg/L in the raw manure bulk liquid was required.
6. The low Oxidation-Reduction Potential (ORP) created by the anaerobic environment combined with the presence of high suspended solids in the bulk liquid matrix is suspected to cause the “loss” of available iron ions through chemical precipitation and absorption mechanisms.
7. Lack of mixing and high suspended solids in the bulk liquid matrix appear to be inherent disadvantages for using iron dosing systems to remove biogas H2S content in plug-flow digesters specifically.
8. The use of ferrous chloride as compared with ferric chloride did not seem to change the effectiveness of the iron salts at reducing hydrogen sulfide concentrations in the field (when compared on a similar weight basis).
9. No measurable changes in the CH4 and CO2 content in the biogas stream were observed due to iron addition, suggesting that iron was not a limiting nutrient under the digester operational parameters prevailing during this investigation.
10. Formation and precipitation of iron sulfides did not result in a measurable increase in the total solids concentration in the digester, thus there is minimal potential for digester plugging due to this process.
11. Direct addition of ferric chloride and ferrous chloride to dairy farm digesters is an effective method for reducing the hydrogen sulfide concentration in the biogas produced from the digesters. Further investigation into minimizing the effects of iron sinks/binding in the digester bulk liquid matrix, such as enhanced delivery and digester mixing, offer the potential to further improve performance.

31
8.0 REFERENCES Ehrlich, H.L. 1996. Geomicrobiology. (Second Edition). New York: Marcel Dekker Inc. Gooch, C. and Pronto, J. 2008. Anaerobic Digestion at AA Dairy: Case Study. Dept. of
Biological and Environmental Engineering, Cornell University. Jeris, J.S., and P.L. McCarty. 1965. “The Biochemistry of Methane Fermentation Using
C14 Tracers.” Journal WPCF 37.2: 178-192. Karhadkar, P.P., J. Audic, G.M. Faup, and P. Khanna. Water Research 21.9 (1987):
1061-1066. McFarland, M. J. and W. J. Jewell (1989). Water Research. 23(12): 1571-1577. Parkin, G.F., and W.F. Owen. 1986. “Fundamentals of Anaerobic Digestion of
Wastewater Sludges.” Journal of Environmental Engineering 24.8: 867-920. Speece, R.E.. 1996. Anaerobic Biotechnology for Industrial Wastewater. Archae
Press., pp. 394. Thiele, J.H., et al. 1991. Mixed Cultures in Biotechnology. New York, NY: McGraw-
Hill, Inc. USEPA. 2002. EPA-430-F-02-004. Office of Air and Radiation, Washington, DC. Yoda, M., M. Kitagawa, and Y. Miyaji, 1987. Water Research. 21(12):1547-1556. Zeikus, J.G., R. Kerby, and J.A. Krzycki. 1985. “Single-Carbon Chemistry of
Acetogenic and Methanogenic Bacteria.” Science 227: 1167-1173. Zicari, S. 2003. Removal Of Hydrogen Sulfide From Biogas Using Cow-Manure
Compost. M.S. Thesis, Cornell University.

NYSERDA, a public benefit corporation, offers objective information and analysis, innovative programs, technical expertise and funding to help New Yorkers increase energy efficiency, save money, use renewable energy, and reduce their reliance on fossil fuels. NYSERDA professionals work to protect our environment and create clean-energy jobs. NYSERDA has been developing partnerships to advance innovative energy solutions in New York since 1975.
To learn more about NYSERDA programs and funding opportunities visit nyserda.ny.gov
NewYorkStateEnergyResearchand
DevelopmentAuthority
17 Columbia CircleAlbany, New York 12203-6399
tollfree:1 (866) NYSERDAlocal: (518) 862-1090fax: (518) 862-1091

Assessment of Biochemical Process Controls for Reduction of Hydrogen Sulfide Concentrations in Biogas from Farm Digesters
Final Report February 2012
NewYorkStateEnergyResearchandDevelopmentAuthority
Francis J. Murray, Jr., President and CEO
StateofNewYork
Andrew M. Cuomo, Governor