assessing the educational gaps in...
TRANSCRIPT
ASSESSING THE EDUCATIONAL GAPS IN AERONAUTICS
AND AIR TRANSPORT
Project start Date: 01 November 2011 – Project Duration: 18 months
Contract Number: 284899
Coordination and support action
(AAT.2011.7-22)
DELIVERABLE WP7:
JOB AVAILABILITY AND ANALYSIS OF LABOUR ATTRACTIVENESS OF THE AIR TRANSPORT
AND AERONAUTICS SECTORS
Partner Responsible: IST
Date: April 2013

This page is intentionally blank

Document Id: EDUCAIR_WP7_D11
Document Title: Deliverable 7.11: Job availability and analysis of labour attractiveness of the Air Transport and Aeronautics Sector
Version of the Document:
Final
Dissemination Level: Public
Work Package Allocation:
WP7
Due date of delivery: 05-04-2013 Actual Date of Submission: 10-04-2013
Authors:
Vasco Reis, Rosário Macário, Joana Ribeiro (IST)
Franziska Kupfer, Els Struyf, Hilde Meersman, Christa Sys, Eddy Van de Voorde, Thierry Vanelslander (UA)
Stefaan Ghys (TUDelft)
Document History
# Date Version
1 31-12-2012 Draft 1
2 10-04-2013 Final 1

Doc. Id: EDUCAIR_WP7_D7_V3
Doc. Title: Deliverable 7.11 Doc. Version: Final
Contract:284899
Date: April 2013 Page: 4of 87
This page is intentionally blank

Contract:284899
Authors: Reis, Macário, Ribeiro
Partner Responsible: IST
Dissemination Level: Public
Page: 5 of 87 Date: April 2013
Executive Summary
The recent dynamics and evolutions in the European Union’s (EU) Air Transport and
Aeronautics (AT&A) sectors have indisputably led to changes in the demand of professional
competences. Naturally, the very nature of the competences has evolved in parallel with the
progressive modification in economies, societies and, ultimately, in the air transport systems.
Prospective employees – that is: the students – have thus to be flexible enough to permanently
be able to develop new competences upon the existing ones. This may even be more relevant
than mastering the new breed of competences that will most likely become obsolete in the near
future. Recalling that prospective employees are nowadays the students, then universities and
other education institutions have likewise to adapt their courses and the curricula. EU’s AT&A
sectors face then real risk of mismatch between the prospective employees’ competences and
the market’s actual requirements. And if such mismatch is not addressed, there is the danger of
creating a significant competence gap that will inevitably affect the competitiveness and
efficiency of the European AT&A sectors.
EDUCAIR project aims to improve the match between needs in human resources, and the
educational and training offer of engineers and researchers within the Europe Union for the
horizon of 2020 in the domains of Air Transport and Aeronautics. EDUCAIR project’s rationale is
built on the concept of competence gap. Decomposing the concept accordingly with the
fundamental agents – that are: Companies, Employees, Universities and Student – we can
identify the four fundamental competence gaps (see next figure), as follows:
Figure 1 - The four gaps framework
Companies Universities (research)
Employees Students
Air Transport Sector
Educational Sector
Expectation (knowledge)
Actual (competences)
Gap 2
Gap 4
Gap 3
Gap 1
Source: EDUCAIR (2012)

Doc. Id: EDUCAIR_WP7_D7_V3
Doc. Title: Deliverable 7.11 Doc. Version: Final
Contract:284899
Date: April 2013 Page: 6of 87
A potential gap was identified between every pair of agents, leading to the identification of 4
potential gaps (Figure 1), being:
Gap 1 - Competence Gap - Gap between the competences that the employees need and the actual competences of the students (i.e. to what extend are the student's competences actually useful in their working daily activities?);
Gap 2 - Gap between the knowledge that the companies need and the actual competences of the employees (i.e. to what extend do the employees' competences actually fit in their companies' competences requirements?)
Gap 3 - Gap between the knowledge the universities generate and the actual competences of the students (i.e. is the knowledge generated in the research transferred in the courses?)
Gap 4 - Gap between the knowledge the companies need and the knowledge the universities have (i.e. is the universities' research and teaching activities of relevance for the companies?)
The present Delivery presents the works developed in WP7 aimed to i) to determine the likely
number of jobs in air transport and aeronautics in European Union, and ii) to assess the
attractiveness and repulsion factors of the air transport and aeronautics jobs. The attractiveness
level of the AT&A industries depends on the nature of each competence gap, mainly, Gap 1 and
Gap 4.
The current WP7 was developed in parallel with three other WP, being: WP4, WP5 and WP6.
Each of these WPs contributes to the assessment of one or two competence gaps as follows, as
follows: Gap 1 (WP4), Gap 2(WP6), Gap 3(WP4, WP5) and Gap 4 (WP5).
A set of five surveys was launched aimed to gather the necessary information to assess the
attractiveness levels and of the competence gaps. One survey was tailored for every agent, in a
total of four – Companies, Employees, Universities and Students – and Graduates of universities
and colleges with engineering programs involving air transport/ aeronautics who are not
working in the AT&A sector. The first four surveys are fully described and the results presented
in the Deliverables of WP4, WP5 and WP6; whereas the last one is presented in this Deliverable.
This WP has made use of three surveys targeting Employees, Students and Graduates. The
surveys have produced a considerable amount of information, despite the total number of
respondents being bellow initial expectations, as follow and respectively:153, 409and 16
The results evidence a similitude between employees and students’ perceptions, as both have
reported similar repulsion factors that could be grouped in four categories, as follows:
1. cumbersome regulatory and legal framework - employees reported difficulties to obtain
the necessary legal certificates to work in some AT&A jobs;

Contract:284899
Authors: Reis, Macário, Ribeiro
Partner Responsible: IST
Dissemination Level: Public
Page: 7 of 87 Date: April 2013
2. above-average difficulty and lengthy of the programme – students reported programmes
as excessively difficulty (in terms of the amount of contents per available lecturing and
studying time) and lengthy;
3. excessive theoretical contexts with unperceived connection with real practice – both
employees and students reported an excessive emphasis on theory (and theoretical
contents) without an equivalent concerns for linking it to the practice.
4. reduced amount of practical working hours – both employees and students reported an
insufficient amount of hands-on lectures (including practicing in working environment)
or contact with industries.
These repulsion factors are likely to have a geographical and time prevalence. In what concerns
the former factor, respondents are from multiple EU member states, evidencing the
geographical-wide nature of the repulsion factors. In what concerns the latter factor, we must
take into consideration that respondents included employees that work for some years now.
Looking now into the attraction factors, we could again identify an overlap between employees
and students’ perceptions. Although varying the description among respondents, three key
attraction factors emerged from the analysis of the results, as follows:
1. Fascination of AT&A sectors – the main attractiveness factor, for the respondents, was the
fascination towards aviation, aeronautics and aerospace. Not only it was the main driver
for choosing this educational path; as well as, it brings respect and admiration in the
other people;
2. Challenging carrier and development path – the second attractiveness element was the
ever-changing, ever-evolving nature of AT&S jobs; along with good plans for carrier
development.
3. Employment and working benefits - final attractiveness factor is related with the high
levels of employability and above-average working benefits offered by AT&A industries.
Again, a coincidence of perspectives between employees and students is visible, which leads to
similar conclusions as the ones previously discussed.
There is a perception in the EU about a steady decline in the level of attractiveness of AT&A
industry over the last years. Several factors and trends were already identified as lying at the
root of this problem, including:
P1. Progressive loss of interest in scientific or technical carriers
P2. Progressive loss of prestige of the Air Transport and Aeronautic Sectors
P3. Progressive reduction of students’ interest for mathematics, physics and other sciences
P4. Technical carrier is inferior to management carrier

Doc. Id: EDUCAIR_WP7_D7_V3
Doc. Title: Deliverable 7.11 Doc. Version: Final
Contract:284899
Date: April 2013 Page: 8of 87
P5. Job in AT&A still has a strong “male” image
P6. Educational paradigm has changed favouring the teaching of soft-skills in detriment of
hard-skills
P7. Reduction of systems engineering-related courses
Every and each trend is believed to contribute, to some extent, to the decay of the attractiveness
level although the actual contribution (if any) is still to be demonstrated.
Although EUCAIR’s surveys cannot provide evidence to support the existence of these trends,
they can be used to infer about their relevancy and validity. From the surveys we can infer the
following conclusions for each trend:
P1. Both employees and students referred that the technological nature of aviation and
aeronautics was a relevant factor in their decision making process (Attractiveness factor
1 and 2);
P2. Attractiveness factor 1 provides strong evidence towards the validity of this factor;
P3. It is indirectly supported by the surveys in the sense that some students referred that a
reason to choose AT&A education was the emphasis in mathematics and analytical
reasoning
P4. It is not supported by the surveys, as any employee mentioned a feeling of inferior by
having a more technical job.
P5. Only one respondent (out of several tens) pointed out that the reduced quantity of
female students was as a negative factor; therefore, even if the trend P5 holds true, there
is little evidence that it would have significant impact in the attractiveness level of
AT&A..
P6. Surveys do not provide definitive answer, but many students complain about the too
heavy lectures on mathematics, physics and other analytical disciplines (repulsion factor
E2). This repulsion factor may denote that the teaching of these disciplines has not been
softened.
P7. The surveys cannot conclude anything towards this factor.
In 2010, the direct employment by aviation within the European Union is estimated to be about
1.7 million jobs, while the indirect effect includes 2 million jobs, the induced effect 0.9 million
jobs and the catalytic effect due to tourism 3.2 million jobs (Air Transport Action Group, 2012b).
The evolution of employment numbers was predicted based on previous years evolutions in
relation with different independent variables such as GDP, FTK etc. As basis the share of
engineering jobs in aeronautics was estimated to be between 30% and 35%, at airport operators

Contract:284899
Authors: Reis, Macário, Ribeiro
Partner Responsible: IST
Dissemination Level: Public
Page: 9 of 87 Date: April 2013
between 15% and 25% and in airlines between 5% and 10%. The amount of direct engineering-
related jobs in 2010 was around [103,200; 120,400] in civil Aeronautics, around [20,500;
34,100] in Airports, and around [21,200; 42,400] in Airlines. The number of jobs in AT&A is
calculated to evolve, in 2020, to about [121,000; 141,200] jobs in Aeronautics, around [34,200;
57,000] jobs in Airports, and [26,667; 53,300] in Airlines. The number of jobs for Air Traffic
Control Officers are estimated to grow from between 13,236 and 13,857 in 2010 to between
16,839 and 17,628 in 2020.

Doc. Id: EDUCAIR_WP7_D7_V3
Doc. Title: Deliverable 7.11 Doc. Version: Final
Contract:284899
Date: April 2013 Page: 10of 87
Table of Contents
Executive Summary 5
1 Introduction 14
2 EDUCAIR Project 17
2.1 Objectives 17
2.2 Scope 18
2.2.1 Demand Side 18
2.2.2 Supply Side 19
2.3 Rationale 20
3 Surveys (Rationale) 24
3.1 Introduction 24
3.2 Dissemination Efforts and Description of the Collected Surveys 28
3.3 Detailed Description of the Survey 29
4 Assessment of the number of jobs in AT&A 32
4.1 Existing forecasts 35
4.2 Forecasting trajectory 38
4.3 Data and Method 40
4.4 Estimation results for the airport sector 43
4.5 Estimation results for the airline sector 45
4.6 Estimation results for the aeronautics sector (civil) 47
4.7 Estimation results for the ANSPs 48
5 Assessment of the Attractiveness Levels 51
5.1 Introduction 51
5.1.1 Research on Attractiveness Level 51
5.1.2 Current Situation in Air Transport and Aeronautics Sectors 55
5.2 Results of the Surveys and Interviews 59
5.2.1 Survey to graduates who are not working in AT&A sectors 60
5.2.2 Survey to graduated employees working in the AT&A companies 65
5.2.2.1 Attractiveness factors in AT&A education 65
5.2.2.2 Repulsion factors in AT&A education 67
5.2.2.3 Attractiveness factors of AT&A job 69
5.2.2.4 Repulsion factors of AT&A job 71
5.2.3 Survey to students of universities and colleges with programs in AT&A 72
5.2.3.1 Attractiveness factors in AT&A education 72
5.2.3.2 Repulsion factors in AT&A education 73
5.3 Discussion of Results 75
6 Conclusions 80

Contract:284899
Authors: Reis, Macário, Ribeiro
Partner Responsible: IST
Dissemination Level: Public
Page: 11 of 87 Date: April 2013
7 Bibliography 86
8 Annex I: Education Survey - Graduates who are not working in the Air Transport and Aeronautics sectors 88
9 Annex II: Students Contacts List 89

Doc. Id: EDUCAIR_WP7_D7_V3
Doc. Title: Deliverable 7.11 Doc. Version: Final
Contract:284899
Date: April 2013 Page: 12of 87
Index of Figures
Figure 1 - The four gaps framework ................................................................................................................................. 5
Figure 2 - Potential competence gap ............................................................................................................................. 17
Figure 3 - Demand side of the aviation market which will be studied by the EDUCAIR project ... 18
Figure 4 - The four gaps framework .............................................................................................................................. 21
Figure 5 - Competence Gaps .............................................................................................................................................. 21
Figure 6 – EDUCAIR rationale for assessing the attractiveness level .......................................................... 23
Figure 7 - Overview of different surveys in line with the educational gaps ............................................. 25
Figure 8 – Structure of the surveys and list of questions to assess the competence gaps and the attractiveness levels............................................................................................................................................................... 26
Figure 9 - Jobs supported by aviation in Europe (2010) .................................................................................... 32
Figure 10 - Estimating the relationship between the evolution of jobs in AT&A and the evolution of air transport (Source: own composition) .............................................................................................................. 34
Figure 11 - Employment in the AT&A sector per 1000 passengers on board (selected European countries) .................................................................................................................................................................................... 40
Figure 12 - Estimating the possible evolution of PhD/Engineering jobs in the different AT&A sectors ........................................................................................................................................................................................... 41
Figure 13 - Employment of engineers at airports 2010-2020 (estimations 2010-2020) ................. 45
Figure 14 - Employment of engineers at airports 2010-2020 (estimations 2012-2020) ................. 46
Figure 15 - Employment of engineers in the civil aeronautics sector 2010-2020 (estimations 2012-2020)................................................................................................................................................................................. 48
Figure 16 - Employment of engineers at ANSPs 2010-2020 (estimations 2011-2020) .................... 49
Figure 17 – Applicant’s job choice process ................................................................................................................ 54
Figure 18 – Impact of the problems with the steps of the job choice problem ....................................... 58

Contract:284899
Authors: Reis, Macário, Ribeiro
Partner Responsible: IST
Dissemination Level: Public
Page: 13 of 87 Date: April 2013
Index of Table
Table 1: Overview of levels and types of education concerning AT&A ....................................................... 20
Table 2: Overview of target group of survey............................................................................................................. 24
Table 3 - List of contacted Universities ........................................................................................................................ 29
Table 4 - Jobs supported by aviation (by country, in thousands) .................................................................. 33
Table 5 - Worldwide training needs for pilots, maintenance and controllers up to 2030 ................ 36
Table 6 - Pilot population in 2030 and training needs ....................................................................................... 36
Table 7 - Population of maintenance personnel in 2030 and training needs ......................................... 37
Table 8 - Air Traffic Control Officer population in 2030 and training needs ........................................... 37
Table 9 - Forecasted growth data for the independent variables .................................................................. 43
Table 10 - Employment at airports 2010-2020 (estimations 2010-2020) ............................................... 44
Table 11 - Employment at airlines 2010-2020 (estimations 2012-2020) ................................................ 46
Table 12 - Employment in the civil aeronautics sector 2010-2020 (estimations 2012-2020) ...... 47
Table 13 - Employment at ANSPs 2010-2020 (estimations 2011-2020) ................................................. 49
Table 14 - Part 1: General information about the respondent ........................................................................ 60
Table 15 - Part 2: Educational Background (Q5 – Q10) .................................................................................. 61
Table 16 - Part 3: Attraction and Repulsion Factors in AT&A education (Q11-Q12 & Q19) ....... 62
Table 17 - Part 4: Current Employment Status (Q13 – Q14) ........................................................................ 63
Table 18 - Part 5: Working experience in AT&A sectors (Q15) and Part 6: Attraction and Repulsion Factors in AT&A sectors (Q16-Q19) ....................................................................................................... 64

Doc. Id: EDUCAIR_WP7_D7_V3
Doc. Title: Deliverable 7.11 Doc. Version: Final
Contract:284899
Date: April 2013 Page: 14of 87
1 Introduction
Deliverable 3.3 of WP3 - Setting the assessment framework for education and training, explores
the roots of the eventual divergence between the demand of and the supply of competences and
set the scene for the works undertaken in the current WP7, as well as in WP4 to WP6.
Deliverable 3.3 also identified the core competences in Air Transport and Aeronautics (AT&A).
These competences are the focal points along which the gaps may emerge and that ultimately
may impact the attractiveness of the AT&A. Finally, it proposed a first draft version of the
surveys to collect the required information from the sector. The surveys are the primary source
of information for assessing the attractiveness levels.
In parallel with WP7, other three WPs were developed, being: WP4, WP5 and WP6. Their
purpose was to assess the competences. Each one studied different relevant stakeholders and
perspectives, as follows:
WP4 – Universities (1st and 2nd Level of Bologna) and Graduating Students;
WP5 – Universities and Research Centres (3rd Level of Bologna) and Graduated Students
and Post-Doctoral Researchers
WP6 – Companies and Employees.
Together these three WPs offer a complete view of the competences in AT&A sectors.
Accordingly, each deliverable only reports the findings of the respective WP, therefore it
provides a segmented description of the sectors. In order to obtain the full picture the reader is
required to read the three deliverables.
These three deliveries provided inputs for the development of the current WP – WP7, as follows:
Deliverable 4.8 – students’ competences and perspective on the current educational
supply;
Deliverable 5.9 - researchers’ competences and perspective on the current educational
supply;
Deliverable 6.10 – employees’ competences and perspectives on the current working
conditions.
The present Deliverable reports the works and achievement of EDUCAIR WP7 - Competences
required by Industry and Research Centres in the AT&A. The objectives of WP 7 include: i) to
determine the likely number of jobs in air transport and aeronautics in European Union, and ii)
to assess the level of attractiveness of the air transport and aeronautics industries. By level of

Contract:284899
Authors: Reis, Macário, Ribeiro
Partner Responsible: IST
Dissemination Level: Public
Page: 15 of 87 Date: April 2013
attractiveness we consider the capacity of these industries in attracting enough capable
graduates to fill in their jobs vacancies. What we see are some difficulties of the air transport and
aeronautic courses in attracting high-capable students, as well as, some of them, after
completion of studies, end up working in different areas. This WP will then evaluate the gap
between the number of students graduating from European schools and universities, and the
needs of engineers and scientists in European industry, education and research centres, at
present and in the future, and shed some light on the underlying attraction and repulsion factors
of air transport and aeronautical industries.
WP7 was divided into five tasks, as follows:
Task 7.1: Assessment of the number of jobs in AT&A
- The objective of Task 7.1 is to identify the current and future number of jobs of
the European AT&A sectors by areas activity. Scenario analysis technique will be
deployed to assess the future developments of the jobs. Owing to budgetary
constraints, our analysis will focus on key functional areas. The competence gaps
will be assessed on these key functional activities, in order to avoid the
dispersion and wasting of the limited resources (budget and time).
Task 7.1 was led by UA with contribution from IST, AUEB-RC/TRANSLOG, ULPGC, TUD
and NLR.
Task 7.2: Assessment of the attractiveness factors for the employees
- This task aims to understand the factors that the employees valuate the most
(and the least) in their work in the AT&A. The task will be based on the inquiry
developed in Task 6.3. Direct interviews to some students may be done to
complement the inquiry.
Task 7.2 was led by IST with contribution from UA, AUEB-RC/TRANSLOG, ULPGC, TUD
and NLR.
Task 7.3: Assessment of the attractiveness factors for the students
- This task aims to understand the critical factors that students valuate the most
(and the least) in the choice of a course in general, and a course in AT&A, in
particular. The task will be based on the inquiry developed in Task 4.2 and Task
5.2. Direct interviews to some students may be done to complement the inquiry.
Task 7.3 was led by IST with contribution from UA, AUEB-RC/TRANSLOG, ULPGC, TUD
and NLR.

Doc. Id: EDUCAIR_WP7_D7_V3
Doc. Title: Deliverable 7.11 Doc. Version: Final
Contract:284899
Date: April 2013 Page: 16of 87
Task 7.4: Reasons for loosing graduates
- This task focuses on those students that after studying in AT&A courses end up
working in different areas. This task will identify and conduct an inquiry
(eventually complemented with interviews) to these so-called 'lost' students,
aiming to understand the reasons underlying their abandonment for a carrier in
AT&A and to obtain an approximate number of withdraws.
Task 7.4 was led by IST with contribution from UA, AUEB-RC/TRANSLOG, ULPGC, TUD
and NLR.
Task 7.5: Assessment of the attractiveness
- This task will summarise the findings obtained in the previous tasks, namely:
- the critical factors influencing the students' decision in pursuing a carrier in
AT&A,
- the attraction and repulsion factors of AT&A industry.
Task 7.5 was led by IST with contribution from UA, AUEB-RC/TRANSLOG, ULPGC, TUD
and NLR.
This report is structured in six sections, each one dedicated to a specific topic and task of
EDUCAIR in general and WP7 in particular, as follows:
Section 1, the present one, introduces the reader to the contents of the report and
provides a description about the WP7 including: objectives, scope, tasks and rationale.
Section 2 provides an overview about the objectives, scope and rationale of EDUCAIR
project, frames WP7 within EDUCAIR project (that is, clarifies the relationships with the
remaining WPs);
Section 3 describes the structure of the surveys conducted in EDUCAIR, in general, and
in WP, in particular, and presents the results.
Section 4 presents the expected evolution of the number of jobs in AT&A.
Section 5 assesses the attractiveness levels of the AT&A industries to attract and retain
graduates and researchers.
Section 6, the final section, concludes the report.
Contract:284899
Authors: Reis, Macário, Ribeiro
Partner Responsible: IST
Dissemination Level: Public
Page: 17 of 87 Date: April 2013
2 EDUCAIR Project
2.1 Objectives
The recent dynamics and evolutions have indisputably brought changes in the demand of
professional competences for working in air transport- and aeronautics-related professions.
Arguably, the very nature of the professional competences has evolved in parallel with the
progressive modification in economies, societies and, ultimately, in the air transport systems. As
such, we are led to conclude that prospective employees have to master the current (and ideally
future) competences if they aspire becoming competent professionals. Since prospective
employees are firstly students, then this entails that universities and other education
institutions have to permanently update the courses and the curricula.
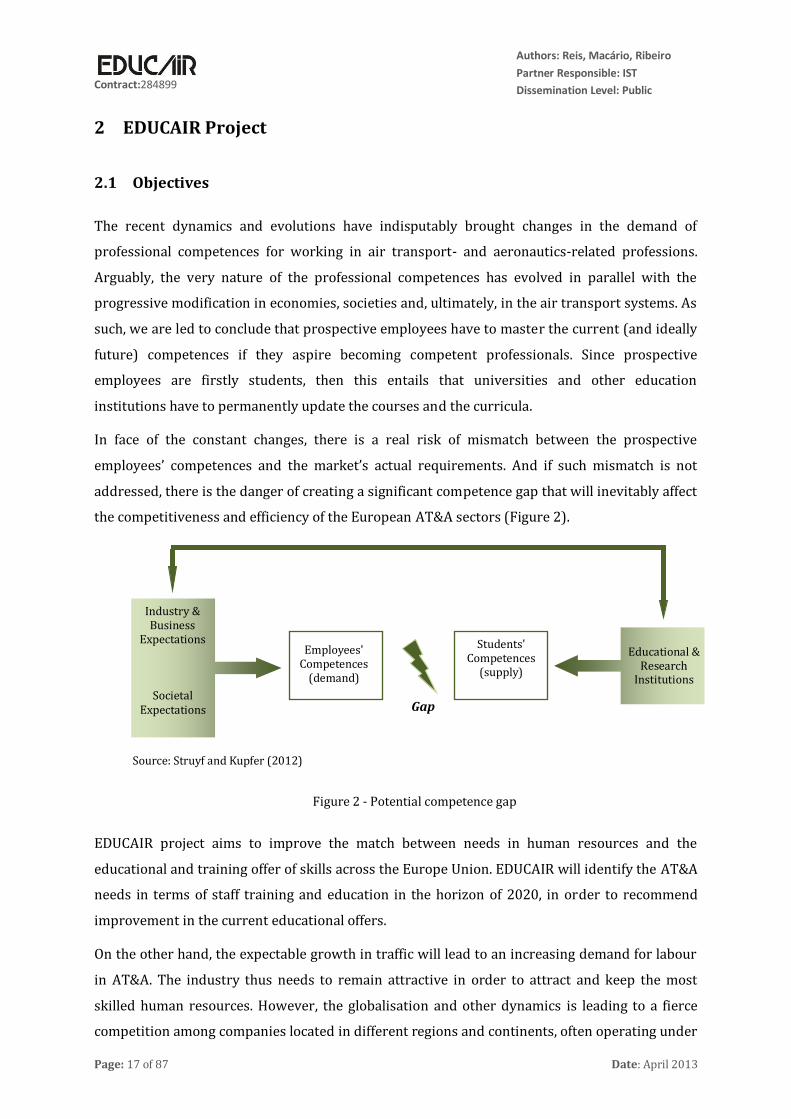
In face of the constant changes, there is a real risk of mismatch between the prospective
employees’ competences and the market’s actual requirements. And if such mismatch is not
addressed, there is the danger of creating a significant competence gap that will inevitably affect
the competitiveness and efficiency of the European AT&A sectors (Figure 2).
EDUCAIR project aims to improve the match between needs in human resources and the
educational and training offer of skills across the Europe Union. EDUCAIR will identify the AT&A
needs in terms of staff training and education in the horizon of 2020, in order to recommend
improvement in the current educational offers.
On the other hand, the expectable growth in traffic will lead to an increasing demand for labour
in AT&A. The industry thus needs to remain attractive in order to attract and keep the most
skilled human resources. However, the globalisation and other dynamics is leading to a fierce
competition among companies located in different regions and continents, often operating under
Societal Expectations
Employees' Competences
(demand)
Industry & Business
Expectations Students' Competences
(supply)
Educational & Research
Institutions
Gap
Figure 2 - Potential competence gap
Source: Struyf and Kupfer (2012)

Doc. Id: EDUCAIR_WP7_D7_V3
Doc. Title: Deliverable 7.11 Doc. Version: Final
Contract:284899
Date: April 2013 Page: 18of 87
different labour and educational regimes. This is leading the industry to a great pressure for
reducing costs, which necessarily reflects in the wages and other working benefits. There is thus
the real danger of either graduated students (and researchers) or employees start looking to
other industries for better working conditions. If this happens, it may threaten the longstanding
competitive hedge of the European Union AT&A industry. Assessing the current attractiveness of
the industry is consequently important so that, if necessary, corrective measures could be
implemented.
2.2 Scope
2.2.1 Demand Side
The demand side refers to the labour market that recruits the graduated students in AT&A.
Owing to time and budget restrictions, EDUCAIR’s scope was limited to the key sectors of the
marker. These sectors correspond to the large majority of the demand basic demand and the
derived demand for educated staff. Foremost, EDUCAIR will only focus on the civil aviation
labour market and restrict the geographical coverage to EU27.
EDUCAIR’s demand side scope is illustrated in Figure 3. EDUCAIR focuses on four sectors, being:
manufacturers and suppliers of air vehicles, airports, airlines and companies that deal with air
transport management. It is also important to add that air vehicles comprise aircraft as well as
helicopters, but the latter goes beyond the scope of the project.
Source: Struyf and Kupfer (2012)
Figure 3 - Demand side of the aviation market which will be studied by the EDUCAIR project
At the lowest level, there is the air vehicle. Design and construction of the air vehicle on the one
hand and the maintenance of the air vehicle on the other hand can be distinguished. A large
fraction of airline costs and activities are related to Maintenance, Repair and Overhaul (MRO).
Contract:284899
Authors: Reis, Macário, Ribeiro
Partner Responsible: IST
Dissemination Level: Public
Page: 19 of 87 Date: April 2013
Some airlines do MRO themselves, other use MRO suppliers or rely on the OEM (Original
Equipment Manufacturers). Often, there is a combination of all three.
However, as the aeronautics and air transport sector is more than only the aircraft, we have to
broaden the view and, in first instance, also look at the necessary infrastructure and
infrastructure management, as well as infostructure, that is needed by the sector, such as airport
landside and airside infrastructure management and air traffic control navigation and
communication air infrastructure. General air transport management cannot be ignored in this
analysis. Air transport management influences the aviation environment, the aircraft specific
domains and the infrastructure and makes sure that the different domains and layers work well
together.
The third layer comprises the air transport environment. This environment contains aircraft
operations and training, the airport operations, air traffic management and the air transport
companies (airlines). It is important to add here, that, next to the air traffic management, there is
also the management of the aircraft design, development, testing, certification, production and
new versions along the entire life cycle. Managing an aircraft development and production
programme is far more complex than managing an airline or airport and should not be omitted
or ignored. For example, is it generally known that developing a new airliner costs around ten
billion euros; the production of a thousand is worth 100-250 billion euros and life-cycle costs
are much higher (Airliner, 2012, several articles). Development takes five to six years,
production may span ten to twenty years in different versions and lifetime can be over 40 years.
The process involves hundreds of suppliers at four or five levels. Therefore, the technical
managers are often senior engineers after some years of experience and aircraft and equipment
producers also employ economists, personnel managers etc.
2.2.2 Supply Side
The supply side refers to the higher-education and long life learning institutions that provide
training in AT&A. In EDUCAIR the universe of European Union institutions was narrowed down
to the universities offering engineering education programmes on the 1st and 2nd level of
Bologna. For the education on the 3rd level of Bologna (i.e. PhD programs) and the post doc
research, also other educational areas are analysed, for example management/business
economics, law, economics/public policy. Table 1 summarizes the various supply entities that
will be covered by the EDUCAIR project.

Doc. Id: EDUCAIR_WP7_D7_V3
Doc. Title: Deliverable 7.11 Doc. Version: Final
Contract:284899
Date: April 2013 Page: 20of 87
2.3 Rationale
To explore the sources and extend of the competence gap, the assessment framework presented
in Figure 4 will be used. The framework is based on two core concepts, being: competence and
knowledge. Competence may be understood as the ability to retrieve the right skill from our
mental warehouse of skills to solve some problem. The more adequate our skill is to solving the
problem, the higher our competence will be. Knowledge, on the other hand, may be understood
as the information, understanding and skills of someone on some domain. A person's
competence depends on the ability to pin-point in her body of knowledge the adequate skill to
do something. Naturally, if there is no knowledge or the skill is not correctly identified, then the
person's competence is affected.
Table 1: Overview of levels and types of education concerning AT&A
Level of education Type of education
Academic:
University
1st and 2nd cycle of Bologna Engineering
3rd cycle of Bologna
Engineering Management/ Business
Economics Law Economics/ Public
Policy
Research (post-doc)
Engineering Management/ Business
Economics Law Economics/ Public
Policy
Source: Struyf and Kupfer (2012)
Looking again to Figure 2 and using this assessment framework, we may identify the four gaps
and better understand the positioning and origin of the Competence Gap (Gap). Figure 5
identifies the four gaps. Using the concepts of competence and knowledge, and analysing from
two perspectives – industry (demand) and educational institutions (supply) – the assessment
framework presented in Figure 4 identifies four gaps, being:
Gap 1 - Competence Gap - Gap between the competences that the employees need and
the actual competences of the students (i.e. to what extend are the student's competences actually useful in their working daily activities?);
Gap 2 - Gap between the knowledge that the companies need and the actual competences of the employees (i.e. to what extend do the employees' competences actually fit in their companies' competences requirements?)

Contract:284899
Authors: Reis, Macário, Ribeiro
Partner Responsible: IST
Dissemination Level: Public
Page: 21 of 87 Date: April 2013
Gap 3 - Gap between the knowledge the universities generate and the actual competences of the students (i.e. is the knowledge generated in the research transferred in the courses?)
Gap 4 - Gap between the knowledge the companies need and the knowledge the universities have (i.e. is the universities' research and teaching activities of relevance for the companies?)
Companies Universities (research)
Employees Students
Air Transport Sector
Educational Sector
Expectation (knowledge)
Actual (competences)
Gap 2
Gap 4
Gap 3
Gap 1
Figure 4 - The four gaps framework
Source: Struyf and Kupfer (2012)
Gap 2 Gap 3
Gap 4
Figure 5 - Competence Gaps
Societal Expectations
Employees' Competences
(demand)
Industry & Business
Expectations Students' Competences
(supply)
Educational & Research
Institutions
Gap 1
Source: Struyf and Kupfer (2012)

Doc. Id: EDUCAIR_WP7_D7_V3
Doc. Title: Deliverable 7.11 Doc. Version: Final
Contract:284899
Date: April 2013 Page: 22of 87
A detailed description on the various competence gaps can be found in Deliverable 3 of EDUCAIR
project (EDUCAIR, 2012).
Figure 6 presents EDUCAIR’s overall methodological approach to assess the attractiveness level
of AT&A sectors. The methodological approach is divided into three stages, being:
1. Conceptual development of the competence gap framework and Identification of the
key competence – already done in WP3;
2. Collection of information (relevant stakeholder’s views and perspective) on the
current state of those competences - done in WP4 , WP5, WP6 and WP7
3. Attractiveness Level Assessment – critical analysis of the perspectives and
expectations of students, employees and graduates which nowadays are working in
other areas – done in WP7.
The first stage corresponded to the identification of the key competences in the various relevant
stakeholders (that is, companies, employees, universities and students) that led to the
conceptual development of the Four Gaps Framework. This part was developed and completed
in WP3 (See Deliverable 3 (EDUCAIR, 2012). The design of the survey included the elaboration
of five questionnaires that were structured to allow assessing the attractiveness levels and the
competences gap (more information about the survey can be found bellow in Section 5 and in
the Deliverables 4 and 5). To complement and validate the surveys a set of interviews, meetings
and other desktop research were conducted. Upon completion of this second stage, the surveys
were disseminated and the interviews and meetings were conducted. Finally, the information
from the surveys and other sources were compiled and compared. The assessment of the
attractiveness level was done through the analysis and cross comparison of collected
information.
The calculation of the evolution of the jobs in AT&A (Task 7.1) followed a different analysis,
based in economic fundamentals, that is described in detail in Section 4.
The present deliverable describes the results of the tasks conducted under WP7 that led to the
calculation of the jobs in AT&A, until 2020, and the assessment of the attractiveness level in
these sectors. The scope of the deliverable (and WP7) corresponds to the green shadow in
Figure 6.

Contract:284899
Authors: Reis, Macário, Ribeiro
Partner Responsible: IST
Dissemination Level: Public
Page: 23 of 87 Date: April 2013
Figure 6 – EDUCAIR rationale for assessing the attractiveness level
Competence Gap Framework
Attractiveness Level
(WP7)
Assessm
ent o
f A
ttractiveness
Desig
n o
f Su
rvey
s C
ollectio
n o
f info
rmatio
n
Assessment of Competences C
on
ceptu
al D
evelo
pm
en
t (W
P3
)
Survey Employees
Survey Students & Researchers
Survey Graduates
not working in AT&A
WP7

Doc. Id: EDUCAIR_WP7_D7_V3
Doc. Title: Deliverable 7.11 Doc. Version: Final
Contract:284899
Date: April 2013 Page: 24of 87
3 Surveys (Rationale)
3.1 Introduction
The surveys (Step 2 of EDUCAIR’s methodological approach, see Figure 6 in Section 2.3)
provided the bulk of the information for the assessment of the competence gaps. The interviews,
meeting and other, although relevant, served mainly for calibration purposes.
The adaptation of the Four Gaps Framework (Figure 4) to the scope of the EDUCAIR project led
to the identification of the relevant stakeholders as the key sources of information for analysis
the various competence gaps – that is, the target of the surveys. Table 2 gives an overview of the
relevant stakeholders (the upper panel shows the scope, while the lower level shows the
stakeholders). Four types of relevant stakeholders were identified, being:
1. companies (human resources),
2. employees,
Table 2: Overview of target group of survey
INDUSTRY (demand side) EDUCATION (supply side)
Airlines Airports Companies involved in air traffic
management (such as air traffic control organisations)
Aircraft manufacturers and suppliers
Universities and colleges with engineering programmes involving air transport/aeronautics
Universities and colleges with research and PhD programmes in air transport/aeronautics
Vocational and Professional training institutes
Relevant Stakeholders:
1. Managers of new employees and people recruiting new employees (human resources)
2. New employees (max. 5 years’ experience)
3. The employees/professionals (with more than 5 years’ experience
Relevant Stakeholders:
1. Heads of departments, professors or lecturers related to air transport/aeronautics
2. Graduating students only 3. Graduated students (pursuing a
doctorate) 4. Graduated students that are not
working in air transport or aeronautics
5. Researchers (post-doctoral fellows)
Source: Struyf and Kupfer (2012)

Contract:284899
Authors: Reis, Macário, Ribeiro
Partner Responsible: IST
Dissemination Level: Confidential
Page: 25 of 87 Date: April 2013
Figure 7 - Overview of different surveys in line with the educational gaps
In the survey to the companies (industry survey - 1), we want to find out which competences the employees need to have in the eyes of the companies and whether the existing employees, incl. “new” and “old” employees have them or not
In the survey to the employees (industry survey 2-3), we want to find out what career paths the employees have and which competences they have or have acquired for the job.
In the survey to the employees (industry survey - 2-3), we want to find out which competences the employees actually had when starting their work and whether the employees were satisfied with them.
In the survey to the students (education survey - 2), we try to find out which competences students think they have that are needed for their career.
In the survey to the companies (industry survey - 1), we want to find out whether the industry is satisfied with the number of courses that are offered (quantitative) as well as their quality concerning the competences that are taught (qualitative)
In the survey to the educational institutions (education survey - 1), we want to find out whether the universities believe that they live up to the expectations of the companies, regarding the courses taught.
In the survey to the educational institutions (education survey - 1) we want to find out which competences the students should acquire through their education.
In the survey to the students (education survey - 2) we want to find out which competences the students actually acquired through their education and whether they are satisfied with them.
Legend:
----= industry survey addressed to managers of new employees and people recruiting new employees
----= industry survey addressed to employees
Legend: ----= education survey addressed to heads of departments or full professors ----= education survey addressed to students
Source: EDCUAIR (2012)

Doc. Id: EDUCAIR_WP7_D7_V3
Doc. Title: Deliverable7.11 Doc. Version: Final
Contract:284899
Date: April 2013 Page: 26of 87
Figure 8 – Structure of the surveys and list of questions to assess the competence gaps and the attractiveness levels
Companies Universities Characterisation of the Company (Q6-Q45) Evaluation of educational offer (Q126-Q225) Cooperation with educational institutes (Q265-Q270) Identification of the relevant competences (Q226-Q264) Relevant criteria when hiring graduates (Q46 – Q70) Characterisation of employees (Q71– Q110) Trainee program /how do they attract best resources (Q111-Q125)
Characterisation of the educational offer and universe of students (Q6-Q11) Employability of the courses (Q12-Q16) Identification of the relevant qualifications in recruitment (Q17-Q20) Identification of the educational competences taught (Q41-Q78) Cooperation with industry (Q79-Q84) Quantitative evaluation of the educational offer (Q30-Q40)
Employees Students & Researchers Attractiveness and repulsion factors of the job (Q53-Q54) Self-evaluation of the relevant qualifications and skills (Q48-Q51) Career planning (Q52) Application process (Q236-Q238) Educational background and employment career (Q11-Q45) Attractiveness and repulsion factors in educational offer (Q46-Q47) Evaluation of educational offer (Q91-Q190) Identification of the relevant competences for the job (Q191-Q229) Lifelong Learning (Q230-Q235) Cooperation between industry and educational institutes (Q239-Q243)
Attractiveness and repulsion factors in the educational offer (Q12-Q13) Self-evaluation of the relevant competences (Q15-Q16) Additional formation (Q20-Q23) Characterisation of the educational background general and in air transport (Q8-Q11 + Q14) Career planning (Q17-Q19) Previous work experience (Q24-Q26) Assessment of the relevant qualifications to get a job (Q27-Q30) Assessment of the relevant competences for employment (Q31-Q68) Cooperation with industry (Q69-Q70)
Gap 4
Gap 2
Gap 1
Gap 3

Contract:284899
Authors: Reis, Macário, Ribeiro
Partner Responsible: IST
Dissemination Level: Public
Page:27 of 87 Date: April 2013
3. universities (professors and lecturers),
4. graduating and graduated students.
A tailored survey was designed and launched for each stakeholder, in a total of four surveys.
Figure 7 shows what was gauged in the survey and how this was linked to the specific relevant
stakeholders. This is aligned with the assessment framework (Figure 4). The link between Table
2 and Figure 7 is shown by use of colours.
A fifth survey was designed and launched in parallel targeting those graduated students in AT&A
but that have either not followed or abandoned a carriers in these sectors. The fact of these
graduated students have decided working outside their educational area, reveals a lack of
attractiveness of AT&A or, alternatively, a higher attractiveness of other working sectors.
Regardless the situation, the AT&industries are losing competitive hedge. Thus, this people are
the primary source of information to assess the (lack of) attractiveness of these sectors. The
results of this fifth survey were only used in the current WP – WP7 – as it did not contribute for
the assessment of the gaps.
For practical matters, each stakeholder received one survey. Looking to Figure 7, we may
conclude that each stakeholder is the focal point for two gaps; therefore, each survey contained
questions from two gaps. Bearing in mind that the competences and the gaps were assessed in
different Work Packages (WP4, WP5, WP6 and WP8)(Figure 6), then the design of the surveys
entailed a strong articulation and coordinating among WPs.
Figure 8 presents the rationale underlying the design of the four surveys. Within bracket, we
present the number of the question. All surveys started and ended, in a similar fashion, with the
basic characterisation of the respondent and a request about their interest in receiving further
news and updates. The relevant surveys to the assessment of the attractiveness level are those
targeting the employees and the students. In turn, the relevant questions within each survey are
highlighted at bold. These surveys are fully described in Deliverables 4.8, 5.9 and 6.10. The fifth
survey – targeting graduated students that do not work in AT&A – is smaller and structured in
five parts. This survey is fully described below in Section 3.3.
Doc. Id: EDUCAIR_WP7_D7_V3
Doc. Title: Deliverable7.11 Doc. Version: Final
Contract:284899
Date: April 2013 Page: 28of 87
3.2 Dissemination Efforts and Description of the Collected Surveys
All the information about the five on-line surveys, including the description of the different
target groups and the hiperlinks to the surveys (in Survey Monkey) are at the project website
(www.educair.eu). This helped the ‘cross-dissemination’ of the surveys through the different
target groups, since the website visitors from one target group may acknowledge the other
surveys and forward them to their acquaintances.
In parallel with the website, a profile in two well-known business-oriented and social-oriented
networking websites Facebook and LinkedIn were created (http://www.facebook.com/Educair;
pt.linkedin.com/pub/educair-project/5b/a71/651/). We also disseminated the surveys in
several groups related to air transport and aeronautics in LinkedIn and Facebook. We also have
sent target messages to EDUCAIR’s first degree connections through Linkedin. EDUCAIR's
LinkedIn profile has reached 380 first degree connections.
We have sent target messages to contacts in specific groups related to the air transport and
aeronautics sectors from our mailing list and all partners did the same. A message to all the
professors, students and alumni of than thirty Universities from EU27 (Table 3) was sent.
In addition, we contacted the PhD students of the worldwide scientific network for aviation
research and policy – AirNeth.
The Air Transport Action Group – ATAG had also disseminated the EDUCAIR’s surveys among its
members as requested by IST while participants of AIRDEV conference have received a message
to be aware of EDUCAIR surveys.
A second effort was made in order to achieve more answers to the surveys. Since we have
received much more responses from Aerospace Engineering students in the first wave of
dissemination, in the second wave we tried to disseminate between other students. Therefore, a
message to all students of Civil, Environmental, Mechanical, Electrical and Computer
Engineering courses of the Engineering Schools listed in Table 3 was sent.
Summarizing, a strong effort was made to disseminate the surveys among different target
groups. We mobilized partners, associations and privileged contacts to help us in this task. We
used the most important and well-known business-oriented and social-oriented networking
websites Facebook and LinkedIn. In addition, several Universities were directly contacted to fill
a short inquiry.
The detailed contact list can be found in ANNEX I.

Contract:284899
Authors: Reis, Macário, Ribeiro
Partner Responsible: IST
Dissemination Level: Public
Page:29 of 87 Date: April 2013
Table 3 - List of contacted Universities
University name Country University name Country
University of Vien Austria Rzeszow University Poland
University of Liège Belgium Instituto Superior Técnico Portugal
University of Limerick Ireland University of Beira Interior Portugal
Politecnico di Milano Italy University of Bucharest Romania
Politecnico di Torino Italy Technical University Košice Slovakia
Universitá di Roma Italy Žilinská University Slovakia
Universitá di Napoli SUN Italy Universidad de León Spain
Universitá di Bologna Italy Universidad de Valencia Spain
University of Bordeaux France Universidad de Sevilla Spain
ENSMA France Universidad de Catalunya Spain
FH Aachen Germany KTH Royal Institute of Technology Sweden
Munchen University Germany University of Bath UK
ILR - Aachen Germany University of Perth UK
TU Braunschwieg Germany University of Manchester UK
Bremen University Germany Queen's University UK
University of Patras Greece University of Sheffield UK
University of Warsaw Poland University of Bristol UK
3.3 Detailed Description of the Survey
The surveys were thought to provide an intuitive and simple experience to the respondents.
Aware that the targets (companies, employees, students, etc.) are constantly approached to
provide information, the surveys were kept short and the amount of information was reduced
the minimum necessary. The following rules guided its structure:
Minimise and simplify the required information – the maximum duration of the surveys
was kept below 20 min;
Tailoring the surveys – as explained in Section 2.2.1, we have identified a set of core
functions within the AT&A sectors, these were our targets. Yet, even so, they exhibit
major differences in terms of needed competences or educational background. Likewise,
we may expect changes the attractiveness level within the sectors. Therefore, the
surveys were tailored to the function of the respondent;
Minimisation of the open questions – this reduces the duration of the survey, focus the
respondent on the purpose and minimise the number of empty questions. In any case,
owing the variety and diversity of reasons (some of them entirely subjective) leading to
abandon a carrier in AT&A, some of the question concerning the attractiveness level
were open questions.

Doc. Id: EDUCAIR_WP7_D7_V3
Doc. Title: Deliverable7.11 Doc. Version: Final
Contract:284899
Date: April 2013 Page: 30of 87
Relaxation of the boundaries – we are aware that the precise answer of many
information would require considerable efforts, whereas, other information is hardly
known or recorded. On the other hand, precise information is not fundamental to
assessing the attractiveness level or the competence gaps; we need to have confidence
about their existence and a clear idea about the their dimension.
As already described in the previous sections, we have developed 5 Surveys in EDUCAIR project,
with the following targets:
1. Students and Researchers in AT&A
2. Employees in AT&A
3. Companies in AT&A
4. Universities in AT&A
5. Gradated Students in AT&A but working in other fields.
The first four surveys are described in detail in other deliverables, namely: D4.8, D5.9 and D6.10.
Herein, we will describe Survey number 5. The actual survey is listed in Annex I (Section 8).
The survey is structured around 6 parts, as follows:
1. General information about the respondent (Q1 – Q4)
Personnel data,
Geographical location,
Language knowledge.
2. Educational Background (Q5 – Q12)
Graduation domain,
Educational level in the domain of AT&T (since it may differ from the graduation
domain),
Professional education in the domain of AT&T,
3. Attraction and Repulsion Factors in AT&A education (Q11-Q12 & Q19)
Influence of the education in carrier choices,
Attraction and repulsion factors in the educational background in AT&T,
Competences needed to find a job in the AT&A sector, but that not acquired
during education,
4. Current Employment Status (Q13 – Q14)
Working domain (necessarily outside AT&A),
Geographical Location,
5. Working experience in AT&A sectors (Q15)
Working function and roles performed in AT&A sectors (if any),

Contract:284899
Authors: Reis, Macário, Ribeiro
Partner Responsible: IST
Dissemination Level: Public
Page:31 of 87 Date: April 2013
Time experience,
6. Attraction and Repulsion Factors in AT&A sectors (Q16-Q19)
Attraction factors for working factors in AT&T,
Repulsion factors for working factors in AT&T,
Conditions needed to return working in AT&A.
7. Other Comments (Q20 – Q22)
Open field for inserting any question
Request authorisation for sending further information or for direct contact.
The survey was uploaded in the platform SurveyMonkey (www.surveymonkey.com) and it is
available at: https://pt.surveymonkey.com/s/surveygraduates.

Doc. Id: EDUCAIR_WP7_D7_V3
Doc. Title: Deliverable7.11 Doc. Version: Final
Contract:284899
Date: April 2013 Page: 32of 87
4 Assessment of the number of jobs in AT&A
The main object of task 7.1 was to assess the number of jobs in Air Transport and Aeronautics
(AT&T) today and in the time horizon of 2020.
In 2010 about 56.6 million jobs were supported worldwide by the AT&A sector (direct, indirect,
induced and catalytic effect)1 of which 8.36 million directly by aviation. Of those jobs directly
supported by the aviation sector, 2.26 million were provided in Asia-Pacific, 1.86 in Europe, 0.46
in Latin America and the Caribbean, 0.43 in the Middle East and 3.09 in North America. (Air
Transport Action Group, 2009)
Focusing on Europe (see Figure 9), it can be seen that about 519,000 (28%) of the total of 1.86
million jobs are created by airlines and handling agents which include flight crew, check-in staff
and maintenance crew. Furthermore, 220,000 people (12%) work directly for airport operators,
while 827,000 (44.5%) work on-site at airports for e.g. government agencies such as customs
and security or provide retail, restaurant or hotel services.
Figure 9 - Jobs supported by aviation in Europe (2010)
Source: Air Transport Action Group, 2012a
1 The direct effect is the employment or value added which is for most part related to the operation of an airport. The indirect effect is defined as employment/value added which is generated in the economy of the region studied, in the chain of suppliers of goods and services. The induced effect is the employment/value added generated in economy of the region studied by the spending of incomes by the direct and indirect employees. Last, the employment/value added generated by the wider role of the airport when improving the productivity of business and attracting new economic activities and in the economy of the region studied, is called catalytic effect. (ACI & York Aviation, 2004, p.5)
1860000
827000
519000
290000 220000
0
200000
400000
600000
800000
1000000
1200000
1400000
1600000
1800000
2000000
Total direct jobs
Jobs on-site at airports (notincluding airport operator)
Jobs at airlines and handlingagents
Jobs in the civil aerospacesector
Jobs at airport operators

Contract:284899
Authors: Reis, Macário, Ribeiro
Partner Responsible: IST
Dissemination Level: Public
Page:33 of 87 Date: April 2013
This group therefore provides the highest share of jobs in AT&A in Europe. In 2010 the civil
aerospace sector such as aircraft, components, airframes and engine manufactures, employed
about 290,000 people (15%). When adding the direct, indirect and induced effects, one can say
that in Europe air transport supports about 5.1 million jobs, which is 22.9% of the worldwide
number of jobs provided by the air transport industry. (Air Transport Action Group, 2012a)
Table 4 - Jobs supported by aviation (by country, in thousands)
Aviation sector
+ Indirect
+ Induced
+ Tourism catalytic
(total)
Austria 32 50 60 75
Belgium 36 71 84 112
Bulgaria 18.2 29.7 38.8 141
Cyprus 9.6 12.2 15.5 63.9
Czech Rep. 14 25 31 43
Denmark 29 39 45 50
Estonia 3.3 5.5 7.1 10.3
Finland 62 86 104 121
France 297 596 780 989
Germany 323 623 816 1146
Greece 53 75 100 300
Hungary 18 29 37 48
Ireland 26 42 54 117
Italy 69 152 195 382
Latvia 4.4 6.5 8.2 18.6
Lithuania 7.9 12.8 16.8 28.3
Luxembourg 8.7 9.8 11.0 14.5
Malta 3.8 4.5 5.5 31.6
Netherlands 87 138 175 287
Poland 20 45 65 84
Portugal 24 44 59 183
Romania 28 41 54 78
Slovakia 13.6 22.1 28.9 32.3
Slovenia 5.6 9.1 11.8 25.6
Spain 120 203 260 872
Sweden 44 67 83 185
UK 326 672 921 1440
EU 27 1700 3700 4600 7800
Source: Air Transport Action Group, 2012b
When looking only at the European Union, the direct employment by aviation is estimated to be
about 1.7 million jobs, while the indirect effect includes 2 million jobs, the induced effect 0.9

Doc. Id: EDUCAIR_WP7_D7_V3
Doc. Title: Deliverable7.11 Doc. Version: Final
Contract:284899
Date: April 2013 Page: 34of 87
million jobs and the catalytic effect due to tourism 3.2 million jobs (Air Transport Action Group,
2012b). Table 4 shows the jobs supported by aviation in the different European countries. It is
clear that countries such as France, Germany and the UK provide the most jobs in aviation in
Europe. Together, those three countries provided about 55.6% of the jobs supported by aviation
in the European Union in 2010.
One part of this task was to estimate the relationship between the evolution of jobs in AT&A and
the evolution of air transport. Here, two different approaches could be followed (see Figure 10).
First, data about past and present employment in AT&A could be related to the past and present
traffic of air transport and the production of new aircraft. Traffic related data can include
information on aircraft movements, passenger and/or cargo traffic. This information can be
collected from organizations such as Eurostat, Eurocontrol etc.. The data on the production of
new aircraft should come from the original equipment manufacturers such as Boeing and Airbus.
Figure 10 - Estimating the relationship between the evolution of jobs in AT&A and the evolution of air transport (Source: own composition)
A second possibility to calculate the relationship is to compare the evolution of jobs in AT&A and
the evolution of the added value2 of the sector. For the second part, the information might be
available at Eurostat and national accounts of the European countries. As the second approach
can be more clearly limited to Europe (the evolution of jobs in Europe and the added value of the
sector in Europe), it is the more favoured approach. This is because the data for the added value
of AT&A might be found on European level, while data on the production of aircraft by the main
original equipment manufacturers such as Boeing and Airbus might also relate to the
employment needed in all of their production facilities and not only their European ones.
However, which approach to follow with the estimation of the relationship mainly depends on
the availability of data. Based on expert analysis to be able to compute the relationships between
2 The value added of an enterprise corresponds to the value that the enterprise adds to its inputs during the year, via the production process. A company’s value added gives an indication of its contribution to the income (GDP) of the country or region etc. (Kupfer, Lagneaux, 2009, p.17)
Evolution
of jobs in air transport
and aeronautics
Evolution of air transport
1. Defined by the evolution in traffic
and the construction of aircraft
OR
2. Defined by the evolution of added
value of the AT&A sector in
Europe

Contract:284899
Authors: Reis, Macário, Ribeiro
Partner Responsible: IST
Dissemination Level: Public
Page:35 of 87 Date: April 2013
the evolution of jobs in air transport and aeronautics and the evolution in air transport, historic
data of at least 10 years is needed.
After a thorough search of available data, it was discovered that the data as input for the analysis
is scarce. The problem is especially situated in the availability of time series for a longer time
period. In particular, few data is available on the evolution of jobs in air transport and
aeronautics at European level. Some studies that analyse the number of jobs in particular
countries can be found (see for example CAA, 2004) while others give the number of jobs in
AT&A at a specific point in time (see e.g. Air Transport Action Group, 2005, 2012a,b, booz&co,
2009 and ACI Europe and York Aviation, 2004), but without giving comparable data for a longer
time period.
To estimate the demand for the direct employment3 in the AT&A sector different approaches
were used, not always with reliable results. First, an attempt was made to estimate the
relationship between the development of employment and air transport using data on an
aggregated level, which means for the AT&A sector in general. Here estimations for Germany
and different European countries were made. However, as the results did not turn out to be
reliable, those will further not be discussed in detail. Only the method for those estimations will
be explained and the reasons why they did not reveal any sufficient reliable results.
Furthermore, disaggregate estimations for the demand for employment at airports, airlines, at
ANSPs and the AT&A sector were carried out. As the results from those estimations proved to be
more reliable, they are discussed more in detail.
4.1 Existing forecasts
Not many forecasts can be found concerning the employment demand in the AT&A sector. One
of the few existing studies concerning this topic is the “Global and Regional 20-year Forecasts –
Pilots, Maintenance Personnel and Air Traffic Controllers” by ICAO (2011b). The study analyses
the need for pilots, maintenance personnel and air traffic controllers worldwide and on regional
level in the horizon of 2030.
Table 5 shows the worldwide training needs according to ICAO (2011a). The study reveals a
shortfall of training capacity for 160,000 pilots, 360,000 maintenance personnel, and 40,000 air
traffic controllers worldwide. (ICAO, 2011a)
3 All estimations were made with regard to direct employment.

Doc. Id: EDUCAIR_WP7_D7_V3
Doc. Title: Deliverable7.11 Doc. Version: Final
Contract:284899
Date: April 2013 Page: 36of 87
Table 5 - Worldwide training needs for pilots, maintenance and controllers up to 2030
Personnel category
Population in 2010
Population needed in 2030
Training needs (estimated on an average annual basis)
Training capacity (estimated on an average annual basis)
Shortage (estimated on an average annual basis)
Pilot 463,386 980,799 52,506 44,360 8,146
Maintenance 580,926 1,164,969 70,331 52,260 18,071
Controllers 67,024 139,796 8,718 6,740 1,978
Source: ICAO (2011a)
The estimations of ICAO are based on the development of the civil aircraft fleet (for maintenance
personnel and pilots) and aircraft movements (for ATCOs) and on ratios with regarding to
personnel. For the forecast of pilots and maintenance personnel ratios of personnel per aircraft
were used and for ATCOs ratios of movements handled annually by the controller. (ICAO,
2011b)
Table 6 - Pilot population in 2030 and training needs4
Pilots needed: 2030
Training needs (estimated on an average annual basis)
Training capacity (estimated on an average annual basis)
Shortage/ surplus (estimated on an average annual basis)
Worldwide High scenario
1,214,006 69,338 44,360 -24,978
Most likely scenario
980,799 52,506 44,360 -8146
Low scenario
800,459 39,555 44,360 4,805
Europe High scenario
325,668 20,127 7,955 -12,172
Most likely scenario
262,329 15,552 7,955 -7,597
Low scenario
214,046 12,090 7,955 -4,135
Source: ICAO, 2011b
Concerning the forecasting of the need for pilots, ICAO worked with different scenarios
depending on the pilots per aircraft ratio. For the “high scenario” a high number of pilots needed
4 An annual attrition of 4% is assumed in the forecast.

Contract:284899
Authors: Reis, Macário, Ribeiro
Partner Responsible: IST
Dissemination Level: Public
Page:37 of 87 Date: April 2013
per aircraft were assumed, for the “low scenario” a low number of pilots per aircraft. The
estimation show that in 2030 between 1,214,006 and 800,469 pilots are needed worldwide
which can come down to a training shortage of up to 24,978 pilots. For Europe, an annual
shortage of training capacity for between 4,135 and 12,172 for pilots is expected (ICAO, 2011b).
Concerning maintenance personnel, Europe has high training needs because of their large
existing aircraft fleet which in 2030 will amount to 28% of the total world fleet. Although in
Europe there will be a relatively modest fleet growth and a relatively high training capacity is
present, the shortage for maintenance personnel will amount to 8,352 annually.
Table 7 - Population of maintenance personnel in 2030 and training needs5
Maintenance personnel needed: 2030
Training needs (estimated on an average annual basis)
Training capacity (estimated on an average annual basis)
Shortage/surplus (estimated on an average annual basis)
Worldwide 1,164,969 70,331 52,260 -18,071
Europe 330,522 22,977 14,625 -8,352
Source: ICAO, 2011b
Last, the need for Air Traffic Control Officers (ATCO) was estimated by ICAO. As mentioned, the
forecast was made using the development of aircraft movements as well as using a ratio of 370
movements/ATCO for the final estimation. The estimations show that, in 2030, there will be a
worldwide need for ATCOs of 139,796 in 2030 and of 32,616 in Europe. Therefore, the annual
shortage of ATCO training capacity is estimated at 1,978 worldwide and 315 in Europe. (ICAO,
2011b)
Table 8 - Air Traffic Control Officer population in 2030 and training needs6
ATCOs: 2030 Training needs (estimated on an average annual basis)
Training capacity (estimated on an average annual basis)
Shortage/surplus (estimated on an average annual basis)
Worldwide 139,796 8,718 6,740 -1,978
Europe 32,616 1,755 1,440 -315
Source: ICAO, 2011b
5 An annual attrition of 5% is assumed in the forecast. 6 An annual attrition of 5% is assumed in the forecast.

Doc. Id: EDUCAIR_WP7_D7_V3
Doc. Title: Deliverable7.11 Doc. Version: Final
Contract:284899
Date: April 2013 Page: 38of 87
4.2 Forecasting trajectory
The relationship between the employment in the AT&A sector and air transport was first
calculated on an aggregated level. As mentioned before, the biggest challenge was the
availability of data, especially for the employment in the AT&A sector for a longer time period.
As most reliable data could be found for Germany, it was decided to first look at the employment
in AT&A and the evolution in air transport for this country in order to get an idea about the
general relationship. This choice is also supported by the fact that 19% of the direct employment
in the air transport sector in 2010 was generated by Germany (Air Transport Action Group,
2012b). Specifically information for 2001 to 2006 could be found on employment at German
airports (booz&co, 2009), at airlines in Germany (booz&co, 2009), at German Air Navigation
service providers (ANSP, booz&co, 2009), in maintenance organisations (booz&co, 2009) and
the employment in the German Aerospace sector (Bundesverband der Deutschen Luft- und
Raumfahrtindustrie e.V., 2012). As independent variables, the registered carrier departures
(World Bank), the passenger on board and carried (Eurostat) as well as the Airbus turnover for
the years 2001 to 2006 (Airbus) were available.
However, the independent variables turned out to be correlated in such a way that they could
not be used together in the estimation. Therefore, it was decided to work with the passengers
carried.
At first sight, the estimation results seem relevant with the coefficient for the constant and the
passengers carried turning out to be significant at 1% and 5% respectively. However, the actual
and fitted values showed that the fit of the estimation is less than optimal. In 2001 and 2004 the
model overestimates the actual employment in AT&A while the employment is underestimated
in 2002, 2003, 2005 and 2006.
The difference between the estimation and the actual values could come from the fact that often
the AT&A companies are not flexible enough to quickly adapt the employment in the companies.
Labour regulations often ask for some month of notice before an employee can be let go. This is
why the estimation of the employment in AT&A was also made including as independent
variable the passengers that were carried of the year before. The second ordinary least squares
(OLS) regression also suggests significant coefficients.
Unfortunately for 2001, 2002 and 2003 the values were still over- or underestimated. It seems
that the overall AT&A industry was still hiring people in 2002, while the number of passengers
decreased. Therefore it was decided to discard the estimations. To produce more reliable
estimations, more data and longer data series concerning the employment in the AT&A is
necessary, especially when the estimation outcome is intended for forecasting.

Contract:284899
Authors: Reis, Macário, Ribeiro
Partner Responsible: IST
Dissemination Level: Public
Page:39 of 87 Date: April 2013
As the aim of the task 7.1. is to obtain an idea about the European demand in employment in
AT&A and not only in Germany the estimation on an European level was attempted. This was
done also in view of more reliable results.
Unfortunately not enough data for a longer time period could be found for all European
countries. However, some data could be found for the following countries: Austria, Belgium,
Cyprus, Czech Republic, Denmark, Estonia, Finland, France, Germany, Ireland, Italy, Malta,
Netherlands, Portugal, and the UK. The data include the employment at the airports of the
specific countries (booz&co, 2009), the airlines (booz&co, 2009), the Air Naviation Service
Providers (booz&co, 2009), the registered carrier departures (World Bank), the passengers and
freight on board (Eurostat). The passengers carried and the freight carried which was available
for Germany, was not available for all countries in this analysis.
Similar to the estimations for Germany correlations between the independent variables were
found which is why the estimations were carried out with the passengers on board.
The estimation was first made with common coefficients, which means that the data for the
different countries were pooled. However, the results of the estimation were again not reliable
as there are too many differences between countries. Therefore a country specific panel
estimation was attempted for which, however, too few data (i.e. not enough years) was available
to give reliable results.
Therefore it was decided to work with ratios of employees per thousand passengers on board.
For the different countries all ratios show a decreasing trend between 2003 and 2006 (see
Figure 11). The reason for a change in ratio can be due to for example technological advances
with which the industry relies less on manpower. Secondly a trend can be seen that passengers
are required to do more and more tasks themselves, such as checking in, so the airports and
airlines can cut back on employment. The highest ratios between the passengers on board and
the employment can be seen in Finland and in Germany with ratios around 0.915 in 2006. The
lowest ratios on the other hand are shown for Denmark with a ratio of around 0.2 employees per
1000 passengers on board.

Doc. Id: EDUCAIR_WP7_D7_V3
Doc. Title: Deliverable7.11 Doc. Version: Final
Contract:284899
Date: April 2013 Page: 40of 87
Source: own composition
Figure 11 - Employment in the AT&A sector per 1000 passengers on board (selected European countries)
However, in terms of forecasting, it is not clear which ratio to use as the ratio vary quite
considerably between the different European countries (see Figure 11) and an average ratio can
only be a proxy. Furthermore, it is not clear how this ratio will develop in the future. Due to
those reasons, also this method of estimating the employment need was discarded and the
decision made to focus on disaggregate estimations for the demand for the employment at
airports, airlines, ANSPs and in the civil aeronautics sector separately.
4.3 Data and Method
The relationship between the evolution of jobs in air transport and aeronautics and the
evolution of air transport can be taken as basis for the estimation of the general development of
jobs in the air transport and aeronautics sector (see Figure 12). Furthermore, the future need of
-0.100
0.100
0.300
0.500
0.700
0.900
1.100
1.300
2003 2004 2005 2006
Austria
Belgium
Cyprus
Czech Republic
Germany
Denmark
Estonia
Finland
France
Ireland
Italy
Malta
The Netherland
Portugal
UK

Contract:284899
Authors: Reis, Macário, Ribeiro
Partner Responsible: IST
Dissemination Level: Public
Page:41 of 87 Date: April 2013
engineering jobs can then be calculated using the share of PhD/Engineering jobs in the different
AT&A sectors.
Source: own composition
Figure 12 - Estimating the possible evolution of PhD/Engineering jobs in the different AT&A sectors
To estimate the future employment at airports, airlines, the aeronautics sector and at ANSP’s,
existing data from previous years needs to be collected. However, as mentioned earlier the
public domain does not offer reliable data for employment in the different sectors for a longer
time period (>10 year old). Moreover, it does not suffice to rely on fact that the historic trend in
employment will simply proceed in the future. Also other variables, such as GDP and future air
transport demand, can affect the future employment in the different sectors. Therefore, these
variables were also taken into account when estimating the future employment in the air
transport and aeronautics sector.
For all estimations data of the GDP, freight tonne-kilometre (FTK) and revenue
passengerkilometre (RPK) were used based on expert analysis and consensus in the project
team. Data for the GDP in Euro per capita in Europe could be retrieved from Eurostat (2013). For
the FTK and RPK, in the end, data of IATA was used. Data for FTK and RPK on European level
was not found for a sufficient long time period (data was only available from 2006). However,
when calculating the share of the European FTK and RPK in worldwide traffic, it could be seen
that this stays approximately the same with the available data. This is why the worldwide
numbers could be used as proxy.
Evolution
of jobs in the different
AT&A sectors
Evolution of air
transport variables and
GDP
Present share of
PhD/Engineering jobs
in the AT&A sectors
Scenario’s concerning
the share of
PhD/Engineering jobs
in the AT&A sectors
Possible evolution of
PhD/Engineering jobs
in the different AT&A
sectors in the future
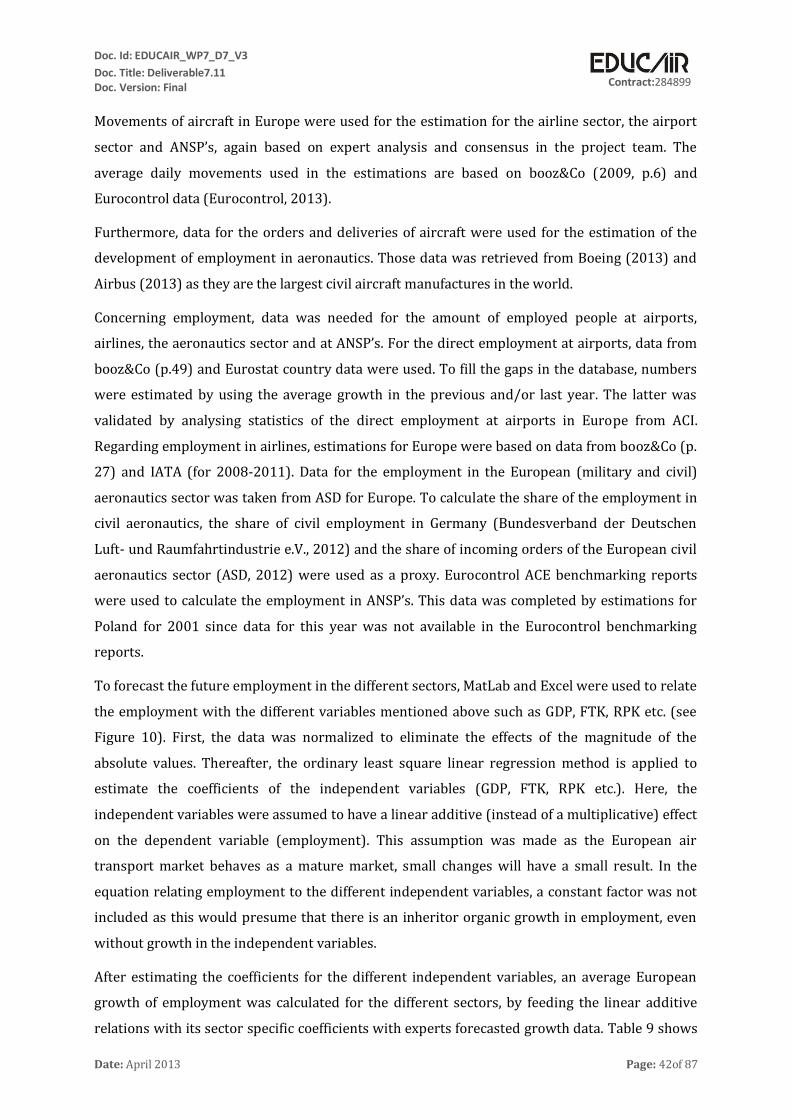
Doc. Id: EDUCAIR_WP7_D7_V3
Doc. Title: Deliverable7.11 Doc. Version: Final
Contract:284899
Date: April 2013 Page: 42of 87
Movements of aircraft in Europe were used for the estimation for the airline sector, the airport
sector and ANSP’s, again based on expert analysis and consensus in the project team. The
average daily movements used in the estimations are based on booz&Co (2009, p.6) and
Eurocontrol data (Eurocontrol, 2013).
Furthermore, data for the orders and deliveries of aircraft were used for the estimation of the
development of employment in aeronautics. Those data was retrieved from Boeing (2013) and
Airbus (2013) as they are the largest civil aircraft manufactures in the world.
Concerning employment, data was needed for the amount of employed people at airports,
airlines, the aeronautics sector and at ANSP’s. For the direct employment at airports, data from
booz&Co (p.49) and Eurostat country data were used. To fill the gaps in the database, numbers
were estimated by using the average growth in the previous and/or last year. The latter was
validated by analysing statistics of the direct employment at airports in Europe from ACI.
Regarding employment in airlines, estimations for Europe were based on data from booz&Co (p.
27) and IATA (for 2008-2011). Data for the employment in the European (military and civil)
aeronautics sector was taken from ASD for Europe. To calculate the share of the employment in
civil aeronautics, the share of civil employment in Germany (Bundesverband der Deutschen
Luft- und Raumfahrtindustrie e.V., 2012) and the share of incoming orders of the European civil
aeronautics sector (ASD, 2012) were used as a proxy. Eurocontrol ACE benchmarking reports
were used to calculate the employment in ANSP’s. This data was completed by estimations for
Poland for 2001 since data for this year was not available in the Eurocontrol benchmarking
reports.
To forecast the future employment in the different sectors, MatLab and Excel were used to relate
the employment with the different variables mentioned above such as GDP, FTK, RPK etc. (see
Figure 10). First, the data was normalized to eliminate the effects of the magnitude of the
absolute values. Thereafter, the ordinary least square linear regression method is applied to
estimate the coefficients of the independent variables (GDP, FTK, RPK etc.). Here, the
independent variables were assumed to have a linear additive (instead of a multiplicative) effect
on the dependent variable (employment). This assumption was made as the European air
transport market behaves as a mature market, small changes will have a small result. In the
equation relating employment to the different independent variables, a constant factor was not
included as this would presume that there is an inheritor organic growth in employment, even
without growth in the independent variables.
After estimating the coefficients for the different independent variables, an average European
growth of employment was calculated for the different sectors, by feeding the linear additive
relations with its sector specific coefficients with experts forecasted growth data. Table 9 shows

Contract:284899
Authors: Reis, Macário, Ribeiro
Partner Responsible: IST
Dissemination Level: Public
Page:43 of 87 Date: April 2013
the forecasted growth data for the independent variables. When more detailed yearly growth
data was available (as for example for GDP) or could be estimated, then the latter was used in
the calculation of the employment.
Table 9 - Forecasted growth data for the independent variables
Independent
variable
Average growth
(until)
Source
Deliveries 1.05% (2020) Airbus, Global Market Forecast 2012-2031
RPK 4.10% (2031) Airbus, Global Market Forecast 2012-2031
FTK 4.80% (2031) Airbus, Global Market Forecast 2012-2031
Movements 3.00% (2019)
EUROCONTROL Seven-Year IFR Flight
Movements and Service units Forecast 2013-
2019
GDP 2.05% (2017) International Monetary Fund, World Economic
Outlook Database, October 2012
Source: own composition
4.4 Estimation results for the airport sector
To estimate the future employment in the airport sector, FTK and RPK growth data were used in
the specific segment linear additive model. During the estimation process, it was seen that other
variables such as GDP and movements proved to be insignificant7 or their coefficient equalled
zero.
To calculate the overall growth in airport employment, the following equation was estimated:
Where: = growth in employment in the airport sector
= yearly growth in freight tonne-kilometres
= yearly growth in passenger tonne-kilometres
With an R² of 0.66 and RPK and FTK significant at a 5% level.
7 A coefficient was assumed to be significant if at least significant at a 10% level.

Doc. Id: EDUCAIR_WP7_D7_V3
Doc. Title: Deliverable7.11 Doc. Version: Final
Contract:284899
Date: April 2013 Page: 44of 87
It can be seen that the explanatory value of the model is relatively low as the R² is quite low. This
can be attributed to the lack of qualitative time-series data, especially for the employment at
airports.
It can be seen that the growth in FTK and RPK have an impact on the employment at airports.
That the growth in FTKs have higher impact than the growth in RPKs can be due to the relatively
lack of long time-series with which the estimation could be carried out.
Table 10 shows the growth of employment in the airport sector until 2020. Also the
development of engineers in the airport sector is shown (see Figure 13). Based on information
from the surveys, a share of 15-25% of engineers in the airport sector can be assumed. The
calculations show that the need for engineers working at airports can be assumed to grow from
between 20,464 and 34,107 in 2010 to between 34,230 and 57050 in 2020, with an average
yearly growth of 5.3%.
Table 10 - Employment at airports 2010-2020 (estimations 2010-2020)
General Engineers 15%
Engineers 25%
2010 136,427 20,464 34,107
2011 140,238 21,036 35,059
2012 147,813 22,172 36,953
2013 155,924 23,389 38,981
2014 163,944 24,592 40,986
2015 172,377 25,857 43,094
2016 182,323 27,348 45,581
2017 192,842 28,926 48,210
2018 203,968 30,595 50,992
2019 215,735 32,360 53,934
2020 228,182 34,227 57,046
Source: own composition

Contract:284899
Authors: Reis, Macário, Ribeiro
Partner Responsible: IST
Dissemination Level: Public
Page:45 of 87 Date: April 2013
Source: own composition
Figure 13 - Employment of engineers at airports 2010-2020 (estimations 2010-2020)
4.5 Estimation results for the airline sector
To estimate the future employment in the airline sector, FTK and movement growth data was
used. During the estimation process it was seen that other variables such as GDP and RPK
proved to be insignificant or their coefficient to be zero.
To calculate the overall growth in employment at airports, the following equation was
estimated:
Where: = growth in employment in the airline sector
= yearly growth in freight tonne-kilometres
= yearly growth in movements
With an R² of 0.69 and FTK and average daily movements significant at a 1% level.
Also here the R² is relatively low, which can be attributed to the lack of reliable time-series data
especially for the airline employment.
It can be seen that the growth in FTK and movements have an impact on the employment at
airlines. The important RPK key performance indicator seems to be highly correlated with
movements and is therefore not significant.
10000
15000
20000
25000
30000
35000
40000
45000
50000
55000
60000
2010 2011 2012 2013 2014 2015 2016 2017 2018 2019 2020
Engineers 15% Engineers 25%

Doc. Id: EDUCAIR_WP7_D7_V3
Doc. Title: Deliverable7.11 Doc. Version: Final
Contract:284899
Date: April 2013 Page: 46of 87
Table 11 shows the growth of employment in the airline sector until 2020. Also the development
of engineers in the airline sector is shown (see Figure 14). Based on information from the
surveys a share of 5-10% of engineers in the airline sector can be assumed.
The calculations show that the need for engineers working at airlines can be assumed to grow
from between 21,229 and 42,458 in 2010 to between 26,670 and 53,330 in 2020, with an
average yearly growth of 2.3 %.
Table 11 - Employment at airlines 2010-2020 (estimations 2012-2020)
General Engineers 5% Engineers 10%
2010 424,582 21,229 42,458
2011 444,377 22,219 44,438
2012 453,479 22,674 45,348
2013 462,767 23,138 46,277
2014 472,245 23,612 47,224
2015 481,917 24,096 48,192
2016 491,787 24,589 49,179
2017 501,860 25,093 50,186
2018 512,139 25,607 51,214
2019 522,628 26,131 52,263
2020 533,333 26,667 53,333
Source: own composition
Source: own composition
Figure 14 - Employment of engineers at airports 2010-2020 (estimations 2012-2020)
10000
15000
20000
25000
30000
35000
40000
45000
50000
55000
60000
2010 2011 2012 2013 2014 2015 2016 2017 2018 2019 2020
Engineers 5% Engineers 10%
Contract:284899
Authors: Reis, Macário, Ribeiro
Partner Responsible: IST
Dissemination Level: Public
Page:47 of 87 Date: April 2013
4.6 Estimation results for the aeronautics sector (civil)
To estimate the future employment in the aeronautics sector, growth data about deliveries, GDP
and passenger tonne-kilometres was used. During the estimation process it was seen that other
variables such as FTK and movements proved to be insignificant or their coefficient to be zero.
To calculate the overall growth in employment in the aeronautics sector, the following equation
was estimated:
Where: = growth in employment in the aeronautics sector
= yearly growth in deliveries
= yearly growth in GDP
With an R² of 0.97 and the growth in deliveries and GDP significant at a 10% level.
In contrast to the other estimations has the estimation for the employment in the civil
aeronautics sector more explanatory value with a high R² of 0.97. This could point to the good
quality of the used data from ASD for the employment in the aeronautics sector.
It can be seen that next to the growth in GDP, the growth in deliveries, but not the orders, has an
impact on the employment in the aeronautical sector. The orders turned out not to be
significant. This can be explained with the fact that orders can apply to aircraft which are
delivered a number of years from now and of which the production does not start right away.
Table 12 - Employment in the civil aeronautics sector 2010-2020 (estimations 2012-2020)
General Engineers 30% Engineers 35%
2010 344,025 103,208 120,409
2011 359,700 107,910 125,895
2012 359,957 107,987 125,985
2013 361,941 108,582 126,679
2014 366,523 109,957 128,283
2015 372,118 111,635 130,241
2016 378,072 113,422 132,325
2017 384,209 115,263 134,473
2018 390,501 117,150 136,675
2019 396,953 119,086 138,933
2020 403,569 121,071 141,249
Source: own composition
Table 12 shows the growth of employment in the aeronautics sector until 2020. Also the
development of engineers in the aeronautics sector is shown. Based on information from ASD, a

Doc. Id: EDUCAIR_WP7_D7_V3
Doc. Title: Deliverable7.11 Doc. Version: Final
Contract:284899
Date: April 2013 Page: 48of 87
share of 30-35% of engineers in the aeronautics sector can be assumed. It can be seen that the
employment of engineers in the civil aeronautics sector growth from between 103,208 and
120,409 in 2010 to between 121,071 and 141,249 in 2020, with an average yearly growth of
1.6%.
Source: own composition
Figure 15 - Employment of engineers in the civil aeronautics sector 2010-2020 (estimations 2012-2020)
4.7 Estimation results for the ANSPs
To estimate the future employment in the ANSP sector, data about the average daily movements
were used. During the estimation process it was seen that other variables such as GDP, FTK and
RPK proved to be insignificant or their coefficients to be zero.
To calculate the overall growth in employment of the ANSPs, the following equation was
estimated:
Where: = growth in employment in the ANSP sector
= yearly growth in movements
With an R² of 0.66 and the growth in movements significant at a 10% level.
It can be seen that the growth of movements has a very high impact on the employment at
ANSPs. This high impact is far from surprising as the work at ANSP’s depend mostly on the
100000
105000
110000
115000
120000
125000
130000
135000
140000
145000
2010 2011 2012 2013 2014 2015 2016 2017 2018 2019 2020
Engineers 30% Engineers 35%

Contract:284899
Authors: Reis, Macário, Ribeiro
Partner Responsible: IST
Dissemination Level: Public
Page:49 of 87 Date: April 2013
movements of aircraft. However, as with the estimations of the employment at airports and
airlines, the R² and therefore explanatory value proved to be quite low.
Table 13 shows the growth in employment in the ANSP sector until 2020. Also the development of Air
Traffic Control Operators (ATCOs) is shown (see Figure 16). Based on information from various
Eurocontrol ACE benchmarking reports a share of 32-33.5% of ATCOs in the ANSP overall
employment can be assumed. It can be seen that the employment of ATCOs at ANSPs grows
from between 13,236 and 13,857 to between 16,839 and 17,628, with an average yearly growth
of 2.4%. This average yearly growth can be considered quite reasonable. This knowing that the
worldwide growth of controllers was forecasted by ICAO between 2010 and 2030 to be 3.7%
and keeping in mind that the European market is a mature market.
Table 13 - Employment at ANSPs 2010-2020 (estimations 2011-2020)
General ATCOs 32% ATCOs 33.5%
2010 41,363 13,236 13,857
2011 42,500 13,600 14,238
2012 41,064 13,141 13,756
2013 42,357 13,554 14,190
2014 43,690 13,981 14,636
2015 45,066 14,421 15,097
2016 46,485 14,875 15,572
2017 47,948 15,343 16,063
2018 49,458 15,826 16,568
2019 51,015 16,325 17,090
2020 52,621 16,839 17,628
Source: own composition
Source: own composition
Figure 16 - Employment of engineers at ANSPs 2010-2020 (estimations 2011-2020)
12000
13000
14000
15000
16000
17000
18000
2010 2011 2012 2013 2014 2015 2016 2017 2018 2019 2020
ATCOs 32% ATCOs 33.5%

Doc. Id: EDUCAIR_WP7_D7_V3
Doc. Title: Deliverable7.11 Doc. Version: Final
Contract:284899
Date: April 2013 Page: 50of 87
Comparing the estimates with the regional forecast of ICAO concerning the need for ATCOs it can
be seen that ICAO forecasts a higher need for ATCOs in Europe. (ICAO, 2011b) In 2030 they
estimate a need of 32,616 ATCOs in Europe. The reasons why this forecast deviates from our
estimates are threefold. First, another geographical scale was used. Our estimation looked at
ATCOs in the EU while ICAO looked at the European level, and therefore the base of the
estimation differs. Second, another methodology was used in the estimation. While the forecast
of ICAO is based on a ratio of 370 movements/ATCO for the final estimation next to the
development of aircraft movements, our methodology is based on historical data. Based on those
data, the relationship between the development in the number of employees at ANSPs and the
development of aircraft movements were determined and projected into the future. Third, the
time horizon of the ICAO study was set on 2030 while our study focusses on estimations to 2020.
Furthermore, it should be mentioned that the forecast is based on present trends, not
incorporating disruptions or increase in efficiency due to for example SESAR.

Contract:284899
Authors: Reis, Macário, Ribeiro
Partner Responsible: IST
Dissemination Level: Public
Page:51 of 87 Date: April 2013
5 Assessment of the Attractiveness Levels
5.1 Introduction
5.1.1 Research on Attractiveness Level
The research topic on the underlying factors driving a person to choose a particular job position
has received a great deal of attention over the past decades. Consequently, it is not surprising
the amount of available literature (e.g.: books, papers, reports, etc. – Chapman et al., 20058). We
may essentially divide the available literature in two major groups, accordingly with its main
purpose, as follows: i) to improve the accuracy of the recruitment process and ii) to improve the
retaining rate of the best employees. The first group is the most aligned with the purpose of the
current WP – WP 7 – and overall with EDUCAIR project.
Derek Chapman and his colleagues (2005) undertook a major review on the available literature
concerning applicants’ attraction to organisation and job choice factors. They clustered the
available literature into five broad groups, accordingly with the nature of the variables – or
predictors – used to explain an applicant’s attraction, as follows:
Job and Organisational Characteristics – this cluster is grounded in the objective
factor theory (Behling et al., 1968). They claim that the applicant bases his/her decision
upon a set of objective variables that characterise both the job and the company.
o Variable concerning the job properties, include:
salary and other benefits,
security
roles and functions
working hours (flexibility)
o Variable concerning the company, include:
path carrier development
opportunities for learning
working environment,
location
familiarity (having freight or relatives already working in there).
company’s image and reputation
company’s size
8 Chapman, D., Uggerslev, K., Carrol, S., Piasentin, K., Jones, D. (2005) Applicant Attraction to Organizations and Job Choice: A Meta-Analytic Review of the Correlates of Recruiting Outcomes, Journal of Applied Psychology, 2005, Vol. 90, No. 5, 928–944

Doc. Id: EDUCAIR_WP7_D7_V3
Doc. Title: Deliverable7.11 Doc. Version: Final
Contract:284899
Date: April 2013 Page: 52of 87
Recruiter Characteristics and Recruitment Process – this subset of literature
suggests that applicants often face the problem of lacking information about the job
attributes, which prevents them of comparing the available offers and necessarily take a
good decision. Instead, they build their perception about the job attributes, and
consequently choose an offer, during the recruitment process and upon contact with the
recruiter. This subset is based on the critical contact theory (Behling et al., 1968).
Variables concerning this predictor include:
o Friendliness and competence of the recruiter
o Trustworthiness of the process
o Procedural justice
o Treatment and Consistency
Perceived fit - this cluster defends that the applicant will choose the offer that better fits
with his/her own needs and values – i.e. subjective factors and appraisal. The
fundamental belief is that a person selects the environment that fulfils – i.e. fits – his/her
needs. Translating this assumption into the workplace domain, we have that an applicant
chooses the company whose characteristics are better aligned with his/her personal
characteristics. The applicant starts by assessing the characteristics of the job, the
organisation and, even, the recruitment process. Follows, a process of interaction
between these characteristics and his/her own objectives, expectations, ambitions, etc.
This process of interaction will identify the adjustment and the friction points resulting
in a perceived fit. The job offer yields higher fitness would be chosen (Kristof, 1996).
Variables concerning this predictor include:
o Person – Company fit
o Person – job fit
o Person – recruiter fit
Perceived alternatives – in face of multiple employment opportunities, applicants may
disperse their energy over multiple channels, leading to a reduction of the focus and
attention on each individual offer. This implicitly has a negative impact on the
attractiveness of each specific offer (Bauer et al., 1998).
Hiring expectancies – grounded in the expectancy theory (Vroom, 1966) this cluster
suggests that there is a positive correlation between the applicants’ expectancy and the
respective attraction for applicants. The applicants’ expectancy can be measured in
several ways. The most common is the likelihood of being offered a position in the
company.
Although the actual influence of each abovementioned variable varies among applicants and jobs
offers, they offer an interesting starting point for pinpointing the attractiveness variables and

Contract:284899
Authors: Reis, Macário, Ribeiro
Partner Responsible: IST
Dissemination Level: Public
Page:53 of 87 Date: April 2013
the reason leading graduates not following a carriers in AT&A. In any case, we may identify
those that typically play a stronger role in the job choice process. Undoubtedly both the
predictors characteristics of the job and of the company were influential in the applicant’s
choice. This evidences that the brand image of the company in the market and society is likely to
influence as much as the actual characteristics of the job itself. Indeed, the creation of what
researchers call of organisational attractiveness is seemed crucial to the success of the
recruitment. Organisational attractiveness can be defined as the “applicant’s willingness to
pursue jobs and to accept job offers in an organisation” (Tsai and Yang, 20109). In this sense, the
company’s brand image plays an important role in the level of attractiveness. In turn, the main
pillars of a company’s image are the: product or products, social and environmental
responsibility and credibility. Another key predictor is the perceptions of fit. More and more, it
has been recognised as one of the strongest ones to explain an applicant’s attitudes and
attractiveness behaviour. The perception of fit can be decomposed in several domain,
accordingly with the objects being fit, as such we may identify: person-job fit, person-vocation
fit, person-person fit, person-group fit or person-organisation fit. For many years, companies
have adopted a work oriented analyses that favoured the recruitment of people based on their
knowledge, skills and abilities to performing a given role or task. It was concluded that such
approach led to low levels of fit, along the various dimensions, resulting in lower levels of job
satisfaction and abandonment. A better way to attract better applicant and retain the best
employees is by improving and ensuring a high level of fit with the person (in a first stage as
applicant and later on as employee). Companies must thus look for applicants that, besides
knowledge, skills or abilities, should exhibit personalities, beliefs and values that are aligned
their culture, norms and values. This evidences that to attract the best people to the offer – that
is maximisation of the fit – companies should engage in individual recruitment processes rather
than general or broad recruitment processes.
A key point is the understanding of an applicant’s process of job choice. Notwithstanding the
amount of research, there is yet no consensus about the actual structure of the process. In this
report we adopted an approach based on the concept of decision funnel with three steps and
four different sets of alternatives (Trommsdorff, 200210, Shocker et al., 199111). The following
scheme (Figure 17) translates the conceptual idea of the job choice process.
9 Tsai, W-C., Yang, W-F. (2010) Does Image Matter to Different Job Applicants? The influences of corporate image and applicant individual differences on organizational attractiveness, International Journal of Selection and Assessment, Volume 18 Number 1 March 2010 10 TROMMSDORFF, V. (2002): Konsumentenverhalten, 4. Ed. Stuttgart.

Doc. Id: EDUCAIR_WP7_D7_V3
Doc. Title: Deliverable7.11 Doc. Version: Final
Contract:284899
Date: April 2013 Page: 54of 87
Figure 17 – Applicant’s job choice process
The set of all offers available in the market forms the Universal Set. The applicant however may
not know (and, most times, does not know) about of all available offers; instead he/she is only
aware of a partial set. This partial set forms the Awareness Set. The actual size of the
Awareness Set depends on both the applicant and the company. In what concerns the former,
the amount of aware job depends on his/her curiosity and resources (time, money, etc.) to look
for the jobs. In what concerns the latter, the amount of aware jobs depends on the resources
(marketing campaigns, participation in info or job fairs, etc.) deployed by the companies to
disseminate its job offers.
The applicant may not necessarily collect information about all the known job offers. He/she
may discard non-fit companies or jobs offers that imply a change in location. Therefore the
applicant will only evaluate (that is, gather information and evaluate the possibility of applying)
a reduced set of job offers. This set is designated as Processed Set.
The applicant evolves then to a stage in which more and detailed information is collected about
the job offer and company. Here again, only a smaller amount of job offers are likely to be
selected for application. The applicant may conclude that he/she does not fit into the job, the
offer requires other competences or skills than his/hers, or the job is simply not attractive. This
reduced set forms the Considered or Evoked Set and represents the set of job offers found
attractive to be applied by the applicant.
The applicant’s job choice process can thus be summarised through a set of 3 steps of which 2
steps involved decision making (Steps 2 and Step 3) and 1 step – Step 1 – depends on the
searching and dissemination efforts.
11 SHOCKER, A.D., BEN-AKIVA, M., BOCCARA, B., and NEDUNGADI, P. (1991): Consideration Set Influences on Consumer Decision-Making and Choice: Isues, Models and Suggestions. Marketing Letters, 2:3 (1991), S. 181-197.
Applicant’s influence
Job Offer
Universal Set
Awareness Set
Processed Set
Considered or Evokes Set
Legend:
Step 1
Step 2
Step 3

Contract:284899
Authors: Reis, Macário, Ribeiro
Partner Responsible: IST
Dissemination Level: Public
Page:55 of 87 Date: April 2013
5.1.2 Current Situation in Air Transport and Aeronautics Sectors
Labour markets worldwide are undergoing unprecedented evolutions. Over the last decades,
Globalisation and other phenomena opened first ever opportunities for people to freely (or with
low barriers) move across regions and Countries. Naturally, in parallel, employees’ mobility is
raising not only at geographical level but also across industries or markets. While some decades
ago, to seek job in an entirely different industry was uncommon, nowadays it is a daily business
and often stimulated and sought for industries as a way to acquire new skills and abilities. If this
creates new opportunities for recruitment, it also creates major and new problems for
companies to retain their best employees.
In human capital intensive industries, like in the AT&A, it has long been recognised that
employees’ knowledge, skills or abilities are fundamental for sustaining the long term
sustainability of a company. Indeed, the competitive edge of AT&A industries heavily relies on
their ability to attract and retain the best applicants. However, this is becoming increasingly
difficult and some authors classify as “war for talent” (Axelrod, 2001 – see 18329851.pdf) the
current dynamics and evolutions occurring in the labour markets.
Although this problem has emerged and grown in parallel with Globalisation, this phenomenon
was not the root of the problem but simply an enabler for an already existence but latent one.
The progressive freedom in moving linked to an economy-driven Society drove employees to
seek better opportunities resulting in a growing mobility.
The AT&A sectors have undergone profound changes over the last couples of decades. In
addition to the European Union liberalisation in the nineties and many others around the world,
there were many other factors impacting the sectors, including: a growing environmental
awareness, which put the industry under a major pressure and forced the industry to reduce its
carbon footprint and emissions; a growing demand for air transport services, which is requiring
further supply from an industry that is often working at its full capacity; a progressive increase
in fuel costs; or significant technological progresses, that over the last years produced major
solutions and advancements for the industry. It is within this whirlpool of constant change that
AT&T companies operate and compete. Necessarily, such evolutions have brought more or less
changes into the required competences of the work force. Recently, H. Deconinck (2011)12
elaborated some of the industrial needs and requirements in aeronautics:
Fuel efficiency (CO2), reduction of noise emission, reduction of NOX;
12 Decononck, H. (2011) Trends in Educational Activities and Tools for Aeronautics the example of the von Karman Institute, Aerodays 2011, 6th European Aeronautics Days, Madrid, March 30 – April 1, 2011

Doc. Id: EDUCAIR_WP7_D7_V3
Doc. Title: Deliverable7.11 Doc. Version: Final
Contract:284899
Date: April 2013 Page: 56of 87
New materials for light weighted aircrafts;
Innovative aircraft configurations (flying wing, etc.);
Innovative engines (contra-rotating propeller, etc.);
Flow control (laminar wing … ), MEMS, morphing;
Shortening in the design cycle of new aircraft, engines, etc.;
In the Air Transport sector, the implementation of the Single European Sky by 2020 is expected
to radically change the paradigm of planning, organising and managing the Air Traffic. Currently,
SESAR, the technological research program of the Single European Sky initiative is conducting
wide scale research projects to create the necessary technological and knowledge for the correct
deployment of the initiative. It is therefore natural to anticipate significant changes in the
required competences, as well as, the creation of new ones.
AT&A sectors have been suffering from this growing problem and progressively industries are
reporting the difficulty in attracting sufficiently skilled employees. The reasons for such problem
have already been identified and are well documented elsewhere (Deconinck, 2011, Favennec,
201113). We summarise here the main identified problems:
P1: Progressive loss of interest in scientific or technical carriers
Traditionally, scientific and technical carriers ranked among the most reputed and socially
relevant ones. However, along the years, they have progressively been replaced by others
more fashionable (and eventually well paid). Among these, we include: financing and
banking, management and entrepreneurship, marketing or public relationships, etc.
Rewards (promotions, salaries, societal relevancy, etc.) in the scientific and technical
carriers appear (if any at all) after a long time of dedication and investment; whereas in
the new fashionable carriers, it is believed to appear after almost immediately and with
lower investments. Consequently, when making the trade-offs between carriers, the
rewards of a scientific or technical carrier are not worth the required investment.
P2: Progressive loss of prestige of the Air Transport and Aeronautic Sectors
Air Transport and Aeronautics, in the broad sense, have always captured the interest of
people, in general, and youth, in particular. The opportunity to work with a flying machine
or in a related sector was often the main driver to apply for a job in this area. However,
such glamour has somewhat faded over time. Endogenous and exogenous reasons may be
identified. The massification of air transport contributed to the reduction of the mystic.
Also, many other industries have been much more pro-active in attracting youth, like for
13 Favennec (2011) How to get the right aerospace engineers of the future, Eurocopter, Aerodays 2011, 6th European Aeronautics Days, Madrid, March 30 – April 1, 2011

Contract:284899
Authors: Reis, Macário, Ribeiro
Partner Responsible: IST
Dissemination Level: Public
Page:57 of 87 Date: April 2013
example: car makers. A this reason is linked with the previous problem and it is related
with a change in society’s view on the technical related jobs (and inherently, in the AT&A
sectors).
P3: Progressive reduction of students’ interest for mathematics, physics and other sciences
A change in students’ perception about educational needs in mathematics, physics and
other sciences is underway over the last decades. Nowadays, students no longer look to
these disciplines with awe and eagerness to learn. Indeed, they label them as unattractive,
difficult, boredom and with low connection to reality. Also, they do not see them as
necessary requisite to get a gob job in the future. Instead, they are favouring other
disciplines, often related with the development of soft-skills. These disciplines are often
advertised as fundamental for getting the job.
No longer, the promising students are those with better grades in mathematics, physics,
chemistry and other science; but, in areas related with management, entrepreneurship,
marketing, etc.
P4: Technical carrier is inferior to management carrier
Although promotions and progression do occur in both technical and management tracks,
in many companies, the top positions (and, consequently, the higher salaries, benefits and
recognition) are restricted to those in the management carrier. There is therefore a major
incentive for employees and applicants to move towards this track.
P5: Job in AT&A still has a strong “male” image
A well-known term trend is the growth of female students in many high-educational
courses, particularly, in those traditionally disciples always controlled by male students,
notably: engineering and physics. However, such evolution was not necessarily mirrored
by a change in AT&A companies’ recruitment strategies and even job conditions. Arguably,
the strategies for adverting and attracting female applicants are different from those used
in attracting male applicants. Furthermore, men favour different job factors than female
women, which must be taken into account by the companies. On the other hand, the fact of
jobs in AT&A remaining labelled as male jobs may be a factor leading female students
pursuing other courses and female applicant to look elsewhere.
P6: Educational paradigm has changed favouring the teaching of soft-skills in detriment of
hard-skills
The spread of Globalisation has led to the emergence of new business and educational
paradigms, largely based on the concepts of networking and chains, and

Doc. Id: EDUCAIR_WP7_D7_V3
Doc. Title: Deliverable7.11 Doc. Version: Final
Contract:284899
Date: April 2013 Page: 58of 87
(multidisciplinary) teams. In parallel, we witnessed in many prominent management
schools the emergence of novel educational paradigms, often largely based in the
development of soft-skills (precisely to educate students working in the Globalised world
and teams). Progressively, this trend was adopted by other schools and universities.
Although the relevancy of soft-skills cannot be challenged, the problem occurs when the
teaching of hard-skills is reduced to a point that students lack the competencies to work in
scientific or technical areas. This trend also occurred to more or less degree in engineering
schools leading to a progressive reduction of knowledge on central areas for AT&A. The
direct consequence was the reduction of interest of students in these industries.
P7: Reduction of systems engineering-related courses
The development of industry and labour market has favoured the specialisation of
employees. In paralleled many engineering-related courses were structured in silos with
low (if any) interaction among them. This has created a bread of knowledgeable engineers
in a given area, but with little understanding outside their area. If this is positive in certain
business sectors, the same does not occur in AT&A, in which employees are erquired to
have a systems’ view and knowledge of the entire productive process. This may be leading
specialised applicants to look elsewhere.
The impact of each problem in the level of attractiveness varies in nature and reach. Recalling
the job choice process discussed in the previous Section and schematised in the Figure 17, we
can now identify the step (or steps) impacted by each problem. Figure 18 links the problems
with the steps.
Figure 18 – Impact of the problems with the steps of the job choice problem
Universal Set
Awareness Set
Processed Set
Considered or Evokes Set
Step 1: P1, P2, P3, P4, P5
Step 2: P1, P3, P4, P5, P6
Step 3: P5, P6, P7, P7

Contract:284899
Authors: Reis, Macário, Ribeiro
Partner Responsible: IST
Dissemination Level: Public
Page:59 of 87 Date: April 2013
The Progressive loss of interest in scientific or technical carriers (Problem 1) has an earlier
influence in the job choice process and, thus, in the level of attractiveness. The point is that if
students do not even think in getting a scientific degree they will hardly become acquainted with
jobs in the domain of AT&A (Step 1) or will immediately discarded them (Step 2). The
Progressive loss of prestige of the Air Transport and Aeronautic Sectors (Problem 2) is another
problem with the same level of impact. If AT&A sectors fail to get known to students and
applicants, they will simply not search for jobs (Step 1). AT&T sectors need to adopt a pro-active
positioning in order to stand above the crowd and flag themselves out. The progressive reduction
of students’ interest for mathematics, physics and other sciences (Problem 3) has a similar effect,
since may lead them to divert to other domains and necessarily exclude them from searching
(Step 1) and working (Step 2) in AT&A sectors.
By the same token, the fact of a Technical carrier is inferior to management carrier (Problem 4)
may divert students from pursuing educational (Step 1) and later on a carrier (Step 2) in AT&A
afraid of being relegated to inferior job positions.
The next problem related with the fact that Job in AT&A still has a strong “male” image (Problem
5) has a much wider impact since it influences the ability of AT&A sectors to attract female
applicants. The problem starts at school level with female students discarding the idea of getting
a degree in engineering simply because AT&A is not for hers. The first impact is when they
graduate, AT&A sectors will not be scanned (Step 1). Even if they get an engineering degree,
female applicants may discard right way AT&A job offers afraid of inadequate conditions or
simply thinking that it is not a job for them (Step 2). Finally, is the AT&A companies do not offer
adequate conditions for female workers, including equal opportunities, they may simple not
consider such offers for application (Step 3). Therefore, this problems has a profound impact in
the level of attractiveness of AT&A companies.
The fact of Educational paradigm has changed favouring the teaching of soft-skills in detriment of
hard-skills (Problem 6) and the Reduction of systems engineering-related courses (Problem 7)
may lead applicants to not process AT&A jobs offers (Step 2) afraid of not having enough
competences, or simply discarded them upon reading the actual requirements (Step 3).
5.2 Results of the Surveys and Interviews
As explained in Section 3, three Surveys were conducted to assess the attractiveness level. Each
survey targeted a specific group, namely:
Graduates of universities and colleges with engineering programs in AT&A who are not
working in these sectors (WP7).

Doc. Id: EDUCAIR_WP7_D7_V3
Doc. Title: Deliverable7.11 Doc. Version: Final
Contract:284899
Date: April 2013 Page: 60of 87
Graduated employees working in the AT&A companies (WP6);
Students of universities and colleges with programs in AT&A (WP4 and WP5);
In this section we present the results of the three surveys.
5.2.1 Survey to graduates who are not working in AT&A sectors
This survey has thus far yield a reduced amount of answers. Tracking former students revealed a
difficult task. Over time, these graduates students loose most (if not all) ties with the AT&A fields
(meaning: former professors, colleagues, university, associations, etc.). They do not update their
contacts in the Alumni Associations or Universities’ Students Office. In practical terms, the
natural distributions channels (i.e: Alumni Associations, Universities and Associations) were of
little use. Instead, we had to rely on the professional contact network of EDUCAIR partners (both
with other professors, researchers and former students). The total amount of valid answers on
the 15th March 2013 was of 16. Despite the number, it was still possible to draw interesting
conclusions about the attractiveness of the AT&A sectors.
Section 3.3 provides a description about the structure of the survey. It is divided in seven parts
as follows:
Part 1. General information about the respondent (Q1-Q4)
Part 2. Educational Background (Q5 – Q10)
Part 3. Attraction and Repulsion Factors in AT&A education (Q11-Q12 & Q19)
Part 4. Current Employment Status (Q13 – Q14)
Part 5. Working experience in AT&A sectors (Q15)
Part 6. Attraction and Repulsion Factors in AT&A sectors (Q16-Q19)
Part 7. Other Comments (Q20 – Q22)
Owing to the amount of received messages, we conducted a qualitative analysis. We will now
present a table with the results for each part. The column headers display the Question Number
and a brief description. The list of questions is presented in Annex I.
Table 14 - Part 1: General information about the respondent
# Respondent Q1: Age Q2: Nationality Q3: English as 1st
Language Q4: Gender
1 29 French No Male
2 26 Portuguese No Male
3 39 Portuguese No Male
4 27 Malaysia No Male
5 25 Portuguese No Male

Contract:284899
Authors: Reis, Macário, Ribeiro
Partner Responsible: IST
Dissemination Level: Public
Page:61 of 87 Date: April 2013
6 40 german No Male
7 56 Austrian No Male
8 38 Swedish No Male
9 31 Dutch No Male
10 35
British and Lebanese No Female
11 49 German No Male
12 34 Austria Yes Male
13 51 Czech No Male
14 63 german No Male
15 31 German No Male
16 25 Dutch No Female
17 29 portuguese No Male
18 27 Portuguese No Male
19 25 Indian Yes Male
Table 15 - Part 2: Educational Background (Q5 – Q10)
# Respondent
Q5: Educ. Backg.
Q6 & Q7: Grad. Maj.
Q8: AT&A Educ. Level Q9: Influence of
AT&A Educ. Level
Q10: Licenses
1 PhD Materials
engineering PhD programe Major None
2
Master degree
Other Engineering,
please specify below A Master degree Major
None
3 PhD Aerospace
engineering PhD programe Minor None
4 Master degree
Mechanical engineering Up to 1 year Minor
None
6 Master degree
Aerospace engineering A Master degree Major
None
7
PhD Information Systems & Computer
engineering Up to 1 year Minor
None
8 Master degree
Business Economics
Vocational/Professional course Minor
None
9
PhD Other Engineering,
please specify below
A post-graduate research/PhD program Minor
None
10 Master degree
Aerospace engineering A Master degree Minor
None
11
Master degree
Other Engineering,
please specify below A Master degree Major
None

Doc. Id: EDUCAIR_WP7_D7_V3
Doc. Title: Deliverable7.11 Doc. Version: Final
Contract:284899
Date: April 2013 Page: 62of 87
12 Master degree
Aerospace engineering A Master degree Major
None
13
PhD Information Systems & Computer
engineering A post-graduate
research/PhD program None
None
14 Master degree
Aerospace engineering A Master degree Major
None
15
PhD Other Engineering,
please specify below
Vocational/Professional course Major
None
16
Bachelor degree
Aerospace engineering A Bachelor degree Major
Flight Operations
Officer license
17 Bachelor degree Management A Bachelor degree Major
None
18 Master degree
Civil engineering Up to 1 semester None
None
19 Master degree
Civil engineering Up to 1 semester Minor
None
Table 16 - Part 3: Attraction and Repulsion Factors in AT&A education (Q11-Q12 & Q19)
# Respondent Q11: Attraction Q12: Repulsion Q19: Missing
Educ.
1 - - -
2 - - -
3 Technology Tactics On job learning
and training.
4 - - -
5 A Dream to Put Something
Flying Creative A need for more practical teaching than theoretical
-
6 - - -
7
Fascinated by aviation
Interesting technology area with broad technical education
Boring and Unfair teachers None
8 High tech industry
The fact that the air transport sector is so large and
internationally interdependent makes change management
(which I was studying) extremely cumbersome.
-
9 - - -
10
I was interested in pursuing a PHD in NPT (navigation,
positioning and timing ) but I couldn't secure a scholarship.
Topic is attractive because it is highly transferable to other
Other areas that I found dull were ATC and ATM . Lots of boring
theories , very little engagement with the core of the topic , no
practical case studies were discussed in class( problem
Mathematical modeling for
NPT . Overlapping between IT

Contract:284899
Authors: Reis, Macário, Ribeiro
Partner Responsible: IST
Dissemination Level: Public
Page:63 of 87 Date: April 2013
modes and disciplines, very dynamic and fun to work on.
solving) or the like.
11
Interest in topic international working environment
attractive projects attractive companies and payment
in my case : basic studies were in civil enegineering
Not applicable
12 - - -
13 - - -
14 - -
15 - -
16 - -
17 money - -
18 - - -
19
My course content at masters in transport planning at school of planning and architecture,
New Delhi
- -
Table 17 - Part 4: Current Employment Status (Q13 – Q14)
# Respondent Q13: Current Company Q14: Country
1 - -
2 - -
3 Maintenance and operational Manager Portugal
4 Phd researcher in Queen's University
Belfast UK at the moment
5 - Portugal
6 - -
7 Self-employed technology and innovation
consultant. Austria, Germany
8 System developer, SAAB Sweden
9 - -
10 I am a free lance financial consultant 03M
Solutions limited UK
11 Lead System Architect for Security
solutions at EADS/Cassidian Germany
12 Senior researcher / Lecturer Austria
13 - -
14 - -
15 - -
16 - -
17 - Portugal
18 Research in MIT-Portugal Portugal
19 Urban transport planner institute of urban transport (India), New Delhi
India

Doc. Id: EDUCAIR_WP7_D7_V3
Doc. Title: Deliverable7.11 Doc. Version: Final
Contract:284899
Date: April 2013 Page: 64of 87
Table 18 - Part 5: Working experience in AT&A sectors (Q15) and Part 6: Attraction and Repulsion Factors in AT&A sectors (Q16-Q19)
# Respondent
Q15: Work
Exp. in AT&A
Q16: Repulsion Q17: Attraction in
current Job Q18: Req. to move back
to AT&A
1 - - - -
2 - - - -
3 Yes Personal motives Personal motives Challenge
4 No N/A - -
5 Yes - - -
6 - - - -
7 No
At the time finishing the aeronautical engineers school there was no job
available in Austria.
Broadness of technology fields to be involved in developing
R&D concepts.
An interesting job offering in the field of innovation
(management).
8 No
Actually, my current work retains the
opportunity to act in the aero-domain.
It's just that I have no current project in
the domain.
My perception of the employer as seriously
wanting to address issues in my area of
competence. Commitment.
-
9 - - - -
10 No
I didn't get any support from the department at my
college, the suggested topics were not for me.
There wasn't enough education
and support to pursue a career in
the sector pr a PhD . Also from our visits to the airports and
the little we saw, the jobs ( ATControllers,
or ATM ) were extremely boring
and the people looked super
depressed. the talks very super
boring. The technological side of
the control tower was fascinating
though and people looked more
dynamic there.
The pay seems to be much lower in the
Transport sector than the financial sector. Uni
didnot help much in career guidance and the
research dept were more interested in
what topics they liked (SESAR) and not what the student wanted to
do or work on.
Proper guidance , explanation, workshops. I
also suggest that these companies can create a 2
year (plus or minus) program similar to those
created by banks whereby they train and teach
graduates with potential and then offer them careers after their
graduation from the programs. These programs
should be specific, intensive and
concentrated whereby by the end of the program the
graduate becomes specialized and can deliver
much better results .
11 Yes NA Career issues and th career progress

Contract:284899
Authors: Reis, Macário, Ribeiro
Partner Responsible: IST
Dissemination Level: Public
Page:65 of 87 Date: April 2013
ewish to do something new let to a change from mil. aircraft to
systems business unit
interesting project/programme
interesting site/town/country
12 No - - -
13 - - - -
14 - - - -
15 - - -
16 - - - -
17 No - - -
18 No
Lack of technical knowledge provided
by courses in air transport.
Specific topic on which I did my master thesis.
Better salary
19 No -
Urban transport planning helps to
various jobs related to airport planing,
transport engineering etc and there are less
jobs which are specifically related to
aerospace engineering in developing nations
-
5.2.2 Survey to graduated employees working in the AT&A companies
A full description of this survey can be found in the deliverable of WP6. In this delivery we
describe only the results concerning the questions related with the attractiveness of the AT&A
sectors. These questions are 46, 47, 53 and 54 (Figure 8). This survey has received far more
answers than the previous one. On the 15th March 2013, a total of 153 valid surveys have been
collected and analysed. Despite the larger amount, it is still not enough to conduct wide
statistical analysis. Instead, we decided to follow a mix qualitative and quantitative approach.
Questions 46 and 47 aimed to collect information about the attractiveness of AT&A educational.
Around 55 respondents described their factors. Questions 53 and 53 aimed to collect
information about the attractiveness of AT&T working conditions. Around 60 respondents
presented their perspective.
5.2.2.1 Attractiveness factors in AT&A education
In Q46, respondents were invited to specify and rank the determinant factor have led them to
choose the course in AT&A. Despite being an open question, there was a clear converge of the
answers around three 3 main topics. As such, we created four groups of answers, concerning the
3 topics plus one containing other factors, as follows:
Doc. Id: EDUCAIR_WP7_D7_V3
Doc. Title: Deliverable7.11 Doc. Version: Final
Contract:284899
Date: April 2013 Page: 66of 87
Employment related factors;
Carrier development related factors;
Fascination of AT&A sectors related factors.
1. Employment related factors
These factors refer to the positive perception of AT&A sectors in the employees, while
students, about the employment and employability perspectives. The answers evidence
students’ strong belief (and awareness) on availability of job opportunities in the AT&A
among students. But, perhaps most relevant, they demonstrate that students’
understanding (and awareness) about the richness and diversity of working options in
these sectors. Some of the answers received are quoted below:
very good employment prospects
aeronautics offers good jobs opportunities
a lot of fields to work
specialized engineering with high employability factor
promise of a challenging job after graduating
2. Carrier Development related factors
These factors refer to the attractive conditions that a job in AT&A is expected to offer,
from the perspective of a student. These can in turn be split in two sub-groups: one
related with the permanent challenges of AT&A and the other about the broad and
diverse options for working (both in terms of geography as well as in terms of roles).
In what concerns, the challenges of AT&A sectors, the received quotes were as follows:
high degree of technical challenge, complexity, continually being pushed
challenging tasks
there is always something new and it is widely open
dealing with a broad range of topics
worldwide industry
The fact of being a growing Sector both in dimension and challenges.
way of doing business in aviation industry!
highly determined and organized society with the great ratio of freedom.
Science in a top level, high tech
3. Fascination of AT&A sectors related factors
This third group of attraction factors are related with the very nature of the AT&A
industries and the inherent fascination that has driven many people over the years.

Contract:284899
Authors: Reis, Macário, Ribeiro
Partner Responsible: IST
Dissemination Level: Public
Page:67 of 87 Date: April 2013
Invariantly, one of the factors presented by the respondents was related with this factor.
The most relevant quotations are listed below:
aircrafts' mystery
the passion for aviation and everything related with it
general interest in aircraft
the most determining factor was my interest in airplanes.
affiliation to space
interest in aeronautics
personal attraction
interest to know how fly
passionate about aircraft and flight
personal knowledge and passion
air transport engineers can contribute to improving air transport passenger
mobility (on ground (airports) or in the air).
aerospace domain is my passion since the my childhood.
I love aircraft
4. Other factors.
The last group gather other attractiveness factors that do not fit in the previous ones.
One pointed out by several respondents was the fact of AT&A education implying
considerable knowledge in maths and physic. Other respondents indicated the advantage
of using AT&A graduation to get a job in a different field. A third group of respondents
claimed that AT&A education would prepare them in many relevant areas, besides
aviation or aeronautics.
5.2.2.2 Repulsion factors in AT&A education
Perhaps as important as the attraction factors, the repulsion factor evidence the drawbacks and
flaws of AT&A education and that may be causing students to divert towards other fields. The
purpose of Q47 was precisely to obtain the factors that the employees enjoyed the least while
students and that could have led them to withdraw.
Again the answers were focussed on a small set of topics. Such coherence gives confidence on
the results and denotes the existence of problems transversal to the AT&S educational sector.
Three types of main problems were documented, including:
1. Cumbersome regulatory and legal framework
2. Heavy theoretical with unperceived connection with real practice
3. Reduced amount of practical working hours.

Doc. Id: EDUCAIR_WP7_D7_V3
Doc. Title: Deliverable7.11 Doc. Version: Final
Contract:284899
Date: April 2013 Page: 68of 87
1. Cumbersome legal framework
Many respondents claimed the regulatory and legal framework was quite difficult and
lengthy. The burden to acquire the duly certifications was also considered considerable
and excessive. Some of the answers are quoted below:
high level of bureaucracy
bureaucratic works
highly regulated
certification and related "administrative burden"
2. Heavy theoretical with unperceived connection with real practice
The second problem identified by most respondents was related with the actual
curricula and teaching methods. Respondents do not complain about the amount of
taught theory, but only from the lack of a clear relationship with the real practice. In
other words, the teaching was too abstract not in line with the needs of the industry. As a
consequence, respondents claimed that the teaching was misaligned with the needs of
the industry. Some of the answers are quoted below:
the course is very focused on theory and not what is actually done in aviation
world;
course content too abstract/theoretical;
too theoretical, far from the real industry needs;
too much theoric, away from the airlines real needs.
most specific aerospace classes were too theoretical and had little to no relevance
when considering what is done at industry level;
unpreparation of the faculty professors regarding the current technology;
the lack of industry inputs to the academy and academic outputs to the industry
very few pratical stuff;
lack of applicability of the studies taken;
too technical (and for 90% of the people useless) preparation.
3. Reduced amount of practical working hours.
The problem reported in final group is in line with the previous one and it is perhaps its
root. Respondents claimed for a low amount of practical studies and insufficient
connection with the industry. Naturally, this resulted in the problem reported in the

Contract:284899
Authors: Reis, Macário, Ribeiro
Partner Responsible: IST
Dissemination Level: Public
Page:69 of 87 Date: April 2013
previous group, about a disconnection between what is taught in the classroom and what
is required by the industry. Quotes of the respondents are listed below:
lack of "hands-on"/concrete working material.
lack of hands on subject
lack of practices or relations with entities within the sector to be ready to work in
the real world;
lack of internship and on-job training opportunities in air transport or aeronautics
companies during the course of my studies.
5.2.2.3 Attractiveness factors of AT&A job
In Q53, respondents were invited to specify and rank the factors that they valuate the most in the
AT&A industry – attractiveness factors – and that could incentivize others to pursue a similar
carrier. This was an open-question, in which respondents were free to leave their ideas and
thoughts. Despite the variety of answers, again they all cluster around a small number of ideas,
in this case we were able to identify three main attractiveness clusters:
1. Professional prestige and recognition;
2. Working conditions and benefits;
3. Challenging working;
1. Professional prestige and recognition
AT&A industry still remains a substantial amount of their prestige and this is notorious
in the respondents. Many of factors reported a pride and respect earned by working in
these sectors. Likewise, the answers evidence that employees share a feeling of
belonging to something worth and the belief of contributing to a bigger cause. Some of
the answers are quoted below:
to work in the field (aerospace);
the possibility to participate in the development of the future aviation system at a
time of intense change in the domain;
my work is valued;
my work helps improving efficiency in my department;
my superior relies on me and values my work;
flexibility potential for self-fulfilment.
2. Working conditions and benefits

Doc. Id: EDUCAIR_WP7_D7_V3
Doc. Title: Deliverable7.11 Doc. Version: Final
Contract:284899
Date: April 2013 Page: 70of 87
In parallel with the prestige of the industry, the above-average working conditions and
benefits were also repeatedly reported by the respondents as a key attractiveness factor.
In addition to the benefits, AT&A sectors offer their employees good working conditions,
in an international environment with multidisciplinary teams. In addition, employees
have the opportunity to work an ever-evolving business activity. Some of the answers
are quoted below:
organization and work conditions;
interest for people and organization;
the job stability and very good atmosphere amongst colleagues;
relevance for the company-development influence remuneration;
autonomy;
the people who work with me
stability,
income
a profession as well as a hobby, job flexibility, work-Life balance, relatively high
income
Good team play of multi-disciplinary researchers
family friendliness of employer
interesting work colleagues
3. Challenging working conditions
The final group of attractiveness factors is related with the ever-changing ever-evolving
nature of AT&A business and the direct consequence of employee being constantly
changing and facing new challenges. This lack of routines, or at least the change in the
job activities was a factor often repeated in the surveys. Employees are faced with
evolving working conditions which was reported as very positive. In addition, the
international nature of the AT&A industries was considered positive, since it entails
working in an multinational and multidisciplinary teams. Linked to this is the
opportunity to work in different regions. Some of the answers are quoted below:
influence major technical and infrastructure investment decisions;
the opportunity to develop real projects and real demonstration of technologies.
the need of rapid response and multi-discipline projects.
high Technology environment.
innovation
challenging environment

Contract:284899
Authors: Reis, Macário, Ribeiro
Partner Responsible: IST
Dissemination Level: Public
Page:71 of 87 Date: April 2013
innovation management,
freedom in research job.
to be in the R&D area where things evolve and change.
job that you can have in almost any point in the globe.
creativity diversity of addressed problems
multidisciplinary work
international working environment
range of different subjects/stakeholders
I have to deal with and constant learning it requires.
the diversity of tasks that need to be addressed and solved
creativity.
variety of jobs ranging from concept work to programming
every day is different than the previous one.
to be part of an international team
big company with big projects.
5.2.2.4 Repulsion factors of AT&A job
The final question concerning the attractiveness on AT&A jobs was placed in Q54, in which
respondents were invited to specify and rank the factors that they valuate the least in the AT&A
industry – repulsion factors – and that could lead others to avoid this industry. Like in all the other
questions, respondents were free to leave their ideas and thoughts. Interestingly, the problems
put forward are rather identical to the previous ones, but now seen from a negative perspective.
However, conversely to the answers in previous question, the reported problems were too firm
specific (for example one answer was “lack of coaching from current boss and no team work
spirit”) and, therefore, cannot be considered representative of the industry. Arguably, many
companies in AT&A may have poor management or working conditions but that does not mean
that cannot be generalised to the whole industry. The direct conclusion is that some respondents
used the survey to convey their discomfort instead of looking. In any case, some answers do
provide valuable information to understand some transversal problems and therefore may
represent repulsion factors. The valuable answers were all around the same problem that is
related with the lack of appropriate competences in many employees. As a consequence, they
perform poorly leading to multiple problems, such as: underperformance, bad working
environment or lack of empowerment. This reported problem may also reveal a lack of suitable
education in this domain and may represent a tip of an iceberg. A most revealing answer of this
problem is the following one: “young engineers failing to present recommendations and
judgements rather than data generated by a computer output”.
Doc. Id: EDUCAIR_WP7_D7_V3
Doc. Title: Deliverable7.11 Doc. Version: Final
Contract:284899
Date: April 2013 Page: 72of 87
5.2.3 Survey to students of universities and colleges with programs in AT&A
The last survey used to provide inputs to assess the attractiveness of AT&A sectors was
conducted to current students enrolled in AT&A courses/programmes. The full description of
the survey can be found in the deliverables of WP4 and WP5. Similarly to the previous sections,
in this delivery we only describe the results concerning the questions relate with the
attractiveness of the AT&A sectors. These questions are the 12 and 13 (Figure 8). This survey
has received far more answers than the previous ones. On the 15th March 2013, a total of 409
valid surveys have been collected and analysed. Despite the larger amount, it is still not enough
to conduct wide statistical analysis. As such, we decided to follow a mix qualitative and
quantitative approach.
Questions 12 and 13 aimed to collect information about the attractiveness and repulsion,
respectively, of AT&A educational and working context. Around 80 respondents described their
factors.
5.2.3.1 Attractiveness factors in AT&A education
In Q12, students were invited to specify the attractiveness factors of the course (i.e., the
determinant factors for choosing your course). Despite the +76 open answers, there was a clear
convergence around three focal ideas. Indeed, the convergence was so vivid that students,
regardless being in different countries often used a similar wording. Interestingly, all the three
attractiveness factors coincides with the factors listed in Section 5.1. The attractiveness factors
of AT&A are:
Fascination of AT&A sectors.
Challenging work, technological and innovation driven;
Employment and working benefits and benefits;
1. Fascination of AT&A sectors
The vast majority of students indicated a more or less interest by airships, aeronautics or
aerospace as a key reason to engage in the course. One of the students wrote that “since I
was 16 years old that I wanted to choose this course”. Indeed, as already mentioned in
Section 5.1, the fascination around AT&A industries is a key factor in the attractiveness
of the sector. Some of the answers received are quoted below:
I was always attracted by air transport industry
exciting and interesting field of study
curiosity and fascination of aeronautical and astrophysical phenomena
being space related
Contract:284899
Authors: Reis, Macário, Ribeiro
Partner Responsible: IST
Dissemination Level: Public
Page:73 of 87 Date: April 2013
for me it's like the space, and the excellence of the course between others.
I like everything related with space, technology and innovation
2. Challenging work, technological and innovation driven
The second most often refereed attractiveness factor was the perception of a work in
AT&A being challenging and demanding. Clearly, students have built an idea about a job
in AT&A industry. The job certainly is always changing, in line with the technological
developments and new demands, above-average demanding, in terms of required
cognitive capabilities and knowledge, and challenging. Some of the answers received are
quoted below:
complexity
challenging and modern
Many real complex problems.
Ability to learn about a demanding sector and broad technical skills
3. Employment and working conditions and benefits
The last attractiveness sector is related with the high levels of employability of the AT&A
sectors and the (well) above average working conditions and benefits. As often as not,
students indicated the high availability of jobs in the AT&S sectors, the perspectives of
having a good working carrier and development and, in parallel, the expectation of a well
paid job (and other benefits). Some of the answers received are quoted below:
good chances of having a high salary
job availability
employment rate
employability.
job opportunities in aerospace Career
5.2.3.2 Repulsion factors in AT&A education
In Q13, students were invited to specify the repulsion factors of the course (i.e., the determinant
factors which could discourage someone from choosing your course). The amount of answers was
slightly fewer than in the previous one, in a total 65. This may denote a students’ satisfaction
towards the programmes. This is more evident when some of the students answered having no
repulsion factor on the course. The answers could be grouped around three main topics,

Doc. Id: EDUCAIR_WP7_D7_V3
Doc. Title: Deliverable7.11 Doc. Version: Final
Contract:284899
Date: April 2013 Page: 74of 87
although not necessarily representing repulsion factors but simply negative (or nor positive)
characteristics of the programme, being:
Above-average difficulty and lengthy of the programme;
Excessive theoretical contexts;
Insufficient emphasis on practice.
1. Above-average difficulty and lengthy of the programme
Two factors that were consistently presented side by side were the inherent difficulty
and the lengthy of the programme. Some of the quotes are:
the difficulty of the subjects
being so difficult and having so few chairs about space
very extend course, and also a bit difficult
time to devote to the study
it is a very demanding course.
the length of the education, currently 4 years.
the amount of work during the 5 years.
Bearing in mind the underlying knowledge (in terms of math or physics) behind many of
the disciplines, we can easily understand why students label the programmes as being
rather demanding. We cannot however say that this is necessarily a repulsion factor;
instead, we see it more as a complain about the (excessive) amount of contents lectured
in the period of classes (see next factor). Indeed, we can hardly conceive these students
(that had previously pointed out precisely the challenging nature of the discipline as a
key attractiveness factor) accepting seeing their programme reduced in its contents;
neither see the industry accepting being deprived from valuable human resources.
2. Excessive theoretical contexts
This second factor is intrinsically related with the previous one and with the following
one (see next factor). Along with the difficulty of the subjects, students also mentioned
that excessive theoretical contents. They acknowledged intellectual interest, but
questioned the practical usefulness of such knowledge, in particular, how it could be
used in a working context. Necessarily, without a stimulus or motive (i.e. not seeing the
(practical) utility of such contents), a feeling of frustration can build up within students
and the sensation of difficulty will naturally emerge. Some of the quotes are listed below:
too much theory and less practice;
too narrowly focussed;

Contract:284899
Authors: Reis, Macário, Ribeiro
Partner Responsible: IST
Dissemination Level: Public
Page:75 of 87 Date: April 2013
extensive theoretical component;
much theory;
The course itself has a high emphasis on theory and low emphasis on practice;
with the current industry technology;
to have some parts that is more to memorize than to work;
3. Insufficient emphasis on practice
The last factor is again directly linked with the previous ones and it is related with the
insufficient practical component of the programmes. Many students reported that their
courses have few hands-on work components. Consequently, they often miss
understanding the applicability of their knowledge. Also, of high relevancy is the fact of
some students reporting a teaching gap in terms of technology and practice. That is, the
contents of the lectures, concerning technological issues or practical aspects, are
outdated (or simply do not report the latest developments), which creates a feeling of
disappointment in the students. Some of the quotes are listed below:
not enough focus on the practical side;
very poor relation with the industry, poor organization of some subjects and
lack of a more practical approach;.
low contact with industry;
a lot of knowledge is very interesting but the chance is big that you will never
use it in your carrier.
5.3 Discussion of Results
Notwithstanding our best dissemination efforts, some of the surveys got a low rate of answers,
namely the one targeting the graduates who are not working in AT&A sectors. Several reasons
may be pointed out.
Firstly, people are less and less willing to participate in this kind of activities. This is the natural
outcome of the progressive growth of web-based surveys made by the most diverse entities and
with the most diverse purpose. In order to minimise the risk of flooding people with e-mail
messages concerning EDUCAIR surveys, we have segmented our mailing lists accordingly with
the type of surveys. Consequently, each person has in principle only received one tailored e-mail.
We have done several waves of calls, but always following this principle. Naturally, we informed
respondents about the other surveys and invite them to distribute among their contacts.
Secondly, our surveys targeted a very specific segment of the employees and students; therefore,
we could never expect a large amount of surveys. This specificity raised a third limitation that

Doc. Id: EDUCAIR_WP7_D7_V3
Doc. Title: Deliverable7.11 Doc. Version: Final
Contract:284899
Date: April 2013 Page: 76of 87
was reaching the right audience. Students or companies are fairly easy to pinpoint. The
universities, colleges or research centres with interest in AT&A sectors are well known of
EDUCAIR’s partners (besides a web based search yields a large amount of them). The response
behaviour has however been rather different; while students (and researchers) have fairly
answered our call; professors, lectures and so (universities and research centres) have not. This
denotes a higher willingness of the former in relation to the latters. Naturally, we may argue that
students have more free time, although this is hardly a reason since most students reported
having no spare time.
Conversely, employees and other graduated revealed being rather difficult. Companies did not
show major willingness to distribute the survey among their workers. Furthermore, although we
could retrieve the companies’ contacts that do not necessarily mean access to the employees
contacts. Consequently, we had to rely on the willingness of the human resources, marketing or
other department to distribute internally. In addition, we also used our own network of contacts
to reach the employees and it is our understanding that this solution was far more effective than
the previous one.
Finally, the group that revealed being most difficult to be contacted was the former graduates in
AT&A. The point is that most of these students lose (or broke) all the links with the AT&A
sectors when they moved to another field of work. Universities’ alumni databases revealed of
little use as contacts were often outdated. They are also outside the network of contacts of the
AT&A Associations or Alumni Associations (most likely, they are not enrolled in other
associations). Consequently, we could not rely on these networks of contacts because. Also,
because their current fields of work are not known and since we had very limited resources, to
do a call embracing all fields of work was not feasible.
Looking now into the repulsion factors on AT&A education, we can conclude for a strong
consistency of the results within and between each set of surveys (that is: students and
employees). As explained in each section – Section 5.2.2.2 and Section 5.2.3.2 – the respondents
focussed on a reduced set of negative aspect of educational system. More interestingly though is
the similitude between the employees and students’ answers – there is almost a complete
overlapping.
The employees focussed around the main repulsion factors being: cumbersome regulatory and
legal framework, heavy theoretical with unperceived connection with real practice, and reduced
amount of practical working hours. In turn, the students answered an: above-average difficulty

Contract:284899
Authors: Reis, Macário, Ribeiro
Partner Responsible: IST
Dissemination Level: Public
Page:77 of 87 Date: April 2013
and lengthy of the programme, excessive theoretical contexts, and insufficient emphasis on
practice. The employees and students coincide in the two last topics.
Starting with the different topics, employees reported difficulties to obtain the necessary legal
certificates to work in some AT&A jobs. It is natural students not reporting this problem, since it
is very specific and only emerges when graduates apply for it. Certificates are provided by either
national or international bodies. The process appears to be lengthy and involving a considerable
amount of bureaucracy. Bearing in mind that a considerable amount of job, in AT&A industry,
requires a valid licence (see Deliverable of WP3 for further information), this factor is indeed
relevant and should be investigated. On the other hand, this problem only seems to emerge after
graduation, as students did not report it (and many of them mentioned having the intention of
applying for a job that required a licence, such as: traffic operator, or aircraft maintenance).
Although, thus far, this problem has been limited, and therefore could not be considered as a
potential factor contributing to reducing attractiveness, it should be tackled as soon as possible
in order to avoid possible contagious to students.
Looking now to the students’ survey, they reported as problem an excessive difficulty of the
course. As already discussed in the previous section, this is not necessarily a repulsion factor,
since we can hardly conceive students wishing an easy and simple programme. Furthermore,
AT&A domain requires a deep knowledge on certain fundamental fields, such as: mathematics,
or physics, or applied fields, such as: mechanics, fluids, materials, etc. Naturally, the contents are
demanding and lengthy and, naturally, only above average students may be able to pursue such
studies. For this reason, it is perfectly understandable to see labelled the programs as difficulty.
However, we must not confuse impossibility with difficulty. That is, the topics must be feasible
to teach and learn within to the available lecturing and studying times, even requiring major
efforts and commitment by the students. Otherwise, the program is not difficult but impossible.
The students fell frustrated, since they cannot cope with the requirements, with a subsequent
loss of commitment and detachment from the programme. Notwithstanding this factor must not
be ignored, principally, because it was consistently reported by students across the EU. This may
evidence an underlying transversal problem he to EU’s educational system. This problem is also
intrinsically linked to the remaining two problems.
The remaining two factors were simultaneously reported in the students and employees’
surveys. Such consistency reinforces the validity of the findings. Yet, perhaps, more importantly
the surveys reveal that these repulsion factors occur for some time now, since employees have
ended their studies some years ago. These two problems are more relevant when the employees
pointed it out even after ending the programme and starting working. It is therefore relevant

Doc. Id: EDUCAIR_WP7_D7_V3
Doc. Title: Deliverable7.11 Doc. Version: Final
Contract:284899
Date: April 2013 Page: 78of 87
now to end with this cycle so that the new generations of students could have a more positive
view about AT&A education.
One repulsion factor is related with the excessive theoretical contents of the classes with
apparently low connection with the practice. As already explained, AT&A programmes are likely
to have a strong emphasis in fundamental and applied fields, particularly, in the first two years,
which often do not have a direct translation into the real world. Nonetheless, these topics are
vital for students fully understanding the lectures in the final years, which tend to have a
stronger practical component. In addition, AT&A programmes are vast and often student end up
working in a very specific job, doing specific tasks, which only required a few amount of the
disciplines. In addition, both surveys reported that often lectures were outdated in relation to
industry’s practices, procedures or technological advancements. Consequently, the knowledge
was not used besides reducing the students’ learning interest.
The other repulsion factor is related with the insufficient practice and contact with industries.
This factor is intrinsically related with the previous one but differs in nature. In the previous
factor, the students and employees reported the inability to transform their theoretical
knowledge into competences or tool to use at their work. This factor goes in another direction
and reports that students pass too much time seated in the classroom and little time in industry
context. Arguably, studying in an industry context could lead students to better understand how
to deploy their theoretical knowledge and how to build tools for doing their job tasks. In any
case, the bottom line is that AT&A programmes appear lacking enough contact with industry and
the students feel it.
Finally, the surveys also provided insights on the attractiveness factors of AT&T sectors. Again
we found a full alignment between students and employees’ perspectives. Three main
attractiveness factors could be identified, although eventually named differently by students or
employees, being:
Fascination of AT&A sectors.
Challenging carrier development path;
Employment and working benefits;
Foremost, AT&A sectors still remain all of its mysticism and glamour, at least for the
respondents. Indeed, many respondents wrote being fascinated by airships, air transport or
aeronautics, often since adolescence. Inevitably, there were drawn into an AT&A educational
programme. In addition to awe, respondents often reported that a job in AT&A is respected and
admired by others (including family and peers). A very revealing picture was by a Polish

Contract:284899
Authors: Reis, Macário, Ribeiro
Partner Responsible: IST
Dissemination Level: Public
Page:79 of 87 Date: April 2013
employee that wrote that “aviation industry in Mielec is most distinguished in my town and in
other towns in Poland”.
A second attractiveness factors is related with the very nature of the job. Students repeatedly
evidence a strong belief about the challenging and ever-changing jobs that lie ahead of them.
And this belief was a strong reason for pursuing a carrier in AT&A industry. The employees
corroborate such belief, as many of them mentioned as very positive the dynamic and evolving
nature of AT&A industry. An employee provided a blunt example about such nature: “yesterday
we were sizing rotating parts of an aircraft engine and today we are involved in the design of a
regional airport”. Also reported as positive was the fact of AT&A sectors often being at the
forefront of technological development and pushing forward the limits of knowledge.
The final attractiveness factor was related with the high levels of employability and above-
average working benefits. The students expect and the employees confirm that AT&A employers
tend to offer attractive working conditions and benefits. Also often reported, by the employees,
was an interesting carrier path development that an AT&A job has to offer. Finally, AT&A sectors
exhibit high levels of employability, being therefore a good attractive for students.
In Section 5.1.2, we listed the trending factors in the origin of the progressive loss of students to
AT&A educational programmes. Both the attractiveness and the repulsion factors match with
those trending factors, contributing to their validation. The first conclusion is that the surveys
contributed to validate and reinforce the importance of those factors in attracting people to
AT&A educational programs. The second conclusion is that if the trends are accurate then they
can actually be diverting people towards other programmes.
Just to finalise this section, we present an answer from an employee about the reasons
underlying his choice for AT&A industry:
I wanted to be an astronaut.
I liked engineering
The ability of aircrafts to fly fascinated me
The aeronautical field had a low unemployed percentage.
We believe it provides a good example about the nature and type of answers.

Doc. Id: EDUCAIR_WP7_D7_V3
Doc. Title: Deliverable7.11 Doc. Version: Final
Contract:284899
Date: April 2013 Page: 80of 87
6 Conclusions
Currently EU’s AT&A sector faces a real risk of mismatch between the prospective employees’
competences and the market’s actual requirements (competences). And if such mismatch is not
addressed, there is the danger of creating a significant competence gap that will inevitably affect
the competitiveness and efficiency of the European AT&A sectors (Figure 2). EDUCAIR project
aims to improve the match between needs in human resources, and the educational and training
offer of engineers and researchers within the Europe Union for the horizon of 2020 in the
domains of Air Transport and Aeronautics.
EDUCAIR project’s rationale is built on the concept of competence gap. The overall concept
presented in Figure 2 was further decoupled into its fundamental constituents – or agents –
being: Companies, Employees, Universities and Students. A potential gap was identified between
every pair of agents, leading to the identification of 4 potential gaps (Figure 4), being:
Gap 1 - Competence Gap - Gap between the competences that the employees need and the actual competences of the students (i.e. to what extend are the student's competences actually useful in their working daily activities?);
Gap 2 - Gap between the knowledge that the companies need and the actual competences of the employees (i.e. to what extend do the employees' competences actually fit in their companies' competences requirements?)
Gap 3 - Gap between the knowledge the universities generate and the actual competences of the students (i.e. is the knowledge generated in the research transferred in the courses?)
Gap 4 - Gap between the knowledge the companies need and the knowledge the universities have (i.e. is the universities' research and teaching activities of relevance for the companies?)
The recommendations will be elaborated upon the assessment of the competence gaps along the
four dimensions. The present delivery presents the works developed in WP7 aimed to i) to
determine the likely number of jobs in air transport and aeronautics in European Union, and ii)
to assess the level of attractiveness of the air transport and aeronautics industries. The
attractiveness level of the AT&A industries depends on the nature of each competence gap,
mainly, Gap 1 and Gap 4.
The current WP7 was developed in parallel with three other WP, being: WP4, WP5 and WP6.
Each of these WPs contributes to the assessment of one or two competence gaps as follows, as
follows: Gap 1 (WP4), Gap 2(WP6), Gap 3(WP4, WP5) and Gap 4 (WP5).

Contract:284899
Authors: Reis, Macário, Ribeiro
Partner Responsible: IST
Dissemination Level: Public
Page:81 of 87 Date: April 2013
A set of five surveys was launched aimed to gather the necessary information to assess the
attractiveness levels and of the competence gaps. One survey was tailored for every agent, in a
total of four, as follows:
1. Companies - professionals involved in the management and recruitment of new
employees;
2. Employees - graduated employees working in the air transport and aeronautics
companies. Graduation must be in Engineering (all levels of Bologna) or Management/
Business Economics/ Law/ Economics/ Public policy (3rd level of Bologna - holder of
Phd).
3. Universities - heads of departments or full professors of universities and colleges with
engineering programs involving air transport/ aeronautics and/or research and PhD
programs in air transport/ aeronautics. Furthermore, also vocational and professional
training institutions are addressed.
4. Students - students of universities and colleges with programs in air
transport/aeronautics.
5. Graduates of universities and colleges with engineering programs involving air
transport/ aeronautics (and/ or research and PhD programs in air transport/
aeronautics) WHO ARE NOT WORKING in the air transport/ aeronautics sector.
Figure 7 and Figure 8 present the various surveys, respective contents and their cross
interactions. A fifth survey was designed and launched in parallel targeting those graduated
students in AT&A but that have either not followed or abandoned a carriers in these sectors. The
fact of these graduated students have decided working outside their educational area, reveals a
lack of attractiveness of AT&A or, alternatively, a higher attractiveness of other working sectors.
In any case, it is the AT&A that is losing competitive hedge. Thus, this people are the primary
source of information to assess the (lack of) attractiveness of these sectors.
This WP has made use of three surveys – Survey 2, 3 and 5. Survey 2 and Survey 3 are described
in detail in WP 6 (more information in the respective Deliverable). Survey 5 was structured in
the following chapters:
1. General information about the respondent (Q1 – Q4)
2. Educational Background (Q5 – Q12)
3. Attraction and Repulsion Factors in AT&A education (Q11-Q12 & Q19)
4. Current Employment Status (Q13 – Q14)
5. Working experience in AT&A sectors (Q15)
6. Attraction and Repulsion Factors in AT&A sectors (Q16-Q19)
7. Other Comments (Q20 – Q22)

Doc. Id: EDUCAIR_WP7_D7_V3
Doc. Title: Deliverable7.11 Doc. Version: Final
Contract:284899
Date: April 2013 Page: 82of 87
The questions relevant to evaluate the level of attractiveness in Survey 2 and Survey 3 are
highlighted in Figure 8.
The surveys have produced a considerable amount of information, as follow:
Survey 2 (employees) - 153
Survey 4 (students) - 408
Survey 5 - 16
Unfortunately, Survey number 5 only produced 16 answers, which is manifestly insufficient to
reach conclusions. The remaining surveys produced an interesting amount of answers enough to
produce valid conclusions.
The analysis to the Survey 2 and Survey 4 produced valuable insights into the current repulsion
and attraction factors of AT&A jobs and education. The employees’ answers focussed around
three main repulsion factors as follows:
E1. cumbersome regulatory and legal framework,
E2. heavy theoretical with unperceived connection with real practice,
E3. reduced amount of practical working hours.
Whereas the students’ answers allowed the identification of the following ones:
S1. above-average difficulty and lengthy of the programme,
S2. excessive theoretical contexts,
S3. insufficient emphasis on practice.
There is a clear overlap between employees and students’ perception. The first repulsion factors
point out by the employees can only be perceived when looking for a job. The other two are
related with the current educational paradigm. Since we got answers from multiple EU member
states we may conclude that the problem is transversal to the EU Universities.
Looking now into the attraction factors, we could identify an overlap between employees and
students’ perceptions. Although varying the description among respondents, three key
attraction factors emerged from the analysis of the results, as follows:
4. Fascination of AT&A sectors.
5. Challenging carrier and development path;
6. Employment and working benefits.
Interestingly both employees and students agreed on the attraction factors. This denotes that
the attraction factors have not been changing over time.

Contract:284899
Authors: Reis, Macário, Ribeiro
Partner Responsible: IST
Dissemination Level: Public
Page:83 of 87 Date: April 2013
From the analysis of the surveys it was quite clear that, firstly, a key driver for pursuing
education in AT&A was the students’ enthusiasm and fascination by aviation and aeronautics.
Indeed, both employees and students referred often and often that a fundamental reason for
ever entering an aviation or aeronautics graduation was the enthusiasm or fascination for this
industry, in particular, on airships or spaceships.
Secondly, employees’ referred (and students’ mentioned a strong belief) in the ever-changing
and always-challenging nature of a job in AT&A. This perception was mentioned as an important
attraction factor. Indeed, by its very technological nature and owing to the recent dynamics,
AT&A offers a very challenging working environment. This is not expected to change in the near
future, therefore, this attraction factor is not expected to fade out.
In addition, a job in AT&A still offers respect and admiration by Society and peers, and this is an
important factor of attraction. An eventual degradation of the working conditions will erode
such positive property, with negative consequences. The sources of respect were not easy to
track, but apparently the following reasons are important contributors: difficult education track,
denotes that only the most capable students are able to graduate, challenging and demanding
working competences, denotes that only the most competence people can work in this
environment, above-average salary (and other benefits), aviation and aeronautics’ inherent
fascination, and the strong technological nature of the industry, that contributes for an image of
development and advancement. All of these factors were to some extend brought forward by the
respondents.
Thirdly, AT&A companies offer (very) good working conditions and benefits. Again this was
indicated by the employees and expressed by the students. The specificities, competence
requirements or responsibilities of many tasks in aviation and aeronautics naturally results in
job positions offering above average working conditions. It is the only companies have to attract
and retain the best people for the job. With the current economic and financial turmoil,
companies may feel the temptation (or be forced) to eliminate some of the benefits or bonuses,
and eventually salaries. This poses a real threat into the attractiveness level of the AT&A
companies, as graduates (and even employees) may be attracted to other industry sectors (for
example: car automakers are increasingly looking for aeronautics engineers).

Doc. Id: EDUCAIR_WP7_D7_V3
Doc. Title: Deliverable7.11 Doc. Version: Final
Contract:284899
Date: April 2013 Page: 84of 87
There is a perception in the EU about a steady decline in the level of attractiveness of AT&A
industry over the last years. Several factors and trends were already identified as lying at the
root of this problem, including:
P1. Progressive loss of interest in scientific or technical carriers
P2. Progressive loss of prestige of the Air Transport and Aeronautic Sectors
P3. Progressive reduction of students’ interest for mathematics, physics and other sciences
P4. Technical carrier is inferior to management carrier
P5. Job in AT&A still has a strong “male” image
P6. Educational paradigm has changed favouring the teaching of soft-skills in detriment of
hard-skills
P7. Reduction of systems engineering-related courses
Every and each trend is believed to contribute, to some extent, to the decay of the attractiveness
level although the actual contribution (if any) is still to be demonstrated.
EUCAIR’s surveys cannot provide evidence to support the existence of these trends, instead they
can be used to infer about their relevancy and validity. We can use P5 as an example, only one
respondent (out of several tens) pointed out that the reduced quantity of female students was as
a negative factor; therefore, even if the trend P5 holds true, there is little evidence that it would
have significant impact in the attractiveness level of AT&A.
From the surveys we can infer the following conclusions for each trend:
P1. Both employees and students referred that the technological nature of aviation and
aeronautics was a relevant factor in their decision making process (Attractiveness factor
1 and 2);
P2. Attractiveness factor 1 provides string evidence towards the validity of this factor;
P3. It is indirectly supported by the surveys in the sense that some students referred that a
reason to choose AT&A education was the emphasis in mathematics and analytical
reasoning
P4. It is not supported by the surveys, as any employee mentioned a feeling of inferior by
having a more technical job.
P5. Already explained above.
P6. Surveys do not provide definitive answer, but many students complain about the too
heavy lectures on mathematics, physics and other analytical disciplines (repulsion factor
E2). This repulsion factor may denote that the teaching of these disciplines has not been
softened.
P7. The surveys cannot conclude anything towards this factor.

Contract:284899
Authors: Reis, Macário, Ribeiro
Partner Responsible: IST
Dissemination Level: Public
Page:85 of 87 Date: April 2013
Before arriving at the estimations for the number of jobs in AT&A, different approaches were
applied. First an attempt to the relationship between the development of employment and air
transport was made using data on an aggregated level, which means for the AT&A sector in
general. Here, estimations for Germany and different European countries were made. However,
as the results did not turn out to be reliable, they were not discussed in detail.
Furthermore, disaggregate estimations for the demand for employment at airports, airlines, at
ANSPs and the AT&A sector were carried out. As the results from those estimations proved to be
more reliable, they are discussed more in detail.
For the forecast of the demand at airports, based on information from the surveys, a share of 15-
25% of engineers in the airport sector could be assumed. The calculations then show that the
need for engineers working at airports can be assumed to grow from between 20,464 and
34,107 in 2010 to between 34,230 and 57,050 in 2020, with an average yearly growth of 5.3%.
Concerning the airline sector, a share of 5-10% of engineers in the airline sector was assumed.
The need for engineers working at airlines can therefore be assumed to grow from between
21229 and 42,458 in 2010 to between 26,670 and 53,330 in 2020, with an average yearly
growth of 2.3 %.
For the civil aeronautics sector, it can be seen that the employment of engineers in the civil
aeronautics sector growth from between 103,208 and 120,409 in 2010 to between 121,071 and
141,249 in 2020, with an average yearly growth of 1.6%. Here, a share of 30-35% of engineers in
the aeronautics sector was assumed.
Based on information from various Eurocontrol ACE benchmarking reports a share of 32-33.5%
of ATCOs in the ANSP overall employment can be assumed. Taking this assumption into account,
it can be seen that the employment of ATCOs at ANSPs grows from between 13,236 and 13,857
to between 16,839 and 17,628, with an average yearly growth of 2.4%. As all forecasts also the
forecast for the demand for ATCOs is based on present trends, therefore not incorporating
disruptions or increase in efficiency due to for example SESAR.
The main difficulty with the estimations proved to be the lack of long reliable time-series data.
Especially information about the historic development of employment in the whole AT&A sector
was scarce. However, also in the separate sectors of airlines, airports, ANSPs and civil
aeronautics sector data was difficult to find. Therefore, next to the results of the estimation, this
task shows the need for more reliable data of the employment in the AT&A sector to analyse the
development of the employment even more in detail and for a longer time period.

Doc. Id: EDUCAIR_WP7_D7_V3
Doc. Title: Deliverable7.11 Doc. Version: Final
Contract:284899
Date: April 2013 Page: 86of 87
7 Bibliography
ACI Europe and York Aviation (2004) The Effect of Liberalisation on Aviation Employment.
ACI and York Aviation (2004) The social and economic impact of airports in Europe.
Airbus (2013) Orders, Deliveries, Operators – Worldwide, available online at
http://www.airbus.com/fileadmin/backstage/orders_deliveries_table/Airbus_Feb_2013_Orders
_Deliveries.xls
Airbus (2012a) Global Market Forecast 2012-2031, available online at
http://www.airbus.com/company/market/forecast/?eID=dam_frontend_push&docID=27599
Airbus (2012b) Navigating the Future – Global Market Forecast 2012-2031, available online at
http://www.airbus.com/company/market/forecast/?eID=dam_frontend_push&docID=26347.
Air Transport Action Group (2012a) Aviation: Benefits Beyond Borders.
Air Transport Action Group (2012b) Aviation: Benefits Beyond Borders – European Union 27
Nations.
Air Transport Action Group (2005) The economic & social benefits of air transport.
ASD (2012) Key Facts and Figures, available online at http://www.asd-
europe.org/fileadmin/user_upload/Client_documents/Attachments/Facts___Figures/ASD_Facts_
and_Figures_2011.pdf
Boeing (2013) Orders and deliveries, available online at
http://active.boeing.com/commercial/orders/index.cfm?content=timeperiodselection.cfm&pag
eid=m15523
Boeing (2011) Market Outlook 2011-2030.
booz&co (2009) Effects of EU Liberalisation on Air Transport Employment and Working
Conditions.
Bundesverband der Deutschen Luft- und Raumfahrtindustrie e.V. (BDLI) (2012) 2011 -
Branchendaten der Luft- und Raumfahrtindustrie. Available at
http://www.bdli.de/images/stories/brochures/BDLI_Jahresbericht2011.pdf.
CAA (2004) The Effect of Liberalisation on Aviation Employment.
Chapman, D., Uggerslev, K., Carrol, S., Piasentin, K., Jones, D. (2005) Applicant Attraction to
Organizations and Job Choice: A Meta-Analytic Review of the Correlates of Recruiting Outcomes,
Journal of Applied Psychology, 2005, Vol. 90, No. 5, 928–944

Contract:284899
Authors: Reis, Macário, Ribeiro
Partner Responsible: IST
Dissemination Level: Public
Page:87 of 87 Date: April 2013
Decononck, H. (2011) Trends in Educational Activities and Tools for Aeronautics the example of
the von Karman Institute, Aerodays 2011, 6th European Aeronautics Days, Madrid, March 30 –
April 1, 2011
Eurocontrol (2013) Seven-Year IFR Flight Movements and Service units Forecast 2013-2019,
available online at http://www.eurocontrol.int/documents/seven-year-flights-forecast-2013-
2019.
Eurostat (2013) Database, available online at
http://epp.eurostat.ec.europa.eu/portal/page/portal/eurostat/home/
Favennec (2011) How to get the right aerospace engineers of the future, Eurocopter, Aerodays
2011, 6th European Aeronautics Days, Madrid, March 30 – April 1, 2011
IATA (2013) FACT SHEET: Industry Statistics, available online at
http://www.iata.org/pressroom/facts_figures/fact_sheets/Documents/industry-facts.pdf
ICAO (2011a) ICAO study reveals strong demand for qualified aviation personnel up to 2030, 8
March 2011, available online at
http://www.icao.int/Newsroom/News%20Doc/PIO.03.11.EN.pdf
ICAO (2011b) Global and Regional 20-year Forecasts – Pilots, Maintenance Personnel and Air
Traffic Controlers.
IMF (2012) World Economic Outlook Database.
Kupfer, F., Lagneaux, F. (2009) Economic importance of air transport and airport activities in
Belgium, Working paper no. 158, National Bank of Belgium, Brussels.
Struyf, E., Kupfer, F. (2012) Deliverable 3: setting the assessment framework for education and
training, EDUCAIR Project
TROMMSDORFF, V. (2002): Konsumentenverhalten, 4. Ed. Stuttgart.
Tsai, W-C., Yang, W-F. (2010) Does Image Matter to Different Job Applicants? The influences of
corporate image and applicant individual differences on organizational attractiveness,
International Journal of Selection and Assessment, Volume 18 Number 1 March 2010
SHOCKER, A.D., BEN-AKIVA, M., BOCCARA, B., and NEDUNGADI, P. (1991): Consideration Set
Influences on Consumer Decision-Making and Choice: Isues, Models and Suggestions. Marketing
Letters, 2:3 (1991), S. 181-197.

Doc. Id: EDUCAIR_WP7_D7_V3
Doc. Title: Deliverable7.11 Doc. Version: Final
Contract:284899
Date: April 2013
8 Annex I: Education Survey - Graduates who are not working in the
Air Transport and Aeronautics sectors

Contract:284899
Authors: Reis, Macário, Ribeiro
Partner Responsible: IST
Dissemination Level: Public
Date: April 2013
9 Annex II: Students Contacts List
Austria
Institution Contact
University of Vien [email protected] (Course Director)
Belgium
Institution Contact
Un
iver
sity
of L
iège
Ireland
Institution Contact
Un
iver
sity
of L
imer
ick
[email protected] (Course Director)

Doc. Id: EDUCAIR_WP7_D7_V3
Doc. Title: Deliverable7.11 Doc. Version: Final
Contract:284899
Date: April 2013
Institution Contact

Contract:284899
Authors: Reis, Macário, Ribeiro
Partner Responsible: IST
Dissemination Level: Public
Date: April 2013
Institution Contact
thomas@[email protected]
Italy
Institution Contact
Po
lite
cnic
o d
i M
ilan
o
[email protected] (Course Director)

Doc. Id: EDUCAIR_WP7_D7_V3
Doc. Title: Deliverable7.11 Doc. Version: Final
Contract:284899
Date: April 2013
Institution Contact

Contract:284899
Authors: Reis, Macário, Ribeiro
Partner Responsible: IST
Dissemination Level: Public
Date: April 2013
Institution Contact

Doc. Id: EDUCAIR_WP7_D7_V3
Doc. Title: Deliverable7.11 Doc. Version: Final
Contract:284899
Date: April 2013
Institution Contact
Institution Contact
Po
lite
cnic
o d
i To
rin
o
[email protected] (Course Director)

Contract:284899
Authors: Reis, Macário, Ribeiro
Partner Responsible: IST
Dissemination Level: Public
Date: April 2013
Institution Contact

Doc. Id: EDUCAIR_WP7_D7_V3
Doc. Title: Deliverable7.11 Doc. Version: Final
Contract:284899
Date: April 2013
Institution Contact

Contract:284899
Authors: Reis, Macário, Ribeiro
Partner Responsible: IST
Dissemination Level: Public
Date: April 2013
Institution Contact

Doc. Id: EDUCAIR_WP7_D7_V3
Doc. Title: Deliverable7.11 Doc. Version: Final
Contract:284899
Date: April 2013
Institution Contact

Contract:284899
Authors: Reis, Macário, Ribeiro
Partner Responsible: IST
Dissemination Level: Public
Date: April 2013
Institution Contact

Doc. Id: EDUCAIR_WP7_D7_V3
Doc. Title: Deliverable7.11 Doc. Version: Final
Contract:284899
Date: April 2013
Institution Contact

Contract:284899
Authors: Reis, Macário, Ribeiro
Partner Responsible: IST
Dissemination Level: Public
Date: April 2013
Institution Contact
Institution Contact
Un
iver
sitá
di R
om
a
[email protected] (Course Director)

Doc. Id: EDUCAIR_WP7_D7_V3
Doc. Title: Deliverable7.11 Doc. Version: Final
Contract:284899
Date: April 2013
Institution Contact

Contract:284899
Authors: Reis, Macário, Ribeiro
Partner Responsible: IST
Dissemination Level: Public
Date: April 2013
Institution Contact
Institution Contact
Un
iver
sitá
di N
apo
li S
UN
[email protected] (Course Director)

Doc. Id: EDUCAIR_WP7_D7_V3
Doc. Title: Deliverable7.11 Doc. Version: Final
Contract:284899
Date: April 2013
Institution Contact
Institution Contact
Universitá di Bologna [email protected] (Course Director)
France
Institution Contact
Un
iver
sity
of B
ord
eau
x
Institution Contact

Contract:284899
Authors: Reis, Macário, Ribeiro
Partner Responsible: IST
Dissemination Level: Public
Date: April 2013
Institution Contact E
NSM
A
Germany
Institution Contact
ILR
- A
ach
en

Doc. Id: EDUCAIR_WP7_D7_V3
Doc. Title: Deliverable7.11 Doc. Version: Final
Contract:284899
Date: April 2013
Institution Contact
TU
Bra
un
sch
wie
g

Contract:284899
Authors: Reis, Macário, Ribeiro
Partner Responsible: IST
Dissemination Level: Public
Date: April 2013
Institution Contact
Institution Contact
Bremen University
Contact
debicka(at)fh-aachen.de
bullerschen(at)fh-aachen.de
dachwald(at)fh-aachen.de
esch(at)fh-aachen.de
franke(at)fh-aachen.de
funke(at)fh-aachen.de
g.hahn(at)fh-aachen.de
harder(at)fh-aachen.de
havermann(at)fh-aachen.de
janser(at)fh-aachen.de
sprachenzentrum(at)fh-aachen.de
menschig(at)fh-aachen.de
t.vogt(at)fh-aachen.de
wahle(at)fh-aachen.de
Institution Contact
Munchen University [email protected] (Course Director)
Greece
Institution Contact
Un
ive
rsi
ty
of
Pat
ras

Doc. Id: EDUCAIR_WP7_D7_V3
Doc. Title: Deliverable7.11 Doc. Version: Final
Contract:284899
Date: April 2013
Institution Contact

Contract:284899
Authors: Reis, Macário, Ribeiro
Partner Responsible: IST
Dissemination Level: Public
Date: April 2013
Institution Contact
Poland
Institution Contact
Un
iver
sit
y o
f W
arsa
w
[email protected] (Course Director)

Doc. Id: EDUCAIR_WP7_D7_V3
Doc. Title: Deliverable7.11 Doc. Version: Final
Contract:284899
Date: April 2013
Institution Contact

Contract:284899
Authors: Reis, Macário, Ribeiro
Partner Responsible: IST
Dissemination Level: Public
Date: April 2013
Institution Contact
Institution Contact
Rzeszow University [email protected] (Jarosław Sęp - Course
Director)
Portugal
Institution Contact
Inst
itu
to S
up
erio
r T
écn
ico
[email protected] (Course Director)
[email protected] (Course Director)

Doc. Id: EDUCAIR_WP7_D7_V3
Doc. Title: Deliverable7.11 Doc. Version: Final
Contract:284899
Date: April 2013
Institution Contact
Institution Contact
University of Beira Interior
[email protected] (Course Director)
Romania
Institution Contact
Un
iver
sity
of W
arsa
w
[email protected] (Course Director)

Contract:284899
Authors: Reis, Macário, Ribeiro
Partner Responsible: IST
Dissemination Level: Public
Date: April 2013
Institution Contact
Institution Contact
University of Bucharest

Doc. Id: EDUCAIR_WP7_D7_V3
Doc. Title: Deliverable7.11 Doc. Version: Final
Contract:284899
Date: April 2013
Slovakia
Institution Contact T
ech
nic
al
Un
ive
rsit
y K
oši
ce

Contract:284899
Authors: Reis, Macário, Ribeiro
Partner Responsible: IST
Dissemination Level: Public
Date: April 2013
Institution Contact

Doc. Id: EDUCAIR_WP7_D7_V3
Doc. Title: Deliverable7.11 Doc. Version: Final
Contract:284899
Date: April 2013
Institution Contact Ž
ilin
ská
Un
ive
rsit
y
[email protected] (Course Director)
Spain
Institution Contact
Un
iver
sid
ad d
e L
eón

Contract:284899
Authors: Reis, Macário, Ribeiro
Partner Responsible: IST
Dissemination Level: Public
Date: April 2013
Institution Contact
Un
iver
sid
ad d
e V
alen
cia
jaormes @ cst.upv.es
dsalva @ mcm.upv.es
ossana @ upvnet.upv.es
jugarcia @ mcm.upv.es
lnavarro @ mcm.upv.es
iordeig @ mcm.upv.es
joallogi @ upvnet.upv.es
pedpicab @ mot.upv.es
Institution Contact
Un
iver
sid
ad d
e Se
vill
Institution Contact
Un
iver
sid
ad d
e C
atal
un
Sweden
Institution Contact
KT
H

Doc. Id: EDUCAIR_WP7_D7_V3
Doc. Title: Deliverable7.11 Doc. Version: Final
Contract:284899
Date: April 2013
Institution Contact
UK
Institution Contact
Un
iver
sity
of B
ath
Institution Contact
Un
iver
sity
of
Per
th
[email protected] (Course Director)

Contract:284899
Authors: Reis, Macário, Ribeiro
Partner Responsible: IST
Dissemination Level: Public
Date: April 2013
Institution Contact
Un
iver
sity
of
Man
ches
ter
[email protected] (Course Director)

Doc. Id: EDUCAIR_WP7_D7_V3
Doc. Title: Deliverable7.11 Doc. Version: Final
Contract:284899
Date: April 2013
Institution Contact
Institution Contact
Qu
een
's U
niv
ersi
ty
[email protected] (Course Director)

Contract:284899
Authors: Reis, Macário, Ribeiro
Partner Responsible: IST
Dissemination Level: Public
Date: April 2013
Institution Contact
Institution Contact
Un
iver
sity
of
Shef
fiel
d
[email protected] (Course Director)

Doc. Id: EDUCAIR_WP7_D7_V3
Doc. Title: Deliverable7.11 Doc. Version: Final
Contract:284899
Date: April 2013
Institution Contact
Institution Contact
Un
iver
sity
of B
rist
ol
[email protected] (Course Director)

Contract:284899
Authors: Reis, Macário, Ribeiro
Partner Responsible: IST
Dissemination Level: Public
Date: April 2013
Institution Contact

Doc. Id: EDUCAIR_WP7_D7_V3
Doc. Title: Deliverable7.11 Doc. Version: Final
Contract:284899
Date: April 2013
Institution Contact