asrec goncalves
Upload: united-nations-university-world-institute-for-development-economics-research
Post on 14-Apr-2017
116 views
TRANSCRIPT

AFFIRMATIVE ACTION AND EFFORT CHOICE:AN EXPERIMENTAL INVESTIGATION
Juliana Silva-Goncalves
WZB Berlin Social Science Center
ASREC Europe Conference
Copenhagen, May 2016

MOTIVATION
I Persistent disparity in education and/or labour market outcomesbetween different social groups in both developed and developingcountries
◦ Ethnicity◦ Religion◦ Gender
I In Australia there are sizeable and systematic differencesbetween indigenous and non-indigenous people
I Closing the gap is a national public policy priority

MOTIVATION: AFFIRMATIVE ACTION
I Affirmative action (AA) has been used as a policy tool to addresssuch inequalities
I Typically AA gives preferential treatment to specific social groupsto compensate for their disadvantaged trajectory, influenced bysocioeco background, historical discrimination and stereotypes
I The goal of AA is to sustainably attenuate inequality betweendifferent social groups and stereotypes
◦ By changing beliefs of the disadvantaged groups wrt theireducation and labour market options, thereby, increasinginvestment in education
◦ By changing society’s beliefs wrt to relevant traits ofdisadvantaged groups through exposure to members of suchgroups

MOTIVATION
Despite its popularity, it is still debated if AA
I Increases effort (e.g. education investment) of the disadvantagedgroups attenuating the potential gap in skills and stereotypes
Or
I By inducing lower standards, reinforces differences in skills andstereotypes (see Coate and Loury, 1993)

THIS STUDY
I Lab experiment in disadvantaged high schools with a highrepresentation of indigenous Australians (between 7% and 27%vs a national average of 7%)
I Students perform an effort-based task in a competitive settingand with monetary incentives
I AA is introduce by giving a starting advantage (positive handicap)to those in the bottom 3rd of the performance distribution
I Overall, AA◦ Increases effort at the task of those that the rule aims to favour◦ Does not discourage effort of those who are not benefited (but
indirectly penalised) by the policy

EXPERIMENTAL LITERATURE
I Lab experiments are an important tool to study the incentiveeffects of AA
◦ Such policies are often adopted endogenously, challenging theinterpretation of its causal effects by means of observational data
◦ It is very unlikely that it will be possible to conduct fieldexperiments, with a valid counterfactual (Falk and Heckman, 2009)
I To increase external validity, a few lab studies use real-effort tasksand introduce AA based on real stereotypes/asymmetry in skills

EXPERIMENTAL LITERATURE
I Competitive settingI Niederle et al. (2013) and Balafoutas and Sutter (2012) focus on
the gender gap in competitive preferences◦ Use a real-effort task (simple calculations)◦ Show that AA in favour of women attenuates the gender gap in
tournament entryI Dulleck et al. (2015) base the experimental design on the real
stereotype and differences in skills in math between Australia andChinese students
◦ Cross-country experiment in Australia and in China◦ Participants perform a math task in mixed ethnic groups◦ Show that AA in favour of Australian participants does not
influence performance

EXPERIMENTAL LITERATURE
I Calsamiglia et al. (2013) manipulate participants’ experience atsolving a logic-based task (sudoku)
◦ Experiment conducted in primary schools◦ Pair experienced participants with non-experienced participants◦ AA in favour of the unexperienced participants has a positive
impact on performance
I Closely related to my study but◦ Logic-based task vs effort task◦ Participant pool◦ Better external validity and policy implications: persistent social
gradient in education is often associated with lower motivation andeffort in school by socially disadvantaged students

EXPERIMENTAL LITERATURE
I Calsamiglia et al. (2013) manipulate participants’ experience atsolving a logic-based task (sudoku)
◦ Experiment conducted in primary schools◦ Pair experienced participants with non-experienced participants◦ AA in favour of the unexperienced participants has a positive
impact on performanceI Closely related to my study but
◦ Logic-based task vs effort task◦ Participant pool◦ Better external validity and policy implications: persistent social
gradient in education is often associated with lower motivation andeffort in school by socially disadvantaged students

PARTICIPANT POOL
I 263 students enrolled in Year 8 and Year 9 (aged between 13 and15), including 55 indigenous Australians
I 4 public schools with similar and below national averagesocio-educational advantage indicators and relatively largenumbers of indigenous students
I Schools use AA, by partnering with an NGO that regularlyprovides encouragement and learning support for indigenousstudents

TASK
I Real-effort task
How many squares in the grid are shaded?
I Each time that the participant enters an answer, a new gridappears on the computer screen
I Participants perform 2 stages of the same task, each lasting 8minutes

TREATMENTS
Baseline Affirmative action
Stage 1 Participants whose number of correct answers is in thetop 3rd of the distribution get the high piece-rate payment($0.15). All the others get the low piece-rate payment ($0.05)
Stage 2 As in S1 Participants whose number of correct answersis below the bottom 3rd in S1 receive 15 extrapoints in S2. Participants whose score (num-ber of correct answers + extra points) is in thetop 3rd, receive the high piece-rate paymentfor each correct answer. All the others re-ceive the low piece-rate payment

INSTRUCTIONS
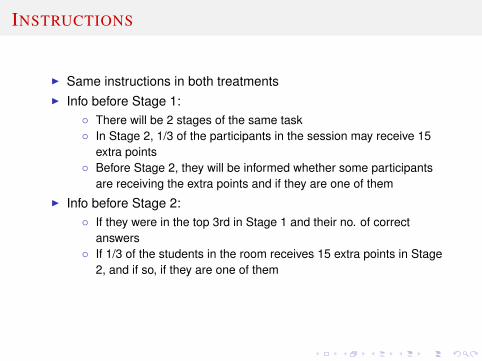
I Same instructions in both treatments
I Info before Stage 1:◦ There will be 2 stages of the same task◦ In Stage 2, 1/3 of the participants in the session may receive 15
extra points◦ Before Stage 2, they will be informed whether some participants
are receiving the extra points and if they are one of themI Info before Stage 2:
◦ If they were in the top 3rd in Stage 1 and their no. of correctanswers
◦ If 1/3 of the students in the room receives 15 extra points in Stage2, and if so, if they are one of them
I After performing in each stage, participants are asked to guesstheir rank (non-incentivized)

INSTRUCTIONS
I Same instructions in both treatmentsI Info before Stage 1:
◦ There will be 2 stages of the same task◦ In Stage 2, 1/3 of the participants in the session may receive 15
extra points◦ Before Stage 2, they will be informed whether some participants
are receiving the extra points and if they are one of them
I Info before Stage 2:◦ If they were in the top 3rd in Stage 1 and their no. of correct
answers◦ If 1/3 of the students in the room receives 15 extra points in Stage
2, and if so, if they are one of them
I After performing in each stage, participants are asked to guesstheir rank (non-incentivized)
INSTRUCTIONS
I Same instructions in both treatmentsI Info before Stage 1:
◦ There will be 2 stages of the same task◦ In Stage 2, 1/3 of the participants in the session may receive 15
extra points◦ Before Stage 2, they will be informed whether some participants
are receiving the extra points and if they are one of themI Info before Stage 2:
◦ If they were in the top 3rd in Stage 1 and their no. of correctanswers
◦ If 1/3 of the students in the room receives 15 extra points in Stage2, and if so, if they are one of them
I After performing in each stage, participants are asked to guesstheir rank (non-incentivized)

INSTRUCTIONS
I Same instructions in both treatmentsI Info before Stage 1:
◦ There will be 2 stages of the same task◦ In Stage 2, 1/3 of the participants in the session may receive 15
extra points◦ Before Stage 2, they will be informed whether some participants
are receiving the extra points and if they are one of themI Info before Stage 2:
◦ If they were in the top 3rd in Stage 1 and their no. of correctanswers
◦ If 1/3 of the students in the room receives 15 extra points in Stage2, and if so, if they are one of them
I After performing in each stage, participants are asked to guesstheir rank (non-incentivized)
RESEARCH QUESTIONS
I Does AA influence effort of the lowest performers?
I Does AA impact the effort of participants who are not targeted byAA, but are indirectly penalised when the lowest performers aregiven a starting advantage?
I Are there efficiency gains/losses from AA?

DESCRIPTION OF PARTICIPANTS’ PERFORMANCE

DESCRIPTION OF PARTICIPANTS’ PERFORMANCE
Stage 1 Stage 2 Differencemean sd mean sd mean sd
Sample: AllBaseline 25.09 6.84 27.50 8.89 2.42*** 5.71Affirmative action 25.10 7.57 28.03 8.39 2.93*** 5.94Difference 0.01 0.53 0.51
Sample: Bottom 3rd in Stage 1Baseline 18.33 4.75 20.00 7.43 1.67 7.12Affirmative action 17.09 5.12 21.26 7.80 4.17*** 7.09Difference -1.24 1.26 2.5*
Sample: Above the bottom 3rd in Stage 1Baseline 28.70 4.71 31.52 6.75 2.82*** 4.80Affirmative action 29.30 4.72 31.57 6.26 2.27*** 5.17Difference 0.60 0.05 -0.55

OLS REGRESSIONS ON PERFORMANCE
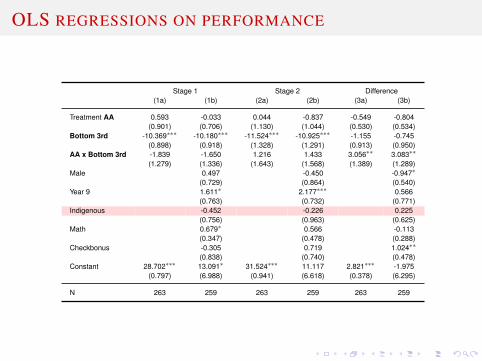
Stage 1 Stage 2 Difference(1a) (1b) (2a) (2b) (3a) (3b)
Treatment AA 0.593 -0.033 0.044 -0.837 -0.549 -0.804(0.901) (0.706) (1.130) (1.044) (0.530) (0.534)
Bottom 3rd -10.369∗∗∗ -10.180∗∗∗ -11.524∗∗∗ -10.925∗∗∗ -1.155 -0.745(0.898) (0.918) (1.328) (1.291) (0.913) (0.950)
AA x Bottom 3rd -1.839 -1.650 1.216 1.433 3.056∗∗ 3.083∗∗
(1.279) (1.336) (1.643) (1.568) (1.389) (1.289)Male 0.497 -0.450 -0.947∗
(0.729) (0.864) (0.540)Year 9 1.611∗ 2.177∗∗∗ 0.566
(0.763) (0.732) (0.771)Indigenous -0.452 -0.226 0.225
(0.756) (0.963) (0.625)Math 0.679∗ 0.566 -0.113
(0.347) (0.478) (0.288)Checkbonus -0.305 0.719 1.024∗∗
(0.838) (0.740) (0.478)Constant 28.702∗∗∗ 13.091∗ 31.524∗∗∗ 11.117 2.821∗∗∗ -1.975
(0.797) (6.988) (0.941) (6.618) (0.378) (6.295)
N 263 259 263 259 263 259
OLS REGRESSIONS ON PERFORMANCE
Stage 1 Stage 2 Difference(1a) (1b) (2a) (2b) (3a) (3b)
Treatment AA 0.593 -0.033 0.044 -0.837 -0.549 -0.804(0.901) (0.706) (1.130) (1.044) (0.530) (0.534)
Bottom 3rd -10.369∗∗∗ -10.180∗∗∗ -11.524∗∗∗ -10.925∗∗∗ -1.155 -0.745(0.898) (0.918) (1.328) (1.291) (0.913) (0.950)
AA x Bottom 3rd -1.839 -1.650 1.216 1.433 3.056∗∗ 3.083∗∗
(1.279) (1.336) (1.643) (1.568) (1.389) (1.289)Male 0.497 -0.450 -0.947∗
(0.729) (0.864) (0.540)Year 9 1.611∗ 2.177∗∗∗ 0.566
(0.763) (0.732) (0.771)Indigenous -0.452 -0.226 0.225
(0.756) (0.963) (0.625)Math 0.679∗ 0.566 -0.113
(0.347) (0.478) (0.288)Checkbonus -0.305 0.719 1.024∗∗
(0.838) (0.740) (0.478)Constant 28.702∗∗∗ 13.091∗ 31.524∗∗∗ 11.117 2.821∗∗∗ -1.975
(0.797) (6.988) (0.941) (6.618) (0.378) (6.295)
N 263 259 263 259 263 259

OLS REGRESSIONS ON EXPECTED RANK
Stage 1 Stage 2 Difference(1a) (1b) (2a) (2b) (3a) (3b)
Treatment AA -0.031 -0.028 -0.010 -0.015 0.023 0.016(0.030) (0.036) (0.031) (0.032) (0.018) (0.020)
Bottom 3rd -0.010 -0.017 0.023 0.012 0.039 0.036(0.044) (0.048) (0.038) (0.041) (0.033) (0.040)
AA x Bottom 3rd -0.019 0.000 0.026 0.045 0.035 0.034(0.056) (0.060) (0.041) (0.045) (0.045) (0.048)
Male -0.020 -0.034 -0.011(0.022) (0.020) (0.024)
Year 9 -0.019 -0.007 0.012(0.032) (0.022) (0.025)
Math 0.020 0.009 -0.013(0.016) (0.011) (0.012)
Indigenous 0.084∗∗∗ 0.087∗∗∗ -0.006(0.025) (0.020) (0.020)
Checkbonus 0.057 0.048 -0.013(0.043) (0.038) (0.023)
Rank in stage 1 0.145∗ 0.143∗
(0.070) (0.070)Rank in stage 2 0.205∗∗∗ 0.213∗∗∗
(0.068) (0.067)Constant 0.279∗∗∗ 0.309 0.279∗∗∗ 0.262 0.032∗∗ -0.001
(0.036) (0.304) (0.038) (0.217) (0.014) (0.238)
N 263 259 263 259 263 259

EFFICIENCY EFFECT: AVERAGE PERFORMANCE IN
STAGE 2
Baseline Affirmative action Diff.
Whole sample 27.50 28.03 0.53Top 3rd 37.15 33.66 - 3.49***Below top 3rd 23.32 25.28 1.96*
SUMMARY
I Investigated how AA impacts performance in a simpleeffort-based task, with a competitive setting and monetaryincentives
I Findings indicate that participants who benefit from AA increasetheir effort in the task
◦ AA increases the gap in performance between the two stages, byapprox. 150% relative to the baseline
I Any potential discouraging effects on those who are indirectlypenalised by affirmative action are small

DISCUSSION
I First study that tests the effect of AA with participants who havevery disadvantaged socioeconomic backgrounds
I Unlike other studies, the task is a pure effort task
I Findings suggest that AA is an effective policy tool to encourageeffort of students who in the absence of the policy would providelower effort
I Thereby it may have the potential to reduce patterns of inequalityin education, where achievement is highly linked to effort
I Even a very strong AA policy in favour of low performing studentsdoes not seem to discourage those above the eligibility threshold

Thank you for your attention!
Questions? Comments?