aspen investor visit port elizabeth site, south africa
TRANSCRIPT

Aspen Investor VisitPort Elizabeth Site,
South Africa
10 May 2011

2
Aspen’s Global Footprint
1. G Durban, South Africa
2. C Cape Town, South Africa
3. C Johannesburg, South Africa
4. M Port Elizabeth, South Africa
5. M East London, South Africa
6. M Toluca, Mexico
7. S Mexico City, Mexico
8. S Caracas, Venezuela
9. S Rio de Janeiro, Brazil
10. M Vittoria, Brazil
11. S Dublin, Ireland
12. M Bad Oldesloe, Germany
13. C Nairobi, Kenya
14. S Kampala, Uganda
15. C Dar es Salaam, Tanzania
16. S Dubai, United Arab Emirates
17. S Grand Bay, Mauritius
18. S Quarry Bay, Hong Kong
19. C Sydney, Australia
20. M Melbourne, Australia
8
9
7
17
16
12
10
6
3
18
11
1315
14
1
192 4
5
C = Combined sales, marketing, distribution and manufacturing centresG = Group headquartersM = Manufacturing centresS = Sales, marketing and distribution centres
20

We remain committed to making a meaningful difference in the health of all those
using Aspen medicines globally, and to increase our contribution to the lives of
people in the many markets we serve across the globe through the manufacture
and supply of high-quality, affordable medicines in a responsible manner.
3
4
Aspen’s Manufacturing Competitive Advantages
Manufacturing capacity and capability is aligned to the Group’s growth strategy
• Aspen’s strength lies in its ability to supply high volumes of products reliably with 4.8 billion tablets beingmanufactured currently
• Manufacturing capabilities at the Port Elizabeth and East London facilities have been rationalised
• Homogenous product types are produced at designated facilities
• Manufacturing capacity in the tabletting can be trebled by 7% increase in the expense base with the additionof only incremental variable costs
• Accreditations received from South African and relevant international authorities
• Sufficient manufacturing capacity exists to produce required volumes for the domestic and internationalmarkets as well to accommodate the introduction of global brands and Sigma products
• Focus on economies of scale - international volumes are being transferred to Port Elizabeth to reducereliance on the public sector volumes
• Effective procurement strategies ensure that materials are purchased at competitive prices
• There is a committed focus on manufacturing efficiency projects – benefits have already been realised, andinitiatives are already in progress to conserve energy and environmental management
Our world class South African Operations team has created Aspen’s sustainably efficient and competitive manufacturing platform

5
Evolution of Aspen’s Manufacturing Base• Aspen General Facility has been on the present site for approximately 70 years
• Acquired by Aspen from South African Druggists in March 1999, together with facilities in East London andJohannesburg
• Mainly supplied the South African market
• Within 12 years, Aspen has transformed from being a domestically accredited supplier to an internationalpharmaceutical manufacturer with the developed capability to supply various dosage forms to anypharmaceutical market in the world
• In the last 5 years, more than R2 billion has been invested in the Group’s South African facilities forinfrastructural expansion and enhancements to improve compliance to the relevant regulatory standards, andin order to support Aspen’s sustained supply to both its domestic and diverse international markets
• More than 2700 people are permanently employed at Aspen’s Port Elizabeth, East London and Nutritionalsmanufacturing facilities
6
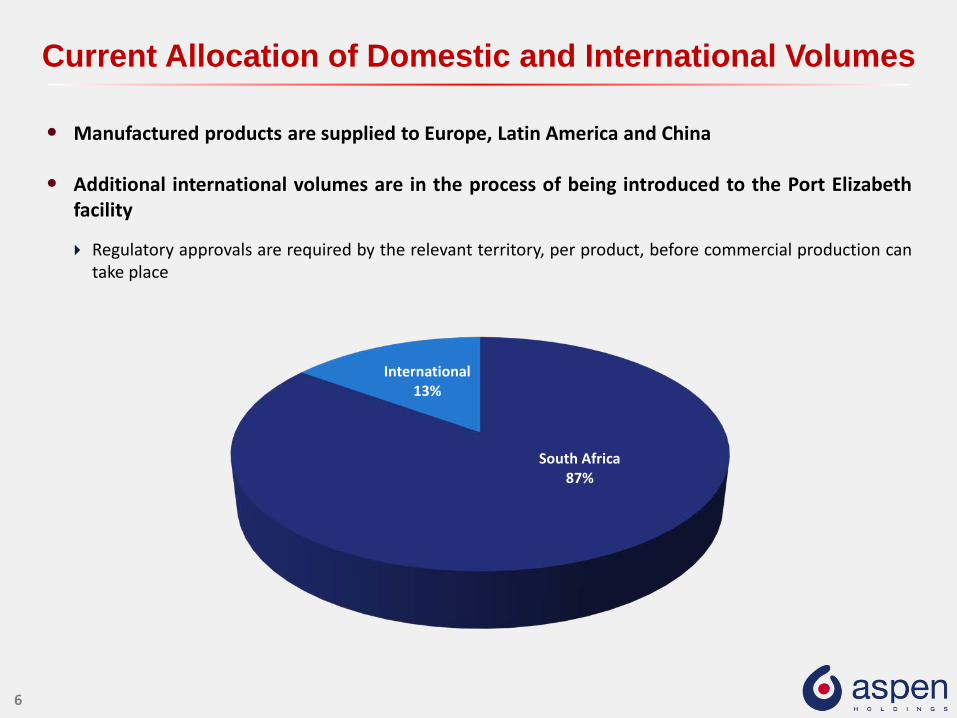
Current Allocation of Domestic and International Volumes
South Africa87%
International13%
• Manufactured products are supplied to Europe, Latin America and China
• Additional international volumes are in the process of being introduced to the Port Elizabethfacility
Regulatory approvals are required by the relevant territory, per product, before commercial production cantake place

Boehringer Ingelheim
Nevirapine
GSK Lamivudine, Zidovudine, Combivir, Epivir & Others
BMS Stavudine, Didanosine, Atazanavir
Gilead Tenofovir & Emtricitabine
MSD Efavirenz
Iroko Aldomet and Indocid
Eli Lilly Cycloserine and Capreomycin
Bayer Nur- Isterate Injection
Prestige Brands
Murine & Murine PlusRange of Eye Drop Products
Strategic Manufacturing Partnerships
7
8
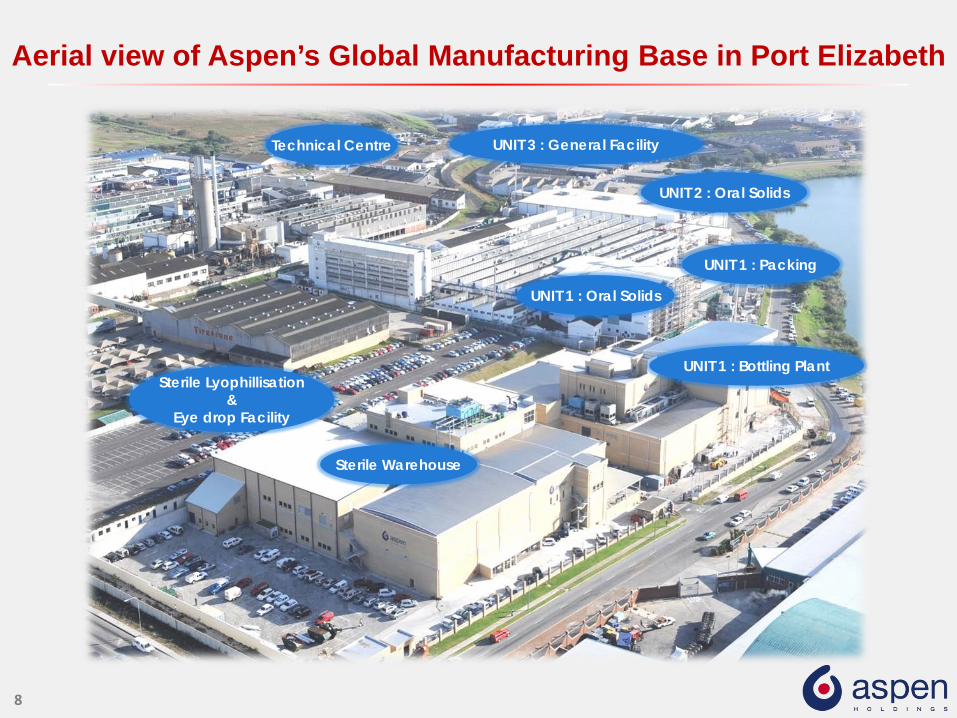
Aerial view of Aspen’s Global Manufacturing Base in Port Elizabeth
UNIT 3 : General Facility
UNIT 2 : Oral Solids
Sterile Lyophillisation&
Eye drop Facility
UNIT 1 : Oral Solids
Technical Centre
UNIT 1 : Bottling Plant
Sterile Warehouse
UNIT 1 : Packing

9
Regulatory Authorities Relevant to South African Operations
RegulatoryAuthority
Unit 1 Unit 2 Unit 3 SVP MP SVP HP East London ADC ACW
MCC X X X X X X X X
FDA X # # # X
MHRA X # # # X
WHO X # # # X
TGA X # # # X
Anvisa (Brazil) X # # # X
High volume solid manufacturing for
domestic and exportmarkets
Small to medium volume solid
manufacturing for domestic and export
markets: fluid-bed dried products (2A) &oven dried products
(2B)
End state solid
packing for
domestic market
Eye drops, lyophilized
vials fordomestic
and exportmarkets
High potency (incl. hormonal)injectables fordomestic and
export markets
Semi-solids, liquids and oral contraceptives for domestic
market
Warehousing for domestic and export
markets
Warehousing for domestic
market
x = Approved# = Inspection planned
10
Strategic Rationalisation Initiatives
Significant efficiencies and cost reductions have been realised through the consolidation of thePort Elizabeth site management systems:
• Site management and facilities support functions have been consolidated under a singlemanagement structure Historically two separate entities with individual management structures Significant rationalisation of redundant costs
• Consolidation of engineering stores and warehouse management systems Integrated site stock management systems and hence focussed working capital management
• Consolidation of ERP systems for all facilities into a single Baan system Provides access to a single reporting platform Facilitates focussed review, analysis and stratification of site information Assists with effective optimisation of resources and capability
• Consolidation of the purchasing systems Reduced number of purchase orders Lower average purchase price per order due to combined volumes Reduced number of lab tests required on incoming materials due to purchase order rationalisation

11
Unit 1 – Oral Solid Dosage Facility
• In 2005, an investment was made in the construction of an FDA-approved facility in response tothe HIV/AIDS pandemic in Africa
• High volume production of tablets and capsules
• The facility was successfully re-inspected by FDA, MRHA and WHO in 2010
No major findings reported
• Unit 1 currently manufactures 2.8 billion tablets
• A granulation capacity expansion project to the value of R178 million is nearing completion(first suite in operation, with second and third suites in final stages)
This will more double current granulation capacity to increase tabletting capacity

12
Unit 2 – Oral Solid Dosage Facility
Unit 2
• 2.0 billion tablets are manufactured in this area• Total capacity = 3 billion tablets
Part 2A – Fluid Bed Dried (FBD) products
• Small to medium volume solids production for selected regulated markets• Reformulated products and investment in new equipment• Improved process flow and hence more efficient manufacturing process• Increased automation and improved yields• Reduction in conversion costs• 96 tabletted products have been transferred into Unit 2A; 40 products will be transferred by July 2011
Part 2B – Oven dried products
• Small volume solids production for selected regulated markets• Investment in new equipment• Increased automation and improved yields• 6 products have been transferred into Unit 2B• 61 products remain to be transferred by April 2012

13
Unit 3 – General Facility
• A phased process for the transfer of products to Unit 1 and Unit 2 is in progress
• Bulk tablet manufacturing at Unit 3 will be decommissioned by end June 2011
• Semi-solids (creams, ointments and suppositories) and Liquid Lennon DutchMedicines have been transferred to East London
• Packing for the local market remains in this area

14
Flow Diagram of the Tabletting Processes
Dispensing
Blending
Fluidised Bed Dryer
Coating / Capsule fill
Compression Packaging
Magnesium Stearate
Granulation
Sieving
Sieving
Air
Air
Scale

15
Focus on Continuous Improvement Initiatives
Introduction of the Fluid Bed Drying Process
• The older oven drying technology
Wet granule obtained during tablet manufacture is dried by spreading materials onto trays inside an oven Process time is relatively long, requiring an average of 8 - 16 hour drying time
• The newer FBD technology
Wet granule obtained during tablet manufacture is sieved into a drying chamber and hot air is passed
through the chamber at relatively high speeds, resulting in fluidisation of the granule
Faster process, requiring 2 - 3 hour drying time
• All key and high volume products have been reformulated and are now manufactured in thisarea
Impact: The benefits of this technology have been extracted and improvements in manufacturing and cost efficiencies have been realised

16
Focus on Continuous Improvement Initiatives
• Doubling of batch sizes to reduce set-up time between batches and thereby optimiseequipment utilisation
All Unit 1 manufactured and all Unit 1/3 packed products completed Unit 2 manufactured products in progress
Impact: Reduction of total annual set up time by 50%
• Automation of end-of-line packing to match the increased rate of manufactured output /manual packing processes transferred to automated equipment
Blister and bottle packing completed, and patient ready packing nearing completion Further projects targeted
Impact: 30% Output improvement in patient-ready packs with a reduction in temporary staff
• Modification of batch manufacturing records to improve process documentation flow andmove to Electronic Batch Documentation has been initiated
Impact: Expected reduction in administration time and headcount
• Barcode inventory management system introduced in warehousing and now being rolled out toproduction management
Impact: 16% Reduction in headcount achieved to date

17
Focus on Continuous Improvement Initiatives
• Barcode status labelling of materials implemented to reduce handling activities
Impact: More efficient process through an instantaneous scanning process. Reduction in labellingtime - manual capturing and labelling change used take up to one shift
• Evaluation of shared packing tooling in progress
Impact: Will reduce set-up and changeover time significantly to unlock additional capacity
• Re-evaluation of automated (new IBC wash-station) and manual cleaning activities (additionalwash-bays at place-of-work and transfer trolleys) in progress
Impact: Will reduce cleaning times to unlock additional capacity
• Evaluation of compression set-up and run-rate parameters proceeding well
Impact: Increases in run rates of 20% achieved in Unit 1

18
In-house Manufacturing Cost Analysis
Labour58%
Electricity7%
Depreciation17%
Other18%
Allocation of Conversion costsMaterials cost64%
Conversion costs36%
Allocation of Production Costs (including ARV’s)
Materials cost53%
Conversion costs47%
Allocation of Production Costs ( excluding ARV’s)

19
Impact of Continuous Improvement on Recoveries
2007 2008 2009 2010
+120%
+78%
+39%Unit 1 Recoveries

20
Prospects in Solids Manufacturing at the Port Elizabeth Site
• The redundant areas in Unit 3 will be converted into specialised manufacturing areas including
High potency suite (HPS) Toxic suite (TS)
• Following approval of the final design, construction of the HPS and TS will commence in the 2012 year
High potency and toxic products both require contained manufacturing areas with the air handling and employee health, safety and protective clothing requirements being more stringent in a toxic manufacturing area
• Approximately 4 billion tablets will be transferred into Unit 1, 2, HPS and TS including
Selected global brands from Europe Selected products from Sigma
• Transfer of these products to Port Elizabeth will almost double manufactured volumes to 8.8 billion tablets (currently 4.8 billion tablets are produced in Unit 1 and 2)
Economies of scale will be further improved The additional volumes will be added with only 50% of incremental variable costs being added. The fixed
cost base will remain unchanged

21
East London Site
An employee in the Oral Contraceptives facility wearing the necessary protective clothing
Oral Contraceptives
General Manufacture
API Store
Aerial view of East London plant
22
East London Multi-Purpose Site
General Facility
• Highly flexible, small volume, niche, solids manufacture, including low dose drugs
• Significant investment has been made into upgrading the East London facility for themanufacture of semi-solids and Dutch medicines
Oral Contraceptive Facility
• The Oral Contraceptive Facility provides a contained manufacturing area for the productionof high volume oral contraceptives for the public and private sector

23
The Steriles Facility
• Project commenced in 2007, presenting challenging complexities of design, technology,technical compliance requirements and specialist skills
• Specialist facility for the manufacture of eye drops, lyophilised vials and sterile injectables,including hormonal vials and ampoules (a niche capability to supply female contraceptivesand HRT products)
• The facility commenced with the production of eye drops for the US market in July 2009
• The lyophilised vials area was commercialised in September 2010
• Approved by the MCC for the manufacture of sterile eye drops and lyophilised vials, withWHO approval for Capreomycin being targeted
• Export certificates were granted by the FDA and MCC for the supply of eye drops into the USA
• The sterile facility represents a niche and complex manufacturing
24
Steriles Facility – Multi-Product SuiteLines 1 and 2
• High volume eye drops with an annual capacity of 42 million units
• Close to 30 million units being exported to US and Canada under a manufacturing contract withPrestige Brands
• Aspen’s Eye Gene range has been introduced; remaining Aspen range of eye drops, i.e. SafyrBleu and Oculerge in progress
Line 3
• Lypophilised vials have been introduced into this area, starting with Capreomycin, a product forMDR TB
Vancomycin, Clarithromycin and other lyophilised products will be introduced in 2011
• Capacity for lyophilised vials is approximately 2.4 million units
• Additional capacity exists for 2.9 million liquid filled vials
Vitamin B Co, Vitamin B12 and Thiamine liquid filled vials are currently being introduced
• Additional space exists to cater for the introduction of further capabilities - an engineering anddesign feasibility study has been completed

25
Steriles Facility – High Potency SuiteLine 4
• High volume ampoule filling capability for hormonal injectables - a niche capability for filling andpacking oily solutions which is very relevant to emerging markets
Validation batches of Bayer Nur-Isterate are scheduled for 2011
• Aspen’s Lenasone, Betanoid and Decasone are currently being introduced. The MCC have beeninvited to inspect and approve this area of the facility, where after full commercial production willcommence
• Annual capacity for 30 million ampoules
Line 5
• High volume vial filling capability for hormonal injectables - a unique aseptic suspension fillingcapability
• Aspen’s Medroxyprogesterone is envisaged to be manufactured for SA, emerging markets andWHO territories; a global formulation is being developed for world wide supply
• Offtake initially forecast at 20 million vials, annual capacity for vial filling of approximately 45million units
• Application has recently been made to MCC for inspection of this area in order to facilitatecommercial production

26
Procurement Initiatives
• Comprehensive understanding of products / materials, driving factors and market factors
• Ability to effectively benchmark product prices, quality and supplier service to ensure that weare procuring optimally
• Longstanding relationships have been established with international API and packagingsuppliers
• Ability to source competitively from developing markets
• Only reputed and validated suppliers are approved for use
• Alternate suppliers are in place to mitigate supply risk and leverage pricing

27
Allocation of Procurement Currencies
USD61%
ZAR33%
EUR5%
Other1%
• Most API’s and excipients are purchased mainly from Asia:
India China
• Packaging materials are largely purchased from South African suppliers
• Aspen received an A-rating from Empowerdex in the preferential procurement category

28
Training and Development• 140 new/ongoing 2010/11 Learnerships are in place, covering
the fields of Business Administration, Equipment Setting andOperation, Safety Controls, Pharmaceutical Controls, etc.
• Additional Laboratory and Warehousing Learnerships are indevelopment for 2011/2012
• 20 additional bursaries have been awarded towards tertiarystudies in 2011
• 4 Pharmacist are receiving internships in 2011
• In 2010, 10 Apprentices as Fitters and 22 learners asPharmacist Assistants were qualified
PMA LEARNERSHIP
ARTISAN APPRENTICESHIP
ABET

29
Environmental Sustainability InitiativesCarbon Footprint
• Sophisticated air handling systems are in place to purify and filter the air discharged from theproduction areas
• Sampling was done in Port Elizabeth and East London for Sulphur Dioxide, Nitrous Oxide, VolatileOrganic Compounds and particulate emissions: quantities were largely undetectable, or else,negligible
• Aspen is participating in a Carbon Disclosure Project, reporting using internationally acceptedgreenhouse gas accounting and reporting standards
Water Conservation
• The Port Elizabeth facility is currently re-using Reverse Osmosis reject water to feed its coolingtowers and ablution facilities, coupled with switching off rotoclones when not in use, the projecthas yielded an average of 8% reduction in monthly water consumption
• East London is reusing cooling water, with a saving of 4% in monthly consumption

30
Environmental Sustainability Initiatives
Conservation of Electricity
• A target of 4% reduction in monthly energy consumption has been achieved through theinstallation of energy saving lighting in Liquids and Solids packing areas, and installation oflighting-off motion detectors across Port Elizabeth Administration Office Sites
• East London has achieved a 1% reduction in electricity consumption through installation of energy saving lights in the warehouses
• A feasibility study is in progress to evaluate the possibilities of generating and making use of alternative renewable energy sources

31
Social Sustainability Initiatives
• We have secured job security for our permanent employees despite recessionary pressures facingmanufacturers in South Africa
• No permanent employees were made redundant by the implementedcontinuous improvement initiatives
• The Disabling Frequency Ratio of 0.63 against a tolerance of1.00 demonstrates the effectiveness of safety standards at the facility
• More than 950 employees participated in the 2010 voluntary HIV/AIDS testing and counselling programme
5% were HIV positive and are receiving the necessary treatment and support
• In addition to extensive on-the-job procedural and technical trainingthat all staff receive in all aspects of operation, including GMP, SOPsand equipment operation, more than 10% of all Operationsemployees received external, specialised skills training in thesix months to December 2010

32
Risks and Challenges
• Realisation of awarded public sector volumes
Mitigation: International volumes are being introduced to Port Elizabeth
• Impact of inflation and currency movements on cost of goods
Mitigation: Benefits from continuous improvement initiatives and effective procurementstrategies are being realised
• Shortage of scarce skills – pharmacists and artisan
Mitigation: Pharmacists retention programmes are in place, and investment is made inlearnership programmes for assistance pharmacists and apprenticeships for artisans
• Increased competition from foreign suppliers
Mitigation: Cost of goods are benchmarked against international prices Aspen’s successful performance in the recent ARV tender demonstrates competitiveness Aspen has proven to be a reliable supplier Significant investment has been made in creating flexible and diverse manufacturing capability to respond
to current and future requirements

Generics Bulletin Report : May 2010
Aspen incl Sigma (17,18, 19)
0 1 000 2 000 3 000 4 000 5 000 6 000 7 000 8 000 9 000 10 000 11 000 12 000 13 000 14 000
Orchid(15, 27)Strides(15)
ImpaxTaro
Adcock(18, 24,25)Torrent(10,15)Towa(10, 25)
Glenmark(15,20)Biocon(10,15)Sawai(10,25)
Egis(23,24)Hikma
Aurobindo(15,20)Pharmastandard(21,22)
Zylus Cadila(10,15)Wockhardt(15)
Sun(15,20)Lupin(10,15)
Orion(4)Par
Alapis(4,16)Cipla(10,15)
Covidien(13,14)Krka(4)
Gideon Richter(4)Sanofi[Winthrop] (4,12)Fresenius Kabi (4,11,12)
RanbaxyDr Reddy(10,15)
Greenstone[Pfizer](9)
Perrigo(7,8)Hospira(6)
Stada(4)Watson(3)
Mylan(2)Sandoz
Teva [incl Ratiopharm] (1,4,5)
Generics API's Brands OtherTurnover (USD'millions)
(1) Sales exclude Ratiopharm; brand sales include Copaxone sales of USD2.83 million(2) Generics sales growth was 9.2%(3) Includes Arrow from December 2009(4) Reported in Euros, converted at EUR1=USD1.4(5) Excludes Mepha, which was sold separately to Cephalon for about USD600million(6) Speciality injectable sales only(7) Financial year end 27 June 2009(8) Includes OTC sales of USD1.64 billion(9) IMS Health figures for US only(10) Financial year end 31 March 2010(11) Injectables sales only(12) Organic growth quoted(13) Speciality Pharma and API sales only(14) Financial year ended 25 September 2009(15) Reported in Indian rupees; converted at USD1 =Rs45(16) Human health sales only, including brands distributed for third parties(17) Financial year end 30 June 2009(18) Reported in South African rand; converted at USD1 = R7.5(19) Transaction completed 31 January 2011. Reported Sigma sales to financial year end
31 January 2010, converted at USD1=AUD1(20) Fourth quarter of 2009-9 plus nine months of 2009-2010(21) Reported in Russian roubles; converted at USD1=RUR30(22) Includes OTC sales of USD 493 million(23) Reported in Hungarian forints; converted at USD1=Huf190(24) Financial year to September 2009(25) Reported in Japanese yen; converted at USD1=Y92(26) Pharmaceutical sales only, including OTC sales of USD 172 million(27) Financial year to 21 March 2009
Figures have been quoted for 2009 calendar year wherever possible, showing growth compared with previous year. Results not reported in dollars have been converted at the rates shown, but growth figures are as reported.
Business breakdowns are mostly according to companies' own definitions (Source - Company reports)
33