askari financials 2012
TRANSCRIPT

Annual Report for the year ended December 31, 2012

In today’s challenging environment, we face unprecedented uncertainties across a range of issues. Yet, we still believe that real success lies in always moving ahead; in the relentless pursuit of solutions.
At Askari Bank, we believe in leading the way forward. Our fundamental aim is to integrate our offerings with the changing lifestyles of our valued customers – so that we can better assist in their banking needs and also help in shaping their future.
On our cover this year, we express our long-standing conviction – of thinking ahead and banking forward.
Cover Concept

02 21 Years of Banking
04 Vision & Mission
06 Our Thinking
08 Products & Services
12 Corporate Philosophy
16 Corporate Information
17 Entity Ratings
18 Directors’ Profile
22 Board Committees
24 Management Committees
26 Notice of 21st Annual General Meeting
28 Management
29 Organogram
30 Corporate Social Responsibility
32 President’s Message
34 Value Added Statement
35 Our Network
36 Financial Review
38 Financial Calendar
39 Share & Debt Information
40 Horizontal & Vertical Analysis
44 Six Years’ Performance
46 Directors’ Report to the Shareholders
Unconsolidated Financial Statements of Askari Bank Limited
63 Statement of Compliance
65 Review Report to the Members
66 Auditors’ Report to the Members
68 Unconsolidated Statement of Financial Position
69 Unconsolidated Profit and Loss Account
70 Unconsolidated Statement of Comprehensive Income
71 Unconsolidated Cash Flow Statement
72 Unconsolidated Statement of Changes in Equity
73 Notes to the Unconsolidated Financial
Statements
Contents
Consolidated Financial Statements of Askari Bank Limited and its Subsidiaries
131 Auditors’ Report to the Members
132 Consolidated Statement of Financial Position
133 Consolidated Profit and Loss Account
134 Consolidated Statement of Comprehensive Income
135 Consolidated Cash Flow Statement
136 Consolidated Statement of Changes in Equity
137 Notes to the Consolidated Financial Statements
189 Pattern of Shareholding
190 Correspondent Network
192 Statement of Financial Position in US Dollars
193 Profit and Loss Account in US Dollars
194 Glossary of Financial & Banking Terms
197 Form of Proxy
1
Annual Report of Askari Bank Limited for 2012

21 years of banking
2

Askari Bank was incorporated in Pakistan on October 9, 1991, as a public
limited company. It commenced operations on April 1, 1992, and is
principally engaged in the business of banking, as defined in the Banking
Companies Ordinance, 1962. The Bank is listed on Karachi, Lahore and
Islamabad Stock Exchanges.
Askari Bank has since expanded into a network of 261 branches / sub-
branches, including 34 dedicated Islamic banking branches, and a wholesale
bank branch in Bahrain.
A shared network of 5,903 online ATMs covering all major cities in Pakistan
supports the delivery channels for customer service. As at December 31,
2012, the Bank had equity of Rs. 19.7 billion and total assets of Rs. 353
billion, with 907,984 banking customers, serviced by our 5,597 employees.
Askari Investment Management Limited and Askari Securities Limited are
subsidiaries of Askari Bank engaged in managing mutual funds and share
brokerage, respectively.
3
Annual Report of Askari Bank Limited for 2012

Vision & Mission
4
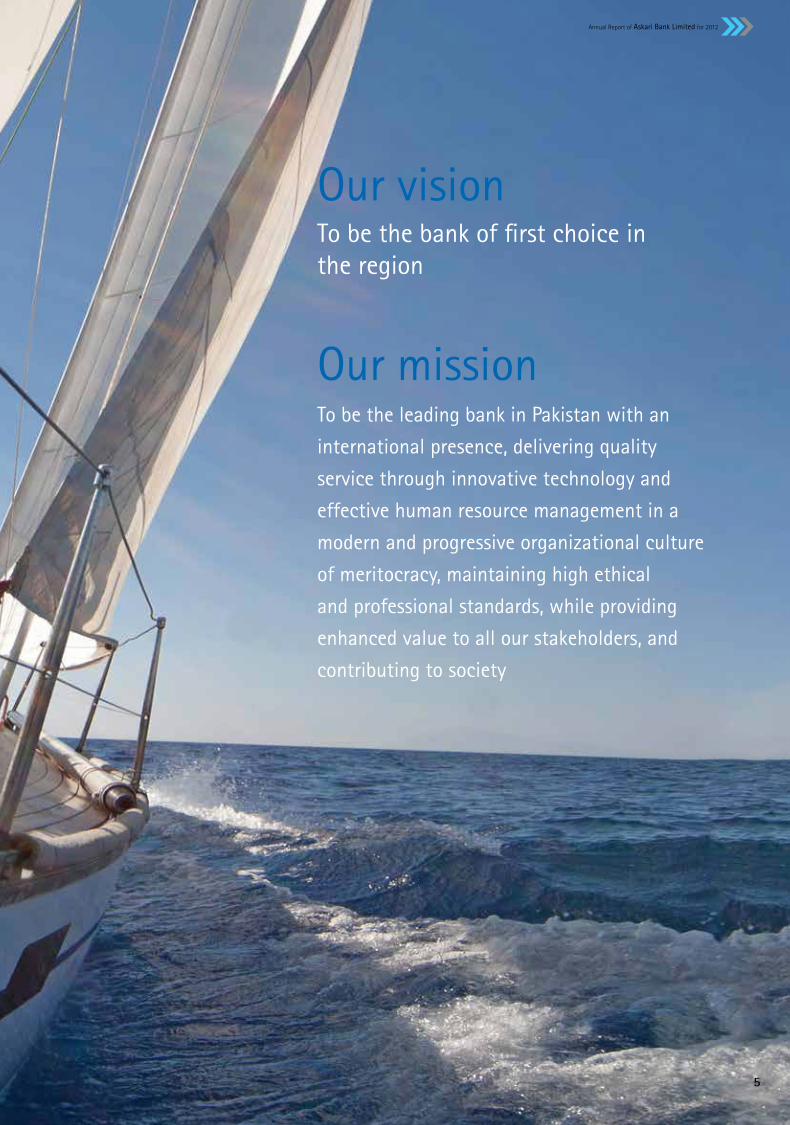
Our missionTo be the leading bank in Pakistan with an
international presence, delivering quality
service through innovative technology and
effective human resource management in a
modern and progressive organizational culture
of meritocracy, maintaining high ethical
and professional standards, while providing
enhanced value to all our stakeholders, and
contributing to society
Our visionTo be the bank of first choice in the region
5
Annual Report of Askari Bank Limited for 2012

Our thinking
Our vision to be the bank of first choice in
the region demands continuous strive for
creation of business opportunities with
innovation while maintaining our core
values to meet our commitment to all our
stakeholders.
The range of our products aims to serve
our diverse customer base that comprises
of corporate, SMEs, individual savers,
households and, farmers. At the same
time, our people are constantly engaged
in assessing customer needs and market
dynamics to realign our products and
priorities to attain brand recognition and
competitive edge. We are continuously
reviewing and reshaping our portfolio of
businesses by investing in higher growth
areas, extending and developing our core
competencies and moving out of weak
and non–core segments.
Technology has played a pivotal role
in meeting customer expectations,
particularly with respect to speed
and quality of service. We have fully
automated transaction–processing
systems for back–office support. Our
branch network is connected on–line
real–time and our customers have access
to off–site as well as on–site ATMs, all
over Pakistan and internationally. Our
phone and internet banking facilities
allow customers to enjoy routine banking
service from anywhere, anytime in the
world. We also pioneered an e–commerce
venture in Pakistan. Our mobile ATMs are
the first in Pakistan.
To further strengthen and enhance
our technology platform, the Bank is
in final stages of replacing the existing
technology with a comprehensive state-
of- the-art technology solutions. Upon
complete implementation; will greatly
improve our product delivery and service
abilities.
Our values
Integrity is the most valued standard in
whatever we do. We understand that our
commitment to satisfy customers’ needs
must be fulfilled within a professional
and ethical framework. We subscribe to
a culture of high ethical standards, based
on the development of right attitudes.
The intrinsic values, which are the corner
stones of our corporate behaviour, are:
• Commitment
• Integrity
• Fairness
• Teamwork
• Service
Commitment
CustomersPassionate about our custom-
ers’ success, delighting them
with the quality of our service
Fairness
RegulatorsExemplary compliance, gov-
ernance and business ethics
Integrity
InvestorsA distinctive investment,
delivering outstanding perfor-
mance, return and value
6

Teamwork
EmployeesCaring for our people and
helping them to grow
Service
CommunitiesDedication towards social de-
velopment and improvement
in quality of life
Our customers
Knowing our customers and their needs
is the key to our business success. Our
products and services are as diverse
as our market segments. Our client
relationship managers are well equipped
and well trained to provide the most
efficient and personalized service to the
customers. Askari Bank is proud of its
pioneering role in providing the most
modern and technologically advanced
services to its 907,984 relationships.
Our investors
We believe that the bottom line of any
business is creating shareholder value.
To gain their trust and confidence, we
believe in providing our investors timely,
regular and reliable information on our
activities, structure, financial situation,
and performance.
Our regulators
We firmly believe in regulatory discipline
and harmony of our corporate objectives
with regulatory framework. Our business
methodologies are designed to ensure
compliance with the directives of all our
regulators.
Our employees
We strongly believe that the interests
of the Bank and the employees are
inseparable. At Askari we try to create a
‘we’ culture where there is mutual trust
and respect for each other. We encourage
ownership behaviour so that everyone
feels responsible for the performance
and reputation of the Bank. We are
committed to develop and enhance each
employee’s skills and capabilities through
extensive in–house and external training
programs and job rotations. In order to
ensure meritocracy, our appraisal system
is purely performance based.
Our communities
We fully recognize our corporate social
responsibility and our contributions to
different areas of the social sector are
aimed to help improve the quality of life
in our country.
7
Annual Report of Askari Bank Limited for 2012

Products & ServicesBranch BankingThrough a branch network in major cities, towns and cantonments, made up of conventional, corporate, consumer, Islamic, as well as agricultural banking service branches, we aim to provide our customers with a wide array of offerings catering to their banking needs.
Mahana Bachat
Askari Mahana Bachat Account is a term deposit designed for individuals with a short to medium term investment appetite. It offers customers the option of investing for one and to three years tenures and has been designed keeping in view savings needs of customers who want profit on a monthly basis. With competitive rates of return paid monthly on the 1st of every month and the option of getting a financing facility of up to 90
percent, Askari Mahana Bachat Account caters to customers saving needs without blocking their funds for a longer duration.
Paishgi Munafa
Askari Paishgi Munafa Account is a unique term deposit designed to meet the immediate financial needs of individual investors / savers who want to invest their funds for a medium term. The most significant feature of this product is that the customer receives the entire profit upfront at the time of placing the deposit in a way that the investors / savers can fulfill their financial needs of today without depleting their savings.
Value Plus Deposit
Askari Value Plus Rupee Deposit Account offers value and flexibility. This product promises greater financial freedom
and security with matching flexibility. Now customers can open a “Value Plus Account” while enjoying the features of a normal checking account.
Current Account
Current accounts cater to the variety of financial needs of our diverse customer base with added benefits of free ATM card, cheque book, issue of demand drafts / pay-orders and much more. These products include value plus current accounts, basic account with no minimum balance requirement.
Savings Account
A range of saving accounts offered by the Bank to both individual and institutional customers include Askari Special Deposit, Value Plus Savings besides normal saving account based on profit and loss
8

sharing basis. Askari saving deposits offer attractive features and competitive returns and certain flexibility similar to current accounts.
Investment Certificates
Askari Bank’s Investment Certificates provide the added security, investment and monthly return to the customers. These certificates are negotiable and can be transferred to third parties. Investment Certificates are available for a three month period and profit is payable on a monthly basis through preprinted tear-off coupons.
Rupee Traveler Cheques
Askari Bank offers customers a widely accepted ‘Rupee Traveler Cheques’, which eliminates all financial risks while traveling. It is a safe and secure way to make payments nation-wide.
Bancassurance
The Bank offers innovative banking solutions with a touch of insurance in it by fusion of banking, wealth management and insurance products. In partnership with Eastern Federal Union (EFU) Life, the Bank offers its customers with value added life insurance and wealth management products tailored to suit their long term financial requirements and protection plans through select branches. As an extended feature of bancassurance, the Bank has also pioneered a co-branded credit card ‘Askari EFU Life co-Brand Credit Card’. This feature offers benefits such as cash back facility, standing charge option, reward points for each retail transaction conducted and much more.
Corporate & Investment BankingAt Askari, we understand the unique business requirements of our corporate and institutional clients, and accordingly the Bank’s Corporate and Investment Banking Group (CIBG) strives to meet their expectations through provision of customized and relationship based banking approach.
Corporate Banking
Corporate Banking works on a long-term relationship based business model to provide a single point within the Bank for meeting all business requirements of its corporate and institutional customers, including public sector enterprises, with the primary objective of enhancing customer service. Dedicated relationship managers for each of our corporate client ensure customer satisfaction, which remains top priority. Our relationship oriented outlook focuses upon providing a complete array of tailored financing solutions, that are practical and cost effective, some of which include:
• Working Capital Facilities
• Term Loans
• Structured Trade Finance Facilities
• Letters of Guarantee
• Letters of Credit
• Fund Transfers / Remittances
• Bill Discounting
• Export Financing
• Receivable Discounting
Investment Banking
Investment Banking focuses on origination and execution of a range of financial advisory and capital raising services to corporate and institutional clients as well as actively managing the Bank’s proprietary investments in the local equity and debt markets. Investment Banking offers various and tailored financial solutions including debt syndications, project finance and advisory services, debt placements through capital markets as well as structured trade finance facilities. Whether a company is seeking to access the local or cross border syndications and debt capital markets, project financing needs, advisory services related to M&A or the local equity capital markets for raising capital, Askari Bank’s Investment Banking is well positioned to provide due assistance. We can create and tailor the right structured solutions for business needs in order to enhance shareholders’ wealth and market competitiveness.
Consumer BankingAskari Bank’s consumer finance is focused on enhancing retail portfolio through new and improved initiatives and products. Special attention is given to business opportunities involving strategic alliances to earn sustainable returns, with greater emphasis on secured form of consumer lending and an aim to increase product offerings while improving and maintaining quality of asset portfolio.
9
Annual Report of Askari Bank Limited for 2012

Agricultural BankingAgricultural banking products and services are specifically designed for Pakistan’s crop farming, other farming and rural business segment. Agricultural Banking products and services, some of which are listed below, offer improved and efficient delivery and control mechanism for meeting increased demand for credit by the farmers in easy, accessible and affordable manner.
• Kissan Ever Green Finance
• Kissan Tractor Finance
• Kissan Livestock Development Finance
• Kissan Farm Mechanization Finance
• Kissan Aabpashi Finance
Islamic BankingWith the help of Shariah advisor and professional bankers, Askari Islamic banking provides Riba free and Shariah Compliant solutions to various customer segments through branch network in major cities of Pakistan. It offers following main products:
Ijarah Vehicle Finance
Ijarah is a rental agreement, under which the usufructs of an asset are transferred to the client on agreed terms and conditions. It is a Shariah compliant mode of finance, adopted by Askari Islamic banking to meet the vehicle financing needs of its Islamic customers.
Home Musharkah
Askari Islamic banking offers Shariah compliant home financing to purchase, construct, improve and transfer of the property under the concept of diminishing musharakah. This means being able to cope with other financial commitment, while still having money left over for extras and unexpected expenses.
Ask4Car
It is a product for vehicle financing for both new and used vehicles at affordable and competitive mark-up, easy processing without any hidden costs.
Personal Finance
With unmatched financing features in terms of loan amount, payback period and most affordable monthly installments, Askari Bank’s personal finance makes sure that the customer gets the most out of their loan; the product tenure ranges from one to five years and is designed primarily for salaried individuals.
Mortgage Finance
Whether our customer plan to construct a house, buy a constructed house, or renovate a house, Askari mortgage finance enables them to pursue their goal without any problems. Mortgage is a premium home financing product for customers belonging to the upper, upper middle and middle income groups, residing in the urban areas of Pakistan.
Visa Debit Card
Askari Visa Debit Card enables customers access to convenient banking services; now you can manage your account, withdraw cash, make purchases and transfer your funds through Askari Visa Debit Card, which also offers the convenience of a credit card without the hassle of monthly bills and interest charges. No minimum balance requirements for issuance or retention of the VISA Debit Card. An eligible customer may apply for any of the debit cards i.e. classic or gold.
Master Credit Card
Askari Bank offers a competitive suite of silver, gold and platinum Master Credit cards focusing on providing superior services, travel privileges, and shopping
Products & Services (Contd.)
pleasures. It also offers reward points and transactional alerts through SMS as enhanced security feature.
Askari Branchless Banking
Jointly with China Mobile Pakistan, Askari Bank launched branchless banking program under the brand name of “Timepey” during 2012.
With this program, banking has become very convenient, easy and secured yet much more efficient. Branchless banking customers enjoy the benefit of sending or receiving funds at anytime and to any place within the country. A wide network of Timepey shops across Pakistan are fully equipped to handle day to day needs of the customers. Under the program, following transactions are currently being handled:
Timepey Money Transfer
Using Timepey Money Transfer, customers can now send and receive money from any Timepey outlet in the most efficient, secure and convenient way. Customers do not need to have a ZONG connection or to have a mobile phone at all. Following funds transfers are catered under this facility:
• Person to Person Funds Transfer• Account To Person Funds Transfer• Account to Account Funds Transfer
Timepey Bill Payment
Timepey account holders and non account holders can pay most of their utility bills through Timepey instantly and without any charges. Just dial *888# from mobile phone without leaving the comfort of your home.
Timepey mobile top-up
With Timepey account customers can purchase prepaid airtime and pay postpaid bills any time anywhere from their own mobile phone. This service is available to Zong customers having a Timepey account.
10

* Above referred products and services are subject to various terms and conditions. Further details about the products listed above or additional offerings of Askari Bank, any of our branches may be contacted at toll free 0800-00078 or our website www.askaribank.com.pk may be visited.
Alternate Delivery Channels
Internet (I.NET) Banking
Askari’s I.Net banking assures convenient banking from the comfort of your home. Now, customers are no longer required to wait in long and worrisome queues to request a financial transaction, 24/7 balance inquiry, statement of accounts, fund transfer, utility bill payment etc.
Call Center
Askari’s Call Center provides a single point of contact for all of its customers, yet offer unique and individualized services on real time information for its time-conscious customers; it is operated 24/7 and service customers for providing information of products and services, handling inquiries, attending requests.
Automated Teller Machine (ATM)
Askari Bank is a member of two electronic ATM inter-bank connectivity platforms i.e., MNET and 1-link. Through this shared network of online 5,903 ATMs including Askari Bank’s 267 dedicated ATMs covering major cities in Pakistan supports the delivery channels for customer service. It provides services of e-banking and payment system products.
11
Annual Report of Askari Bank Limited for 2012

Corporate Philosophy
Corporate Objectives• To achieve sustained growth and
profitability in all areas of banking business;
• To build and sustain a high performance culture, with a continuous improvement focus;
• To develop a customer–service oriented culture with special emphasis on customer care and convenience;
• To build an enabling environment, where employees are motivated to contribute to their full potential;
• To effectively manage and mitigate all kinds of risks inherent in the banking business;
• To optimize use of technology to ensure cost–effective operations, strengthened controls, efficient management information system, enhanced delivery capability, and high service standards;
• To manage the Bank’s portfolio of businesses to achieve strong and sustainable shareholder returns and to continuously build shareholder value;
• To deliver timely solutions that best meet the customers’ financial needs; and
• To explore new avenues for growth and profitability.
Strategic Planning• To comprehensively plan for the
future to ensure sustained growth and profitability;
• To facilitate alignment of the vision, mission, corporate objectives with the corporate goals and objectives;
• To provide strategic initiatives and solutions for projects, products, policies and procedures;
• To provide strategic solutions to strengthen weak areas and to counter threats to profits;
• To identify strategic initiatives and opportunities for profit; and
• To create and leverage strategic assets and capabilities for competitive advantage.
Statement of Ethics & Business PracticesAskari Bank seeks to maintain high standards of service and ethics enabling it to be perceived as impartial, ethical, and independent. In order to achieve these objectives, following principles of ethics and conduct are mandatory for all employees of the Bank:
• Render, with integrity, a responsible and effective service of high quality which is accessible by all customers, present and prospective;
• Not abuse the authority that he or she has been assigned as an employee of the Bank, in dealings with customers and other employees;
• Act judiciously, fairly and impartially with all customers when exercising any discretion in the performance of duties;
• Exercise powers conferred on them in a responsible manner particularly by:
– performing all their duties impartially without favouring any customer and without regard to status, sex, race, religion, political beliefs or aspirations;
– acting honestly, respectfully, transparently and in an accountable manner;
– treating all persons with equal consideration and objectivity;
– using any discretion vested in them judiciously, sensibly, impartially and reasonably.
• Refrain from divulging any information received in the course of their work and duties unless the performance of duty or the needs of justice require otherwise;
• Refrain from making wrong declaration to the Bank, other employees or customers;
• Resist and report any offers of bribes or other corruption emanating from any source;
• In their private life behave in a manner, which does not bring discredit to or impair the dignity or reputation of the Bank;
• Seek to attain the highest possible standards of performance, interpersonal relationships and exercise care for others in employment related activities;
• Take official decisions and enforce policies of the Bank within the ambit of law of the land faithfully and impartially; and
• Respect and comply with the statement of ethics and business practices, if they have reason to believe that a violation of this Statement, laws or regulations has occurred or is about to occur, report the matter to the Bank’s management.
Corporate Culture
The Bank recognizes employees’ behaviour and interaction with others as a vital part of their duties. In order to achieve the desired level of performance and corporate objectives, preservation of congenial and professional working environment is encouraged. Askari Bank seeks to create an environment where all persons are treated equitably and with respect, where person’s rights are respected and where efforts of staff are encouraged and their achievements given due recognition.
Professionalism
Professionalism embraces the necessary skills, qualification and knowledge to undertake tasks in a competent manner. Bank employees are expected to carry out their responsibilities in a professional manner at all times. They must conduct
12

financial or other obligations in a prudent manner and should avoid situations that could reflect unfavorably on themselves, Bank or its customers.
Customer Relationship
Knowing our customers and their needs is the key to our business success. Fairness, truthfulness and transparency governs our customer relationships in determining the transactional terms, conditions, rights and obligations. Employees should seek to understand customers’ financial circumstances and needs to be able to provide them with most suitable products and services. All employees must ensure that any advice
given to a customer is honest and fairly expressed and restricted to only those services or products where the Bank has the relevant expertise and authority.
Maintaining Confidentiality
Bank employees have a duty to safeguard confidential information, which may come to their possession during their day-to-day work. Respect for customers’ private affairs, merits the same care as does the protection of the Bank’s own affairs or other interests. This duty of confidentiality involves not divulging information to third parties unless required by statutory authorities / law.
Conflict of Interest
Circumstances should be avoided in which personal interest conflicts, or may appear to conflict, with the interest of the Bank or its customers. Circumstances may arise where an employee, his / her spouse or family member directly or indirectly hold a business interest which conflicts or may conflict with the Bank’s interest. In order to ensure that the Bank makes objective decisions, employee must declare in advance such interest to the management. Any involvement in an outside activity or any external position held by an employee:
13
Annual Report of Askari Bank Limited for 2012

• must not give rise to any real or apparent conflict with a customer’s interest;
• must not adversely reflect on the Bank; and
• must not interfere with an employee’s job performance.
Employees must not negotiate or contract on behalf of the Bank with an enterprise in which they have a direct or indirect interest. Employees on the payroll of Askari Bank must not undertake any other employment, whether part time, temporary or other, or act as consultant, director or partner of another enterprise except with the prior permission of the Bank.
Customer Due Diligence
Customer due diligence is a process to ensure that the Bank is not used for any unlawful transactions. This is achieved by obtaining sufficient information about the customers to reasonably satisfy as to their reputation, standing and the nature of their business activities. Its effective use discourages money laundering, which uses banks as vehicles to disguise or “launder” the proceeds of criminal activities. All employees, particularly working in the customer service areas, must establish the identity of every new customer from reliable identification documents. For existing customers, they must remain vigilant and aware of:
• activities not consistent with customer’s business;
• unusual characteristics or activities;
• attempts to avoid reporting or record keeping requirement; and
• unusual or erratic movement of funds.
Personal Investments
Employees must ensure that no conflict of interest arises between their personal transactions and corporate and customer responsibilities. Employees must never attempt to use their position to obtain an advantage to buy and sell investments. Employees shall not, at any time, carry out:
• short sales of marketable securities or currencies or any other form of trading which is speculative in nature in their own account or for the account of their spouse or family members; and
• trading in shares, securities or currencies which involve improper use of unpublished price sensitive information for personal benefit.
Relations with Regulators
Relationship with regulators is one of the most important relations, which Askari Bank maintains with the aim of developing mutual confidence and trust. All employees must comply in letter and spirit, with legal and regulatory requirements applicable to the activities in which the Bank is engaged.
Relationship with Competitors
Except in situations where the Bank is participating in a transaction with other bank(s), no employee shall have any agreement, understanding or arrangement with any competitor with respect to pricing of services, profit rates and / or marketing policies, which may adversely affect the Bank’s business.
Gifts & Entertainment
Gifts, business entertainment or other benefits from a customer or a supplier / vendor, which appear or may appear to
compromise commercial relationships must not be accepted by the employees. In the event that a gift must be accepted for reason of customer’s insistence and sensitivity of relationship, such gifts must be surrendered to the Bank along with reasons of acceptance. Under no circumstances an employee shall either directly or indirectly accept any amount of money, however small, as gift, gratuity, subscription or reward from any employee of the Bank, customer, supplier or vendor. Customers who wish to express gratitude for the services of Askari Bank should be requested to send a letter of appreciation.
Political Activities
No employee of the Bank shall contribute or lend money or items of any value to any of the political candidates or parties. This also includes using Bank’s facilities, equipment, personnel etc. for the purpose. However, they shall be free to participate in political process as concerned individuals through means of voting. In case of an employee considering assuming any public office, prior specific information with all related reasons must be provided to the Bank for approval.
Fraud, Theft or Illegal Activities
Employees are expected to remain alert and vigilant with respect to frauds, thefts or illegal activities committed within the Bank premises.
Harassment at Workplace
Employees must avoid any behaviours that can be termed as harassment, offensive, threatening or disturbing to other employees.
Corporate Philosophy (Contd.)
14

15
Annual Report of Askari Bank Limited for 2012

Corporate Information
Board of Directors
Lt Gen. Javed IqbalChairman
Lt Gen. (R) Tahir Mahmood
Malik Riffat Mahmood
Mr. Zafar Alam Khan Sumbal
Dr. Bashir Ahmad Khan
Mr. Ali Noormahomed Rattansey, FCA
Mr. Shahid Mahmud
Mr. Muhammad Riyazul Haque
Mr. Wazir Ali Khoja
Khawaja Jalaluddin Roomi
Mr. M. R. MehkariPresident & Chief Executive
Audit Committee
Dr. Bashir Ahmad KhanChairman
Mr. Ali Noormahomed Rattansey, FCA
Mr. Wazir Ali Khoja
Khawaja Jalaluddin Roomi
Chief Financial Officer
Mr. Saleem Anwar, FCA
Company Secretary
Mr. M. A. Ghazali Marghoob, FCA
Auditors
KPMG Taseer Hadi & CoChartered Accountants
Legal Advisors
Rizvi, Isa, Afridi & Angell
Shariah Advisor
Dr. Muhammad Tahir Mansoori
Registered / Head Office
AWT Plaza, The Mall,P.O. Box No. 1084Rawalpindi-46000,Pakistan.Tel: (92 51) 9063000Fax: (92 51) 9272455E-mail: [email protected]
Registrar & Share Transfer Office
THK Associates (Private) LimitedGround Floor, State Life Building No. 3,Dr. Ziauddin Ahmad Road,P.O. Box: 8533Karachi-75530Tel: (92 21) 111 000 322Fax: (92 21) 35655595
Entity Ratings
Long Term: AAShort Term: A1+by Pakistan Credit Rating Agency (PACRA)
Website
www.askaribank.com.pk
16

Entity Ratings
Definitions by Pakistan Credit Rating Agency Limited (PACRA):
AAVery high credit quality. ‘AA’ ratings denote a very low expectation of credit risk. These indicate very strong capacity for timely payment of financial commitments. This capacity is not significantly vulnerable to fore-seeable events.
A1+Obligations supported by the highest capacity for timely repayments.
by PACRA
17
Annual Report of Askari Bank Limited for 2012

Directors’ Profile
Lt Gen (R) Tahir Mahmood joined the Board in January 2012. The General was commissioned in Pakistan Army in 1972. He is a graduate of Command and Staff College Quetta, Royal Jordanian Command and Staff College Jordan and National Defense University Islamabad. He has served on command, staff and instructional assignments at various tiers. He commanded Rawalpindi Corps and remained Inspector General Arms in General Headquarters as Principal Staff Officer.
The General served for 40 years in the Army during which he participated in various military operations and was thrice awarded for his performance in actions. He was also conferred upon Hilal-i-Imtiaz (Military) for his meritorious service.
Joined the Board of Directors on Janaury 19, 2012
Sponsor / Non-Executive Director
Chairman of the Executive Committee
Managing Director / Vice Chairman, Army Welfare Trust (AWT). He is also Chairman of the boards of Askari General Insurance Co Ltd, Askari Guards (Pvt) Ltd, Askari Siddiqsons Development Ltd, Askari Cement Ltd, Askari Power Ltd, Askari Information System Ltd, Askari Aviation (Pvt) Ltd, Mobile Askari Lubricant Ltd, Petrosel Lubricants (Pvt) Ltd, Askpure (Pvt) Ltd and Askari Investment Management Ltd.
Lt Gen Javed Iqbal was commissioned in Pakistan Army in March 1979 and has had a distinguished career spanning a period of more than 34 years. He possesses MSc (Strategic Studies) degree from Quaid-i-Azam University, Islamabad. He has worked on various command and staff assignments during his illustrious career in the Pakistan Army. He has been General Officer Commanding of two Divisions besides having been Director General Military Operations Directorate.
Biography brief
Joined as Chairman of the Board of Directors on May 23, 2011
Term of office
Non-Executive DirectorStatus
NoneMembership of board committees
Adjutant General (AG) of Pakistan Army and Chairman Army Welfare Trust (AWT).
Other directorships / ext. appointments
Lt Gen (R) Tahir MahmoodLt Gen Javed IqbalName
18

Malik Riffat Mahmood is a Chartered Accountant by profession and has hands on experience of strategic planning, with proven skills of translating strategic vision into workable action plans.
He has also attended various professional trainings.
Mr Zafar Alam Khan Sumbal is one of the founder Directors of the Bank. Since inception of the Bank he was also assigned an extra responsibility of the Company Secretary and he worked for this position till Apr 2005 and then elevated as Director Corporate by the Board of Directors.
Before joining his present organization he was having 22 years banking experience both in Pakistan and abroad. His aggregate experience of banking and financial institutions is more than 41 years. He is a post-graduate in Economics. He is “Certified Director” by the Pakistan Institute of Corporate Governance (PICG).
He has attended various trainings and seminars in Pakistan and abroad.
Mr Muhammad Riyazul Haque holds master’s degrees in Development Economics [Williams College, USA]; Economic and Social Sciences [University of Manchester, UK]; and English [GCU, Lahore]. He joined the Government of Pakistan in 1966 in CSP. He has worked in all the provinces of Pakistan, and in districts; as Secretary to the Government of Baluchistan; as Joint Secretary in the President and the PM secretariat and in EAD; and as Additional Secretary [Banking and Foreign Exchange], Ministry of Finance. He has been a director on the boards of HBL, of Pak-Kuwait and Saudi -Pak Investment companies, and of the Federal Bank of Cooperatives.
Mr. Haque worked as international professional staff for the Asian Development Bank (ADB)in several countries. He was Team Leader for project development, processing, implementation, and monitoring and evaluation of development projects, and of institutions including several banks. He led the production of policy documents and instruction manuals. He led delegations of GOP with international financial institutions and of the ADB with other countries. He has worked as an international consultant. Mr. Haque has attended a large number of conferences and other moots in Pakistan; and abroad; has been a member of professional societies; is actively associated with think tanks and social groups; and has travelled abroad extensively.
Joined the Board of Directors on August 26, 2011. A founder Director of the Bank and has been re-elected since. He was last re-elected at the AGM of March 29, 2011.
He joined the Board of Directors of the Bank on September 1, 2008 and was re-elected for the second term at the AGM of March 29, 2011.
Sponsor / Non-Executive Director Sponsor / Non-Executive Director Independent Director
Chairman Budget Committee and a member of Executive Committee, and Information Technology Committee.
Chairman Risk Management Committee and a member of the Executive Committee and Human Resource and Remuneration Committee.
Chairman Human Resource and Remuneration Committee.
He is Director Finance on the Board of Army Welfare Trust (AWT). He is also a member of the boards of Askari Siddiqsons Development Ltd, Askari Cement Ltd., Mobile Askari Lubricant Ltd., Askari Aviation (Pvt.) Ltd., Askari Information System and Askari Power Ltd.
Chief Executive Officer of one of the AWT projects. He is a director of First Dawood Investment Bank Limited and Bata Pakistan Limited.
Zafar Alam Khan Sumbal Muhammad Riyazul Haque Malik Riffat Mahmood
19
Annual Report of Askari Bank Limited for 2012
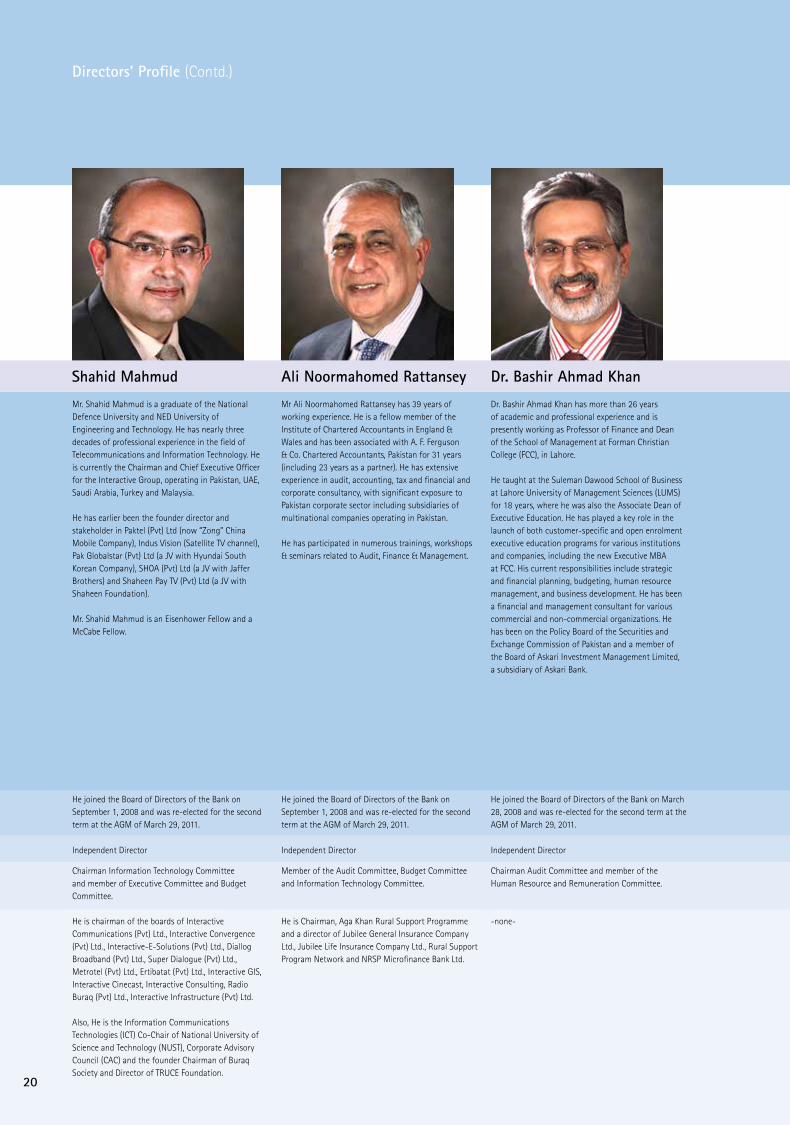
Dr. Bashir Ahmad Khan has more than 26 years of academic and professional experience and is presently working as Professor of Finance and Dean of the School of Management at Forman Christian College (FCC), in Lahore.
He taught at the Suleman Dawood School of Business at Lahore University of Management Sciences (LUMS) for 18 years, where he was also the Associate Dean of Executive Education. He has played a key role in the launch of both customer-specific and open enrolment executive education programs for various institutions and companies, including the new Executive MBA at FCC. His current responsibilities include strategic and financial planning, budgeting, human resource management, and business development. He has been a financial and management consultant for various commercial and non-commercial organizations. He has been on the Policy Board of the Securities and Exchange Commission of Pakistan and a member of the Board of Askari Investment Management Limited, a subsidiary of Askari Bank.
Mr Ali Noormahomed Rattansey has 39 years of working experience. He is a fellow member of the Institute of Chartered Accountants in England & Wales and has been associated with A. F. Ferguson & Co. Chartered Accountants, Pakistan for 31 years (including 23 years as a partner). He has extensive experience in audit, accounting, tax and financial and corporate consultancy, with significant exposure to Pakistan corporate sector including subsidiaries of multinational companies operating in Pakistan.
He has participated in numerous trainings, workshops & seminars related to Audit, Finance & Management.
Mr. Shahid Mahmud is a graduate of the National Defence University and NED University of Engineering and Technology. He has nearly three decades of professional experience in the field of Telecommunications and Information Technology. He is currently the Chairman and Chief Executive Officer for the Interactive Group, operating in Pakistan, UAE, Saudi Arabia, Turkey and Malaysia.
He has earlier been the founder director and stakeholder in Paktel (Pvt) Ltd (now “Zong” China Mobile Company), Indus Vision (Satellite TV channel), Pak Globalstar (Pvt) Ltd (a JV with Hyundai South Korean Company), SHOA (Pvt) Ltd (a JV with Jaffer Brothers) and Shaheen Pay TV (Pvt) Ltd (a JV with Shaheen Foundation).
Mr. Shahid Mahmud is an Eisenhower Fellow and a McCabe Fellow.
Directors’ Profile (Contd.)
He joined the Board of Directors of the Bank on March 28, 2008 and was re-elected for the second term at the AGM of March 29, 2011.
He joined the Board of Directors of the Bank on September 1, 2008 and was re-elected for the second term at the AGM of March 29, 2011.
He joined the Board of Directors of the Bank on September 1, 2008 and was re-elected for the second term at the AGM of March 29, 2011.
Independent DirectorIndependent DirectorIndependent Director
Chairman Audit Committee and member of the Human Resource and Remuneration Committee.
Member of the Audit Committee, Budget Committee and Information Technology Committee.
Chairman Information Technology Committee and member of Executive Committee and Budget Committee.
-none-He is Chairman, Aga Khan Rural Support Programme and a director of Jubilee General Insurance Company Ltd., Jubilee Life Insurance Company Ltd., Rural Support Program Network and NRSP Microfinance Bank Ltd.
He is chairman of the boards of Interactive Communications (Pvt) Ltd., Interactive Convergence (Pvt) Ltd., Interactive-E-Solutions (Pvt) Ltd., Diallog Broadband (Pvt) Ltd., Super Dialogue (Pvt) Ltd., Metrotel (Pvt) Ltd., Ertibatat (Pvt) Ltd., Interactive GIS, Interactive Cinecast, Interactive Consulting, Radio Buraq (Pvt) Ltd., Interactive Infrastructure (Pvt) Ltd.
Also, He is the Information Communications Technologies (ICT) Co-Chair of National University of Science and Technology (NUST), Corporate Advisory Council (CAC) and the founder Chairman of Buraq Society and Director of TRUCE Foundation.
Ali Noormahomed Rattansey Shahid Mahmud Dr. Bashir Ahmad Khan
20
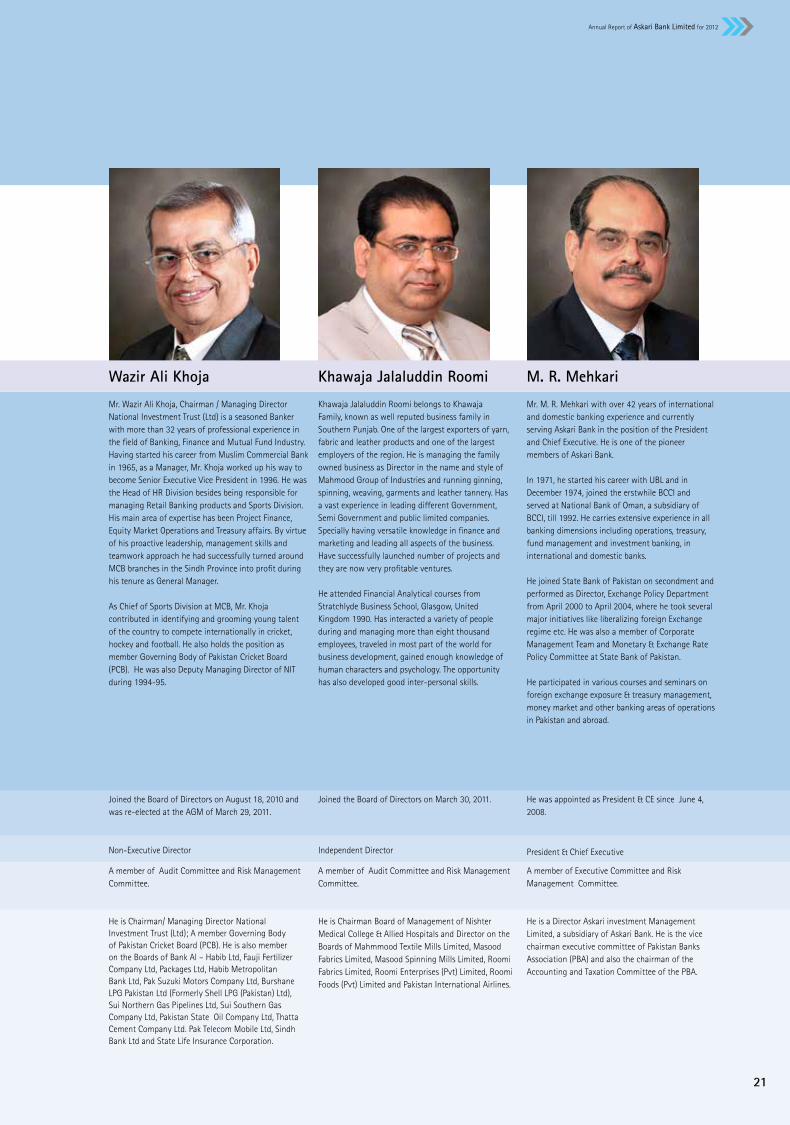
Mr. Wazir Ali Khoja, Chairman / Managing Director National Investment Trust (Ltd) is a seasoned Banker with more than 32 years of professional experience in the field of Banking, Finance and Mutual Fund Industry. Having started his career from Muslim Commercial Bank in 1965, as a Manager, Mr. Khoja worked up his way to become Senior Executive Vice President in 1996. He was the Head of HR Division besides being responsible for managing Retail Banking products and Sports Division. His main area of expertise has been Project Finance, Equity Market Operations and Treasury affairs. By virtue of his proactive leadership, management skills and teamwork approach he had successfully turned around MCB branches in the Sindh Province into profit during his tenure as General Manager.
As Chief of Sports Division at MCB, Mr. Khoja contributed in identifying and grooming young talent of the country to compete internationally in cricket, hockey and football. He also holds the position as member Governing Body of Pakistan Cricket Board (PCB). He was also Deputy Managing Director of NIT during 1994-95.
Khawaja Jalaluddin Roomi belongs to Khawaja Family, known as well reputed business family in Southern Punjab. One of the largest exporters of yarn, fabric and leather products and one of the largest employers of the region. He is managing the family owned business as Director in the name and style of Mahmood Group of Industries and running ginning, spinning, weaving, garments and leather tannery. Has a vast experience in leading different Government, Semi Government and public limited companies. Specially having versatile knowledge in finance and marketing and leading all aspects of the business. Have successfully launched number of projects and they are now very profitable ventures.
He attended Financial Analytical courses from Stratchlyde Business School, Glasgow, United Kingdom 1990. Has interacted a variety of people during and managing more than eight thousand employees, traveled in most part of the world for business development, gained enough knowledge of human characters and psychology. The opportunity has also developed good inter-personal skills.
Joined the Board of Directors on August 18, 2010 and was re-elected at the AGM of March 29, 2011.
Joined the Board of Directors on March 30, 2011.
Non-Executive Director Independent Director
A member of Audit Committee and Risk Management Committee.
A member of Audit Committee and Risk Management Committee.
He is Chairman/ Managing Director National Investment Trust (Ltd); A member Governing Body of Pakistan Cricket Board (PCB). He is also member on the Boards of Bank Al – Habib Ltd, Fauji Fertilizer Company Ltd, Packages Ltd, Habib Metropolitan Bank Ltd, Pak Suzuki Motors Company Ltd, Burshane LPG Pakistan Ltd (Formerly Shell LPG (Pakistan) Ltd), Sui Northern Gas Pipelines Ltd, Sui Southern Gas Company Ltd, Pakistan State Oil Company Ltd, Thatta Cement Company Ltd. Pak Telecom Mobile Ltd, Sindh Bank Ltd and State Life Insurance Corporation.
He is Chairman Board of Management of Nishter Medical College & Allied Hospitals and Director on the Boards of Mahmmood Textile Mills Limited, Masood Fabrics Limited, Masood Spinning Mills Limited, Roomi Fabrics Limited, Roomi Enterprises (Pvt) Limited, Roomi Foods (Pvt) Limited and Pakistan International Airlines.
Mr. M. R. Mehkari with over 42 years of international and domestic banking experience and currently serving Askari Bank in the position of the President and Chief Executive. He is one of the pioneer members of Askari Bank.
In 1971, he started his career with UBL and in December 1974, joined the erstwhile BCCI and served at National Bank of Oman, a subsidiary of BCCI, till 1992. He carries extensive experience in all banking dimensions including operations, treasury, fund management and investment banking, in international and domestic banks.
He joined State Bank of Pakistan on secondment and performed as Director, Exchange Policy Department from April 2000 to April 2004, where he took several major initiatives like liberalizing foreign Exchange regime etc. He was also a member of Corporate Management Team and Monetary & Exchange Rate Policy Committee at State Bank of Pakistan.
He participated in various courses and seminars on foreign exchange exposure & treasury management, money market and other banking areas of operations in Pakistan and abroad.
He was appointed as President & CE since June 4, 2008.
President & Chief Executive
A member of Executive Committee and Risk Management Committee.
He is a Director Askari investment Management Limited, a subsidiary of Askari Bank. He is the vice chairman executive committee of Pakistan Banks Association (PBA) and also the chairman of the Accounting and Taxation Committee of the PBA.
Wazir Ali Khoja Khawaja Jalaluddin Roomi M. R. Mehkari
21
Annual Report of Askari Bank Limited for 2012

Human Resource & Remuneration Committee (HRRC)• MrMuhammadRiyazulHaque Chairman
• MrZafarAlamKhanSumbal
• DrBashirAhmadKhan
Terms of ReferencesThe key functions of HRC comprise of review of Bank’s human resource policies, to keep them aligned with the environment and recommend them for Board’s approval, review of human resource annual budgets and monitor progress thereagainst; review of succession plan for senior management ensuring that key positions remain adequately filled at all times; reviewing employee training need assessment including adequacy of training programs organized for Bank employees; review Bank’s staff strength and reports on human resource management and practices; perform any other task as per the directive of the Board / EC.
6 HRC meetings were held during 2012.
Board Committees
Executive Committee (EC)• Lt.Gen.(R)TahirMahmood Chairman
• MalikRiffatMahmood
• MrZafarAlamKhanSumbal
• MrShahidMahmud
• MrMRMehkari President & Chief Executive
Terms of ReferencesThe key functions of the EC comprise of overseeing all operational, financial and administrative aspects of Bank’s business, and in this regard, formulating, reviewing and revising policies including defining powers of the President & Chief Executive and other key management employees of the Bank and issuing directives for implementation thereof. Considering / approving such other matters which are beyond the established limits of the President & Chief Executive. Considering, approving, appointing and promoting executives in certain senior cadre and suspending, terminating their services with the consent / recommendations of President & Chief Executive.
11 EC meetings were held during 2012.
Audit Committee (AC)• DrBashirAhmadKhan Chairman
• MrAliNoormahomedRattansey
• MrWazirAliKhoja
• KhawajaJalaluddinRoomi
Terms of References AC is responsible for setting appropriate measures to safeguard the Bank’s assets and in this regard determining the effectiveness and efficiency of internal control systems; reviewing and recommending for Board’s approval the periodical financial statements, statement on internal control, related party transactions and recommendation for appointment of external auditors. It is also mandated to receive, review and present to the Board management letters issued by the external auditors; consider internal audit reports and submit findings to the Board that require its attention; ensuring effective coordination between internal and external auditors. It also reviews the scope of internal audit function. Determination and monitoring compliance to statutory / regulatory requirements and best practices of corporate governance and taking up any other matter on the directions of the Board are also within the scope of the AC.
4 AC meetings were held during 2012.
Risk Management Committee (RMC)• MrZafarAlamKhanSumbal Chairman
• MrWazirAliKhoja
• KhawajaJalaluddinRoomi
• MrMRMehkari President & Chief Executive
Terms of ReferencesThe core function of RMC is to review the risk management strategies for identification, assessment, reporting, monitoring and controlling of risks. RMC oversees that the risk management framework remains compliant with the regulatory requirements and that appropriate risk management policies and parameters are in place; approval and monitoring of limits in respect of credit, market, operational and other risks; carrying out risk related surveillance function on behalf of the Board and reporting on matters requiring Board’s attention; ensuring that the risk management function of the Bank is adequately resourced with requisite skills to effectively discharge assigned roles and responsibilities.; and ensuring that the RMC is kept abreast of changing risk management techniques through effective training programs.
5 RMC meetings were held during 2012.
22
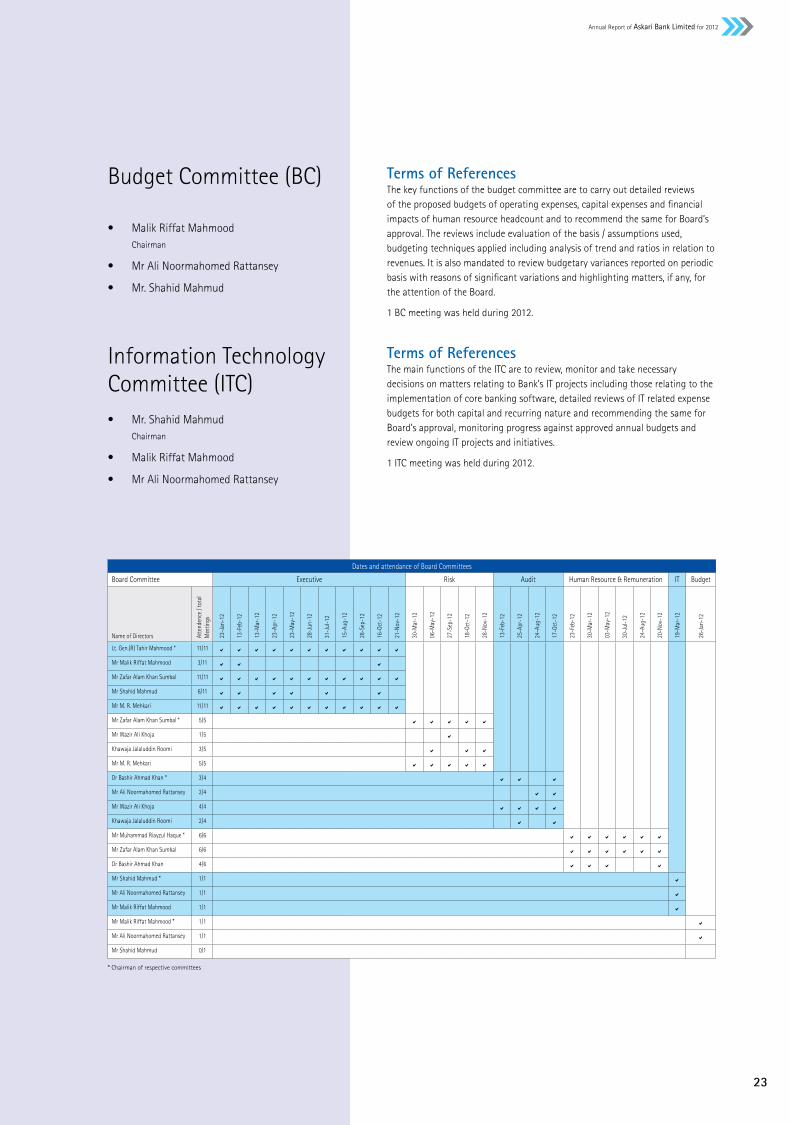
Budget Committee (BC)
• MalikRiffatMahmood Chairman
• MrAliNoormahomedRattansey
• Mr.ShahidMahmud
Terms of ReferencesThe key functions of the budget committee are to carry out detailed reviews of the proposed budgets of operating expenses, capital expenses and financial impacts of human resource headcount and to recommend the same for Board’s approval. The reviews include evaluation of the basis / assumptions used, budgeting techniques applied including analysis of trend and ratios in relation to revenues. It is also mandated to review budgetary variances reported on periodic basis with reasons of significant variations and highlighting matters, if any, for the attention of the Board.
1 BC meeting was held during 2012.
Terms of ReferencesThe main functions of the ITC are to review, monitor and take necessary decisions on matters relating to Bank’s IT projects including those relating to the implementation of core banking software, detailed reviews of IT related expense budgets for both capital and recurring nature and recommending the same for Board’s approval, monitoring progress against approved annual budgets and review ongoing IT projects and initiatives.
1 ITC meeting was held during 2012.
* Chairman of respective committees
Dates and attendance of Board Committees
Board Committee Executive Risk Audit Human Resource & Remuneration IT Budget
Name of Directors Atte
nden
ce /
tota
l M
eetin
gs
23-J
an-1
2
13-F
eb-1
2
13-M
ar-1
2
23-A
pr-1
2
23-M
ay-1
2
28-J
un-1
2
31-J
ul-1
2
15-A
ug-1
2
28-S
ep-1
2
16-O
ct-1
2
21-N
ov-1
2
30-M
ar-1
2
06-M
ay-1
2
27-S
ep-1
2
18-O
ct-1
2
28-N
ov-1
2
13-F
eb-1
2
25-A
pr-1
2
24-A
ug-1
2
17-O
ct-1
2
23-F
eb-1
2
30-M
ar-1
2
03-M
ay-1
2
30-J
ul-1
2
24-A
ug-1
2
20-N
ov-1
2
19-M
ar-1
2
26-J
an-1
2
Lt. Gen.(R) Tahir Mahmood * 11/11 a a a a a a a a a a a
Mr Malik Riffat Mahmood 3/11 a a a
Mr Zafar Alam Khan Sumbal 11/11 a a a a a a a a a a a
Mr Shahid Mahmud 6/11 a a a a a a
Mr M. R. Mehkari 11/11 a a a a a a a a a a a
Mr Zafar Alam Khan Sumbal * 5/5 a a a a a
Mr Wazir Ali Khoja 1/5 a
Khawaja Jalaluddin Roomi 3/5 a a a
Mr M. R. Mehkari 5/5 a a a a a
Dr Bashir Ahmad Khan * 3/4 a a a
Mr Ali Noormahomed Rattansey 2/4 a a
Mr Wazir Ali Khoja 4/4 a a a a
Khawaja Jalaluddin Roomi 2/4 a a
Mr Muhammad Riayzul Haque * 6/6 a a a a a a
Mr Zafar Alam Khan Sumbal 6/6 a a a a a a
Dr Bashir Ahmad Khan 4/6 a a a a
Mr Shahid Mahmud * 1/1 a
Mr Ali Noormahomed Rattansey 1/1 a
Mr Malik Riffat Mahmood 1/1 a
Mr Malik Riffat Mahmood * 1/1 a
Mr Ali Noormahomed Rattansey 1/1 a
Mr Shahid Mahmud 0/1
Information Technology Committee (ITC)• Mr.ShahidMahmud Chairman
• MalikRiffatMahmood
• MrAliNoormahomedRattansey
23
Annual Report of Askari Bank Limited for 2012

Head Office Credit Committee (HOCC)• President&ChiefExecutive,Chairman• GroupHeadCorporate&InvestmentBanking• GroupHeadMarketing&StrategicPlanning• GroupHeadOperations• GroupHeadCommercialBanking• CountryHeadSpecialAssetManagement• ChiefCreditOfficer
Terms of ReferencesHOCC is mainly responsible for review and approval of credit strategy; review of risk appetite and tolerance limits; approval of credit / investment proposals; review of classified advances portfolio and watch-list accounts and initiation of necessary corrective measures. It is also delegated with the powers to develop / maintain and approve the credit approval authority structure within the Bank to ensure smooth functioning. Various analysis & reviews on credit risk conducted by Risk Management Division of the Bank are also presented in HOCC for review and monitoring the health of Bank’s credit portfolio.
Management Committees
Management Committee (ManCom)
• President&ChiefExecutive,Chairman• GroupHeadCorporate&InvestmentBanking• GroupHeadBusinessTransformation• GroupHeadMarketing&StrategicPlanning• GroupHeadOperations• GroupHeadCommercialBanking• ChiefInformationOfficer• GlobalTreasurer• ChiefFinancialOfficer• CountryHeadRiskManagement• CountryHeadConsumerBankingServices• ChiefCreditOfficer• CountryHeadHumanResource• CountryHeadCompliance&Data• RegionalGeneralManagersNorth,Central&South
Terms of ReferencesManCom’s primary responsibility is to ensure development, monitoring and management of effective governance throughout the Bank and its subsidiaries. It is responsible to set strategic direction of the Bank including its understanding and communication across the Bank; developing business plans ensuring that these are aligned with strategic objectives and monitoring performance thereagainst. Mancom is also mandated to ensure the health of operations and adequacy of returns on all business activities of the Bank.
Asset Liability Management Committee (ALCO)
• President&ChiefExecutive,Chairman• GroupHeadCorporate&InvestmentBanking• GroupHeadMarketing&StrategicPlanning• GroupHeadCommercialBanking• GlobalTreasurer• ChiefFinancialOfficer• CountryHeadRiskManagement• CountryHeadInternationalBanking• ChiefCreditOfficer• RegionalGeneralManagersNorth,Central&South
Terms of ReferencesALCO is responsible for reviewing and monitoring the liquidity management of the Bank, interest rate scenarios, market and foreign currency risks, by applying various techniques including stress testing and gap analysis, while considering external environment (economic forecasts etc.) and ensuring that these remain fully compliant with the regulatory requirements. ALCO also ensures that corrective / remedial measures, where necessary, are initiated. It is also responsible to review and approval new products, periodical declaration of deposit rates, setting targets, and monitoring performances there-against. It is also mandated to review performance of capital market and treasury activities of the Bank.
24
25
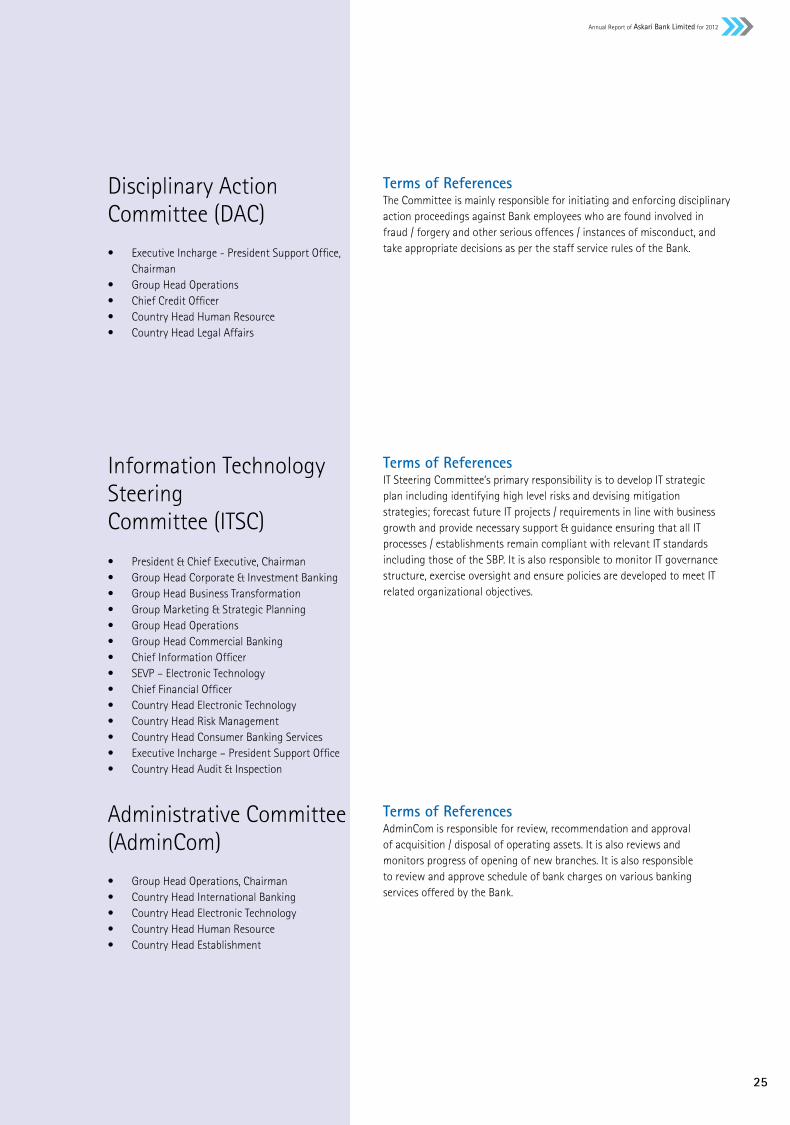
Disciplinary Action Committee (DAC)
• ExecutiveIncharge-PresidentSupportOffice, Chairman• GroupHeadOperations• ChiefCreditOfficer• CountryHeadHumanResource• CountryHeadLegalAffairs
Terms of ReferencesThe Committee is mainly responsible for initiating and enforcing disciplinary action proceedings against Bank employees who are found involved in fraud / forgery and other serious offences / instances of misconduct, and take appropriate decisions as per the staff service rules of the Bank.
Information Technology SteeringCommittee (ITSC)
• President&ChiefExecutive,Chairman• GroupHeadCorporate&InvestmentBanking• GroupHeadBusinessTransformation• GroupMarketing&StrategicPlanning• GroupHeadOperations• GroupHeadCommercialBanking• ChiefInformationOfficer• SEVP–ElectronicTechnology• ChiefFinancialOfficer• CountryHeadElectronicTechnology• CountryHeadRiskManagement• CountryHeadConsumerBankingServices• ExecutiveIncharge–PresidentSupportOffice• CountryHeadAudit&Inspection
Terms of ReferencesIT Steering Committee’s primary responsibility is to develop IT strategic plan including identifying high level risks and devising mitigation strategies; forecast future IT projects / requirements in line with business growth and provide necessary support & guidance ensuring that all IT processes / establishments remain compliant with relevant IT standards including those of the SBP. It is also responsible to monitor IT governance structure, exercise oversight and ensure policies are developed to meet IT related organizational objectives.
Administrative Committee (AdminCom)
• GroupHeadOperations,Chairman• CountryHeadInternationalBanking• CountryHeadElectronicTechnology• CountryHeadHumanResource• CountryHeadEstablishment
Terms of ReferencesAdminCom is responsible for review, recommendation and approval of acquisition / disposal of operating assets. It is also reviews and monitors progress of opening of new branches. It is also responsible to review and approve schedule of bank charges on various banking services offered by the Bank.
25
Annual Report of Askari Bank Limited for 2012

hereby authorized either singly or jointly, to complete any or all necessary required corporate and legal formalities for the completion of the transactions.”
5. To consider any other business as may be placed before the meeting with the permission of the Chair.
By Order of the Board
Rawalpindi M. A. Ghazali MarghoobMarch 6, 2013 Company Secretary
NOTES1. The statement under section 160 (1)
(b) & (c) of the Companies Ordinance,
1984 setting forth all material facts
concerning the special business to be
transacted at the meeting is annexed.
2. The share transfer books of the Bank
will remain closed from March 21 to
March 28, 2013 (both days inclusive).
Transfers received at M/s THK Associates
(Private) Limited, Ground Floor, State Life
Building # 3, Dr. Ziauddin Ahmad Road,
Karachi-75530, the Registrar and Share
Transfer Office of the Bank at the close
of the business on March 20, 2013 will
be treated in time.
3. A member entitled to attend and vote
at the meeting is entitled to appoint a
proxy to attend and vote for him/her.
No person shall act as a proxy, who is
not a member of the Bank except that
Government of Pakistan [GoP] or SBP or
corporate entity may appoint a person
who is not a member.
4. The instrument appointing a proxy
should be signed by the member or his/
her attorney duly authorized in writing.
If the member is a corporate entity
(other than GoP and SBP), its common
seal should be affixed on the instrument.
5. The instrument appointing a proxy,
together with power of attorney, if any,
under which it is signed or a notarially
certified copy thereof, should be
deposited, with the Company Secretary,
Askari Bank Limited, 1st Floor, AWT Plaza,
The Mall, P.O. Box No. 1084, Rawalpindi
not less than 48 hours before the time of
holding the meeting.
Notice of 21stAnnual General Meeting
Notice is hereby given that the 21st Annual General Meeting of the shareholders of Askari Bank Limited (the Bank) will be held on Thursday, March 28, 2013 at 10:00 am at Blue Lagoon Complex near Pearl Continental Hotel, Rawalpindi to transact the following business:
Ordinary Business:1. To confirm the minutes of the 20th
Annual General Meeting held on March 29, 2012.
2. To receive, consider and adopt the financial statements for the year ended December 31, 2012 together with the Directors’ and Auditors’ reports thereon.
3. To appoint the auditors of the Bank for the year ending December 31, 2013 and to fix their remuneration.
Special Business:
4. To consider and if deemed fit pass the following ‘Special Resolutions’ under section 208 of the Companies Ordinance, 1984 with or without modification(s):
a. “Resolved that the President & Chief Executive and Company Secretary of the Bank be and are hereby authorized either singly or jointly to take all necessary steps to make investment(s) of upto Rs. 330 million as seed /core capital in the open-end mutual funds schemes to be launched by Askari Investment Management Limited (AIML), wholly owned subsidiary of the Bank in future from time to time.
b. Further Resolved that the Board of Directors of Askari Bank Limited be and is hereby authorized to evaluate and approve above seed / core capital investments to be made by the Bank in any particular open-end mutual fund to be launched by AIML in future.
c. Further Resolved that the President & Chief Executive and Company Secretary of the Bank be and are
6. If a member appoints more than one
proxy, and more than one instrument of
proxy is deposited by a member, all such
instruments of proxy shall be rendered
invalid.
7. The proxy form shall be witnessed by one
person whose name, address and CNIC
number shall be mentioned on the form.
8. Attested copies of the CNIC or passport
of the beneficial owners and the proxy
shall be furnished with the proxy form.
9. The proxy shall produce his / her original
CNIC or original passport at the time of
meeting.
10. In case of GoP / SBP / corporate entity,
the Board of Directors’ resolution
/ power of attorney with specimen
signature shall be submitted along with
proxy form to the Bank.
Statement under Section 160 (1) (b) & (c) of the Companies Ordinance, 1984
This statement sets out the material facts
pertaining to the special business to be
transacted at the 21st Annual General Meeting
of the Bank to be held on Thursday, March 28,
2013.
Item No. 4 of the Notice – Investments to be
made by the Bank
AIML is wholly owned subsidiary of Askari Bank
Limited which is licensed as a Non-Banking
Finance Company (NBFC) to undertake asset
management and investment advisory services
under the Non-Banking Finance Companies
(Establishment and Regulation) Rules, 2003.
AIML is currently managing seven open-end
mutual funds / collective investment schemes.
Launch of new funds by AIML will increase
its product platter and is expected to help in
further expanding its business by capturing
the market shares and thereby adding value to
AIML and the Bank.
Askari Bank Limited, in order to ensure
successful launch of the new open-end mutual
funds of AIML intends to make seed / core
capital in the open - end mutual funds upto
Rs. 330 million to be launched by AIML from
time to time in future.
Information required Under Clause (a) of Sub-
Regulation (1) of Regulation 3 of Companies
(Investment in Associated Companies or
Associated Undertaking) Regulations, 2012.
26

Information Required Under Clause (a) of Sub-Regulation (1) of Regulation 3 of Companies (Investment in Associated Companies or Associated Undertaking) Regulations, 2012
i Name of associated company or Askari Investment Management associated undertaking Limited (AIML) along with criteria based on which the associated relationship Open-end mutual funds / VPS to be established launched by AIML in future from time to time.
All the mutual funds / investment plans launched by a subsidiary are the associated undertaking of AIML, as per NBFC & Notified Entities Regulations, so as of the Bank.
ii Purpose, benefits and period of Seed capital for open-end mutual investment funds / VPS.
Minimum time of Investments 2 years, however transferable within 2 years.
iii Maximum amount of Investment Rs. 330 million
iv Maximum price at which At prevailing NAV / par value, in securities will be acquired accordance with the constitutive documents of the funds / VPS.
v Maximum number of securities to Based on the NAV / par value and be acquired investment amount in respective funds / VPS.
vi Number of securities and Before proposed investments it percentage there of held before would be zero. After investment will and after the proposed investment depend on the size of the Fund / VPS.
vii In case of investment in listed Not applicable securities, average of the preceding twelve weekly average price of security intended to All investment will be made in newly be acquired launched funds / VPS.
viii In case of investment in unlisted All the mutual funds will be listed securities, fair market value of except VPS. such securities determined in terms of regulation 6(1)
ix Break-up value of securities Not applicable intended to be acquired on the basis of latest audited financial statements
x Earnings per share of the 2012: Re. 0.10 per share associated company or associated 2011: Re. 0.41 per share undertaking for the last 2010: Rs. (1.63) per share three years
xi Source of fund from which Pool of funds. securities will be acquired
xii Where the securities are intended Not applicable to be acquired using borrowed funds
i. Justification for investment through borrowings and ii. Detail of guarantees and assets pledged for obtaining such funds
xiii Salient features of the No separate agreement will be agreement(s),if any, entered into entered into; it will be in accordance with its associated company or with the constitutive documents of associated undertaking with the funds / VPS approved by board of regards to the proposed directors and the Regulator. investment
xiv Direct or indirect interest of None directors, sponsors, majority shareholders and their relatives, if any, in the associated company or associated under taking or the transaction under consideration.
xv Any other important details Not applicable necessary for the members to understand the transaction
xvi In case of investment in securities Not applicable of a project of an associated company or associated undertaking that has not commenced operations, in addition to the information referred to above, the following further information required, namely:
1 Description of the project and its history since conceptualization 2 Starting and expected date of completion of work 3 Time by which such project shall become commercially operational 4 Expected return by which the project shall start paying return on investment Inspection of Documents
Copies of memorandum and articles of association of the Bank, statement under section 160 (1) (b) & (c) of the Companies Ordinance, 1984, annual and quarterly financial statements as the case may and other related information/documents of the Bank and the investee companies which may be inspected / procured during business hours on any working day at the registered office of the Bank from the date of publication of this notice till conclusion of the Annual General Meeting.
27
Annual Report of Askari Bank Limited for 2012
Management
M. R. MehkariPresident & Chief Executive
Head OfficeS. Suhail RizviGroup Head-Business Transformation
Haseeb SaulatGroup Head-Marketing & Strategic Planning
Javed IqbalChief Information Officer
Imtiaz Ahmad SheikhSEVP Electronic Technology
Rehan MirGlobal Treasurer
Khalid Muhammad KhanGroup Head-Operations
Farooq Abid TungCountry Head-Special Asset Management
Saleem AnwarChief Financial Officer
Lubna Azam TiwanaCountry Head-Risk Management
Zahid Mehmood ChaudhryCountry Head-International Banking
Farrukh Iqbal KhanChief Credit Officer
Abdus Samad KhanCountry Head-Human ResourceExecutive Incharge-President Support Office
Hassan Aziz RanaHead-Legal Affairs
Babar WaseimCountry Head-Establishment
Zain Ul AbidinCountry Head-Compliance & Data
Muhammad Ahmed Ghazali MarghoobCompany Secretary
Muhammad Iftikhar BalochHead-Central Processing Unit
Abdul WaseemCountry Head-Credit Administration
Shahid AbbasiCountry Head-Audit & Inspection
Commercial BankingKhurshid ZafarGroup Head-Commercial Banking
North RegionSyed Tauqir Haider RizviRegional General Manager
Tanveer Afzal KhanArea Manager-Peshawar
Sheikh Muhammad Abrar AliArea Manager-Rawalpindi-II
Khalid Ejaz MalikActing Area Manager-Islamabad
Sher Afgan KhanzadaArea Manager-Rawalpindi-I
Mohammad Ahmad JamilArea Manager-Azad Kashmir
Central RegionKhawaja Shaukat IqbalRegional General Manager
Saulat HameedArea Manager-Lahore-II
Ejaz Musarrat SiddiquiArea Manager-Lahore-I
Mushtaq AhmedArea Manager-Gujranwala
Javed IqbalArea Manager-Multan
Altaf Hussain SaqibArea Manager-Faisalabad
Tariq JavedArea Manager-Sahiwal
South RegionMirajuddin AzizRegional General Manager
Irfan MalikArea Manager-Karachi-II
Hassan Raza KariArea Manager-Karachi-I
Ismail OzaArea Manager-Karachi-IV
Saleem Sohail ButtArea Manager-Quetta
Abdul WaheedArea Manager-Hyderabad
Ahsan NoorArea Manager-Karachi-III
Agricultural BankingAdnan AsgharCountry Head-Agriculture & Rural Business
Leasing BusinessZulfiqar Ali KhanCountry Head-Leasing
Corporate BankingTahir AzizGroup Head-Corporate & Investment Banking
Syed Abbas HamdaniRegional Head Corporate, North
Muhammad Anwar SheikhRegional Head Corporate, Central
Khawaja Haider HassanRegional Head Corporate, South
Islamic BankingHashim Khan HotiCountry Head-Islamic Banking Services
Consumer BankingIsrar AhmedCountry Head-Consumer Banking Services
Wholesale Bank Branch, BahrainKhurram DarBranch Manager
28

Organogram
Board of Directors
President &Chief Executive
ExecutiveCommittee
Information Technology Committee
Human Resource & Remuneration Committee
Executive InchargePresident Support Office
Country HeadRisk Management
Group HeadBusiness Transformation
Global Treasurer
Country Head Islamic Banking Services
Country HeadAudit and Inspection
Group Head Operations
Country HeadCompliance & Data
Chief Financial Officer
Company Secretary
Country HeadInternational Banking
Country HeadConsumer Banking
Services
Chief Information Officer
Country HeadSpecial Asset Management
Group Head Marketing & Strategic Planning
Group HeadCorporate & Investment
Banking
Country HeadHuman Resource
Chief Credit Officer
Group HeadCommercial Banking
BudgetCommittee
Risk ManagementCommittee
AuditCommittee
29
Annual Report of Askari Bank Limited for 2012
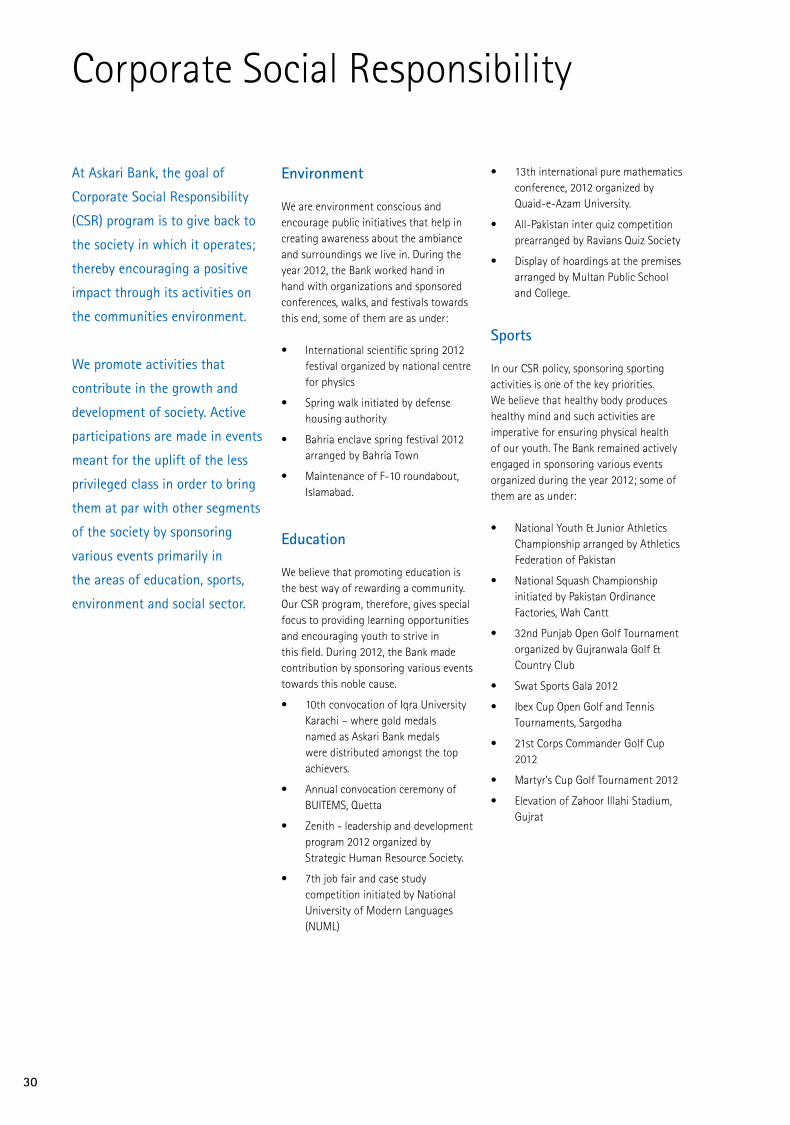
Corporate Social Responsibility
At Askari Bank, the goal of
Corporate Social Responsibility
(CSR) program is to give back to
the society in which it operates;
thereby encouraging a positive
impact through its activities on
the communities environment.
We promote activities that
contribute in the growth and
development of society. Active
participations are made in events
meant for the uplift of the less
privileged class in order to bring
them at par with other segments
of the society by sponsoring
various events primarily in
the areas of education, sports,
environment and social sector.
Environment
We are environment conscious and encourage public initiatives that help in creating awareness about the ambiance and surroundings we live in. During the year 2012, the Bank worked hand in hand with organizations and sponsored conferences, walks, and festivals towards this end, some of them are as under:
• Internationalscientificspring2012festival organized by national centre for physics
• Springwalkinitiatedbydefensehousing authority
• Bahriaenclavespringfestival2012arranged by Bahria Town
• MaintenanceofF-10roundabout,Islamabad.
Education
We believe that promoting education is the best way of rewarding a community. Our CSR program, therefore, gives special focus to providing learning opportunities and encouraging youth to strive in this field. During 2012, the Bank made contribution by sponsoring various events towards this noble cause.
• 10thconvocationofIqraUniversityKarachi – where gold medals named as Askari Bank medals were distributed amongst the top achievers.
• AnnualconvocationceremonyofBUITEMS, Quetta
• Zenith-leadershipanddevelopmentprogram 2012 organized by Strategic Human Resource Society.
• 7thjobfairandcasestudycompetition initiated by National University of Modern Languages (NUML)
• 13thinternationalpuremathematicsconference, 2012 organized by Quaid-e-Azam University.
• All-Pakistaninterquizcompetitionprearranged by Ravians Quiz Society
• Displayofhoardingsatthepremisesarranged by Multan Public School and College.
Sports
In our CSR policy, sponsoring sporting activities is one of the key priorities. We believe that healthy body produces healthy mind and such activities are imperative for ensuring physical health of our youth. The Bank remained actively engaged in sponsoring various events organized during the year 2012; some of them are as under:
• NationalYouth&JuniorAthleticsChampionship arranged by Athletics Federation of Pakistan
• NationalSquashChampionshipinitiated by Pakistan Ordinance Factories, Wah Cantt
• 32ndPunjabOpenGolfTournamentorganized by Gujranwala Golf & Country Club
• SwatSportsGala2012
• IbexCupOpenGolfandTennisTournaments, Sargodha
• 21stCorpsCommanderGolfCup2012
• Martyr’sCupGolfTournament2012
• ElevationofZahoorIllahiStadium,Gujrat
30

31
Annual Report of Askari Bank Limited for 2012
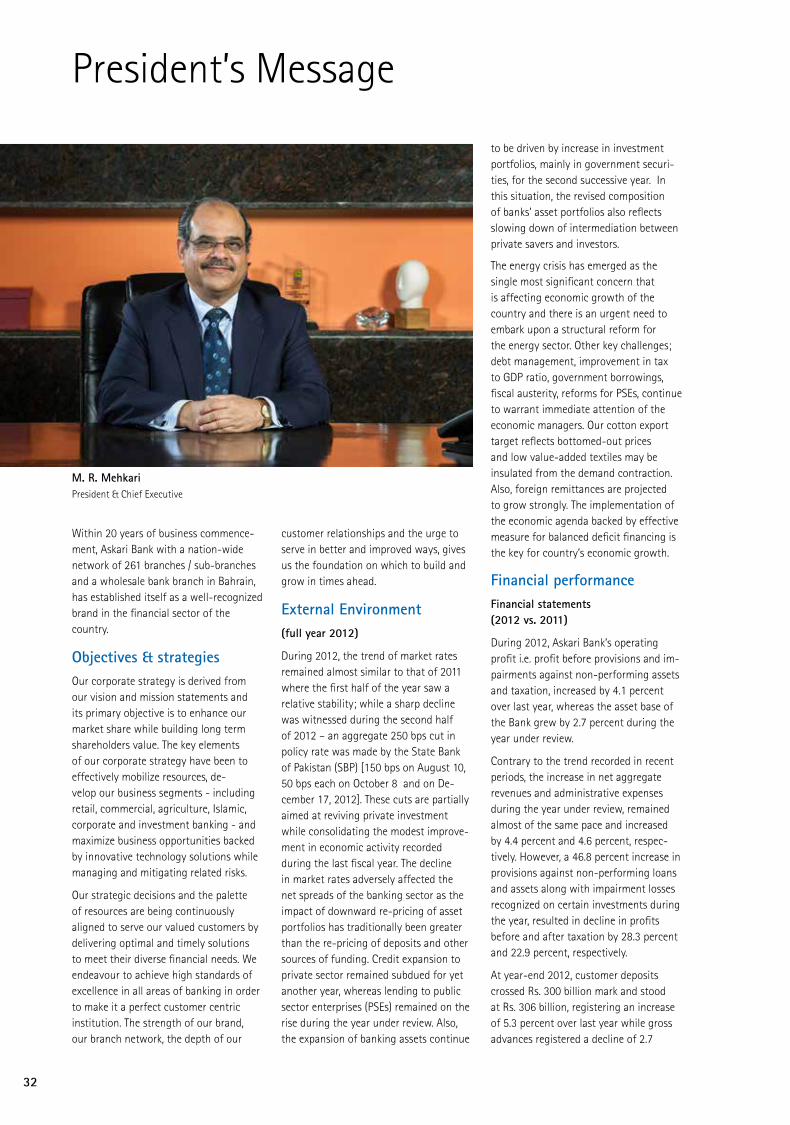
customer relationships and the urge to serve in better and improved ways, gives us the foundation on which to build and grow in times ahead.
External Environment(full year 2012)
During 2012, the trend of market rates remained almost similar to that of 2011 where the first half of the year saw a relative stability; while a sharp decline was witnessed during the second half of 2012 – an aggregate 250 bps cut in policy rate was made by the State Bank of Pakistan (SBP) [150 bps on August 10, 50 bps each on October 8 and on De-cember 17, 2012]. These cuts are partially aimed at reviving private investment while consolidating the modest improve-ment in economic activity recorded during the last fiscal year. The decline in market rates adversely affected the net spreads of the banking sector as the impact of downward re-pricing of asset portfolios has traditionally been greater than the re-pricing of deposits and other sources of funding. Credit expansion to private sector remained subdued for yet another year, whereas lending to public sector enterprises (PSEs) remained on the rise during the year under review. Also, the expansion of banking assets continue
to be driven by increase in investment portfolios, mainly in government securi-ties, for the second successive year. In this situation, the revised composition of banks’ asset portfolios also reflects slowing down of intermediation between private savers and investors.
The energy crisis has emerged as the single most significant concern that is affecting economic growth of the country and there is an urgent need to embark upon a structural reform for the energy sector. Other key challenges; debt management, improvement in tax to GDP ratio, government borrowings, fiscal austerity, reforms for PSEs, continue to warrant immediate attention of the economic managers. Our cotton export target reflects bottomed-out prices and low value-added textiles may be insulated from the demand contraction. Also, foreign remittances are projected to grow strongly. The implementation of the economic agenda backed by effective measure for balanced deficit financing is the key for country’s economic growth.
Financial performanceFinancial statements(2012 vs. 2011)
During 2012, Askari Bank’s operating profit i.e. profit before provisions and im-pairments against non-performing assets and taxation, increased by 4.1 percent over last year, whereas the asset base of the Bank grew by 2.7 percent during the year under review.
Contrary to the trend recorded in recent periods, the increase in net aggregate revenues and administrative expenses during the year under review, remained almost of the same pace and increased by 4.4 percent and 4.6 percent, respec-tively. However, a 46.8 percent increase in provisions against non-performing loans and assets along with impairment losses recognized on certain investments during the year, resulted in decline in profits before and after taxation by 28.3 percent and 22.9 percent, respectively.
At year-end 2012, customer deposits crossed Rs. 300 billion mark and stood at Rs. 306 billion, registering an increase of 5.3 percent over last year while gross advances registered a decline of 2.7
President’s Message
Within 20 years of business commence-ment, Askari Bank with a nation-wide network of 261 branches / sub-branches and a wholesale bank branch in Bahrain, has established itself as a well-recognized brand in the financial sector of the country.
Objectives & strategiesOur corporate strategy is derived from our vision and mission statements and its primary objective is to enhance our market share while building long term shareholders value. The key elements of our corporate strategy have been to effectively mobilize resources, de-velop our business segments - including retail, commercial, agriculture, Islamic, corporate and investment banking - and maximize business opportunities backed by innovative technology solutions while managing and mitigating related risks.
Our strategic decisions and the palette of resources are being continuously aligned to serve our valued customers by delivering optimal and timely solutions to meet their diverse financial needs. We endeavour to achieve high standards of excellence in all areas of banking in order to make it a perfect customer centric institution. The strength of our brand, our branch network, the depth of our
M. R. MehkariPresident & Chief Executive
32
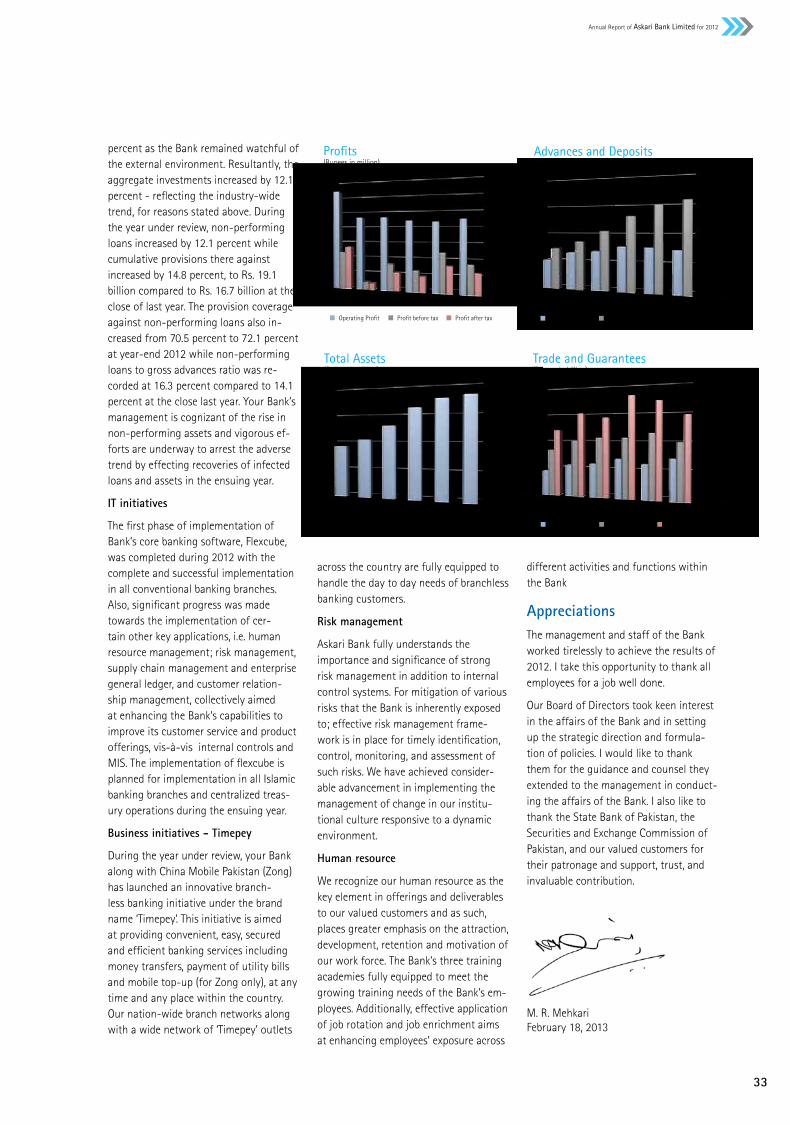
percent as the Bank remained watchful of the external environment. Resultantly, the aggregate investments increased by 12.1 percent - reflecting the industry-wide trend, for reasons stated above. During the year under review, non-performing loans increased by 12.1 percent while cumulative provisions there against increased by 14.8 percent, to Rs. 19.1 billion compared to Rs. 16.7 billion at the close of last year. The provision coverage against non-performing loans also in-creased from 70.5 percent to 72.1 percent at year-end 2012 while non-performing loans to gross advances ratio was re-corded at 16.3 percent compared to 14.1 percent at the close last year. Your Bank’s management is cognizant of the rise in non-performing assets and vigorous ef-forts are underway to arrest the adverse trend by effecting recoveries of infected loans and assets in the ensuing year.
IT initiatives
The first phase of implementation of Bank’s core banking software, Flexcube, was completed during 2012 with the complete and successful implementation in all conventional banking branches. Also, significant progress was made towards the implementation of cer-tain other key applications, i.e. human resource management; risk management, supply chain management and enterprise general ledger, and customer relation-ship management, collectively aimed at enhancing the Bank’s capabilities to improve its customer service and product offerings, vis-à-vis internal controls and MIS. The implementation of flexcube is planned for implementation in all Islamic banking branches and centralized treas-ury operations during the ensuing year.
Business initiatives - Timepey
During the year under review, your Bank along with China Mobile Pakistan (Zong) has launched an innovative branch-less banking initiative under the brand name ‘Timepey’. This initiative is aimed at providing convenient, easy, secured and efficient banking services including money transfers, payment of utility bills and mobile top-up (for Zong only), at any time and any place within the country. Our nation-wide branch networks along with a wide network of ‘Timepey’ outlets
0
100
200
300
400
2007 2008 2009 2010 2011 2012
Advances and Deposits(Rupees in billion)
Advances - Net Deposits
Pro�ts(Rupees in million)
Operating Pro�t Pro�t before tax Pro�t after tax
0
1,000
2,000
3,000
4,000
5,000
6,000
7,000
2007 2008 2009 2010 2011 2012
0
100
200
300
400
2007 2008 2009 2010 2011 2012
Total Assets(Rupees in billion)
0
50
100
150
200
2007 2008 2009 2010 2011 2012
Trade and Guarantees(Rupees in billion)
Guarantees Exports Imports
across the country are fully equipped to handle the day to day needs of branchless banking customers.
Risk management
Askari Bank fully understands the importance and significance of strong risk management in addition to internal control systems. For mitigation of various risks that the Bank is inherently exposed to; effective risk management frame-work is in place for timely identification, control, monitoring, and assessment of such risks. We have achieved consider-able advancement in implementing the management of change in our institu-tional culture responsive to a dynamic environment.
Human resource
We recognize our human resource as the key element in offerings and deliverables to our valued customers and as such, places greater emphasis on the attraction, development, retention and motivation of our work force. The Bank’s three training academies fully equipped to meet the growing training needs of the Bank’s em-ployees. Additionally, effective application of job rotation and job enrichment aims at enhancing employees’ exposure across
different activities and functions within the Bank
AppreciationsThe management and staff of the Bank worked tirelessly to achieve the results of 2012. I take this opportunity to thank all employees for a job well done.
Our Board of Directors took keen interest in the affairs of the Bank and in setting up the strategic direction and formula-tion of policies. I would like to thank them for the guidance and counsel they extended to the management in conduct-ing the affairs of the Bank. I also like to thank the State Bank of Pakistan, the Securities and Exchange Commission of Pakistan, and our valued customers for their patronage and support, trust, and invaluable contribution.
M. R. MehkariFebruary 18, 2013
33
Annual Report of Askari Bank Limited for 2012
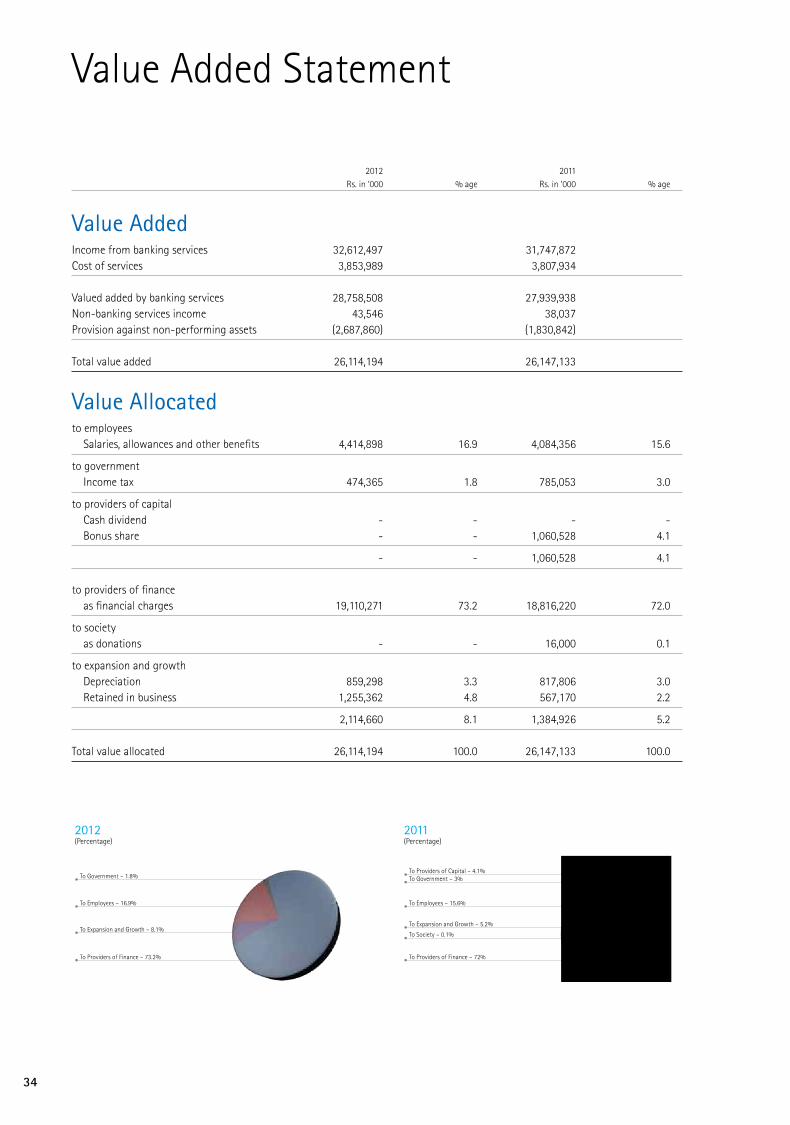
Value Added Statement
2012 2011 Rs. in ‘000 % age Rs. in ‘000 % age
Value AddedIncome from banking services 32,612,497 31,747,872 Cost of services 3,853,989 3,807,934 Valued added by banking services 28,758,508 27,939,938 Non-banking services income 43,546 38,037 Provision against non-performing assets (2,687,860) (1,830,842) Total value added 26,114,194 26,147,133
Value Allocated to employees Salaries, allowances and other benefits 4,414,898 16.9 4,084,356 15.6
to government Income tax 474,365 1.8 785,053 3.0
to providers of capital Cash dividend - - - - Bonus share - - 1,060,528 4.1
- - 1,060,528 4.1
to providers of finance as financial charges 19,110,271 73.2 18,816,220 72.0
to society as donations - - 16,000 0.1
to expansion and growth Depreciation 859,298 3.3 817,806 3.0 Retained in business 1,255,362 4.8 567,170 2.2
2,114,660 8.1 1,384,926 5.2 Total value allocated 26,114,194 100.0 26,147,133 100.0
2011(Percentage)
To Employees – 15.6%
To Government – 3%To Providers of Capital – 4.1%
To Expansion and Growth – 5.2%
To Society – 0.1%
To Providers of Finance – 72%
2012(Percentage)
To Employees – 16.9%
To Government – 1.8%
To Expansion and Growth – 8.1%
To Providers of Finance – 73.2%
34

Our Network
North Region Islamabad 19 Rawalpindi I 20 Rawalpindi II 16 Peshawar 13 Azad Kashmir 8 Corporate 1 Islamic 12
89
Central Region
Lahore I 13 Lahore II 13 Sahiwal 12 Faisalabad 10 Gujranwala 12 Multan 12 Corporate 1 Islamic 12
85
South Region Karachi I 11 Karachi II 12 Karachi III 12 Karachi IV 14 Hyderabad 16 Quetta 10 Corporate 1
Islamic 10
86
Branch contact details can be accessed at Bank’s website: www.askaribank.com.pk
Wholesale Bank Branch (Bahrain) 1
Total branches / sub-branches 261
35
Annual Report of Askari Bank Limited for 2012
35
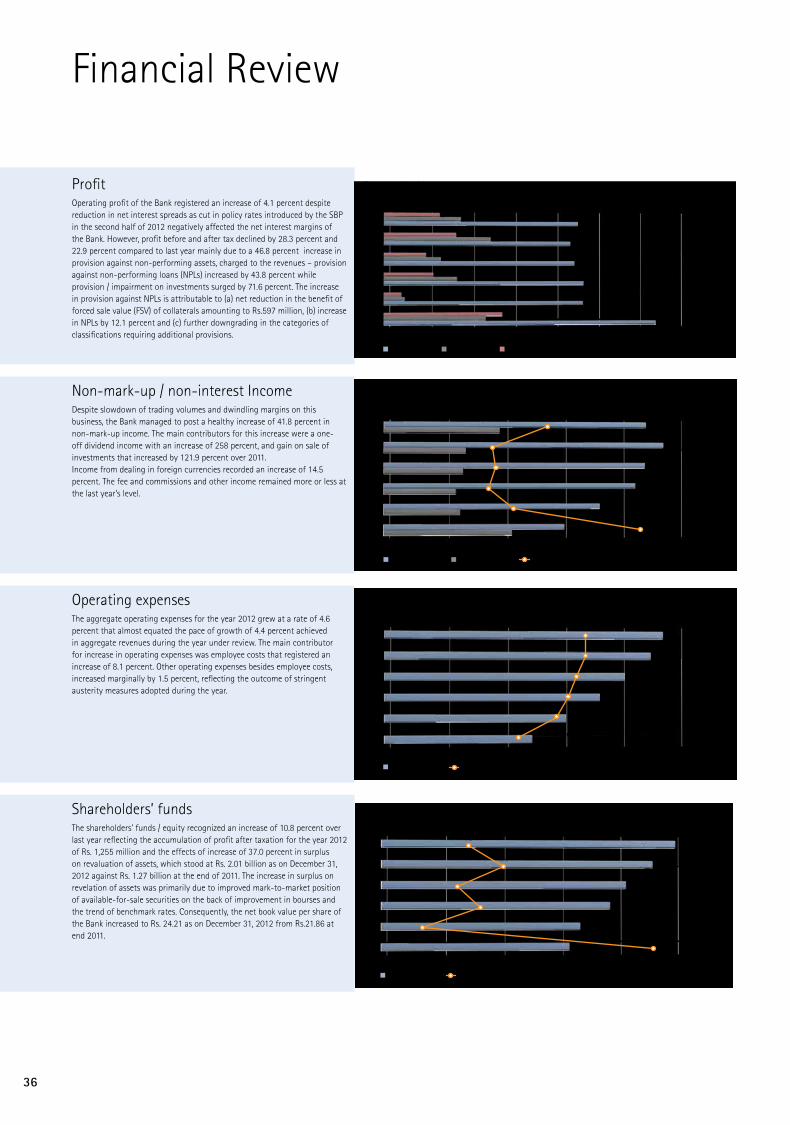
Financial Review
ProfitOperating profit of the Bank registered an increase of 4.1 percent despite reduction in net interest spreads as cut in policy rates introduced by the SBP in the second half of 2012 negatively affected the net interest margins of the Bank. However, profit before and after tax declined by 28.3 percent and 22.9 percent compared to last year mainly due to a 46.8 percent increase in provision against non-performing assets, charged to the revenues – provision against non-performing loans (NPLs) increased by 43.8 percent while provision / impairment on investments surged by 71.6 percent. The increase in provision against NPLs is attributable to (a) net reduction in the benefit of forced sale value (FSV) of collaterals amounting to Rs.597 million, (b) increase in NPLs by 12.1 percent and (c) further downgrading in the categories of classifications requiring additional provisions.
Non-mark-up / non-interest IncomeDespite slowdown of trading volumes and dwindling margins on this business, the Bank managed to post a healthy increase of 41.8 percent in non-mark-up income. The main contributors for this increase were a one-off dividend income with an increase of 258 percent, and gain on sale of investments that increased by 121.9 percent over 2011. Income from dealing in foreign currencies recorded an increase of 14.5 percent. The fee and commissions and other income remained more or less at the last year’s level.
Operating expensesThe aggregate operating expenses for the year 2012 grew at a rate of 4.6 percent that almost equated the pace of growth of 4.4 percent achieved in aggregate revenues during the year under review. The main contributor for increase in operating expenses was employee costs that registered an increase of 8.1 percent. Other operating expenses besides employee costs, increased marginally by 1.5 percent, reflecting the outcome of stringent austerity measures adopted during the year.
Shareholders’ fundsThe shareholders’ funds / equity recognized an increase of 10.8 percent over last year reflecting the accumulation of profit after taxation for the year 2012 of Rs. 1,255 million and the effects of increase of 37.0 percent in surplus on revaluation of assets, which stood at Rs. 2.01 billion as on December 31, 2012 against Rs. 1.27 billion at the end of 2011. The increase in surplus on revelation of assets was primarily due to improved mark-to-market position of available-for-sale securities on the back of improvement in bourses and the trend of benchmark rates. Consequently, the net book value per share of the Bank increased to Rs. 24.21 as on December 31, 2012 from Rs.21.86 at end 2011.
0 2,200 4,400 6,600 8,800 11,000
2012
2011
2010
2009
2008
2007
(Rupees in million)
Net Interest Income Non-interest Income
44%
29%
30%
28%
35%
71%
Non-interest income to net interest income
0 2,000 4,000 6,000 8,000 10,000
2012
2011
2010
2009
2008
2007
(Rupees in million)
67%
67%
64%
61%
57%
44%
Operating Expenses Cost to Income (CIR)
(Rupees in million)
0 1,000 2,000 3,000 4,000 5,000 6,000 7,000
2012
2011
2010
2009
2008
2007
Operating Pro�t Pro�t before tax Pro�t after tax
0 4,000 8,000 12,000 16,000 20,000
2012
2011
2010
2009
2008
2007
(Rupees in million)
7%
10%
6%
8%
3%
23%
Shareholder’s Funds Return on Average Shareholder’s Fund
36

Customer depositsCustomer deposits as on December 31, 2012, registered a growth of around 5.3 percent over last year. The major increase was in current and saving accounts (CASA), which climbed by 14.5 percent while term deposits registered a decrease of 15.5 percent. The average deposit size almost maintained its level.
Non-performing loansThe NPLs of the Bank as on December 31, 2012 were increased by 12.1 percent over last year reflecting a net addition of Rs.2.87 billion. The increase is mainly in ‘loss’ and ‘doubtful’ categories of classification, which showed a rise of 8.0 percent and 72.9 percent, respectively. As a result, provision against NPLs charged to revenues increased by 43.7 percent also partly due to expiry of the FSV benefit as already discussed; which was much greater than the net increase in NPLs. The combination of factors i.e., growth in NPLs and decrease in gross advances, resulted in NPL-to-advances ratio to increase from 14.1 percent of the last year to 16.3 percent at end 2012. The coverage ratio, however, improved by almost 164 basis points due to recording additional provisions against NPLs as discussed above.
Earnings per share The EPS of the Bank for the year 2012 was recorded at Rs.1.54 against Rs.2.00 of the corresponding period, last year, reflecting a decrease of 22.9 percent primarily due to increase in provisions / impairment against non-performing assets.
Return on average assetsThe RoA of the Bank for the year 2012 decreased by around 13 bps mainly due to a 22.9 percent decline in profits after taxation along with increase in average assets by 5.8 percent of the Bank during 2012 .
0 50 100 150 200
2012
2011
2010
2009
2008
2007
(Rupees in billion)
Current Saving Time Others
0 2 4 6 8 10
2012
2011
2010
2009
2008
2007
(Rupees)
0 5 10 15 20 25 30
2012
2011
2010
2009
2008
2007
(Rupees in billion)
6.40%
16.28%
14.10%
12.80%
12.00%
8.40%
Non-Performing Loans NPLs as % of Gross Advances
0 50 100 150 200 250 300 350 400
2012
2011
2010
2009
2008
2007
(Percentage)
1.54%
0.36%
0.49%
0.33%
0.48%
0.20%
Total Assets (Rs. in billion) Return on Average Assets (RoA)
37
Annual Report of Askari Bank Limited for 2012

Financial Calendar
2012
1st Quarter Results issued on April 25, 20122nd Quarter Results issued on August 28, 20123rd Quarter Results issued on October 19, 201221st Annual Results issued on February 18, 201321st Annual General Meeting scheduled for March 28, 2013 2011
1st Quarter Results issued on April 26, 20112nd Quarter Results issued on August 24, 20113rd Quarter Results issued on October 18, 201120th Annual Results issued on February 14, 201220th Annual General Meeting held on March 29, 201215% bonus shares issued April 16, 2012
Summarized Quarterly Financial Results
2012 2011
Rupees in million 1st Qtr 2nd Qtr 3rd Qtr 4th Qtr 1st Qtr 2nd Qtr 3rd Qtr 4th Qtr
Financial Position
AssetsCash,short term funds & statutory deposits with SBP 34,970 26,416 37,430 39,618 31,788 31,022 31,040 33,995 Investments 137,299 133,687 147,534 145,378 113,134 125,588 121,335 133,757 Advances 148,000 155,209 148,531 143,727 139,336 147,570 150,164 150,711 Operating fixed assets 9,246 9,134 8,988 8,841 9,907 9,685 9,551 9,349 Other assets 14,778 17,485 16,180 15,491 13,973 15,544 16,078 15,945 Total assets 344,293 341,932 358,664 353,056 308,137 329,410 328,167 343,756
Liabilities Borrowings from financial institutions 26,583 10,185 26,070 8,373 23,464 19,719 38,042 17,273 Customers deposits 280,712 294,488 293,239 306,937 249,758 274,710 255,353 291,503 Sub-ordinated loans 6,990 6,989 6,988 6,987 5,992 5,991 5,991 6,990 Other liabilities 11,557 11,494 12,127 11,070 12,309 12,205 11,429 10,213 Total liabilities 325,842 323,156 338,424 333,368 291,523 312,625 310,815 325,980
Shareholders’ funds Share capital 8,131 8,131 8,131 8,131 7,070 7,070 7,070 7,070 Reserves and unapprpriated profit 8,952 9,385 9,761 9,547 8,360 8,512 8,815 9,439 Surplus on revaluation of assets 1,369 1,260 2,348 2,011 1,184 1,203 1,467 1,267 Total shareholders’ funds 18,451 18,776 20,240 19,688 16,614 16,785 17,352 17,776
Profit & Loss
Total income 9,533 9,574 9,207 8,206 9,029 8,404 9,392 8,845 Mark-up / return / interest earned 8,541 8,469 8,314 7,078 8,442 7,607 8,887 7,830 Mark-up / return / interest expensed 6,174 6,173 5,784 4,843 5,475 5,529 6,170 5,526 Net mark-up / interest income 2,367 2,296 2,530 2,235 2,967 2,078 2,717 2,305 Non - mark-up / interest income 992 1,105 893 1,128 587 796 505 1,014 Fee, commission and exchange income 255 365 228 306 295 353 262 284 Other income 737 739 665 822 292 444 244 730 Operating expenses 2,097 2,349 2,567 2,115 2,197 1,946 2,297 2,286 Provisions against non-performing assets 462 277 301 1,648 542 678 417 195 Operating profit 1,262 1,052 855 1,247 1,357 929 925 1,033 Profit before tax 801 775 554 (400) 815 251 508 838 Taxation 227 251 179 (182) 277 86 208 215 Profit after taxation 574 525 375 (218) 538 165 301 624
Ratios (percent) Return on average shareholders’ funds (RoE) 12.7% 11.3% 7.7% -4.4% 13.2% 4.0% 7.0% 14.2%Return on average assets (RoA) 0.7% 0.6% 0.4% -0.2% 0.7% 0.2% 0.4% 0.7%
38

Share & Debt Information
1.3 Share price and volume (Rupees in billion) (Rupees)
Year Askari’s Askari’s Askari’s KSE’s Askari’s Askari Askari Askari Askari’s number of Number of Shareholders’ Market market share in market High Low Close shares traded Shares funds capitalization capitalization capitalization During the year During the year at December 31 during the year
2001 103,553,663 2.58 1.38 297.42 0.46% 16.45 10.35 13.30 51,396,000 2002 108,731,400 4.17 2.92 595.21 0.49% 27.90 13.50 26.85 36,984,000 2003 114,168,000 5.05 5.88 951.45 0.62% 53.90 21.30 51.50 96,059,000 2004 125,584,800 6.02 11.80 1,723.45 0.68% 98.25 50.61 94.00 1,043,563,300 2005 150,701,684 8.81 19.11 2,746.56 0.93% 133.25 70.00 126.80 612,803,600 2006 200,433,239 11.05 21.04 2,771.11 0.76% 145.00 68.00 104.95 444,476,500 2007 300,649,859 12.27 29.99 4,329.91 0.69% 128.75 75.50 99.75 1,628,929,400 2008 405,877,308 12.97 5.91 1,857.18 0.32% 106.20 14.57 14.57 382,990,000 2009 507,346,700 14.95 13.85 2,753.54 0.50% 28.69 12.15 27.30 190,782,242 2010 642,744,335 16.00 11.37 3,268.95 0.35% 31.14 12.70 17.69 132,010,181 2011 707,018,400 17.78 7.09 2,945.78 0.24% 19.25 8.50 10.03 110,231,037 2012 813,071,084 19.69 14.00 4,242.28 0.33% 17.75 9.89 17.22 462,420,623
1.4 Record of share issues Year Issue Number of shares Share capital (Rs)
Prior to public issue 15,000,000 150,000,000 1992 Public issue 15,000,000 150,000,000 1993 50% Rights issue @ Rs.10 per share 15,000,000 150,000,000 1995 Bonus @ 15% 6,750,000 67,500,000 1996 50% Rights issue @ Rs.20 per share 22,500,000 225,000,000 1996 Bonus @ 10% 7,425,000 74,250,000 1997 Bonus @ 15% 12,251,250 122,512,500 1998 Bonus @ 5% 4,696,312 46,963,120 2001 Bonus @ 5% 4,931,101 49,311,010 2002 Bonus @ 5% 5,177,712 51,777,120 2003 Bonus @ 5% 5,436,568 54,365,680 2004 Bonus @ 10% 11,416,794 114,167,940 2005 Bonus @ 20% 25,116,947 251,169,474 2006 Bonus @ 33% 49,731,555 497,315,549 2007 Bonus @ 50% 100,216,620 1,002,166,196 2008 Bonus @ 35% 105,227,450 1,052,274,496 2009 Bonus @ 25% 101,469,326 1,014,693,261 2010 Share issued to shareholders of erstwhile Askari Leasing Limited 28,273,315 282,733,150 2010 Bonus @ 20% 107,123,990 1,071,239,900 2011 Bonus @ 10% 64,274,460 642,744,604 2012 Bonus @ 15% 106,052,684 1,060,526,840 813,071,084 8,130,710,840
2. Debts Information 2.1 Askari Bank has issued the following Term Finance Certificates (TFCs) - unsecured sub-ordinated debt, listed on the Lahore Stock Exchange (LSE). (Rupees in million) TFC - I TFC - II TFC - III TFC - IV
IPO investors 1,000 1,125 2,375 1,000 General Public 500 226 19 - Underwriters - 149 606 - 1,500 1,500 3,000 1,000 Market Symbols / IDs at LSE AKBLTFC AKBLTFC2 AKBLTFC3 AKBLTFC4 Rating by PACRA AA– AA– AA– AA– Market Price as at December 31, 2012 (based on marketable lots of Rs. 5,000 and Rs. 1,000,000) 5,000 5,000 5,000 1,000,000 Applicable Interest Rate (p.a.) as at December 31, 2012 11.07% 13.24% 11.99% 11.19%
1. Share Information
1.1 The ordinary shares of Askari Bank Limited are listed on the Karachi, Lahore and Islamabad stock exchanges. The audited financial statements have been submitted to the stock exchanges within the requisite notice periods as required by the relevant regulations. Askari Bank’s Central Depository System ID is 05132.
1.2 Market symbols
Karachi Stock Exchange – AKBL, Reuters – ASKB.KA, Bloomberg – AKBL: PA
Price Volume Chart(During the year 2012)
0
2
4
6
8
10
12
14
16
18
20
0
18,000
16,000
14,000
12,000
10,000
8,000
6,000
4,000
2,000
No. of Shares in ‘000’ Rupees Per Share
Volume Average share price
Quarterly Price Volume Chart(During the year 2007 to 2012)
0
20
40
60
80
100
120
140
Q12007
Q2 Q3 Q4 Q12008
Q2 Q3 Q4 Q12009
Q2 Q3 Q4 Q12010
Q2 Q3 Q4 Q12011
Q2 Q3 Q4 Q12012
Q2 Q3 Q4
HighClosingOpening
Closing Price > Opening Price
Low
Closing Price < Opening Price
HighClosingOpening
Low
39
Annual Report of Askari Bank Limited for 2012

Horizontal & Vertical Analysis
Horizontal AnalysisSource Data FINANCIAL POSITION 2012 2011 2010 2009 2008 2007 Vs Vs Vs Vs Vs Vs 2012 2011 2010 2009 2008 2007 2011 2010 2009 2008 2007 2006 2012 2011 2010 2009 2008 2007 Rupees in million Variance Variance Assets Cash and balances with treasury banks 24,435 26,168 22,565 19,386 16,030 13,356 -7% 16% 16% 21% 20% -10% 7% 8% 7% 8% 8% 7%Balances with other banks 8,864 6,235 3,785 8,364 3,955 3,497 42% 65% -55% 111% 13% -52% 3% 2% 1% 3% 2% 2%Lendings to financial institutions 6,319 1,592 9,172 4,614 4,480 14,444 297% -83% 99% 3% -69% 72% 2% 0% 3% 2% 2% 8%Investments 145,378 133,757 102,260 67,046 35,678 39,431 9% 31% 53% 88% -10% 38% 41% 39% 32% 26% 17% 22%Advances 143,727 150,711 152,784 135,034 128,818 100,780 -5% -1% 13% 5% 28% 2% 41% 44% 49% 53% 62% 55%Operating fixed assets 8,841 9,349 9,988 9,262 8,266 5,128 -5% -6% 8% 12% 61% 35% 3% 3% 3% 4% 4% 3%Other assets 15,491 15,945 14,190 10,621 8,964 5,535 -3% 12% 34% 18% 62% 45% 4% 5% 5% 4% 4% 3% 353,056 343,756 314,745 254,327 206,191 182,172 3% 9% 24% 23% 13% 10% 100% 100% 100% 100% 100% 100%Liabilities Bills payable 3,700 2,756 3,090 2,946 2,585 2,627 34% -11% 5% 14% -2% 43% 1% 1% 1% 1% 1% 2%Borrowings 8,373 17,273 25,555 19,300 15,190 17,554 -52% -32% 32% 27% -13% 17% 3% 5% 9% 8% 8% 10%Deposits and other accounts 306,937 291,503 255,937 205,970 167,677 143,037 5% 14% 24% 23% 17% 8% 92% 89% 86% 86% 87% 84%Sub-ordinated loans 6,987 6,990 5,993 5,995 2,996 2,997 0% 17% 0% 100% 0% 0% 2% 2% 2% 3% 2% 2%Deferred tax liabilities 118 83 86 334 13 472 43% -3% -74% 2471% -97% -36% 0% 0% 0% 0% 0% 0%Other liabilities 7,252 7,374 8,081 4,833 4,759 3,220 -2% -9% 67% 2% 48% 24% 2% 2% 3% 2% 2% 2% 333,368 325,980 298,740 239,378 193,220 169,906 2% 9% 25% 24% 14% 10% 100% 100% 100% 100% 100% 100%Net Assets 19,688 17,776 16,004 14,949 12,971 12,266 11% 11% 7% 15% 6% 11% 6% 5% 5% 6% 6% 7% Represented by Share capital 8,131 7,070 6,427 5,073 4,059 3,006 15% 10% 27% 25% 35% 50% 41% 40% 40% 34% 31% 25%Reserves 8,542 8,136 7,691 7,236 7,667 6,950 5% 6% 6% -6% 10% 20% 43% 46% 48% 48% 59% 57%Unappropriated profit 1,004 1,302 702 834 309 2,143 -23% 86% -16% 170% -86% 19% 5% 7% 4% 6% 2% 17% 17,677 16,509 14,821 13,143 12,035 12,100 7% 11% 13% 9% -1% 26% 90% 93% 93% 88% 93% 99%Surplus on revaluation of assets - net of tax 2,011 1,267 1,184 1,806 936 166 59% 7% -34% 93% 463% -88% 10% 7% 7% 12% 7% 1% 19,688 17,776 16,004 14,949 12,971 12,266 11% 11% 7% 15% 6% 11% 100% 100% 100% 100% 100% 100%
PROFIT AND LOSS
Mark-up / return / interest earned 32,402 32,766 27,329 22,587 18,393 15,143 -1% 20% 21% 23% 21% 20% 100% 100% 100% 100% 100% 100%Mark-up / return / interest expensed 22,974 22,700 17,937 13,554 10,651 8,686 1% 27% 32% 27% 23% 24% 71% 69% 66% 60% 58% 57% Net mark-up / interest income 9,428 10,067 9,392 7,743 7,743 6,458 -6% 7% 21% 0% 20% 15% 29% 31% 34% 34% 42% 43% Provision against non-performing loans and advances 2,342 1,630 2,319 2,324 3,825 3,920 44% -30% 0% -39% -2% 247% 7% 5% 8% 10% 21% 26% Impairment loss on available for sale investment 143 122 383 431 - - 17% -68% 100% - - - 0% 0% 1% - - - Provision for impairment in the value of investments 201 44 297 77 1 2 362% -85% 286% 15015% -66% - 1% 0% 1% 0% 0% 0% Provision against repurchase agreement lending - 35 66 83 - - -100% -47% 100% - - - 0% 0% 0% - - - Bad debts written off directly 1 - - - 247 - - - - 100% - - - - - 0% - - 2,688 1,831 3,064 4,073 4,073 3,922 47% -40% -25% 0% 4% 248% 8% 6% 11% 18% 22% 26% Net mark-up / interest income after provisions 6,741 8,236 6,328 3,670 3,670 2,536 -18% 30% 72% 0% 45% -44% 21% 25% 23% 16% 20% 17%
Non mark-up / interest income Fee, commission and brokerage income 1,153 1,194 1,271 1,308 1,258 1,073 -3% -6% -3% 4% 17% 6% 4% 4% 5% 6% 7% 7% Dividend income 1,036 289 210 163 174 137 258% 38% 29% -6% 27% 25% 3% 1% 1% 1% 1% 1% Income from dealing in foreign currencies 885 772 731 538 874 656 15% 6% 36% -38% 33% 12% 3% 2% 3% 2% 5% 4% Gain on sale of investments - net 682 307 213 144 37 2,361 122% 45% 48% 291% -98% 1999% 2% 1% 1% 1% 0% 16% Unrealised gain on revaluation of investments - classified as held for trading - net 0 - (0) (2) 22 2 - -100% -82% -109% 1195% -175% 0% 0% 0% 0% 0% 0% Other income 361 340 376 404 343 337 6% -10% -7% 18% 2% 5% 1% 1% 1% 2% 2% 2% Total non-markup / interest income 4,117 2,903 2,800 2,707 2,707 4,565 42% 4% 3% 0% -41% 113% 13% 9% 10% 12% 15% 30% 10,858 11,139 9,128 6,377 6,377 7,101 -3% 22% 43% 0% -10% 7% 34% 34% 33% 28% 35% 47%Non mark-up / interest expenses Administrative expenses 9,039 8,639 7,813 6,996 5,904 4,790 5% 11% 12% 18% 23% 46% 28% 26% 29% 31% 32% 32% Other provisions / write offs 9 - - - 0 - - - - - - - - - - 0% - - Other charges 80 87 42 34 11 12 -7% 104% 24% 213% -9% 96% 0% 0% 0% 0% 0% 0% Total non-markup / interest expenses 9,128 8,726 7,855 5,916 5,916 4,802 5% 11% 33% 0% 23% 46% 28% 27% 29% 26% 32% 32%Profit before taxation 1,730 2,413 1,273 461 461 2,300 -28% 90% 176% 0% -80% -31% 5% 7% 5% 2% 3% 15% Taxation – current 839 833 330 562 17 99 1% 153% -41% 3138% -82% -90% 3% 3% 1% 2% 0% 1% Taxation – prior years’ - - - 120 (50) (234) - - -100% -340% -100% - - - 0% 1% 0% - Taxation – deferred (364) (48) 0 (147) 108 (246) 664% -14039% -100% -237% -144% -318% -1% 0% 0% -1% 1% -2% 475 785 330 75 75 (381) -39% 138% 339% 0% -120% -135% 1% 2% 1% 0% 0% -3%Profit after taxation 1,255 1,628 943 1,108 386 2,681 -23% 73% -15% 187% -86% 19% 4% 5% 3% 5% 2% 18% Unappropriated profit brought forward 1,302 702 834 309 2,145 1,800 86% -16% 170% -86% 19% 11% 4% 2% 3% 1% 12% 12% Profit available for appropriation 2,557 2,330 1,777 1,417 2,531 4,481 10% 31% 25% -44% -44% 16% 8% 7% 7% 6% 14% 30% Basic / diluted earnings per share - Rupees 1.54 2.00 1.34 1.79 0.76 6.61
40

Vertical Analysis FINANCIAL POSITION 2012 2011 2010 2009 2008 2007 Vs Vs Vs Vs Vs Vs 2012 2011 2010 2009 2008 2007 2011 2010 2009 2008 2007 2006 2012 2011 2010 2009 2008 2007 Rupees in million Variance Variance Assets Cash and balances with treasury banks 24,435 26,168 22,565 19,386 16,030 13,356 -7% 16% 16% 21% 20% -10% 7% 8% 7% 8% 8% 7%Balances with other banks 8,864 6,235 3,785 8,364 3,955 3,497 42% 65% -55% 111% 13% -52% 3% 2% 1% 3% 2% 2%Lendings to financial institutions 6,319 1,592 9,172 4,614 4,480 14,444 297% -83% 99% 3% -69% 72% 2% 0% 3% 2% 2% 8%Investments 145,378 133,757 102,260 67,046 35,678 39,431 9% 31% 53% 88% -10% 38% 41% 39% 32% 26% 17% 22%Advances 143,727 150,711 152,784 135,034 128,818 100,780 -5% -1% 13% 5% 28% 2% 41% 44% 49% 53% 62% 55%Operating fixed assets 8,841 9,349 9,988 9,262 8,266 5,128 -5% -6% 8% 12% 61% 35% 3% 3% 3% 4% 4% 3%Other assets 15,491 15,945 14,190 10,621 8,964 5,535 -3% 12% 34% 18% 62% 45% 4% 5% 5% 4% 4% 3% 353,056 343,756 314,745 254,327 206,191 182,172 3% 9% 24% 23% 13% 10% 100% 100% 100% 100% 100% 100%Liabilities Bills payable 3,700 2,756 3,090 2,946 2,585 2,627 34% -11% 5% 14% -2% 43% 1% 1% 1% 1% 1% 2%Borrowings 8,373 17,273 25,555 19,300 15,190 17,554 -52% -32% 32% 27% -13% 17% 3% 5% 9% 8% 8% 10%Deposits and other accounts 306,937 291,503 255,937 205,970 167,677 143,037 5% 14% 24% 23% 17% 8% 92% 89% 86% 86% 87% 84%Sub-ordinated loans 6,987 6,990 5,993 5,995 2,996 2,997 0% 17% 0% 100% 0% 0% 2% 2% 2% 3% 2% 2%Deferred tax liabilities 118 83 86 334 13 472 43% -3% -74% 2471% -97% -36% 0% 0% 0% 0% 0% 0%Other liabilities 7,252 7,374 8,081 4,833 4,759 3,220 -2% -9% 67% 2% 48% 24% 2% 2% 3% 2% 2% 2% 333,368 325,980 298,740 239,378 193,220 169,906 2% 9% 25% 24% 14% 10% 100% 100% 100% 100% 100% 100%Net Assets 19,688 17,776 16,004 14,949 12,971 12,266 11% 11% 7% 15% 6% 11% 6% 5% 5% 6% 6% 7% Represented by Share capital 8,131 7,070 6,427 5,073 4,059 3,006 15% 10% 27% 25% 35% 50% 41% 40% 40% 34% 31% 25%Reserves 8,542 8,136 7,691 7,236 7,667 6,950 5% 6% 6% -6% 10% 20% 43% 46% 48% 48% 59% 57%Unappropriated profit 1,004 1,302 702 834 309 2,143 -23% 86% -16% 170% -86% 19% 5% 7% 4% 6% 2% 17% 17,677 16,509 14,821 13,143 12,035 12,100 7% 11% 13% 9% -1% 26% 90% 93% 93% 88% 93% 99%Surplus on revaluation of assets - net of tax 2,011 1,267 1,184 1,806 936 166 59% 7% -34% 93% 463% -88% 10% 7% 7% 12% 7% 1% 19,688 17,776 16,004 14,949 12,971 12,266 11% 11% 7% 15% 6% 11% 100% 100% 100% 100% 100% 100%
PROFIT AND LOSS
Mark-up / return / interest earned 32,402 32,766 27,329 22,587 18,393 15,143 -1% 20% 21% 23% 21% 20% 100% 100% 100% 100% 100% 100%Mark-up / return / interest expensed 22,974 22,700 17,937 13,554 10,651 8,686 1% 27% 32% 27% 23% 24% 71% 69% 66% 60% 58% 57% Net mark-up / interest income 9,428 10,067 9,392 7,743 7,743 6,458 -6% 7% 21% 0% 20% 15% 29% 31% 34% 34% 42% 43% Provision against non-performing loans and advances 2,342 1,630 2,319 2,324 3,825 3,920 44% -30% 0% -39% -2% 247% 7% 5% 8% 10% 21% 26% Impairment loss on available for sale investment 143 122 383 431 - - 17% -68% 100% - - - 0% 0% 1% - - - Provision for impairment in the value of investments 201 44 297 77 1 2 362% -85% 286% 15015% -66% - 1% 0% 1% 0% 0% 0% Provision against repurchase agreement lending - 35 66 83 - - -100% -47% 100% - - - 0% 0% 0% - - - Bad debts written off directly 1 - - - 247 - - - - 100% - - - - - 0% - - 2,688 1,831 3,064 4,073 4,073 3,922 47% -40% -25% 0% 4% 248% 8% 6% 11% 18% 22% 26% Net mark-up / interest income after provisions 6,741 8,236 6,328 3,670 3,670 2,536 -18% 30% 72% 0% 45% -44% 21% 25% 23% 16% 20% 17%
Non mark-up / interest income Fee, commission and brokerage income 1,153 1,194 1,271 1,308 1,258 1,073 -3% -6% -3% 4% 17% 6% 4% 4% 5% 6% 7% 7% Dividend income 1,036 289 210 163 174 137 258% 38% 29% -6% 27% 25% 3% 1% 1% 1% 1% 1% Income from dealing in foreign currencies 885 772 731 538 874 656 15% 6% 36% -38% 33% 12% 3% 2% 3% 2% 5% 4% Gain on sale of investments - net 682 307 213 144 37 2,361 122% 45% 48% 291% -98% 1999% 2% 1% 1% 1% 0% 16% Unrealised gain on revaluation of investments - classified as held for trading - net 0 - (0) (2) 22 2 - -100% -82% -109% 1195% -175% 0% 0% 0% 0% 0% 0% Other income 361 340 376 404 343 337 6% -10% -7% 18% 2% 5% 1% 1% 1% 2% 2% 2% Total non-markup / interest income 4,117 2,903 2,800 2,707 2,707 4,565 42% 4% 3% 0% -41% 113% 13% 9% 10% 12% 15% 30% 10,858 11,139 9,128 6,377 6,377 7,101 -3% 22% 43% 0% -10% 7% 34% 34% 33% 28% 35% 47%Non mark-up / interest expenses Administrative expenses 9,039 8,639 7,813 6,996 5,904 4,790 5% 11% 12% 18% 23% 46% 28% 26% 29% 31% 32% 32% Other provisions / write offs 9 - - - 0 - - - - - - - - - - 0% - - Other charges 80 87 42 34 11 12 -7% 104% 24% 213% -9% 96% 0% 0% 0% 0% 0% 0% Total non-markup / interest expenses 9,128 8,726 7,855 5,916 5,916 4,802 5% 11% 33% 0% 23% 46% 28% 27% 29% 26% 32% 32%Profit before taxation 1,730 2,413 1,273 461 461 2,300 -28% 90% 176% 0% -80% -31% 5% 7% 5% 2% 3% 15% Taxation – current 839 833 330 562 17 99 1% 153% -41% 3138% -82% -90% 3% 3% 1% 2% 0% 1% Taxation – prior years’ - - - 120 (50) (234) - - -100% -340% -100% - - - 0% 1% 0% - Taxation – deferred (364) (48) 0 (147) 108 (246) 664% -14039% -100% -237% -144% -318% -1% 0% 0% -1% 1% -2% 475 785 330 75 75 (381) -39% 138% 339% 0% -120% -135% 1% 2% 1% 0% 0% -3%Profit after taxation 1,255 1,628 943 1,108 386 2,681 -23% 73% -15% 187% -86% 19% 4% 5% 3% 5% 2% 18% Unappropriated profit brought forward 1,302 702 834 309 2,145 1,800 86% -16% 170% -86% 19% 11% 4% 2% 3% 1% 12% 12% Profit available for appropriation 2,557 2,330 1,777 1,417 2,531 4,481 10% 31% 25% -44% -44% 16% 8% 7% 7% 6% 14% 30% Basic / diluted earnings per share - Rupees 1.54 2.00 1.34 1.79 0.76 6.61
41
Annual Report of Askari Bank Limited for 2012

Horizontal & Vertical Analysis contd.
0
10
20
30
40
50
60
70
80
90
100
2007 2008 2009 2010 2011 2012
Balance Sheet Vertical Analysis(Composition for the last six years)
Surplus on revaluation of assets - net of tax Unappropriated pro�t Reserves Share capitalOther liabilities Deferred tax liabilities Sub-ordinated loans Deposits and other accounts Borrowings Bills payable
0
10
20
30
40
50
60
70
80
90
100
2007 2008 2009 2010 2011 2012
Balance Sheet Vertical Analysis(Composition for the last six years)
Cash and balances with treasury banksBalances with other banksLendings to �nancial institutions InvestmentsAdvancesOperating �xed assetsOther assets
-40 -20 0 20 40 60 80
Balance Sheet Horizontal Analysis(Cumulative average growth rate for the last six year – annualised)
Surplus on revaluation of assets - net of tax
Unappropriated pro�t
Reserves
Share capital
Net assets
Other liabilities
Deferred tax liabilities
Sub-ordinated loans
Deposits and other accounts
Borrowings
Bills payable
Total assets
Other assets
Operating �xed assets
Advances
Investments
Lendings to �nancial institutions
Balances with other banks
Cash and balances with treasury banks
64.61
-14.07
-24.15
4.21
22.02
9.93
17.63
18.44
16.50
-13.76
7.09
14.15
29.82
22.85
11.51
7.36
-15.24
20.44
12.84
42

43
Annual Report of Askari Bank Limited for 2012

December 31 2007 2008 2009 2010 2011 2012
Assets Rupees in million
Advances - net 100,780 128,818 135,034 152,784 150,711 143,727 Investments 39,431 35,678 67,406 102,260 133,757 145,378 Cash, short term funds and statutory deposits with SBP 31,297 24,464 32,364 35,522 33,995 39,618 Operating fixed assets 5,128 8,266 9,262 9,988 9,349 8,841 Other assets 5,535 8,965 10,621 14,190 15,945 15,491 Total Assets 182,171 206,191 254,327 314,744 343,756 353,056 Non-performing loans 6,908 11,689 17,725 21,599 23,646 26,518 Provisions for non-performing loans 7,409 11,013 12,594 15,652 16,669 19,128
Liabilities Deposits 143,037 167,677 205,970 255,937 291,503 306,937 Refinance borrowings 9,918 13,902 13,700 12,425 9,277 7,775 Sub-ordinated loans 2,997 2,996 5,995 5,993 6,990 6,987 Other liabilities 13,954 8,645 13,713 24,386 18,248 11,669 Total liabilities 169,906 193,220 239,378 298,740 325,980 333,368
Shareholders’ funds Share capital 3,006 4,059 5,073 6,427 7,070 8,131 Reserves 9,093 7,976 8,070 8,393 9,439 9,547 Surplus on revaluation of assets 166 936 1,806 1,184 1,267 2,010 Total shareholders’ funds 12,265 12,971 14,949 16,004 17,776 19,688
Profitability Interest income 15,143 18,394 22,587 27,329 32,766 32,402 Interest expenditure 8,686 10,651 13,554 17,937 22,700 22,974 Net interest income 6,457 7,743 9,033 9,392 10,066 9,428 Provisions for non-performing assets 3,922 4,073 2,915 3,064 1,831 2,688 Fee, commission and exchange income 1,073 1,258 1,308 1,271 1,194 1,153 Other income 3,493 1,449 1,236 1,529 1,709 2,964 Operating expenses 4,802 5,916 7,030 7,855 8,726 9,128 Profit before taxation 2,299 461 1,631 1,273 2,412 1,730 Taxation (381) 75 534 330 785 474 Profit after taxation 2,680 386 1,098 943 1,627 1,255 Operating profit 6,222 4,534 4,546 4,338 4,244 4,418 Total income 19,709 21,101 25,131 30,129 35,669 36,520 Total expenditure 17,410 20,640 23,499 28,856 33,257 34,790
Cash flows Operating activities 8,370 2,597 36,245 35,810 36,492 10,939 Investing activities (13,527) 155 (32,063) (37,311) (31,456) (10,047)Financing activities (203) (446) 2,998 (3) 997 (4)Changes in cash & cash equivalents (5,360) 2,306 7,191 (1,501) 6,033 888 Cash & cash equivalents at end of the year 18,353 20,659 27,850 26,350 32,403 33,299
Business transacted Rupees in billion
Imports 119.27 148.24 140.16 177.32 166.51 143.30 Exports 82.98 99.70 105.41 105.11 112.71 98.03 Guarantees 44.31 55.77 58.55 67.55 59.63 69.92
Six Years’ Performance
44

2007 2008 2009 2010 2011 2012
Profitability Ratios Percentage
Profit before tax 15.19 2.51 7.22 4.66 7.36 5.34Gross Yield on Earning Assets 9.97 11.02 11.48 11.42 11.55 10.74Return on average assets (RoA) 1.54 0.20 0.48 0.33 0.49 0.36Gross Spread 42.64 42.10 39.99 35.83 30.72 29.10Cost to income (CIR) 43.56 56.61 60.73 64.42 67.28 67.39 Return on average shareholders’ funds (RoE) 22.99 3.06 7.85 6.09 9.64 6.70Return on Capital employed 4.75 0.59 1.43 1.00 1.06 0.59Liquidity Ratios Advance to deposits (CDR) 70.46 76.83 65.56 59.70 51.70 46.83Current 1.21 1.26 1.22 0.97 1.84 1.99Cash to Current Liabilities 0.15 0.15 0.17 0.13 0.24 0.26Investment/ market Ratios Price Earning (PE) 11.18 15.34 12.52 11.95 4.36 11.18Price to Book 0.16 0.03 0.05 0.04 0.02 0.04Dividend yield 1.50 - - - - - Dividend payout 16.82 - - - - -Cash dividends * 15.00 - - - - - Stock dividend * 35.00 25.00 20.00 10.00 15.00 - Earnings per share (EPS)** - Rupees 8.92 0.95 2.18 1.48 2.30 1.54 Market value per share - year end - Rupees 99.75 14.57 27.30 17.69 10.03 17.22Market value per share - high - Rupees 127.25 104.25 28.69 31.14 19.25 17.75Market value per share - low - Rupees 77.10 14.57 12.15 12.70 8.50 9.89Capital Structure Ratios Income / Expense 1.13 1.02 1.07 1.04 1.07 1.05Capital Adequacy (CAR) 9.35 9.22 11.75 10.30 11.35 11.81Earning assets to total assets 86.91 85.94 85.71 86.34 86.05 86.90Weighted average cost of deposits 5.33 5.49 6.19 6.51 6.87 6.77Net assets per share – including surplus on revaluation of assets 40.80 31.96 29.47 24.90 25.14 24.21Operating fixed assets to average shareholders’ funds 43.98 65.51 66.35 64.54 55.35 47.20
Other information Numbers Number of employees (Regular) 3,834 4,252 4,393 4,473 4,470 4,272 Number of branches / sub-branches 150 200 226 235 245 261
* post balance sheet event ** based on number of shares outstanding at each year end
45
Annual Report of Askari Bank Limited for 2012
Directors’ Reportto the Shareholders
Askari Bank (the Bank) is a scheduled commercial bank incorporated in 1991 and is engaged in banking business, as defined in the Banking Companies Ordinance, 1962. The Army Welfare Trust owns a significant portion of Bank’s share as on the date of annexed statement of financial position. Askari Bank operates with a network of 261 full service / sub-branches in major cities and towns of Pakistan and in Azad Jammu and Kashmir, and has a Wholesale Bank Branch in the Kingdom of Bahrain.
Subsidiary CompaniesAskari Investment Management Limited (AIML) and Askari Securities Limited (ASL) are the two subsidiary companies of the Bank with an ownership of 100 percent and 74 percent, respectively. The primary business of AIML is to manage mutual funds and provide advisory services. ASL is engaged in the business of share brokerage, investment advisory and related services.
Pakistan’s Banking SectorPakistan’s banking sector consists of scheduled commercial banks, Islamic banks, specialized banks, development finance institutions, investment banks, and microfinance institutions. Collectively, these institutions offer a wide array of products and services both on the assets and liabilities side, catering to the savings, investments, and financing needs of the country’s population, especially its business sectors and activities.
Prior to the banking industry reforms, banking business in Pakistan was predominantly in the public sector owing to the nationalization of banks during the 70s. In the early 90s, market-based reforms were introduced and the private sector was encouraged to supplement and support Pakistan’s banking sector. Over the years these reforms have transformed the major part of
On behalf of the Board of Directors, I am pleased to present the 21st Annual Report of Askari Bank along with the audited financial statements and Auditors’ reports thereon, for the year ended December 31, 2012.
our financial sector into a vibrant banking system backed by a strong legislative framework and an excellent regulatory and supervisory regime. The banking sector of Pakistan, which now comprises of 35 banks, includes 30 commercial banks, [24 indigenous and 6 foreign] and 5 Islamic banks, plays a pivotal role in the country’s economy.
The local private sector banks collectively hold approximately 80 percent of the assets of the banking system. Askari, an indigenous bank, operates in a highly competitive environment. It endeavours to manage and increase its market share by offering innovative products and services backed by improved service quality and efficient operational processes. Askari Bank’s share in total deposits and advances of scheduled banks as on December 31, 2012 stands at around 4.6 percent and 4.2 percent, respectively.
Pakistan’s EconomyThe resilience of Pakistan’s economy has been tested time and again by one crisis after another. The economy has witnessed numerous domestic and external shocks, especially from 2007 onwards. The sharp rise in oil and food prices, the internal security situation brought on by extremism and terrorism, the energy crises, and natural disasters in the form of successive floods, have influenced our macroeconomic strategy and had a drastic impact on economic growth.
Entity & BusinessEnvironment
46

Gross Domestic ProductsDuring fiscal 2012, real GDP grew by 3.7 percent and compares with the target of 4.2 percent and 3.0 percent for fiscal 2011. The under performance of the economy compared with the growth target was not surprising given the energy shortage, the security situation, and floods in two consecutive years. Nevertheless, growth in fiscal 2012 was more broad-based compared to fiscal 2011, and was somewhat more evenly distributed - agriculture sector recorded a growth of 3.1 percent against a target of 3.4 percent and against the previous year’s growth rate of 2.4 percent. Large scale manufacturing grew by 1.8 percent as compared to the target of 2.0 percent and against the growth of 1.2 percent in the previous year. The services sector recorded a steady growth of 4.0 percent as compared to 4.5 percent in the previous year, although lower than the target of 5.0 percent set for the fiscal 2012. Growth in fiscal 2012 was primarily driven by private consumption, strong worker remittances, a vibrant informal economy, and higher fiscal spending
supported consumption growth during the year. On the other hand, investment remained sluggish – a continuing trend over the past several years.
Inflation During fiscal 2012, actual inflation remained lower than the annual target and is amongst the key positive features for the year. After dropping to a single digit at 9.2 percent in January 2012, inflation stabilized and remained around 11-12 percent. This was mainly on account of a tight monetary policy and declining trend on global commodity prices. The main factor contributing to the rise in prices, that could also cause a further rise, is also the upward adjustment of energy, gas, and fuel prices. Economic managers are focusing on restricting inflation to 12 percent. Positive factors including better crops production and better supply chain management are expected to contribute to price stability in the country. Falling global commodity prices and steps towards fiscal consolidation could aid this process. However, long term solutions lie in increased investment in agriculture;
strong market integration; and regional cooperation to secure food supplies for the country’s growing population.
Monetary PolicyDuring fiscal 2012, SBP resorted to a cumulative reduction of 200 bps in the interest rate in the first two monetary policy announcements, reducing it to 12 percent. With the risks emanating from the external sector and increased government borrowing, monetary management aimed at improvement in economic activity remained challenging. Despite the reduction in interest rates, overall monetary expansion decelerated during fiscal 2012, largely due to the deterioration in the external account. The resulting depletion of foreign currency reserves absorbed Rupee liquidity from the money market. This, along with increasing government borrowing from commercial banks, underlined the need for liquidity injections into the system to keep the money market calm and was reflected by a sharp increase in the volume of open market operations. Credit expansion to the private sector remained
47
Annual Report of Askari Bank Limited for 2012
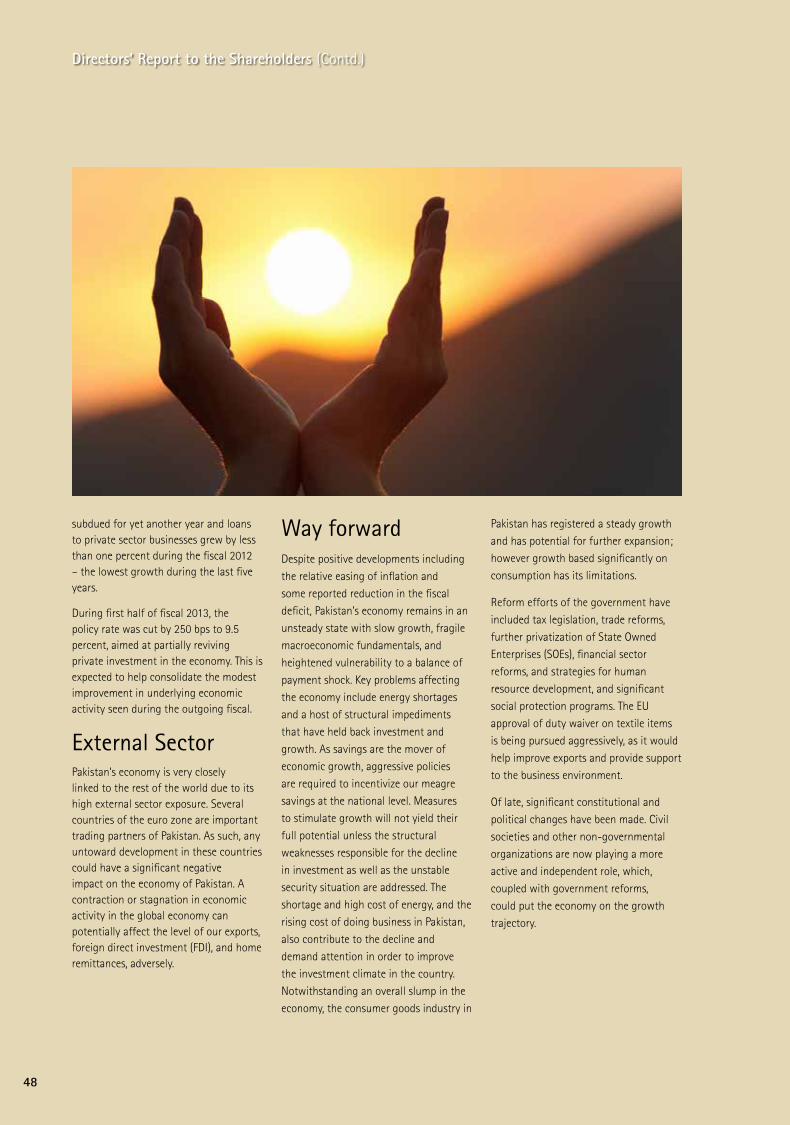
subdued for yet another year and loans to private sector businesses grew by less than one percent during the fiscal 2012 – the lowest growth during the last five years.
During first half of fiscal 2013, the policy rate was cut by 250 bps to 9.5 percent, aimed at partially reviving private investment in the economy. This is expected to help consolidate the modest improvement in underlying economic activity seen during the outgoing fiscal.
External SectorPakistan’s economy is very closely linked to the rest of the world due to its high external sector exposure. Several countries of the euro zone are important trading partners of Pakistan. As such, any untoward development in these countries could have a significant negative impact on the economy of Pakistan. A contraction or stagnation in economic activity in the global economy can potentially affect the level of our exports, foreign direct investment (FDI), and home remittances, adversely.
Way forwardDespite positive developments including
the relative easing of inflation and
some reported reduction in the fiscal
deficit, Pakistan’s economy remains in an
unsteady state with slow growth, fragile
macroeconomic fundamentals, and
heightened vulnerability to a balance of
payment shock. Key problems affecting
the economy include energy shortages
and a host of structural impediments
that have held back investment and
growth. As savings are the mover of
economic growth, aggressive policies
are required to incentivize our meagre
savings at the national level. Measures
to stimulate growth will not yield their
full potential unless the structural
weaknesses responsible for the decline
in investment as well as the unstable
security situation are addressed. The
shortage and high cost of energy, and the
rising cost of doing business in Pakistan,
also contribute to the decline and
demand attention in order to improve
the investment climate in the country.
Notwithstanding an overall slump in the
economy, the consumer goods industry in
Pakistan has registered a steady growth
and has potential for further expansion;
however growth based significantly on
consumption has its limitations.
Reform efforts of the government have
included tax legislation, trade reforms,
further privatization of State Owned
Enterprises (SOEs), financial sector
reforms, and strategies for human
resource development, and significant
social protection programs. The EU
approval of duty waiver on textile items
is being pursued aggressively, as it would
help improve exports and provide support
to the business environment.
Of late, significant constitutional and
political changes have been made. Civil
societies and other non-governmental
organizations are now playing a more
active and independent role, which,
coupled with government reforms,
could put the economy on the growth
trajectory.
Directors’ Report to the Shareholders (Contd.)
48
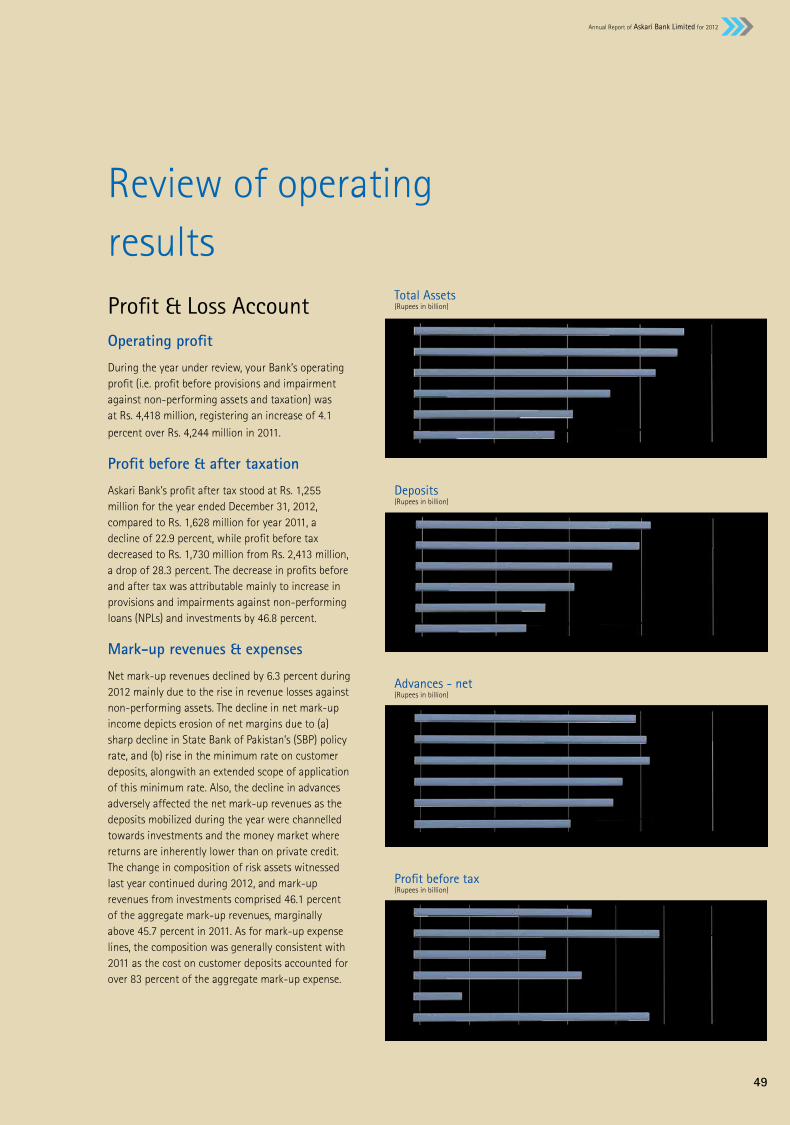
Review of operating resultsProfit & Loss AccountOperating profit
During the year under review, your Bank’s operating profit (i.e. profit before provisions and impairment against non-performing assets and taxation) was at Rs. 4,418 million, registering an increase of 4.1
percent over Rs. 4,244 million in 2011.
Profit before & after taxation
Askari Bank’s profit after tax stood at Rs. 1,255 million for the year ended December 31, 2012, compared to Rs. 1,628 million for year 2011, a decline of 22.9 percent, while profit before tax decreased to Rs. 1,730 million from Rs. 2,413 million, a drop of 28.3 percent. The decrease in profits before and after tax was attributable mainly to increase in provisions and impairments against non-performing loans (NPLs) and investments by 46.8 percent.
Mark-up revenues & expenses
Net mark-up revenues declined by 6.3 percent during 2012 mainly due to the rise in revenue losses against non-performing assets. The decline in net mark-up income depicts erosion of net margins due to (a) sharp decline in State Bank of Pakistan’s (SBP) policy rate, and (b) rise in the minimum rate on customer deposits, alongwith an extended scope of application of this minimum rate. Also, the decline in advances adversely affected the net mark-up revenues as the deposits mobilized during the year were channelled towards investments and the money market where returns are inherently lower than on private credit. The change in composition of risk assets witnessed last year continued during 2012, and mark-up revenues from investments comprised 46.1 percent of the aggregate mark-up revenues, marginally above 45.7 percent in 2011. As for mark-up expense lines, the composition was generally consistent with 2011 as the cost on customer deposits accounted for over 83 percent of the aggregate mark-up expense.
Deposits(Rupees in billion)
0 100 200 300 400
2012
2011
2010
2009
2008
2007
Total Assets(Rupees in billion)
0 100 200 300 400
2012
2011
2010
2009
2008
2007
Advances - net(Rupees in billion)
0 50 100 150 200
2012
2011
2010
2009
2008
2007
Pro�t before tax(Rupees in billion)
0 0.5 1.0 1.5 2.0 2.5 3.0
2012
2011
2010
2009
2008
2007
49
Annual Report of Askari Bank Limited for 2012

Non mark-up revenue
During 2012, aggregate non mark-up income increased by 41.8 percent on the back of a more than 300 percent increase in dividend income which was Rs. 1,036 million compared to Rs. 289 million last year. Also, gain from the sale of market securities increased by 121.9 percent during the year. Fee, commission, and brokerage income declined by 3.4 percent reflecting slowed down trading activity and eroding margins on trade finance. During the year under review, income from dealing in foreign currencies also registered a rise of 14.5 percent as the Bank was able to optimize on the arbitrage opportunities provided by the trends in foreign exchange dealings and transactions.
Operating expenses
Askari Banks’ aggregate operating and administrative expenses increased by 4.6 percent during the year under review, mainly reflecting the inflationary upsurge, increased recurring cost of the Bank’s major investment in information technology, and additional expenses on branches opened during the year, partially countered by the increased austerity measures implemented during the year under review, especially the reduction in staff strength. The cost to income ratio (CIR) i.e., percentage of administrative expenses to net total revenues, increased marginally to 67.4 percent for the year under review against 67.3 percent in 2011. This was mainly due to less than adequate increase in revenues as indicated above. The Bank is, however, committed to improving this vital performance indicator.
Provision against NPLs
During the year under review, the provisions for NPLs chargeable to revenues increased by 43.7 percent, which was due to additional classification of loan accounts resulting in a 12.2 percent increase in NPLs and further downgrade of the classified accounts to the categories requiring higher level of provisions – decrease in substandard by 13.8 percent and increase in doubtful and loss categories by 71.9 percent and 8.0 percent respectively. Also, the increase is attributable to a net additional provision of Rs. 597 million made during 2012 upon expiry of the benefit of permissible forced sales values (FSV) recognized in earlier years. The detailed financial impact of the FSV benefit on profits on revised and previous basis is explained in Note 10.6.2 of the annexed audited financial statements. The Bank has maintained general provisions @ 0.1 percent against performing loans other than consumer advances.
Earnings per share
The earnings per share for the year ended December 31, 2012 amounted to Rs. 1.54 per share against Rs. 2.00 per share in 2011 on a diluted basis, a decrease of 22.9 percent.
Earnings per share(Rupees)
0 1 2 3 4 5 6 7 8 9 10
2012
2011
2010
2009
2008
2007
Re�nance borrowing from SBP – 3.0%
Liability Mix - Cost Bearing(Percentage)
Sub-ordinated Loans – 2.7%
Saving Deposits – 64.7%
Fixed Deposits – 29.6%
Lendings to Financial Institutions – 1.8%
Assets Mix - Earning(Percentage)
Money market funds – 4.4%
Advances – 41.8%
Equity and debt instruments – 8.9%
Federal Government Securities – 36.0%
Cash and Balances with treasury banks– 7.1%
Directors’ Report to the Shareholders (Contd.)
50
Appropriations
The Board of Directors recommends the following appropriations from profits for the year ended December 31, 2012:
Rupees in thousand
Profit after tax for the year 2012 1,255,362
Appropriations: Statutory reserve @20% 251,072 Transferred to general reserve 1,004,290Total appropriations 1,255,362
Minimum paid-up capital requirement
SBP’s BSD Circular No. 7 dated April 15, 2009 sets out the minimum paid-up capital requirement (MCR) for banks to be raised to Rs. 10 billion in a phased manner by December 31, 2013. The required MCR (net of losses) as of December 31, 2012 is Rs. 9 billion. The paid-up capital of the Bank as of December 31, 2012 amounted to Rs. 8.13 billion, and thus remained short by Rs. 870 million of the prescribed level. As stated in note 1.2 of the annexed financial statements, the sale process of the Bank’s shareholding by AWT, also requires a public offer to be conducted under the Listed Companies (Substantial Acquisition of Voting Shares and Takeovers) Ordinance, 2002 read with Listed Companies (Substantial Acquisition of Voting Shares and Takeovers) Regulations, 2008. In terms of Regulation No. 7 of the said Regulations, and during the period stated therein, it is not possible for the Bank to issue any rights or bonus shares.
Based on the above, the management and the Board of Directors of the Bank, after taking into account that the Bank intends to meet the MCR as prescribed under the aforementioned SBP circular, have resolved that it is not possible to do so at present in view of the restriction imposed by Regulation No. 7 of the above stated Regulations. The Bank has also apprised the SBP and sought relaxation from meeting the minimum capital requirement of Rs. 9 billion for the year 2012.
Balance SheetYour Bank’s balance sheet footing reached Rs. 353 billion as at December 31, 2012, registering an increase of 2.7 percent over Rs. 344 billion as of December 31, 2011. The shareholders’ equity, excluding the surplus on the revaluation of assets, increased by 7.1 percent during the year.
Customer deposits
At the close of the year 2012, customer deposits had reached Rs. 307 billion from Rs. 292 billion on December 31, 2011, an increase of 5.3 percent. During the year, saving deposits increased by 15.8 percent and were 53.8 percent of the total deposits, compared to 48.9 percent at the close of 2011. Current accounts also registered improvement, in terms of 11.5 percent increase over 2011, as well as accounting for around 21.6 percent of the total deposits compared to 20.4 percent in 2011. The currency-wise composition of customer deposits showed a slight shift from foreign currency to local currency.
Advances
During the year under review, gross advances declined by 2.7 percent to Rs. 163 billion, from Rs. 167 billion at the close of 2011. This decline was driven by both internal and external factors. Externally, credit expansion remained subdued for yet another year as private sector credit was marginalized due to the shift in lending strategies - loans to private sector businesses grew by
less than one percent during the fiscal 2012 – the lowest growth rate since 2008. Internally, the Bank continued to be watchful of the enhanced levels of credit risk factors prevalent in the system, and of the impact of the growth of advances on the capital adequacy ratio. Given this situation, our credit strategy continued to focus on the growth of advances which offered optimal risk-adjusted returns. During the year under review, non-performing advances increased by 12.2 percent to Rs. 26.5 billion, from Rs. 23.6 billion at end 2011. This was mainly due to addition of certain accounts to the main classification categories as per SBP Prudential Regulations. Movement within the categories of classification shows that the NPL portfolio further downgraded: 13.8 percent reduction in the ‘substandard’ while 71.9 percent and 8.0 percent increase in ‘doubtful’ and ‘loss’ categories, respectively. Consequent upon the increase in NPLs and their further downgrade, the cumulative provision against non-performing advances stood at Rs. 19.1 billion, reflecting a net increase of 14.8 percent over 2011. The Bank has continued to pursue the two-fold strategy for achieving an improvement in NPLs through (a) expeditious recovery from the recognize non-performing loan portfolio and (b) restructuring / rescheduling of inflected loans, where appropriate.
At year end 2012, the ratio of non-performing advances as a percentage of gross advances deteriorated to 16.3 percent from 14.1 percent as of December 31, 2011, due to the disproportionate rise in NPLs compared with the overall decline in gross advances. Risk coverage of NPLs was 72.1 percent at end 2012, as against 70.5 percent in 2011. The classified accounts are being closely monitored and followed up for early revival and recovery. Strategies have been developed to enhance effective management of the loan portfolio by boosting recovery through concerted efforts to collect overdue amounts, and attempting to stem the further flow of accounts into NPLs.
51
Annual Report of Askari Bank Limited for 2012

Investments
Your Bank’s aggregate investments as shown in the annexed statement of financial position increased by 8.7 percent, from Rs. 134 billion at end 2011 to Rs. 145 billion as of December 31, 2012. A significant portion of this increase was concentrated in government securities, which also aimed to balance the increased requirement of prescribed liquidity management ratios. Other components of investments generally maintained the previous year’s level.
Assets acquired against claims
During the year, the Bank acquired properties worth Rs. 862 million against satisfaction of claims on borrowers, increasing the aggregate value of such properties held by the Bank to Rs. 4.29 billion (aggregate market value of Rs. 6.46 billion) at the end of 2012 compared to Rs. 3.49 billion (aggregate market value 5.50 billion) as on December 31, 2011. The cost of these assets is grouped in other assets (note 12 to the annexed financial statements).
Staff strength
The Bank’s total staff strength under the categories permanent (regular), temporary / contractual excluding outsourced services, as of December 31, 2012 was reduced by 397 employees and stood at 5,597 employees compared to 5,994 as on December 31, 2011. The reduction was in the number of permanent (regular) employees where the head count declined by 198 employees or 4.4 percent, and temporary / contractual staff, where head count showed a reduction of 199 or 13.1 percent. Thus increase in aggregate employee costs was restricted at 8.1 percent during 2012.
TechnologyThe technology infrastructure of the Bank has been undergoing a major overhaul under a project that involves the replacement of the core banking system as well as the implementation of a number of other applications aimed at enhancing the Bank’s capability to improve its customer services and product offerings, backed by improved control over operations and enhanced MIS.
Core banking and other applications
During the year under review, the Bank achieved significant progress towards the implementation of various technology initiatives. The core banking system, Flexcube, which is our major initiative, went into ‘live’ operations in all conventional banking branches, while implementation in Islamic banking branches and for centralized treasury management, is nearing completion of design, customization, and test phases. Also, Flexcube ‘version upgrade’ with improved control, MIS, and customer service features is being planned during first quarter
Staff loans – 3.4%
Advances by Sector(Percentage)
Commodity �nancing – 0.8%
Corporate– 38.9%
Commercial – 39.1%
SME – 6.7%
Agriculture– 4.0%
Consumer – 7.1%
Agri Business – 8.0%
Transport – 6%
Textile – 14%
Leather products & Shoes – 1%
Advances by Segment(Percentage)
Individuals – 10%
Miscellaneous – 35%
Synthetic & Rayon – 1%
Cement and Construction – 3.0%Financial Institutions – 0.5%Chemical & Pharmaceutical – 2.0%Food, beverages & Tobacco – 3.0%
Fuel, Energy & Engineering – 16.9%
Fuel, Energy & Tobacco – 13.1%
Food, beverages & Tobacco – 1.6%Cement & Construction – 8.3%
NPL by Sector(Percentage)
Textile – 42.9%
Agri Business – 3.3%
Leather products and shoes – 0.2%
Individuals – 11.3%
Miscellaneous – 19.3%
Directors’ Report to the Shareholders (Contd.)
52

of 2013. Other applications include human resource management, risk management, supply chain management, enterprise general ledger, and customer relationship management. Most of these systems are live with varying degrees of coverage and integration.
Other IT initiatives
As most of the new applications operate on central servers, the new IT infrastructure needed to be created at a central location with high availability and redundant data communication access mechanisms while ensuring security and business continuity. The Bank has therefore invested significantly in creating such an infrastructure. A new state of the art data center is fully operational in a Bank-owned building specifically designed to house technology infrastructure and facilities. A disaster recovery center has also been created in another Bank-owned premises with provision for real-time data replication to ensure minimal down-time even in case of a major disaster.
Risk Management FrameworkYour Bank has been pursuing a holistic approach towards the implementation of a sound risk management framework in all areas of banking activities as the risk management function is recognized as fundamental to the business of banking and it is an essential element of our banking strategy.
Bank’s risk management framework comprises of a risk management committee of the Board which oversees that risk policies, risk appetite, risk management methodologies, and risk measurement tools are in place. Also that it is supported by a risk management function that ensures implementation of these policies and the performance of these functions and that the risks are managed within the pre-defined and tolerable levels through effective monitoring across the Bank of the three main areas of risk namely, credit risk,
market risk, and operational risk. Our risk management framework is compliant with the relevant regulations, directives, and international best practices, including those relating to implementation of Basel-II.
Credit risk
In the area of credit risk management, a credit evaluation system comprising of well-designed credit appraisal, sanctioning procedures, and credit review arrangements, ensures that the lending decision are in line with the Bank’s strategic objectives, are prudent, and aim at maintaining asset quality at all times.
Market risk
Banking is inherently exposed to market risks, whether arising from changes in interest rates, currency exchange rates, credit spreads, or share prices. Our market risk management system attempts to ensure that various exposures in financial markets are managed actively consistent with maintaining an efficient risk return profile. In the area of market risks, the Bank applies the widely-used concept of value at risk (VaR). Also, the Asset Liability Management Committee closely monitors the sensitivities of interest rates and maturity profiles of assets and liabilities.
Operational risk
The Bank has established a
comprehensive operational risk management framework based on appropriate risk management architecture, which assesses and measures the operational risks arising from system, people, and processes.
Basel-II
The Basel II standardized approach is in use for calculating capital adequacy for credit risk, with a comprehensive approach for credit risk mitigation. Standardized approach is also used for capital allocation for credit risk and market risk, while allocation for capital required for operational risk is based on the basic indicators approach. Efforts are underway to move towards the more advanced approaches of Basel-II and necessary tools, and these techniques are in testing and implementation phases.
The Bank has implemented the credit risk environment administration management module that has automated the credit approval and risk rating processes, while Reveleus risk management software is in the advanced stages of implementation. Once completed, this will enable the Bank to automate capital allocation and monitoring implementation of Basel II foundation internal risk based approach for managing credit risk, as well as VaR model for market risk.
53
Annual Report of Askari Bank Limited for 2012

Human ResourceOur energetic human resource is recognized as our primary strength that contributes our product and service deliverables and is the key in the process of value addition to our shareholders. Human resource functions are continually updated and reviewed in accordance with our strategic direction and objectives. During the year under review, human resource strategies were aligned with the prevalent economic and business conditions and were focused on initiatives which aim to promote a performance-oriented environment where employees work with dedication and coordination.
The implementation of our human resource management software ‘PeopleSoft’ has enabled the centralization of the payroll, time and attendance, and absence management systems. This web-based system provides expanded online services for staff on HR-related matters. The advance modules of the system will automate many processes relating to selection and recruitment, training and development, performance management, and career and succession planning and are currently under review and test phases. The centralization of HR related activities will improve discipline and accountability, besides improving the compliance and service standards of the Bank.
Training & development
Our training and development teams continued their pursuit for quality training of Bank employees in line with our training policy. Training goals were determined in the light of the well-defined training need assessments. Our training facilities conducted 320 in-house courses, workshops, and skill development clinics, in the disciplines of service and attitude, management and communication, IT, credit and finance, international trade, domestic banking operations, and risk management. In IT-related training, special trainings programs were designed and conducted
Internal control over financial reporting
The Bank is in the process of adopting
an internationally accepted internal
control framework, as envisaged under
various SBP directives and guidelines.
To this end, the Bank has completed
detailed documentation of the existing
processes and controls, together with
a comprehensive gap analysis of the
control design. A detailed remediation
and testing plan is currently being
worked at alongwith changes in the
processes, resulting from advancements
in technology, as indicated above.
During 2012, the Bank continued its
focus in making the system of internal
controls more efficient and effective
in order to ensure that no material
compromise is made in implementing
the desired control procedures, and
that a suitable control environment is
maintained in general. However, the
process of identification, evaluation, and
management of significant risks is an
ongoing process, which the Bank actively
and vigilantly pursues.
Credit RatingA bank’s credit rating reflects, inter alia, its ability to protect its relative standing in the sector by competing effectively in the increasingly competitive environment in the banking sector and assumes its ability to take all measures necessary for the purpose.
Askari Bank has been assigned the long term rating of ‘AA’ and short term rating of ‘A1+’ by the Pakistan Credit Rating Agency Limited (PACRA). The ratings reflect the Bank’s strong capital structure supported by sound profitability. According to PACRA “these ratings reflect sustained ability of revenue growth from core operations while maintaining a low risk profile and also dynamic as well as an efficient fund deployment strategy. Going forward, given the strong technological platform and enhanced geographical
for existing and potential users of our core banking software ‘Flexcube’ and other softwares, in order to enable them to optimally utilize the software features for improved banking and customer services. The Bank will continue its endeavor to attract and retain the
talented human resource. .
Internal ControlsInternal controls contribute to effective management by the management and oversight by the Bank’s Board of Directors. The Board recognizes its responsibility as envisaged in the relevant regulations and has been keen on oversight and monitoring apart from adopting and reviewing appropriate policies. The management of the Bank tries its best to ensure the establishment and enforcement of effective systems of internal control in compliance with the applicable laws and regulations by identifying control objectives, and establishing appropriate controls, procedures and practices. It is also responsible for assessing the effectiveness of internal controls and report on them to the Board.
Most significant policies and procedural manuals are in place. Their review / updation and improvement is actively ongoing. The preparation of policy document and procedural manual for the others are being developed.
Under the Board’s directions, the management puts a system in place for the review of the authentication of transactions and scrutiny of collateral and documentation, and for identifying areas requiring improvement and devising appropriate remedial action. As stated above, a complete revamp of its existing IT platform is one of the major moves in this direction.
Although the internal control system in the Bank is designed to minimize the risk of failure, it is recognized that these cannot be eliminated completely. The best that could be done is to keep inevitable failures within tolerable limits.
Directors’ Report to the Shareholders (Contd.)
54

55
Annual Report of Askari Bank Limited for 2012

outreach, the Bank is well positioned to maintain its competitive edge despite an increasingly competitive operations environment.”
Capital AdequacyAs of December 31, 2012, your Bank’s capital adequacy ratio (CAR) stood at 11.8 percent against last year’s 11.4 percent, while the SBP’s minimum prescribed requirement stands at 10 percent. The improvement in CAR is mainly due to growth in equity i.e. total eligible capital due to retention of profits, and risk profiling of assets carried out during the year. The Bank will continue this process by creating awareness amongst risk-takers to be cognizant of the risk-adjusted return, when making decisions that involves risks.
Branch NetworkYour Bank is fully aware that the outreach of its branch network has direct implications for the services that it provides to its valued customers. During the year, your bank opened 12 new conventional banking branches and 4 Islamic banking branches. We now offer services through a network of 261 full service / sub-branches, including 34 dedicated Islamic banking branches / sun-branches, and a Wholesale Bank Branch in Bahrain. Through this network, the Bank is able to offer our wide range of products and services to our customers. Given the current economic conditions, your Bank will continue to place emphasis on the consolidation of recent expansion, and incremental expansion.
Branchless Banking “Timepey”In 2012, the Bank and China Mobile Pakistan (CMPak) have jointly launched a major initiative, branchless banking program under the brand name of ‘Timepey’. Branchless banking has already taken root in Pakistan and is all poised to become a formidable alternative to conventional banking. A mobile
and 2 sub-branches, are based entirely on Shariah principles. Special care is exercised to ensure that there is no mixing of funds between conventional and Islamic banking. During 2012, Islamic banking posted a profit of Rs. 75.8 million, a 23.1 percent decrease over last year’s Rs. 98.5 million. The decline is mainly due to increase in provision / impairment against investments by 179 percent – total net provision / impairment recorded during the year was Rs. 46.3 million against the last year’s net reversal of Rs. 78.3 million.
At the close of 2012, the asset-base of Islamic banking stood at Rs. 15.8 billion, an increase of 5.6 percent over Rs. 15.0 billion as of December 31, 2011. Customer deposits increased by 17.3 percent from Rs. 11.8 billion on December 31, 2011 to Rs. 13.9 billion, at the close of December 31, 2012. The increase in deposits was backed by the improvement in the deposit mix as we focused on relatively low-cost deposits on a Shariah compliant basis. The aggregate Islamic financing increased marginally to Rs. 3.1 billion during the year under review. Our sukuk investments portfolio increased by 3.9 percent from Rs. 9.9 billion at end 2011 to Rs. 10.5 billion as on December 31, 2012 mainly comprising of Government of Pakistan guaranteed ijarah sukuk instruments.
The Islamic Banking business of the Bank will gain further strength through an increased focus on automation, improvement in Shariah compliant areas of business, and effective marketing to create awareness of Askari Islamic banking, which shall be strategically used
phone with a SIM card can be used to enter, display, process, store, and transmit information, which provides an architecture to the banks for payments and transactions. The mobile phone enables the banks and their customers to interact from remote locations in a trusted manner either directly or through branchless banking agents.
By partnering with CMPak, the Bank has adapted its existing “brick and mortar” network and technology platform to a low-value, high-volume, transaction environment and has thus built a more scalable retail network of points at which people can conveniently pay into or cash out from their branchless banking accounts. The mainstay of the Bank’s branchless banking program will be to achieve a greater outreach to the customers regardless of location, time, economic condition, and gender, thereby providing opportunity to access banking services especially to the poorer, disadvantaged segment of the country as a viable business proposition, and as a counterpart, to provide the Bank greater penetration in the unbanked sector of the economy. We envisage that the branchless banking program of the Bank will contribute significantly in enhancing customer base and service quality thereby generating additional, cost effective resources, and revenues, for improving the performance of the Bank.
Islamic BankingOur Islamic product and service offerings available through our dedicated Islamic banking branch network of 32 full service
Directors’ Report to the Shareholders (Contd.)
56
to position our products more effectively in the market.
SubsidiariesAskari Investment Management Limited
Askari Investment Management Limited (AIML) is the first subsidiary of the Bank and is regulated under the Non-Banking Finance Companies and Notified Entities Regulation, 2007, and licensed by the Securities and Exchange Commission of Pakistan (SECP). The primary business of AIML is to launch and manage mutual funds investments. However, AIML also offers advisory services to institutional clients.
AIML is operating with seven open-end funds namely, 1) Askari Sovereign Cash Fund (ASCF), size Rs. 4,732.31 million; 2) Askari Sovereign Yield Enhancer, size 1,798.47 million 3) Askari High Yield Scheme, size Rs. 1,478.14 million; 4) Askari Islamic Income Fund, size Rs. 967.97 million; 5) Askari Asset Allocation Fund, size Rs. 230.13 million; 6) Askari Equity Fund, size Rs. 118.06 million and 7) Askari Islamic Asset Allocation Fund, size Rs. 133.45 million.
Catering to the needs of both individual and institutional investment segments, AIML and its funds follow an objective based investment methodology, where financial performance is defined as a return against an investment benchmark, as distinct from the conventional investing methodologies.
Consolidated financial statements of the Bank and AIML for the year ended December 31, 2012 are included in this annual report.
Askari Securities Limited
The Bank has a controlling interest in Askari Securities Limited (ASL) by virtue of acquiring 74 percent shares of ASL.
ASL is an incorporated public limited company and a corporate member of Islamabad Stock Exchange (Guarantee)
Limited, engaged primarily in share brokerage, and investment advisory and consultancy services. During the year, ASL mainly focused on positioning itself strategically in the market which was aided by acquisition of a seat at the Karachi Stock Exchange, and by upgraded technology infrastructure. Simultaneously, with the improved market sentiment ASL has been able to post better results during the year under review. With evidence of improving
investor confidence at the bourses, we believe that ASL will show better results in the years to come.
Consolidated financial statements of the Bank and ASL for the year ended December 31, 2012 are included in this annual report.
Corporate SustainabilityThe corporate sustainability of the Bank encompasses all areas of its activities, whether it be business or its operations; its relationships with regulator or customers; or its human resource; or caring for the society at large.
Core Values & ConductThe Bank strives to establish high standards of good governance and professionalism, transparency in its business and operational decisions, and fully secured and compliant systems and controls in order to protect interests of stakeholders. We at Askari Bank have defined a set of core values for ourselves – commitment, integrity, fairness, teamwork, and service – to guide us in all we do. Also, a comprehensive ‘code of ethics and conduct’ is in place, which is required to be read, understood, and signed by all employees each year. It serves as an aid and a guidance for discharging their duties diligently and in compliance with best practices. We, are cognizant of the need to work beyond financial considerations, and try to go the extra mile in order to ensure that we are perceived as a corporate body that exists not just for profits, but as a wholesome
entity created for the good of the society and for contributing to improve the quality of life of the communities we serve.
Corporate Social ResponsibilityAs a constructive partner in the communities in which it operates, Askari Bank has been taking concrete action to realize its social responsibility objectives, thereby building value and goodwill for its shareholders as well as its customers. For the last several years, the Bank has supported various social and community initiatives by supporting environmental and health care projects and social welfare, cultural, and educational programs. The notable contributions and events under CSR program are covered in this report separately.
Askari Bank is the bank of first choice for the Armed Forces of Pakistan and in this regard we offer special account operating facilities to foreign contingent and salary accounts. Branches and sub-branches are opened in cantonments and other army establishments where facilities offered include dedicated ATM machines.
57
Annual Report of Askari Bank Limited for 2012

Human ResourceThe Bank continued to invest in the development of its human capital. Our human resource policies try to ensure that we maintain high standards as an equal opportunity employer; we maintain special employment quota for special persons and encourage their hiring.
Safety and SecurityThe Bank is ISO 27001 certified. It takes care of occupational health and safety of people. It follows high standards of information security management thereby ensuring data security.
Contribution to ExchequerDuring 2012, the Bank contributed Rs. 1.6 billion (2011: Rs. 0.95 billion) to the national exchequer on account of income tax. Thus, a considerable portion of the net income that the Bank earned generated government revenue. A substantial amount was also deposited into the government treasury as a tax
collecting agent.
AwardsDuring the year, the Annual Report of the Bank for the year 2011 won the first prize of “The Best Annual Report” for the financial sector, instituted jointly by The Institute of Chartered Accountants of Pakistan and The Institute of Cost and Management Accountants of Pakistan.
Also, the annual report for 2011 has been adjudged for ‘merit certificates’ in the category of Private Banking Sector and SAARC Anniversary ‘Award for Corporate Governance’ by the South Asian Federation of Accountants (SAFA), an Apex body of the SAARC countries.
We are thankful for these recognitions of our good work by these esteemed professional organizations.
Corporate GovernancePattern of Shareholding The pattern of shareholding at the close
of December 31, 2012 is included in this
report.
Corporate and Financial Reporting Framework• Thefinancialstatements,prepared
by the management of the Bank, present fairly its state of affairs, the results of its operations, and the changes in equity and cash flows.
• ProperbooksofaccountsoftheBank have been maintained.
• Accountingpolicieshavebeenconsistently applied in preparation of these financial statements, and accounting estimates are based on reasonable and prudent judgment.
• InternationalAccountingStandards,as applicable to banking companies in Pakistan, have been followed in the preparation of these financial statements.
• Thesystemofinternalcontrol,which is in place, is being continuously reviewed by the Internal Audit and Inspection Division as are other relevant procedures. Such review processes will continue with a view to removing any weakness.
• TheBoardofDirectorsissatisfiedwith the Bank’s ability to continue as a going concern.
• Therehavebeennomaterialdepartures from the best practices of corporate governance as detailed
Directors’ Report to the Shareholders (Contd.)
58

in the Listing Regulation No. 37 of the Karachi Stock Exchange (Guarantee) Limited.
• Keyoperatingdataandfinancialdata for the last six years, in summarized form, are included in this report.
• Therearenostatutorypaymentsonaccount of taxes, duties, levies and charges which are outstanding as of December 31, 2012.
• Thefollowingisthevalueofinvestment as at December 31, 2012:
– Provident Fund Rs. 2,143 million, based on un-audited financial statements (December 31, 2011: Rs. 1,859 million)
– Gratuity Fund Rs. 991 million, based on un-audited financial statements (December 31, 2011: Rs. 850 million)
• During2012,ninemeetingsofthe Board of Directors were held. Attendance by each Director was as
follows:
Name of directors Attendance
Lt. Gen. Javed Iqbal 8(Chairman)
Lt. Gen. (R) Tahir Mahmood 9
Malik Riffat Mahmood 7
Mr. Zafar Alam Khan Sumbal 9
Dr. Bashir Ahmad Khan 4
Mr. Ali Noormahomed Rattansey 6
Mr. Shahid Mahmud 7
Mr. Muhammad Riyazul Haque 9
Mr. Wazir Ali Khoja 8
Khawaja Jalaluddin Roomi 6
Mr. M. R. Mehkari 9
(President & Chief Executive)
Performance Review Criteria President & Chief Executive
The stewardship position of President & Chief Executive is appraised by the Board on a periodic basis. The Board gives strategic direction to the President & Chief Executive through targets in the annual budgets and business plans whereby key operational, business, and financial targets are set, with a mechanism of regular monitoring. The performance against all financial and non-financial targets are periodically reviewed, with the directions for corrective measures, as necessary. The performance of President & Chief Executive is also evaluated based on the SBP inspections reports and independent review by auditors. Therefore, the BoD while giving full authority to President & Chief Executive, ensures that corporate goals and objectives remain aligned with the vision, and the mission, and the corporate objectives of the Bank.
Board of Directors
The Board’s role of oversight and its effectiveness is evaluated by the Board itself by reviewing contribution made by it, in terms of:
• Thoroughness–formingsubcommittees for important areas and devising their terms of reference and reviewing compliance there-against.
• Commitment–thenumberoftimesthe Board and its sub-committees met during the year.
• Documentation–review&approvalof policies made during the year.
• Strategyformulation–developingplans and their regular review.
• Monitoring–devisingmonitoringmechanisms, and review of their implementation.
• Strategicdecisions–assessmentof their impact, vis-à-vis expected benefits.
• Training&development–attendance of courses / workshops by directors, and the Bank staff.
Auditors The Auditors, M/s KPMG Taseer Hadi & Co, Chartered Accountants have completed their assignment for the year ended December 31, 2012 and shall retire at the conclusion of the 21st Annual General Meeting. As advised by the Audit Committee, the Board recommends appointment of M/s KPMG Taseer Hadi & Co., Chartered Accountants, as the auditors for the year 2013.
Events After the Balance Sheet DateThere have not been any material events that occurred subsequent to the date of the Statement of Financial Position that require adjustments to the attached financial statements.
Prospects and PlansSale of AWT’s Shareholding in Askari Bank to Fauji ConsortiumArmy Welfare Trust (AWT), the majority shareholder of the Bank as on the date of statement of financial position, has signed an agreement with Fauji Consortium; Fauji Foundation, Fauji Fertilizer Company Limited and Fauji Fertilizer Bin Qasim Limited for the sale of its entire shareholding in the Bank at a purchase price of Rs. 24.32 per share. The sale and purchase is subject to approval of the State Bank of Pakistan (SBP) and the Securities and Exchange Commission of Pakistan (SECP). Intimation to this effect was made by the Bank to the Stock Exchanges on February 7, 2013 and February 8, 2013.
59
Annual Report of Askari Bank Limited for 2012

Prospects for 2013
With the next general elections expected after the democratically elected government hands over power to an interim government sometime in March 2013, economic policy-making reform appears to be on hold.
The challenges that the country is facing are enormous and multidimensional. These include continued subdued growth in the wake of security concerns; sharp decline in foreign direct investments - though partly offset by a growth in foreign remittance – and its consequential effect on foreign currency reserves, unstable rupee parity against US dollar, deteriorating balance of payment position, resurgence of inflationary pressures, lower growth of tax collections, and rising expenditures especially on energy, and food. The new political government is expected to be formed
by mid 2013 will face these challenges immediately on taking over. Tough economic decisions would be required in order to put the economy on the growing path that generates employment, that corrects the structural imbalances, and that improves the macroeconomic indicators.
Within the Pakistani banking sector rising NPLs are a major cause of concern. Continued weakness in the world economic growth, particularly in the economies of some of Pakistan’s major trading partners, remains a constraint to our export growth potential. There are no easy answers. Given the challenges on hand, 2013 is expected to be yet another difficult year.
Acknowledgments
On behalf of the Board, I like to express my sincere appreciation to the State Bank of Pakistan and other regulatory bodies for their guidance and support; to the shareholders, and to our valued customers, for their patronage and business; and to the employees for their continued dedication and hard work.
For and on behalf of the Board
Lt Gen Javed IqbalChairman, Board of Directors
Askari Bank Limited
February 18, 2013Rawalpindi
Directors’ Report to the Shareholders (Contd.)
60

61
Annual Report of Askari Bank Limited for 2012
Unconsolidated Financial Statements of
Askari Bank LimitedFor the year ended December 31, 2012

62
This page is intentionally left blank
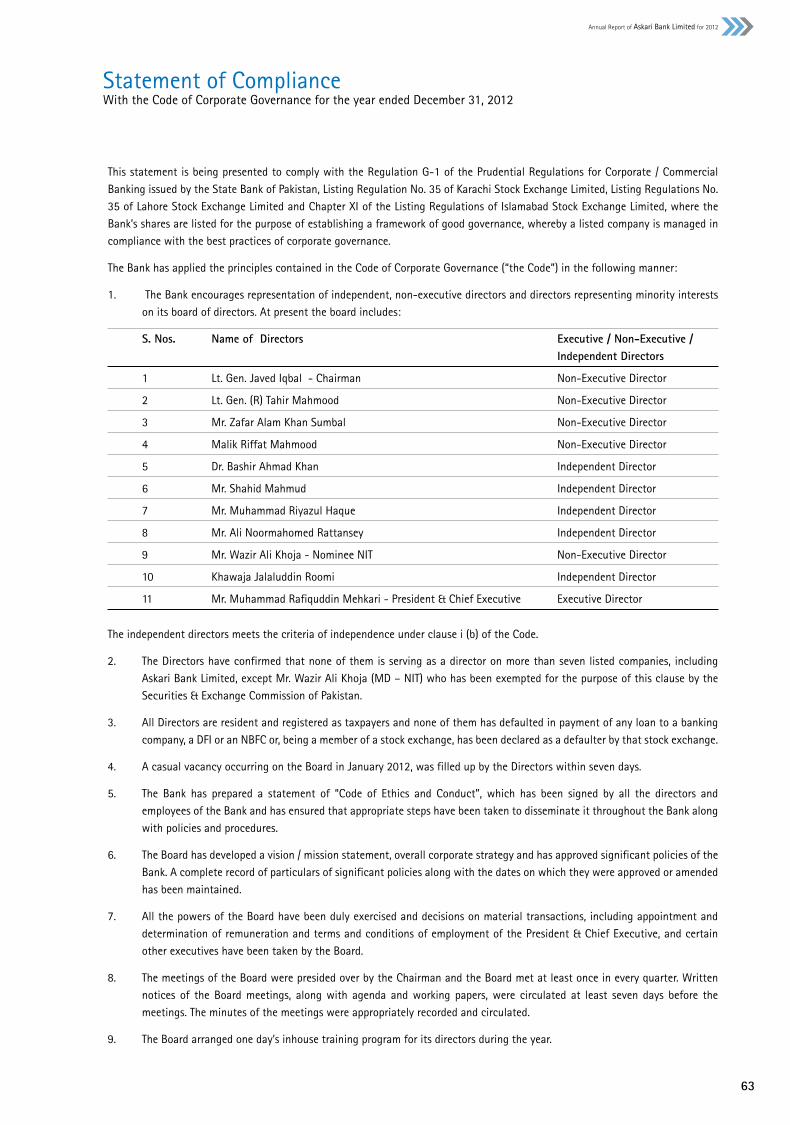
63
Annual Report of Askari Bank Limited for 2012
Statement of ComplianceWith the Code of Corporate Governance for the year ended December 31, 2012
This statement is being presented to comply with the Regulation G-1 of the Prudential Regulations for Corporate / Commercial Banking issued by the State Bank of Pakistan, Listing Regulation No. 35 of Karachi Stock Exchange Limited, Listing Regulations No. 35 of Lahore Stock Exchange Limited and Chapter XI of the Listing Regulations of Islamabad Stock Exchange Limited, where the Bank’s shares are listed for the purpose of establishing a framework of good governance, whereby a listed company is managed in compliance with the best practices of corporate governance.
The Bank has applied the principles contained in the Code of Corporate Governance (“the Code”) in the following manner:
1. The Bank encourages representation of independent, non-executive directors and directors representing minority interests on its board of directors. At present the board includes:
S. Nos. Name of Directors Executive / Non-Executive / Independent Directors
1 Lt. Gen. Javed Iqbal - Chairman Non-Executive Director
2 Lt. Gen. (R) Tahir Mahmood Non-Executive Director
3 Mr. Zafar Alam Khan Sumbal Non-Executive Director
4 Malik Riffat Mahmood Non-Executive Director
5 Dr. Bashir Ahmad Khan Independent Director
6 Mr. Shahid Mahmud Independent Director
7 Mr. Muhammad Riyazul Haque Independent Director
8 Mr. Ali Noormahomed Rattansey Independent Director
9 Mr. Wazir Ali Khoja - Nominee NIT Non-Executive Director
10 Khawaja Jalaluddin Roomi Independent Director
11 Mr. Muhammad Rafiquddin Mehkari - President & Chief Executive Executive Director
The independent directors meets the criteria of independence under clause i (b) of the Code.
2. The Directors have confirmed that none of them is serving as a director on more than seven listed companies, including Askari Bank Limited, except Mr. Wazir Ali Khoja (MD – NIT) who has been exempted for the purpose of this clause by the Securities & Exchange Commission of Pakistan.
3. All Directors are resident and registered as taxpayers and none of them has defaulted in payment of any loan to a banking company, a DFI or an NBFC or, being a member of a stock exchange, has been declared as a defaulter by that stock exchange.
4. A casual vacancy occurring on the Board in January 2012, was filled up by the Directors within seven days.
5. The Bank has prepared a statement of “Code of Ethics and Conduct”, which has been signed by all the directors and employees of the Bank and has ensured that appropriate steps have been taken to disseminate it throughout the Bank along with policies and procedures.
6. The Board has developed a vision / mission statement, overall corporate strategy and has approved significant policies of the Bank. A complete record of particulars of significant policies along with the dates on which they were approved or amended has been maintained.
7. All the powers of the Board have been duly exercised and decisions on material transactions, including appointment and determination of remuneration and terms and conditions of employment of the President & Chief Executive, and certain other executives have been taken by the Board.
8. The meetings of the Board were presided over by the Chairman and the Board met at least once in every quarter. Written notices of the Board meetings, along with agenda and working papers, were circulated at least seven days before the meetings. The minutes of the meetings were appropriately recorded and circulated.
9. The Board arranged one day’s inhouse training program for its directors during the year.

64
10. The Directors’ Report for this year has been prepared in compliance with the requirements of the Code and fully describes the salient matters required to be disclosed.
11. The financial statements of the Bank were duly endorsed by the President & Chief Executive and the Chief Financial Officer before approval of the Board.
12. The Directors, President & Chief Executive and executives do not hold any interest in the shares of the Bank other than that disclosed in the pattern of shareholding.
13. The Bank has complied with all the corporate and financial reporting requirements of the Code.
14. The Board has formed a Board Audit Committee. It comprises 4 members, of whom 1 is non-executive director and 3 members including the Chairman are independent directors.
15. The meetings of the Board Audit Committee were held in every quarter prior to approval of interim and final results of the Bank as required by the Code. The terms of reference of the committee have been formed and advised to the committee for compliance.
16. The Board has formed Board Human Resource & Remuneration Committee (BHR&RC). It comprises 3 members, of whom 1 member is non-executive director and the other members including Chairman of the Committee are independent directors.
17. The Board has set-up an effective internal audit function. Personnel of internal audit function are suitably qualified and experienced for the purpose and are conversant with the policies and procedures of the Bank.
18. The statutory auditors of the Bank have confirmed that they have been given a satisfactory rating under the quality control review program of the Institute of Chartered Accountants of Pakistan, that they or any of the partners of the firm, their spouses and minor children do not hold shares of the Bank and that the firm and all its partners are in compliance with International Federation of Accountants (IFAC) guidelines on code of ethics, as adopted by Institute of Chartered Accountants of Pakistan.
19. The statutory auditors or the persons associated with them have not been appointed to provide other services except in accordance with the Listing Regulations and the auditors have confirmed that they have observed IFAC guidelines in this regard.
20. The ‘closed period’, prior to the announcement of interim / final results, and business decisions, which may materially affect the market price of the Bank’s shares, was determined and intimated to directors, employees and stock exchanges.
21. Material / price sensitive information has been disseminated among all market participants through stock exchanges.
22. We confirm that all other material principles enshrined in the Code have been complied with.
For and on behalf of the Board
Rawalpindi Lt. Gen. Javed IqbalFebruary 18, 2013 Chairman

65
Annual Report of Askari Bank Limited for 2012
Review Report to the MembersOn Directors’ Statement of Compliance with Best Practices of Code of Corporate Governance
We have reviewed the Directors’ Statement of Compliance with the best practices (“the Statement”) contained in the Code of Corporate Governance prepared by the Board of Directors of Askari Bank Limited, (“the Bank”) to comply with Regulation G–1 of the Prudential Regulations for Corporate / Commercial Banking issued by the State Bank of Pakistan, Listing Regulation No. 35 of Karachi Stock Exchange Limited, Listing Regulation No. 35 of Lahore Stock Exchange Limited and Chapter XI of the Listing Regulations of Islamabad Stock Exchange Limited, where the Bank is listed.
The responsibility for compliance with the Code of Corporate Governance (“the Code”) is that of the Board of Directors of the Bank. Our responsibility is to review, to the extent where such compliance can be objectively verified, whether the Statement of Compliance reflects the status of the Bank’s compliance with the provisions of the Code of Corporate Governance and report if it does not. A review is limited primarily to inquiries of the Bank’s personnel and review of various documents prepared by the Bank to comply with the Code.
As part of our audit of financial statements we are required to obtain an understanding of the accounting and internal control systems sufficient to plan the audit and develop an effective audit approach. We are not required to consider whether the Board’s statement covers all risks or controls, or to form an opinion on the effectiveness of such internal control, the Bank’s corporate governance procedures and risks.
Further, Sub–Regulation (xiii a) of Listing Regulation 35 notified by the Karachi Stock Exchange Limited vide circular KSE / N–269 dated January 19, 2009 requires the Bank to place before the Board of Directors for their consideration and approval of related party transactions, distinguishing between transactions carried out on terms equivalent to those that prevail in arm’s length transactions and transactions which are not executed at arm’s length price recording proper justification for using such alternative pricing mechanism. Further, all such transactions are also required to be separately placed before the Audit Committee. We are only required and have ensured compliance of requirement to the extent of approval of related party transactions by the Board of Directors and placement of such transactions before the Audit Committee. We have not carried out any procedure to determine whether the related party transactions were undertaken at arm’s length price or not.
Based on our review, nothing has come to our attention which causes us to believe that the Statement does not appropriately reflect the Bank’s compliance, in all material respects, with the best practices contained in the Code of Corporate Governance as applicable to the Bank for the year ended December 31, 2012.
Islamabad KPMG Taseer Hadi & Co.February 26, 2013 Chartered Accountants
Engagement Partner
Muhammad Rehan Chughtai
KPMG Taseer Hadi & Co., a Partnership firm registered in Pakistanand a member firm of the KPMG network of independent memberfirms affiliated with KPMG International Cooperative(“KPMG International”), a Swiss entity.
KPMG Taseer Hadi & Co.Chartered AccountantsSixth Floor, State Life Building No. 5Jinnah Avenue, Blue AreaIslamabad, Pakistan
Telephone + 92 (51) 282 3558 + 92 (51) 282 5956Fax + 92 (51) 282 2671Internet www.kpmg.com.pk

66
We have audited the annexed unconsolidated statement of financial position of Askari Bank Limited (“the Bank”) a at December 31,
2012 and the related unconsolidated profit and loss account, unconsolidated statement of comprehensive income, unconsolidated
cash flow statement and unconsolidated statement of changes in equity together with the notes forming part thereof (here-in-after
referred to as the ‘financial statements’) for the year then ended, in which are incorporated the unaudited certified returns from
the branches except for 20 branches which have been audited by us and one branch audited by the other auditors abroad and we
state that we have obtained all the information and explanations which, to the best of our knowledge and belief, were necessary
for the purposes of our audit.
It is the responsibility of the Bank’s Board of Directors to establish and maintain a system of internal control, and prepare and
present the above said statements in conformity with the approved accounting standards and the requirements of the Banking
Companies Ordinance, 1962 (LVII of 1962), and the Companies Ordinance, 1984 (XLVII of 1984). Our responsibility is to express and
opinion on these statements based on our audit.
We conducted our audit in accordance with the International Standards on Auditing as applicable in Pakistan. These standards
require that we plan and perform the audit to obtain reasonable assurance about whether the financial statements are free of
any material misstatement. An audit includes examining on a test basis, evidence supporting the amounts and disclosures in the
financial statements. An audit also includes assessing the accounting policies and significant estimates made by management, as
well as, evaluating the overall presentation of the financial statements. We believe that our audit provides a reasonable basis for
our opinion and, after due verification, which in the case of loans and advances covered more than 60% of the total loans and
advances of the Bank, we report that:
a) in our opinion, proper books of account have been kept by the Bank as required by the Companies Ordinance, 1984 (XLVII of
1984) and the returns referred to above received from the branches have been found adequate for the purposes of our audit;
b) in our opinion:
i) the unconsolidated statement of financial position and unconsolidated profit and loss account together with the
notes thereon have been drawn up in conformity with the Banking Companies Ordinance, 1962 (LVII of 1962) and
the Companies Ordinance, 1984 (XLVII of 1984), and are in agreement with the books of account and are further in
accordance with accounting policies consistently applied;
ii) the expenditure incurred during the year was for the purpose of the Bank’s business; and
Auditors’ Report to the Members
KPMG Taseer Hadi & Co., a Partnership firm registered in Pakistanand a member firm of the KPMG network of independent memberfirms affiliated with KPMG International Cooperative(“KPMG International”), a Swiss entity.
KPMG Taseer Hadi & Co.Chartered AccountantsSixth Floor, State Life Building No. 5Jinnah Avenue, Blue AreaIslamabad, Pakistan
Telephone + 92 (51) 282 3558 + 92 (51) 282 5956Fax + 92 (51) 282 2671Internet www.kpmg.com.pk

67
Annual Report of Askari Bank Limited for 2012
iii) the business conducted, investments made and the expenditure incurred during the year were in accordance with the
objects of the Bank and the transactions of the Bank which have come to our notice have been within the power of
the Bank;
c) in our opinion and to the best of our information and according to the explanations given to us, the unconsolidated
statement of financial position, unconsolidated profit and loss account, unconsolidated statement of comprehensive income,
unconsolidated cash flow statement and unconsolidated statement of changes in equity together with the notes forming
part thereof conform with approved accounting standards as applicable in Pakistan, and give the information required by
the Banking Companies Ordinance, 1962 (LVII of 1962) and the Companies Ordinance, 1984 (XLVII of 1984), in the manner
so required and respectively give a true and fair view of the state of the Bank’s affairs as at December 31, 2012 and its true
balance of the profit, its cash flows and changes in equity for the year then ended; and
d) in our opinion, Zakat deductible at source under the Zakat and Ushr Ordinance, 1980 (XVIII of 1980), was deducted by the
Bank and deposited in the Central Zakat Fund established under section 7 of that Ordinance.
Islamabad KPMG Taseer Hadi & Co.February 26, 2013 Chartered Accountants
Engagement Partner
Muhammad Rehan Chughtai
KPMG Taseer Hadi & Co.

68
Unconsolidated Statement of Financial PositionAs at December 31, 2012
Rupees in ‘000 Note 2012 2011
Assets
Cash and balances with treasury banks 6 24,435,380 26,168,181 Balances with other banks 7 8,863,586 6,235,055 Lendings to financial institutions 8 6,319,474 1,591,584 Investments 9 145,378,148 133,756,712 Advances 10 143,726,962 150,710,709 Operating fixed assets 11 8,841,091 9,348,815 Deferred tax assets - - Other assets 12 15,490,986 15,945,250
353,055,627 343,756,306 Liabilities
Bills payable 13 3,700,156 2,756,032 Borrowings 14 8,372,617 17,273,470 Deposits and other accounts 15 306,937,216 291,502,993 Sub-ordinated loans 16 6,987,300 6,990,100 Liabilities against assets subject to finance lease - - Deferred tax liabilities 17 118,376 83,024 Other liabilities 18 7,251,956 7,374,421
333,367,621 325,980,040
Net assets 19,688,006 17,776,266
Represented by
Share capital 19 8,130,711 7,070,184 Reserves 20 8,542,421 8,136,440 Unappropriated profit 1,004,290 1,302,158
17,677,422 16,508,782 Surplus on revaluation of assets - net of tax 21 2,010,584 1,267,484
19,688,006 17,776,266 Contingencies and commitments 22
The annexed notes 1 to 46 and Annexures - 1 and 2 form an integral part of these unconsolidated financial statements.
M. R. Mehkari Dr. Bashir Ahmad Khan Lt. Gen. (R) Tahir Mahmood Lt. Gen. Javed Iqbal President & Chief Executive Director Director Chairman

69
Annual Report of Askari Bank Limited for 2012
M. R. Mehkari Dr. Bashir Ahmad Khan Lt. Gen. (R) Tahir Mahmood Lt. Gen. Javed Iqbal President & Chief Executive Director Director Chairman
Rupees in ‘000 Note 2012 2011
Mark-up / return / interest earned 25 32,402,187 32,766,351 Mark-up / return / interest expensed 26 22,973,781 22,699,583
Net mark-up / interest income 9,428,406 10,066,768
Provision against non-performing loans and advances - net 10.6.1 2,342,473 1,630,123 Impairment loss on available for sale investments 143,079 122,421 Provision for diminution in the value of investments - net 9.2.1 201,265 43,596 Provision against purchase under resale arrangement - 34,702 Bad debts written off directly 1,043 -
2,687,860 1,830,842
Net mark-up / interest income after provisions 6,740,546 8,235,926
Non mark-up / interest income
Fee, commission and brokerage income 1,153,496 1,193,986 Dividend income 1,036,249 289,470 Income from dealing in foreign currencies 884,724 772,495 Gain on sale of securities - net 27 681,685 307,212 Unrealised gain on revaluation of investments classified as held for trading - net 252 - Other income 28 360,960 339,758
Total non-markup / interest income 4,117,366 2,902,921
10,857,912 11,138,847 Non mark-up / interest expenses
Administrative expenses 29 9,039,255 8,639,312 Other provisions / write offs 8,633 - Other charges 30 80,297 86,784
Total non-markup / interest expenses 9,128,185 8,726,096
1,729,727 2,412,751 Extra ordinary / unusual items - -
Profit before taxation 1,729,727 2,412,751
Taxation – current 31 839,144 832,723 – prior years’ - - – deferred 31 (364,779) (47,670)
474,365 785,053
Profit after taxation 1,255,362 1,627,698
Unappropriated profit brought forward 1,302,158 701,819
Profit available for appropriation 2,557,520 2,329,517 Basic / diluted earnings per share - Rupees 32 1.54 2.00
The annexed notes 1 to 46 and Annexures - 1 and 2 form an integral part of these unconsolidated financial statements.
Unconsolidated Profit and Loss AccountFor the year ended December 31, 2012

70
M. R. Mehkari Dr. Bashir Ahmad Khan Lt. Gen. (R) Tahir Mahmood Lt. Gen. Javed Iqbal President & Chief Executive Director Director Chairman
Rupees in ‘000 2012 2011
Profit after taxation 1,255,362 1,627,698
Other comprehensive income
Effect of rescheduled / restructured classified advances (94,085) 40,723
Effect of translation of net investment in Wholesale Bank Branch 7,363 19,783 Total comprehensive income 1,168,640 1,688,204
The annexed notes 1 to 46 and Annexures - 1 and 2 form an integral part of these unconsolidated financial statements.
Unconsolidated Statement of Comprehensive IncomeFor the year ended December 31, 2012

71
Annual Report of Askari Bank Limited for 2012
Rupees in ‘000 Note 2012 2011
Cash flow from operating activities
Profit before taxation 1,729,727 2,412,751 Less: Dividend income (1,036,249) (289,470)
693,478 2,123,281 Adjustments: Depreciation / amortization 859,298 817,806 Provision against non-performing advances - net 2,342,473 1,630,123 Impairment loss on available for sale investments 143,079 122,421 Provision for diminution in the value of investments - net 201,265 43,596 Provision against purchase under resale arrangement - 34,702 Provision against other assets 8,633 - Unrealised gain on revaluation of investments classified as held for trading - net (252) - Gain on sale of operating fixed assets (5,744) (20)
3,548,752 2,648,628
4,242,230 4,771,909 (Increase) / decrease in operating assets Lendings to financial institutions (4,727,890) 7,545,900 Held for trading securities (151,593) 21,560 Advances 3,742,882 (862,910) Other assets (excluding advance taxation) 2,030,320 (276,227)
893,719 6,428,323 Increase / (decrease) in operating liabilities Bills payable 944,124 (333,952) Borrowings (8,900,853) (8,281,307) Deposits 15,434,223 35,566,490 Other liabilities (excluding current taxation) (121,679) (706,499)
7,355,815 26,244,732
Cash flow before tax 12,491,764 37,444,964 Income tax paid (1,553,220) (953,125)
Net cash flow from operating activities 33.1 10,938,544 36,491,839 Cash flow from investing activities
Net investments in available for sale securities (11,872,592) (31,917,887)Net investments in held to maturity securities 1,201,888 430,746 Net investments in subsidiaries / associate - (68,284)Dividend income 991,331 282,447 Investments in operating fixed assets - net of adjustment (380,551) (194,552)Sale proceeds of operating fixed assets - disposed off 13,333 11,713
Net cash used in investing activities (10,046,591) (31,455,817) Cash flow from financing activities
(Payments) / receipts of sub-ordinated loans (2,800) 997,600 Dividend paid (786) (219)
Net cash flow (used in) / from financing activities (3,586) 997,381 Effect of translation of net investment in Wholesale Bank Branch 7,363 19,783
Increase in cash and cash equivalents 895,730 6,053,186 Cash and cash equivalents at beginning of the year 32,403,236 26,350,050
Cash and cash equivalents at end of the year 33 33,298,966 32,403,236 The annexed notes 1 to 46 and Annexures - 1 and 2 form an integral part of these unconsolidated financial statements.
Unconsolidated Cash Flow StatementFor the year ended December 31, 2012
M. R. Mehkari Dr. Bashir Ahmad Khan Lt. Gen. (R) Tahir Mahmood Lt. Gen. Javed Iqbal President & Chief Executive Director Director Chairman

72
Exchange Share Revenue Reserves translation premium Statutory Capital General Un-appropriated TotalRupees in ‘000 Share capital reserve account reserve reserve reserve profit Balance as at January 1, 2011 6,427,440 55,513 234,669 3,322,905 53,362 4,024,870 701,819 14,820,578
Total comprehensive income for the year ended December 31, 2011
Net profit for the year ended December 31, 2011 - - - - - - 1,627,698 1,627,698
Other comprehensive income - Reversal of capital reserve - - - - (30,969) - - (30,969) - Effect of rescheduled / restructured classified advances - note 20.1 - - - - 71,692 - - 71,692 - Effect of translation of net investment in Wholesale Bank Branch - 19,783 - - - - - 19,783
- 19,783 - - 40,723 - 1,627,698 1,688,204 Transfer to: Statutory reserve - - - 325,540 - - (325,540) - General reserve - - - - - 701,819 (701,819) -
Transaction with owners, recorded directly in equity
Bonus shares declared / issued subsequent to the year ended December 31, 2010 642,744 - - - - (642,744) - -
Balance as at January 1, 2012 7,070,184 75,296 234,669 3,648,445 94,085 4,083,945 1,302,158 16,508,782
Total comprehensive income for the year ended December 31, 2012
Net profit for the year ended December 31, 2012 - - - - - - 1,255,362 1,255,362
Other comprehensive income - Reversal of capital reserve - note 20.1 - - - - (94,085) - - (94,085) - Effect of translation of net investment in Wholesale Bank Branch - 7,363 - - - - - 7,363
- 7,363 - - (94,085) - 1,255,362 1,168,640 Transfer to: Statutory reserve - - - 251,072 - - (251,072) - General reserve - - - - - 1,302,158 (1,302,158) -
Transaction with owners, recorded directly in equity
Bonus shares declared / issued subsequent to the year ended December 31, 2011 1,060,527 - - - - (1,060,527) - -
Balance as at December 31, 2012 8,130,711 82,659 234,669 3,899,517 - 4,325,576 1,004,290 17,677,422
The annexed notes 1 to 46 and Annexures - 1 and 2 form an integral part of these unconsolidated financial statements.
M. R. Mehkari Dr. Bashir Ahmad Khan Lt. Gen. (R) Tahir Mahmood Lt. Gen. Javed Iqbal President & Chief Executive Director Director Chairman
Unconsolidated Statement of Changes in EquityFor the year ended December 31, 2012

73
Annual Report of Askari Bank Limited for 2012
1. STATUS AND NATURE OF BUSINESS
1.1 Askari Bank Limited (the Bank) was incorporated in Pakistan on October 09, 1991 as a Public Limited Company and is listed on the Karachi, Lahore and Islamabad Stock Exchanges. The registered office of the Bank is situated at AWT Plaza, The Mall, Rawalpindi.
The Bank obtained its business commencement certificate on February 26, 1992 and started operations from April 01, 1992. Army Welfare Trust (AWT) holds 50.57 % (2011: 50.57 %) of the Bank’s share capital at the year end. The Bank has 261 branches (2011: 245 branches); 260 in Pakistan and Azad Jammu and Kashmir, including 32 (2011: 31) Islamic Banking branches, 24 (2011: 21) sub-branches and a Wholesale Bank Branch in the Kingdom of Bahrain.
The Bank is a scheduled commercial bank and is principally engaged in the business of banking as defined in the Banking Companies Ordinance, 1962.
1.2 Army Welfare Trust (AWT), the majority shareholder of the Bank as on the date of statement of financial position, has signed an agreement with Fauji Consortium; Fauji Foundation, Fauji Fertilizer Company Limited and Fauji Fertilizer Bin Qasim Limited for the sale of its entire shareholding in the Bank at a purchase price of Rs. 24.32 per share. The sale and purchase is subject to approval of the State Bank of Pakistan (SBP) and the Securities and Exchange Commission of Pakistan (SECP). Intimation to this effect was made by the Bank to the stock exchanges on February 07, 2013 and February 08, 2013.
1.3 SBP’s BSD Circular No. 7 dated April 15, 2009 sets out the minimum paid-up capital requirement (MCR) for banks to be raised to Rs. 10 billion in a phased manner by December 31, 2013. The required MCR (net of losses) as of December 31, 2012 is Rs. 9 billion. The paid-up capital of the Bank as of December 31, 2012 amounted to Rs. 8.13 billion, and thus remained short by Rs. 870 million of the prescribed level. As stated in note 1.2 above, the sale process of the Bank’s shareholding by AWT, also requires a public offer to be conducted under the Listed Companies (Substantial Acquisition of Voting Shares and Takeovers) Ordinance, 2002 read with Listed Companies (Substantial Acquisition of Voting Shares and Takeovers) Regulations, 2008. In terms of Regulation No. 7 of the said Regulations, and during the period stated therein, it is not possible for the Bank to issue any rights or bonus shares.
Based on the above, the management and the Board of Directors of the Bank, after taking into account that the Bank intends to meet the MCR as prescribed under the aforementioned SBP circular, have resolved that it is not possible to do so at present in view of the restriction imposed by Regulation No. 7 of the above stated Regulations. The Bank has also apprised the SBP and sought relaxation from meeting the minimum capital requirement of Rs. 9 billion for the year 2012.
2. BASIS OF PRESENTATION
2.1 These unconsolidated financial statements have been presented in accordance with the requirements of format prescribed by the SBP’s BSD Circular No. 4 dated February 17, 2006.
2.2 These unconsolidated financial statements are separate financial statements of the Bank in which the investments in subsidiaries and associates are stated at cost and have not been accounted for on the basis of reported results and net assets of the investees which is done in consolidated financial statements.
2.3 In accordance with the directives of the Federal Government regarding shifting of the banking system to Islamic modes, the SBP has issued various circulars from time to time. One permissible form of trade related mode of financing comprises of purchase of goods by the Bank from its customers and resale to them at appropriate mark-up in price on a deferred payment basis. The purchases and sales arising under these arrangements are not reflected in these unconsolidated financial statements as such but are restricted to the amount of facilities actually utilized and the appropriate portion of mark-up thereon.
2.4 The financial results of the Islamic banking branches have been consolidated in these unconsolidated financial statements for reporting purposes, after eliminating material inter-branch transactions / balances. Key figures of the Islamic banking branches are disclosed in Annexure-2 to these unconsolidated financial statements.
2.5 Items included in the unconsolidated financial statements are measured using the currency of the primary economic environment in which the Bank operates. The unconsolidated financial statements are presented in Pak. Rupee, which is the Bank’s functional currency. Figures have been rounded off to the nearest thousand of rupees unless otherwise stated.
3. STATEMENT OF COMPLIANCE
These unconsolidated financial statements have been prepared in accordance with the approved accounting standards as applicable in Pakistan and the requirements of the Companies Ordinance, 1984 and the Banking Companies Ordinance, 1962. Approved accounting standards comprise of such International Financial Reporting Standards (IFRS) issued by the International Accounting Standard Board (IASB) and Islamic Financial Accounting Standards (IFAS) issued by the Institute of Chartered Accountants of Pakistan (ICAP) as are notified under the Companies Ordinance, 1984, provisions of and directives issued under the Companies Ordinance, 1984 and the Banking Companies Ordinance, 1962 or directives issued by the Securities and Exchange Commission of Pakistan and the State Bank of Pakistan. In case the requirements differ, the provisions of and directives issued under the Companies Ordinance, 1984 and the Banking Companies Ordinance, 1962 and the directives issued by the SBP shall prevail.
International Accounting Standard 39, “Financial Instruments: Recognition and Measurement”, International Accounting Standard 40, “Investment Property” and International Financial Reporting Standard 7, ”Financial Instruments: Disclosure” are not applicable to banking companies in Pakistan. Accordingly, the requirements of these Standards have not been considered in the preparation of these unconsolidated financial statements. However, investments have been classified and valued in accordance with the requirements prescribed by the SBP through various circulars.
Notes to the Unconsolidated Financial StatementsFor the year ended December 31, 2012

74
Standards, interpretations and amendments to approved accounting standards that are not yet effective The following standards, amendments and interpretations of approved accounting standards will be effective for accounting
periods beginning after January 01, 2013: - IAS 27 Separate Financial Statements (2011) - (effective for annual periods beginning on or after January 01, 2013).
IAS 27 (2011) supersedes IAS 27 (2008). Three new standards IFRS 10 - Consolidated Financial Statements, IFRS 11- Joint Arrangements and IFRS 12- Disclosure of Interest in Other Entities dealing with IAS 27 would be applicable effective January 01, 2013. IAS 27 (2011) carries forward the existing accounting and disclosure requirements for separate financial statements, with some minor clarifications. The amendments are not expected to impact the current transactions of the Bank.
- IAS 28 Investments in Associates and Joint Ventures (2011) - (effective for annual periods beginning on or after January 01, 2013). IAS 28 (2011) supersedes IAS 28 (2008). IAS 28 (2011) makes the amendments to apply IFRS 5 to an investment, or a portion of an investment, in an associate or a joint venture that meets the criteria to be classified as held for sale; and on cessation of significant influence or joint control, even if an investment in an associate becomes an investment in a joint venture. The amendments are not expected to impact the current transactions of the Bank.
- IAS 19 Employee Benefits (amended 2011) - (effective for annual periods beginning on or after January 01, 2013). The amended IAS 19 includes the amendments that require actuarial gains and losses to be recognised immediately in other comprehensive income; this change will remove the corridor method and eliminate the ability for entities to recognise all changes in the defined benefit obligation and in plan assets in profit or loss, which currently is allowed under IAS 19; and that the expected return on plan assets recognised in profit or loss is calculated based on the rate used to discount the defined benefit obligation. Following this change, unrecognised actuarial loss of Rs. 134,706 thousand will be recorded immediately in other comprehensive income.
- Presentation of Items of Other Comprehensive Income (Amendments to IAS 1) - (effective for annual periods beginning on or after July 01, 2012). The amendments require that an entity present separately the items of other comprehensive income that would be reclassified to profit or loss in the future if certain conditions are met from those that would never be reclassified to profit or loss. The amendments do not address which items are presented in other comprehensive income or which items need to be reclassified. The requirements of other approved accounting standards continue to apply in this regard. The amendments are not expected to impact the current transactions of the Bank.
- Offsetting Financial Assets and Financial Liabilities (Amendments to IAS 32) – (effective for annual periods beginning on or after January 01, 2014). The amendments address inconsistencies in current practice when applying the offsetting criteria in IAS 32 Financial Instruments: Presentation. The amendments clarify the meaning of ‘currently has a legally enforceable right of set-off’; and that some gross settlement systems may be considered equivalent to net settlement. The amendments are not expected to impact the current transactions of the Bank.
- IFRIC 20 - Stripping cost in the production phase of a surface mining (effective for annual periods beginning on or after January 01, 2013). The interpretation requires production stripping cost in a surface mine to be capitalized if certain criteria are met. The amendments have no impact on the unconsolidated financial statements of the Bank.
Annual Improvements 2009–2011 (effective for annual periods beginning on or after January 01, 2013). The new cycle of improvements contains amendments to the following standards, with consequential amendments to other
standards and interpretations: - IAS 1 Presentation of Financial Statements is amended to clarify that only one comparative period – which is the
preceding period – is required for a complete set of financial statements. If an entity presents additional comparative information, then that additional information need not be in the form of a complete set of financial statements. However, such information should be accompanied by related notes and should be in accordance with IFRS. Furthermore, it clarifies that the ‘third statement of financial position’ is only required if the effect of restatement is material to statement of financial position.
- IAS 16 Property, Plant and Equipment is amended to clarify the accounting of spare parts, stand-by equipment and servicing equipment. The definition of ‘property, plant and equipment’ in IAS 16 is now considered in determining whether these items should be accounted for under that standard. If these items do not meet the definition, then they are accounted for using IAS 2 Inventories. The amendments have no impact on financial statements of the Bank.
- IAS 32 Financial Instruments: Presentation - is amended to clarify that IAS 12 Income Taxes applies to the accounting for income taxes relating to distributions to holders of an equity instrument and transaction costs of an equity transaction. The amendment removes a perceived inconsistency between IAS 32 and IAS 12.
- IAS 34 Interim Financial Reporting is amended to align the disclosure requirements for segment assets and segment liabilities in interim financial reports with those in IFRS 8 Operating Segments. IAS 34 now requires the disclosure of a measure of total assets and liabilities for a particular reportable segment. In addition, such disclosure is only required when the amount is regularly provided to the chief operating decision maker and there has been a material change from the amount disclosed in the last annual financial statements for that reportable segment. The amendments have no impact on financial statements of the Bank.
4. BASIS OF MEASUREMENT
These unconsolidated financial statements have been prepared under the historical cost convention as modified for certain investments which are carried at fair value, freehold and leasehold land which are shown at revalued amounts and staff retirement gratuity and compensated absences which are carried at present value of defined benefit obligations net of fair value of plan assets and unrecognised actuarial losses.
Notes to the Unconsolidated Financial StatementsFor the year ended December 31, 2012

75
Annual Report of Askari Bank Limited for 2012
Use of critical accounting estimates and judgments The preparation of unconsolidated financial statements in conformity with approved accounting standards as applicable
in Pakistan requires the use of certain accounting estimates. It also requires management to exercise its judgment in the process of applying the Bank’s accounting policies. The Bank uses estimates and assumptions concerning the future. The resulting accounting estimate will, by definition, seldom equal the related actual results. Estimates and judgments are continually evaluated and are based on historical experience and other factors, including expectations of future events that are believed to be reasonable under the circumstances. The areas involving a higher degree of judgment or complexity, or areas where assumptions and estimates are significant to the financial statements are as follows: i) classification of investments (note 5.3) ii) provision against investments (note 5.3), advances (note 5.4) and other assets (note 5.6) iii) valuation and impairment of available for sale securities (note 5.3) iv) useful life of property and equipments, intangible assets and revaluation of land (note 5.5) v) taxation (note 5.8) vi) staff retirement benefits (note 5.9)
5. SUMMARY OF SIGNIFICANT ACCOUNTING POLICIES
5.1 Cash and cash equivalents Cash and cash equivalents comprise of cash and balances with treasury banks, balances with other banks and call money
lendings. 5.2 Sale and repurchase agreements Securities sold under repurchase agreement (repo) are retained in the unconsolidated financial statements as investments
and a liability for consideration received is included in borrowings. Conversely, consideration for securities purchased under resale agreement (reverse repo) are included in lendings to financial institutions. The difference between sale and repurchase / purchase and resale price is recognised as mark-up / return expensed and earned on a time proportion basis as the case may be. Repo and reverse repo balances are reflected under borrowings from and lendings to financial institutions respectively.
5.3 Investments Investments are classified as follows: Held for trading These represent securities acquired with the intention to trade by taking advantage of short-term market / interest rate
movements. These are marked to market and surplus / deficit arising on revaluation of ‘held for trading’ investments is taken to profit and loss account in accordance with the requirements prescribed by the SBP through various circulars.
Available for sale These represent securities which do not fall under ‘held for trading’ or ‘held to maturity’ categories. In accordance with the
requirements of the SBP’s BSD Circular No. 20 dated August 04, 2000, available for sale securities for which ready quotations are available on Reuters Page (PKRV) or Stock Exchanges are valued at market value and the resulting surplus / deficit is kept in a separate account and is shown below the shareholders’ equity in the unconsolidated statement of financial position. Where the decline in prices of available for sale equity securities is significant or prolonged, it is considered impaired and included in profit and loss account. Impairment loss on available for sale debt securities is determined in accordance with the requirements of Prudential Regulations issued by the SBP.
Unquoted equity securities are valued at the lower of cost and break-up value. Break-up value of equity securities is calculated with reference to the net assets of the investee company as per the latest audited financial statements. If the break-up value is less than cost the difference is included in profit and loss account.
Unquoted debt securities are valued using the market value of secondary market where available. Investments in other unquoted securities are valued at cost less impairment losses, determined in accordance with the
requirements of Prudential Regulations issued by the SBP. Held to maturity These represent securities acquired with the intention and ability to hold them upto maturity. These are carried at amortized
cost less impairment, determined in accordance with the requirements of Prudential Regulations issued by the SBP.
Investments in subsidiaries and associate Investments in subsidiaries and associate are carried at cost less impairment loss, if any. All purchases and sales of investments that require delivery within the time frame established by regulations or
market convention are recognized at the trade date, which is the date the Bank commits to purchase or sell the investments.
5.4 Advances Advances are stated net of provisions for non-performing advances. Provision for advances is determined in accordance
with the requirements of the Prudential Regulations issued by the SBP from time to time. In addition, a general provision is maintained for advances other than consumer advances as per details given in note 10.6.4.
The provisions against non-performing advances are charged to the profit and loss account. Advances are written off when there is no realistic prospect of recovery.
The SBP has notified for adoption of “Islamic Financial Accounting Standard 2 Ijarah” (IFAS-2) which is applicable for accounting period beginning on or after January 01, 2009. Consequent to the adoption of IFAS-2, such Ijarahs booked on or after January 01, 2009 are stated at cost less accumulated depreciation and impairment if any, and are shown under advances.

76
Leases where the Bank transfers substantially all the risks and rewards incidental to ownership of an asset to the lessee are classified as finance leases. A receivable is recognised at an amount equal to the present value of the lease payments including any guaranteed residual value. Finance lease receivables are included in advances to the customers.
The rentals received / receivable on above Ijarahs are recorded as income / revenue. Depreciation on Ijarah assets is charged to profit and loss account by applying the straight line method whereby the depreciable value of Ijarah assets is written off over the Ijarah period. The Bank charges depreciation from the date of delivery of respective assets to Mustajir upto the date of maturity / termination of Ijarah agreement.
5.5 Capital work-in-progress, operating fixed assets and depreciation Capital work-in-progress Capital work-in-progress is stated at cost less impairment losses, if any. Owned assets Fixed assets are stated at cost less impairment losses and accumulated depreciation except for freehold / leasehold land.
Land is carried at revalued amounts which is not depreciated. Land is revalued by professionally qualified valuers with sufficient regularity to ensure that the net carrying amount does
not differ materially from their fair value. Surplus / (deficit) arising on revaluation of fixed assets is credited / (debited) to the surplus on revaluation of assets account and is shown below the shareholders’ equity in the unconsolidated statement of financial position. Except to the extent actually realised on disposal of land which are revalued, the surplus on revaluation of land shall not be applied to set-off or reduce any deficit or loss, whether past, current or future, or in any manner applied, adjusted or treated so as to add to the income, profit or surplus of the Bank or utilized directly or indirectly by way of dividend or issue of bonus shares.
Intangible assets Intangible assets are carried at cost less accumulated amortization and impairment losses, if any. Depreciation / amortization Depreciation / amortization is computed over the estimated useful lives of the related assets at the rates set out in note 11.2.
The cost of assets is depreciated / amortized on the diminishing balance method, except for vehicles, carpets, renovations, other assets and intangibles which are depreciated on a straight line basis. Depreciation / amortization is charged for the full month of purchase / acquisition / availability for use of an asset while no depreciation / amortization is charged in the month of disposal of an asset. Maintenance and normal repairs are charged to profit and loss account as and when incurred. Major renewals and improvements are capitalized. Gains and losses on disposal of operating fixed assets are taken to the profit and loss account.
In making estimates of the depreciation / amortization, the management uses useful life and residual value which reflects the pattern in which economic benefits are expected to be consumed by the Bank. The useful life and the residual value are reviewed at each financial year end and any change in these estimates in future years might effect the carrying amounts of the respective item of operating fixed assets with the corresponding effect on depreciation / amortization charge.
5.6 Impairment The carrying amount of the Bank’s assets are reviewed at the date of unconsolidated statement of financial position to
determine whether there is any indication of impairment. If such indications exist, the asset’s recoverable amount is estimated in order to determine the extent of the impairment loss, if any. Impairment loss is recognised as expense in the unconsolidated profit and loss account. An impairment loss is reversed only to the extent that the asset’s carrying amount does not exceed the carrying amount that would have been determined, net of depreciation or amortization, if no impairment loss had been recognised.
5.7 Deposits Deposits are recorded at the amount of proceeds received. Mark-up accrued on deposits is recognised separately as part of
other liabilities and is charged to profit and loss account on a time proportion basis.
5.8 Taxation Income tax on the profit or loss for the year comprises current and deferred tax. Income tax is recognised in the unconsolidated
profit and loss account, except to the extent that it relates to items recognised directly in other comprehensive income or below equity, in which case it is recognised in other comprehensive income or below equity.
Current Provision for current tax is the expected tax payable on the taxable profit for the year using tax rates applicable at the date
of unconsolidated statement of financial position and any adjustment to tax payable for previous years. Deferred Deferred tax is provided for by using the balance sheet liability method, providing for temporary differences between the
carrying amounts of assets and liabilities for financial reporting purposes and the amount used for taxation purposes. The amount of deferred tax provided is based on the expected manner of realization or settlement of the carrying amount of assets and liabilities using tax rates enacted or substantially enacted at the date of unconsolidated statement of financial position. A deferred tax asset is recognised only to the extent that it is probable that the future taxable profit will be available and credits can be utilized. Deferred tax assets are reduced to the extent it is no longer probable that the related tax benefit will be realised.
Deferred tax, on revaluation of investments, if any, is recognised as an adjustment to surplus / (deficit) arising on such revaluation.
Notes to the Unconsolidated Financial StatementsFor the year ended December 31, 2012

77
Annual Report of Askari Bank Limited for 2012
5.9 Staff retirement benefits
Defined benefit plan The Bank operates an approved funded gratuity scheme for all its regular employees. Contributions are made in accordance
with the actuarial recommendation. The actuarial valuation is carried out periodically using “Projected Unit Credit Method”. The actuarial gains / losses in excess of corridor limit (10% of higher of present value of obligation and fair value of plan assets) are recognized over the expected remaining working life of its employees.
Defined contribution plan The Bank operates a recognised provident fund scheme for all its regular employees for which equal monthly contributions
are made both by the Bank and by the employees at the rate of 8.33% of the basic salary of the employee. Compensated absences The Bank provides compensated absences to all its regular employees. Liability for unfunded scheme is recognized on the
basis of actuarial valuation using the “Projected Unit Credit Method”. Provision for the year is charged to unconsolidated profit and loss account. The amount recognised in the unconsolidated statement of financial position represents the present value of defined benefit obligations.
5.10 Revenue recognition
Mark-up / interest on advances and return on investments is recognised on accrual basis except on classified advances and investments which is recognized on receipt basis. Mark-up / interest on rescheduled / restructured advances and investments is recognised as permitted by the regulations of the SBP or overseas regulatory authority of the country where branch operates, except where in the opinion of the management it would not be prudent to do so.
Fees, commission and brokerage income is recognised at the time of performance of service. Dividend income is recognised when Bank’s right to receive the income is established. Gains and losses on sale of investments are included in income currently. Financing method is used in accounting for income from lease financing. Under this method, the unearned lease income
(excess of the sum of the total lease rentals and estimated residual value over the cost of leased assets) is deferred and taken to income over the term of the lease period so as to produce a constant periodic rate of return on the outstanding net investment in lease. Repossessed vehicles on account of loan default are recorded in memorandum account.
Unrealised lease income is suspended on classified leases, in accordance with the requirements of the Prudential Regulations issued by the SBP. Gains / losses on termination of lease contracts, documentation charges, front-end fees and other lease income are recognised as income on receipt basis.
Murabaha transactions are reflected as receivable at the invoiced amount. Actual sale and purchase are not reflected as the goods are purchased by the customer as agent of the Bank and all documents relating to purchase are in customers’ name. However, the profit on that sale not due for the payment is deferred by recording a credit to the “Deferred Murabaha Income” account.
Profits on Diminishing Musharaka financings are recognised on accrual basis. Consistent with prior years, profit required to be suspended in compliance with the Prudential Regulations issued by the SBP is recorded on receipt basis.
5.11 Foreign currencies
Foreign currency transactions Foreign currency transactions are translated into Pak. Rupee at the exchange rates prevailing on the date of transaction.
Monetary assets and liabilities in foreign currencies are translated to Pak. Rupee at the exchange rates prevailing at the date of unconsolidated statement of financial position. Outstanding foreign bills purchased are valued at the rates applicable to the remaining maturities. Exchange gains and losses are included in unconsolidated profit and loss account currently.
Foreign operation The assets and liabilities of Wholesale Bank Branch are translated to Pak. Rupee at exchange rates prevailing at the date
of unconsolidated statement of financial position. The results of foreign operations are translated at the average rate of exchange for the year.
Translation gains and losses Translation gains and losses arising on revaluation of net investment in foreign operations are taken to equity under
“Exchange Translation Reserve” through other comprehensive income and on disposal are recognised in unconsolidated profit and loss account.
Commitments Commitments for outstanding forward foreign exchange contracts are valued at the rates applicable to the remaining
maturities. 5.12 Provisions Provisions are recognised when there are present, legal or constructive obligations as a result of past events, it is probable
that an out flow of resources embodying economic benefits will be required to settle the obligation and a reliable estimate of the amounts can be made. Provision for guarantee claims and other off balance sheet obligations is recognized when intimated and reasonable certainty exists to settle the obligations. Expected recoveries are recognized by debiting customer accounts. Charge to unconsolidated profit and loss account is stated net off expected recoveries.

78
5.13 Off-setting Financial assets and financial liabilities are only set-off and the net amount is reported in the unconsolidated financial
statements when there is a legally enforceable right to set-off the recognised amount and the Bank intends either to settle on a net basis, or to realise the assets and to settle the liabilities simultaneously.
5.14 Financial assets and liabilities Financial assets and financial liabilities are recognised at the time when the Bank becomes a party to the contractual
provision of the instrument. Financial assets are de-recognised when the contractual right to future cash flows from the asset expires or is transferred along with the risk and reward of the asset. Financial liabilities are de-recognised when obligation specific in the contract discharges, cancels or expires. Any gain or loss on de-recognition of the financial asset and liability is recognised in the profit and loss account of the current period. The particular recognition and subsequent measurement methods adopted for significant financial assets and financial liabilities are disclosed in the individual policy statements associated with them.
5.15 Derivative financial instruments Derivative financial instruments are initially recognized at fair value on the date on which the derivative contract is
entered into and are subsequently re–measured at fair value using appropriate valuation techniques. All derivative financial instruments are carried as assets when fair value is positive and liabilities when fair value is negative. Any change in the fair value of derivative financial instruments is taken to the profit and loss account.
5.16 Appropriations subsequent to date of unconsolidated statement of financial position Appropriations subsequent to year end are recognised during the year in which those appropriations are made. 5.17 Segment reporting A segment is a distinguishable component of the Bank that is engaged in providing products or services (business segment) or
in providing product or services within a particular economic environment (geographical segment), which is subject to risks and rewards that are different from those of other segments. The Bank’s primary format of reporting is based on business segments.
5.17.1 Business segment Corporate finance Corporate financing includes corporate and investment banking activities such as mergers and acquisition, underwriting,
privatization, securitisation, IPO’s related activities and secondary private placements. Trading and Sales Trading and sales includes the Bank’s treasury and money market activities. Retail Banking Retail banking segment provides services to small borrowers and include loans, deposits and other transactions with retail
customers and credit card business. Commercial Banking Commercial banking segment provides services related to project finance, export finance, trade finance, leasing, lending,
guarantees, bills of exchange and deposits from corporate customers. Payment and settlement Payment and settlement includes income from payments and collections, funds transfer, clearing and settlement. Agency services Agency services include income from rent of lockers provided to customers. Sub-ordinated loans It represents Term Finance Certificates issued by the Bank. 5.17.2 Geographical segments The Bank operates in two geographic regions; Pakistan and the Middle East.
Notes to the Unconsolidated Financial StatementsFor the year ended December 31, 2012
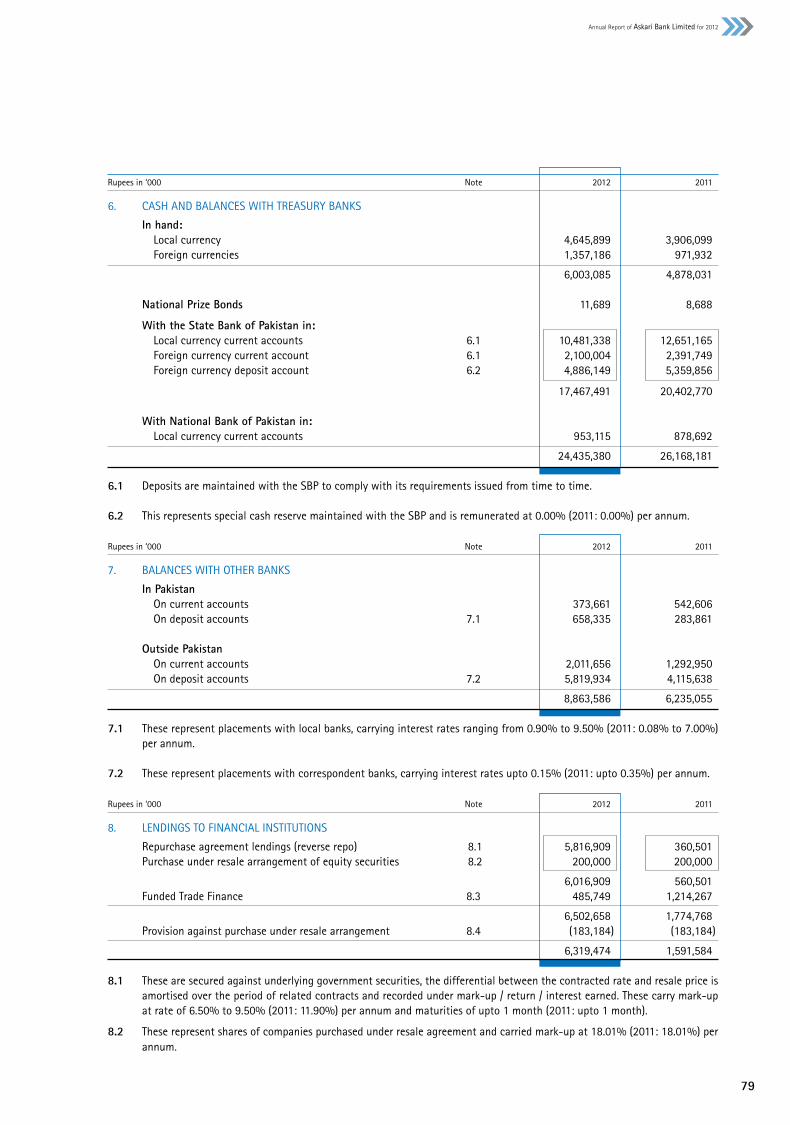
79
Annual Report of Askari Bank Limited for 2012
Rupees in ‘000 Note 2012 2011
6. CASH AND BALANCES WITH TREASURY BANKS
In hand: Local currency 4,645,899 3,906,099 Foreign currencies 1,357,186 971,932
6,003,085 4,878,031 National Prize Bonds 11,689 8,688
With the State Bank of Pakistan in: Local currency current accounts 6.1 10,481,338 12,651,165 Foreign currency current account 6.1 2,100,004 2,391,749 Foreign currency deposit account 6.2 4,886,149 5,359,856
17,467,491 20,402,770 With National Bank of Pakistan in: Local currency current accounts 953,115 878,692
24,435,380 26,168,181 6.1 Deposits are maintained with the SBP to comply with its requirements issued from time to time.
6.2 This represents special cash reserve maintained with the SBP and is remunerated at 0.00% (2011: 0.00%) per annum. Rupees in ‘000 Note 2012 2011
7. BALANCES WITH OTHER BANKS
In Pakistan On current accounts 373,661 542,606 On deposit accounts 7.1 658,335 283,861 Outside Pakistan On current accounts 2,011,656 1,292,950 On deposit accounts 7.2 5,819,934 4,115,638
8,863,586 6,235,055 7.1 These represent placements with local banks, carrying interest rates ranging from 0.90% to 9.50% (2011: 0.08% to 7.00%)
per annum.
7.2 These represent placements with correspondent banks, carrying interest rates upto 0.15% (2011: upto 0.35%) per annum.
Rupees in ‘000 Note 2012 2011
8. LENDINGS TO FINANCIAL INSTITUTIONS
Repurchase agreement lendings (reverse repo) 8.1 5,816,909 360,501 Purchase under resale arrangement of equity securities 8.2 200,000 200,000
6,016,909 560,501 Funded Trade Finance 8.3 485,749 1,214,267
6,502,658 1,774,768 Provision against purchase under resale arrangement 8.4 (183,184) (183,184)
6,319,474 1,591,584 8.1 These are secured against underlying government securities, the differential between the contracted rate and resale price is
amortised over the period of related contracts and recorded under mark-up / return / interest earned. These carry mark-up at rate of 6.50% to 9.50% (2011: 11.90%) per annum and maturities of upto 1 month (2011: upto 1 month).
8.2 These represent shares of companies purchased under resale agreement and carried mark-up at 18.01% (2011: 18.01%) per annum.

80
8.3 These represent finance provided by Wholesale Bank Branch to Bank of Ceylon, Sri Lanka at mark-up rate of 2.06% (2011: 2.01% to 2.03%) per annum with maturities of upto January 2013 and July 2013 (2011: upto April 2012 and December 2012).
Rupees in ‘000 2012 2011
8.4 Particulars of provision against purchase under resale arrangement
Opening balance 183,184 148,482 Charge for the year - 34,702
Closing balance 183,184 183,184 8.5 Particulars of lending In local currency 6,016,909 560,501 In foreign currencies 485,749 1,214,267
6,502,658 1,774,768 2012 2011
Further Further Held by given as Held by given asRupees in ‘000 the Bank collateral Total the Bank collateral Total
8.6 Securities held as collateral against lendings to financial institutions
Market Treasury Bills 5,666,972 – 5,666,972 360,501 – 360,501 Pakistan Investment Bonds 149,937 – 149,937 – – – Purchase under resale arrangement of listed shares 200,000 – 200,000 200,000 – 200,000
6,016,909 – 6,016,909 560,501 – 560,501 Market value of securities held as collateral is Rs. 5,854,838 thousand (2011: Rs. 377,645 thousand).
Notes to the Unconsolidated Financial StatementsFor the year ended December 31, 2012

81
Annual Report of Askari Bank Limited for 2012
9. INVESTMENTS 2012 2011
Held by Given as Held by Given asRupees in ‘000 Note the Bank collateral Total the Bank collateral Total
9.1 Investments by types Held for trading securities
Fully paid ordinary shares 151,593 - 151,593 - - -
Available for sale securities
Market Treasury Bills 9.16 98,661,356 - 98,661,356 85,163,963 7,933,076 93,097,039
Pakistan Investment Bonds 9.16 22,098,414 - 22,098,414 18,760,393 36,602 18,796,995
Fully paid ordinary shares / units 2,475,678 - 2,475,678 1,637,867 - 1,637,867
Units of open end mutual funds 9.4 1,708,814 - 1,708,814 1,574,714 - 1,574,714
Fully paid preference shares 9.6 233,324 - 233,324 67,000 - 67,000
Term Finance Certificates 5,321,376 - 5,321,376 4,895,969 - 4,895,969
National Investment Trust (NIT) Units 864,395 - 864,395 372,762 - 372,762
Sukuk Certificates 9.9 8,928,672 - 8,928,672 8,150,281 - 8,150,281
Government of Pakistan Euro Bonds 9.10 1,037,900 - 1,037,900 948,612 - 948,612
Foreign securities 9.11 49,328 - 49,328 133,555 - 133,555
141,379,257 - 141,379,257 121,705,116 7,969,678 129,674,794
Held to maturity securities
Term Finance Certificates 116,348 - 116,348 523,726 - 523,726
Pakistan Investment Bonds 9.16 742,377 - 742,377 1,070,676 - 1,070,676
Government of Pakistan Euro Bonds 9.2.4 1,155,746 - 1,155,746 1,038,061 - 1,038,061
Sukuk Certificates 9.13 1,594,167 - 1,594,167 1,728,334 - 1,728,334
Credit Linked Notes - - - 449,729 - 449,729
3,608,638 - 3,608,638 4,810,526 - 4,810,526
Investment in associate
Askari General Insurance Company Limited 9.12 53,703 - 53,703 53,703 - 53,703
Investment in subsidiaries
Askari Investment Management Limited 9.5 185,000 - 185,000 185,000 - 185,000
Askari Securities Limited 9.5 114,789 - 114,789 114,789 - 114,789
Investment at cost 145,492,980 - 145,492,980 126,869,134 7,969,678 134,838,812
Provision for diminution in value
of investments 9.2.1 (597,021) - (597,021) (420,806) - (420,806)
Investments (net of provision) 144,895,959 - 144,895,959 126,448,328 7,969,678 134,418,006
Unrealised gain on revaluation of
held for trading securities - net 9.15 252 - 252 - - -
Surplus / (deficit) on revaluation of
available for sale securities - net 481,937 - 481,937 (665,819) 4,525 (661,294)
Total investments 145,378,148 - 145,378,148 125,782,509 7,974,203 133,756,712
Market value of held to maturity securities as at December 31, 2012 is Rs. 3,609,976 thousand (2011: Rs. 4,605,207 thousand).

82
Rupees in ‘000 Note 2012 2011
9.2 Investments by segments
Federal Government Securities 9.2.3 Market Treasury Bills 98,661,356 93,097,039 Pakistan Investment Bonds 22,840,791 19,867,671 Government of Pakistan Euro Bonds 9.2.4 2,193,646 1,986,673 Sukuk Certificates 9,282,712 8,300,000
132,978,505 123,251,383 Fully paid up ordinary shares / units Listed companies / funds 9.3 2,675,294 1,635,890 Unlisted companies 9.5 305,469 355,469
2,980,763 1,991,359 Units of open end mutual funds 9.4 1,708,814 1,574,714
Fully paid preference shares Listed companies 9.6 208,324 42,000 Unlisted companies 9.6 25,000 25,000
Term Finance Certificates 9.7
Listed Term Finance Certificates 2,343,871 2,529,589 Unlisted Term Finance Certificates 3,093,853 2,890,106
5,437,724 5,419,695 Foreign Securities
Mena Transformation Fund 9.11 49,328 133,555 Credit Linked Notes - 449,729
49,328 583,284 Other Investments
Sukuk Certificates 1,240,127 1,578,615 National Investment Trust (NIT) - Units 864,395 372,762
2,104,522 1,951,377
Total investment at cost 145,492,980 134,838,812 Provision for diminution in value of investments 9.2.1 (597,021) (420,806)
Investments - net of provisions 144,895,959 134,418,006 Unrealised gain on revaluation of held for trading securities - net 9.15 252 - Surplus / (deficit) on revaluation of available for sale securities - net 481,937 (661,294)
Total investments 145,378,148 133,756,712 9.2.1 Particulars of provision for diminution in value of investments Opening balance 420,806 377,210 Charge for the year 201,265 43,596 Reversal / transfer of provision during the year (25,050) -
Closing balance 597,021 420,806 9.2.2 Particulars of provision in respect of type and segment
Available for sale securities Fully paid ordinary shares - unlisted 5,680 5,680 Preference shares - unlisted 25,000 27,550 Term finance certificates 236,026 102,729 Sukuk certificates 242,288 174,320 Held to maturity securities Term finance certificates - 22,500 Subsidiaries Fully paid ordinary shares - unlisted 88,027 88,027
597,021 420,806
Notes to the Unconsolidated Financial StatementsFor the year ended December 31, 2012
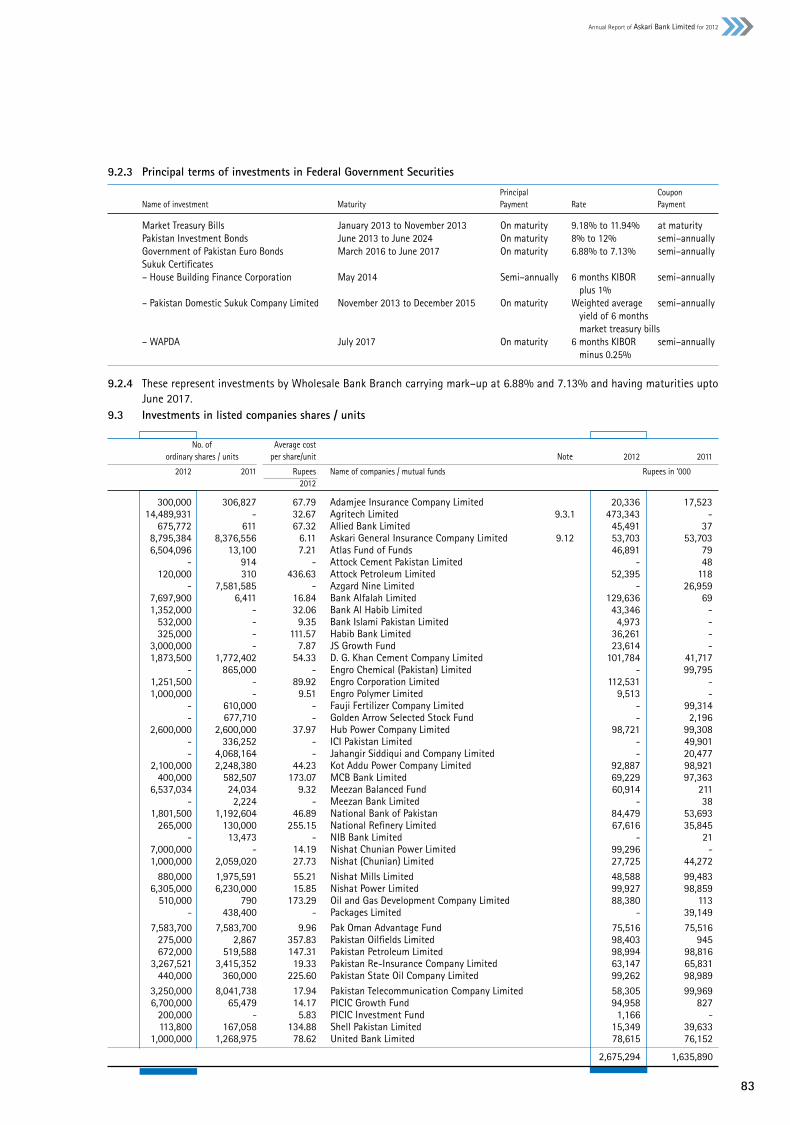
83
Annual Report of Askari Bank Limited for 2012
9.3 Investments in listed companies shares / units No. of Average cost ordinary shares / units per share/unit Note 2012 2011
2012 2011 Rupees Name of companies / mutual funds Rupees in ‘000 2012
300,000 306,827 67.79 Adamjee Insurance Company Limited 20,336 17,523 14,489,931 - 32.67 Agritech Limited 9.3.1 473,343 - 675,772 611 67.32 Allied Bank Limited 45,491 37 8,795,384 8,376,556 6.11 Askari General Insurance Company Limited 9.12 53,703 53,703 6,504,096 13,100 7.21 Atlas Fund of Funds 46,891 79 - 914 - Attock Cement Pakistan Limited - 48 120,000 310 436.63 Attock Petroleum Limited 52,395 118 - 7,581,585 - Azgard Nine Limited - 26,959 7,697,900 6,411 16.84 Bank Alfalah Limited 129,636 69 1,352,000 - 32.06 Bank Al Habib Limited 43,346 - 532,000 - 9.35 Bank Islami Pakistan Limited 4,973 - 325,000 - 111.57 Habib Bank Limited 36,261 - 3,000,000 - 7.87 JS Growth Fund 23,614 - 1,873,500 1,772,402 54.33 D. G. Khan Cement Company Limited 101,784 41,717 - 865,000 - Engro Chemical (Pakistan) Limited - 99,795 1,251,500 - 89.92 Engro Corporation Limited 112,531 - 1,000,000 - 9.51 Engro Polymer Limited 9,513 - - 610,000 - Fauji Fertilizer Company Limited - 99,314 - 677,710 - Golden Arrow Selected Stock Fund - 2,196 2,600,000 2,600,000 37.97 Hub Power Company Limited 98,721 99,308 - 336,252 - ICI Pakistan Limited - 49,901 - 4,068,164 - Jahangir Siddiqui and Company Limited - 20,477 2,100,000 2,248,380 44.23 Kot Addu Power Company Limited 92,887 98,921 400,000 582,507 173.07 MCB Bank Limited 69,229 97,363 6,537,034 24,034 9.32 Meezan Balanced Fund 60,914 211 - 2,224 - Meezan Bank Limited - 38 1,801,500 1,192,604 46.89 National Bank of Pakistan 84,479 53,693 265,000 130,000 255.15 National Refinery Limited 67,616 35,845 - 13,473 - NIB Bank Limited - 21 7,000,000 - 14.19 Nishat Chunian Power Limited 99,296 - 1,000,000 2,059,020 27.73 Nishat (Chunian) Limited 27,725 44,272 880,000 1,975,591 55.21 Nishat Mills Limited 48,588 99,483 6,305,000 6,230,000 15.85 Nishat Power Limited 99,927 98,859 510,000 790 173.29 Oil and Gas Development Company Limited 88,380 113 - 438,400 - Packages Limited - 39,149 7,583,700 7,583,700 9.96 Pak Oman Advantage Fund 75,516 75,516 275,000 2,867 357.83 Pakistan Oilfields Limited 98,403 945 672,000 519,588 147.31 Pakistan Petroleum Limited 98,994 98,816 3,267,521 3,415,352 19.33 Pakistan Re-Insurance Company Limited 63,147 65,831 440,000 360,000 225.60 Pakistan State Oil Company Limited 99,262 98,989 3,250,000 8,041,738 17.94 Pakistan Telecommunication Company Limited 58,305 99,969 6,700,000 65,479 14.17 PICIC Growth Fund 94,958 827 200,000 - 5.83 PICIC Investment Fund 1,166 - 113,800 167,058 134.88 Shell Pakistan Limited 15,349 39,633 1,000,000 1,268,975 78.62 United Bank Limited 78,615 76,152
2,675,294 1,635,890
9.2.3 Principal terms of investments in Federal Government Securities
Principal Coupon Name of investment Maturity Payment Rate Payment
Market Treasury Bills January 2013 to November 2013 On maturity 9.18% to 11.94% at maturity Pakistan Investment Bonds June 2013 to June 2024 On maturity 8% to 12% semi–annually Government of Pakistan Euro Bonds March 2016 to June 2017 On maturity 6.88% to 7.13% semi–annually Sukuk Certificates – House Building Finance Corporation May 2014 Semi–annually 6 months KIBOR semi–annually plus 1% – Pakistan Domestic Sukuk Company Limited November 2013 to December 2015 On maturity Weighted average semi–annually yield of 6 months market treasury bills – WAPDA July 2017 On maturity 6 months KIBOR semi–annually minus 0.25%
9.2.4 These represent investments by Wholesale Bank Branch carrying mark–up at 6.88% and 7.13% and having maturities upto June 2017.

84
9.5 Particulars of investments held in unlisted companies Based on Cost / audited paid–up Total financial Percentage Number value per paid–up Break up statements Name of Chief Investee Note of holding of shares share value value as at Executive / status
% Rupees Rupees in ‘000
Askari Investment Management Limited - subsidiary 9.5.1 100 18,500,000 10 185,000 159,123 31 Dec 2012 Mr. Adnan Siddiqui Askari Securities Limited - subsidiary 9.5.2 74 17,020,000 10 114,789 83,794 31 Dec 2012 Mr. Faheem Sardar Pakistan Export Finance Guarantee Agency Limited - a related party 9.5.3 5.26 568,044 10 5,680 - - Under liquidation
305,469 9.5.1 Askari Investment Management Limited (AIML) is a wholly owned subsidiary of the Bank, licensed as a non-banking finance company
(NBFC), to undertake asset management and investment advisory services under Non Banking Finance Companies and Notified Entities Regulations, 2007 (NBFC and NE Regulations).
Two shares are held in the name of two nominee directors of the Bank in AIML.
9.5.2 Askari Securities Limited (ASL) is a partly owned subsidiary of the Bank, incorporated under the Companies Ordinance, 1984 as a public limited company to undertake the business of share brokerage, investment advisory and consultancy services.
Four shares are held in the name of four nominee directors of the Bank in ASL.
9.5.3 The difference between the paid up value and break up value of Pakistan Export Finance Guarantee Agency Limited amounting to Rs. 5,680 thousand (2011: Rs 5,680 thousand) is considered as impairment loss and has been fully provided for.
9.6 Particulars of investments held in preference shares
Paid–up No. of preference shares value Book Value Market Value
2012 2011 per share Investee Rate % 2012 2011 2012 2011
Rupees Rupees in ‘000 Rupees in ‘000
Listed
10,000,000 10,000,000 10 Chenab Limited 9.25% per annum 100 17,000 10,500 17,000 18,322,418 - 10 Agritech Limited - note 9.6.1 11.00% per annum 183,224 - 185,056 - 2,500,000 2,500,000 10 Masood Textile Mills Limited Average of ask side of six months KIBOR plus 2% per annum 25,000 25,000 25,000 25,000
Un-listed
2,500,000 2,500,000 10 First Dawood Investment 4% per annum Bank Limited 25,000 25,000 25,000 25,000
233,324 67,000 245,556 67,000
9.6.1 This represents preference shares acquired in settlement of overdue / accrued mark-up upto July 01, 2011 on Term Finance Certificates of Azgard Nine Limited pursuant to the restructuring agreement dated July 01, 2011 and share subscription agreement dated February 13, 2012.
9.3.1 This represents shares acquired by the Bank pursuant to sale purchase agreement executed on October 31, 2012, mainly for partial settlement of the Bank’s exposure in Azgard Nine Limited (ANL).
9.4 Units of open end mutual funds
Paid–up No. of units value per unit Note 2012 2011
2012 2011 Rupees Name of mutual funds Rupees in ‘000 2012
2,500,000 2,500,000 40.34 Askari Asset Allocation Fund (a related party) 9.8 100,846 100,846 11,642,356 11,642,356 99.46 Askari High Yield Scheme (a related party) 9.8 1,157,968 1,157,968 1,095,837 1,095,837 91.25 Askari Islamic Asset Allocation Fund (a related party) 9.8 100,000 100,000 1,598,805 1,598,805 93.82 Askari Islamic Income Fund (a related party) 9.8 150,000 150,000 - 505,076 - Askari Sovereign Cash Fund (a related party) 9.8 - 50,009 1,000,000 - 100.00 Askari Equity Fund (a related party) 9.8 100,000 - 1,000,000 - 100.00 Askari Sovereign Yield Enhancer Fund (a related party) 9.8 100,000 - - 1,330,882 - Al Meezan Mutual Fund - 15,891
1,708,814 1,574,714
Notes to the Unconsolidated Financial StatementsFor the year ended December 31, 2012

85
Annual Report of Askari Bank Limited for 2012
9.7 Investment in Term Finance Certificates
Redeemed value No. of certificates Company’s Name per certificate 2012 2011 2012 2011 Rupees Rupees in ‘000
Listed
13,669 13,669 Allied Bank Limited 4,988 68,181 68,208 95,600 35,000 Bank Alfalah Limited 4,737 452,868 141,318 - 30,000 Bank Al-Habib Limited - - 99,740 - 8,000 Orix Leasing Limited - - 6,672 37,230 37,230 Pace Pakistan Limited 4,832 179,882 177,576 97,493 97,493 Pak Arab Fertilizer Limited 1,497 145,929 355,132 41,000 40,000 Pakistan Mobile Communication Limited 3,129 128,280 99,840 140,000 140,000 Engro Fertilizer Limited 5,000 700,000 700,000 4,600 4,600 Faysal Bank Limited 1,247 5,736 11,477 12,000 12,000 Soneri Bank Limited 1,247 14,964 44,892 10,000 10,000 Standard Chartered Bank Limited 1,250 12,500 34,960 72,432 92,432 United Bank Limited 4,883 353,651 423,657 133,023 133,023 Worldcall Telecom Limited 2,119 281,880 366,117
Book value as on December 31 2,343,871 2,529,589
Unlisted 140,000 140,000 Agritech Limited 4,996 699,389 699,389 30,000 30,000 Avari Hotels Limited 4,246 127,372 127,372 (Chief Executive: Mr. Byram Dinshawji Avari) 86,000 86,000 Azgard Nine Limited - notes 9.3.1 & 9.6.1 2,168 186,457 429,969 50,600 35,600 Bank Alfalah Limited 5,141 260,147 182,389 50,000 - Bank Al-Habib Limited 5,198 259,912 - 3,700 3,700 Bunny’s Limited 5,000 18,500 18,500 (Chief Executive: Mr. Haroon Shafique Chaudhary) - 20,000 Dewan Farooq Spinning Mills Limited - - 25,000 74,900 74,900 Jahangir Siddiqui and Company Limited 4,963 371,728 367,850 - 10,000 KASB Securities Limited - - 16,668 3,560 3,560 Orix Leasing Pakistan Limited 16,661 59,312 176,237 10,077 10,077 Pak Hy Oils Limited 5,000 50,385 50,385 (Chief Executive: Mr. Tariq Siddique Paracha) 20,000 20,000 Pak Libya Holding Company (Private) Limited 4,997 99,940 99,980 (Chief Executive: Mr. Abid Aziz) 60,000 5,931 Pakistan Mobile Communication Limited 4,706 282,353 29,657 (Chief Executive: Mr. Rashid Naseer Khan) 50,000 50,000 Pakistan International Airlines Corporation Limited 4,996 249,800 249,800 102,282 83,865 Pakistan National Shipping Corporation 3,750 383,558 366,910 10,000 10,000 Shakarganj Mills Limited 4,500 45,000 50,000
Book value as on December 31 3,093,853 2,890,106
9.7.1 These carry rate of return ranging from 10.36% to 15.00% (2011: 8.45% to 15.64%) per annum and having remaining maturity periods of upto 8 years (2011: 9 years).

86
9.8 This represents investment in funds managed by Askari Investment Management Limited; a wholly owned subsidiary of the Bank.
9.9 Sukuk certificates – available for sale
Name of Investee Rate Maturity 2012 2011
Rupees in ‘000
Eden Builders (Private) Limited Average of offer side of 3 March 8, 2014 37,500 67,500 month KIBOR plus 2.3% p.a. (floor 3.5%, cap 35%) House Building Finance Corporation Average of offer side of 6 May 8, 2014 30,000 50,000 month KIBOR plus 1% p.a. JDW Sugar Mills Limited Average of offer side of 3 June 20, 2014 66,666 111,111 month KIBOR plus 1.25% p.a. (floor 3%, cap 25%) K.S. Sulmanji and Esmailji and Average of offer side of 3 June 30, 2014 106,346 106,346 Sons (Private) Limited month KIBOR plus 1.4% p.a. Kohat Cement Limited Average of offer side of 3 month September 20, 2016 57,378 176,500 KIBOR plus 1.5% p.a. Agritech Limited Average of offer side of 6 month August 6, 2019 299,963 299,963 KIBOR plus 2% p.a. Pak Electron Limited Average of offer side of 3 month June 28, 2013 10,714 10,736 KIBOR plus 1.75% p.a. Pakistan Domestic Sukuk Weighted average yield of 6 December 20, 2013 2,000,000 2,000,000 Company Limited months market treasury bills Pakistan Domestic Sukuk Weighted average yield of September 18, 2015 1,002,712 - Company Limited 6 months market treasury bills Pakistan Domestic Sukuk Weighted average yield of 6 March 7, 2014 3,000,000 3,000,000 Company Limited months market treasury bills Pakistan Domestic Sukuk Weighted average yield of 6 December 26, 2014 2,000,000 2,000,000 Company Limited months market treasury bills Shahraj Fabric Limited Average of offer side of 6 December 31, 2012 150,000 150,000 month KIBOR plus 2.1% p.a. Sitara Peroxide Limited Average of offer side of 1 February 19, 2020 167,393 178,125 month KIBOR plus 1% p.a.
8,928,672 8,150,281
9.10 These represent investments by Wholesale Bank Branch carrying mark-up at 6.88% and 7.13% and having maturities upto June 2017.
9.11 The Bank has invested in Mena Transformation Fund I.L.P., a closed end fund having six years term.
9.12 Investment in associate represents 27.18% (2011: 27.18%) investment in the equity of Askari General Insurance Company Limited (AGICO), a listed associated company. Summary of financial information of AGICO is given below:
3,075 shares are held in the name of a nominee director of the Bank in AGICO.
Based on
September 30, December 31, 2012 2011Rupees in ‘000 (Un–audited) (Audited)
Assets 1,647,025 1,544,980 Liabilities 1,159,604 1,112,773 Equity 487,421 432,207 Revenue 515,226 633,283 Profit after tax 55,213 65,434 Fair value of investment in AGICO as at December 31, 2012 is Rs. 118,738 thousand (December 31, 2011: Rs. 67,599
thousand).
Notes to the Unconsolidated Financial StatementsFor the year ended December 31, 2012

87
Annual Report of Askari Bank Limited for 2012
9.13 Sukuk certificates – held to maturity
Name of Investee Rate Maturity 2012 2011
Rupees in ‘000
Arzoo Textile Limited Average of offer side of 6 month April 14, 2014 110,000 110,000 KIBOR plus 2% (for 1-2 years), 1.75% (for 3-6 years) p.a. Educational Excellence Limited Average of offer side of 6 month November 19, 2013 67,500 135,000 KIBOR plus 2.5% p.a. Pakistan Domestic Sukuk Weighted average yield of 6 November 15, 2013 1,250,000 1,250,000 Company Limited months market treasury bills
Sui Southern Gas Company Average of offer side of 3 June 28, 2012 - 33,334
Limited month KIBOR plus 0.8% p.a.
(floor 1.5%, cap 35%)
WAPDA Average of offer side of 6 July 13, 2017 166,667 200,000
month KIBOR minus 0.25%
p.a.
1,594,167 1,728,334
9.14 Quality of available for sale securities
Note 2012 2011Rupees in ‘000 Market Value Rating Market Value Rating
Market Treasury Bills 9.14.1 98,902,773 unrated 93,023,836 unrated Pakistan Investment Bonds 9.14.1 22,633,877 unrated 18,711,293 unrated Fully paid up ordinary shares / units 9.14.3 Adamjee Insurance Company Limited 20,442 AA 14,271 AA Allied Bank Limited 49,662 AA+ 33 AA Atlas Fund of Funds 62,049 unrated 72 unrated Attock Cement Limited - - 47 unrated Attock Petroleum Limited 61,439 unrated 128 unrated Agritech Limited 169,098 D - - Azgard Nine Limited - - 21,608 D Bank Alfalah Limited 129,479 AA 72 AA Bank Al Habib Limited 42,899 AA+ - - Bank Islami Pakistan Limited 4,900 A - - D. G. Khan Cement Company Limited - - 33,729 unrated Engro Corporation Limited 98,022 A 80,186 AA Engro Polymer Limited 10,120 unrated - - Fauji Fertilizer Company Limited - - 91,219 unrated Golden Arrow Selected Stock Fund - - 1,837 unrated Hub Power Company Limited 117,624 AA+ 88,920 AA+ Habib Bank Limited 38,288 AAA - - ICI Pakistan Limited - - 40,441 unrated Jahangir Siddiqui and Company Limited - - 16,395 AA JS Growth Fund 26,190 unrated - - Khushhali Bank Limited - - 50,000 A Kot Addu Power Company Limited 103,719 AA+ 92,903 AA+ MCB Bank Limited 83,904 AA+ 78,405 AA+ Meezan Balanced Fund 75,568 unrated 219 unrated Meezan Bank Limited - - 39 AA- National Bank of Pakistan 83,963 AAA 48,956 AAA
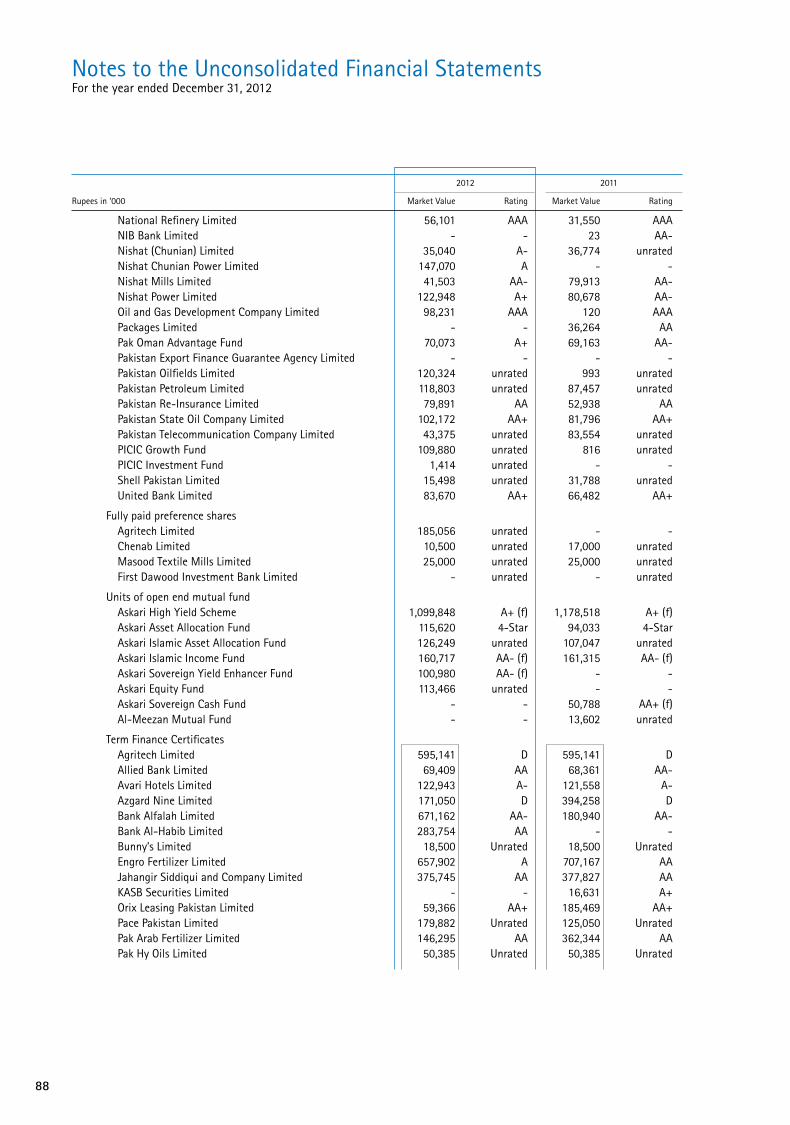
88
2012 2011
Rupees in ‘000 Market Value Rating Market Value Rating
National Refinery Limited 56,101 AAA 31,550 AAA NIB Bank Limited - - 23 AA- Nishat (Chunian) Limited 35,040 A- 36,774 unrated Nishat Chunian Power Limited 147,070 A - - Nishat Mills Limited 41,503 AA- 79,913 AA- Nishat Power Limited 122,948 A+ 80,678 AA- Oil and Gas Development Company Limited 98,231 AAA 120 AAA Packages Limited - - 36,264 AA Pak Oman Advantage Fund 70,073 A+ 69,163 AA- Pakistan Export Finance Guarantee Agency Limited - - - - Pakistan Oilfields Limited 120,324 unrated 993 unrated Pakistan Petroleum Limited 118,803 unrated 87,457 unrated Pakistan Re-Insurance Limited 79,891 AA 52,938 AA Pakistan State Oil Company Limited 102,172 AA+ 81,796 AA+ Pakistan Telecommunication Company Limited 43,375 unrated 83,554 unrated PICIC Growth Fund 109,880 unrated 816 unrated PICIC Investment Fund 1,414 unrated - - Shell Pakistan Limited 15,498 unrated 31,788 unrated United Bank Limited 83,670 AA+ 66,482 AA+
Fully paid preference shares Agritech Limited 185,056 unrated - - Chenab Limited 10,500 unrated 17,000 unrated Masood Textile Mills Limited 25,000 unrated 25,000 unrated First Dawood Investment Bank Limited - unrated - unrated
Units of open end mutual fund Askari High Yield Scheme 1,099,848 A+ (f) 1,178,518 A+ (f) Askari Asset Allocation Fund 115,620 4-Star 94,033 4-Star Askari Islamic Asset Allocation Fund 126,249 unrated 107,047 unrated Askari Islamic Income Fund 160,717 AA- (f) 161,315 AA- (f) Askari Sovereign Yield Enhancer Fund 100,980 AA- (f) - - Askari Equity Fund 113,466 unrated - - Askari Sovereign Cash Fund - - 50,788 AA+ (f) Al-Meezan Mutual Fund - - 13,602 unrated
Term Finance Certificates Agritech Limited 595,141 D 595,141 D Allied Bank Limited 69,409 AA 68,361 AA- Avari Hotels Limited 122,943 A- 121,558 A- Azgard Nine Limited 171,050 D 394,258 D Bank Alfalah Limited 671,162 AA- 180,940 AA- Bank Al-Habib Limited 283,754 AA - - Bunny’s Limited 18,500 Unrated 18,500 Unrated Engro Fertilizer Limited 657,902 A 707,167 AA Jahangir Siddiqui and Company Limited 375,745 AA 377,827 AA KASB Securities Limited - - 16,631 A+ Orix Leasing Pakistan Limited 59,366 AA+ 185,469 AA+ Pace Pakistan Limited 179,882 Unrated 125,050 Unrated Pak Arab Fertilizer Limited 146,295 AA 362,344 AA Pak Hy Oils Limited 50,385 Unrated 50,385 Unrated
Notes to the Unconsolidated Financial StatementsFor the year ended December 31, 2012
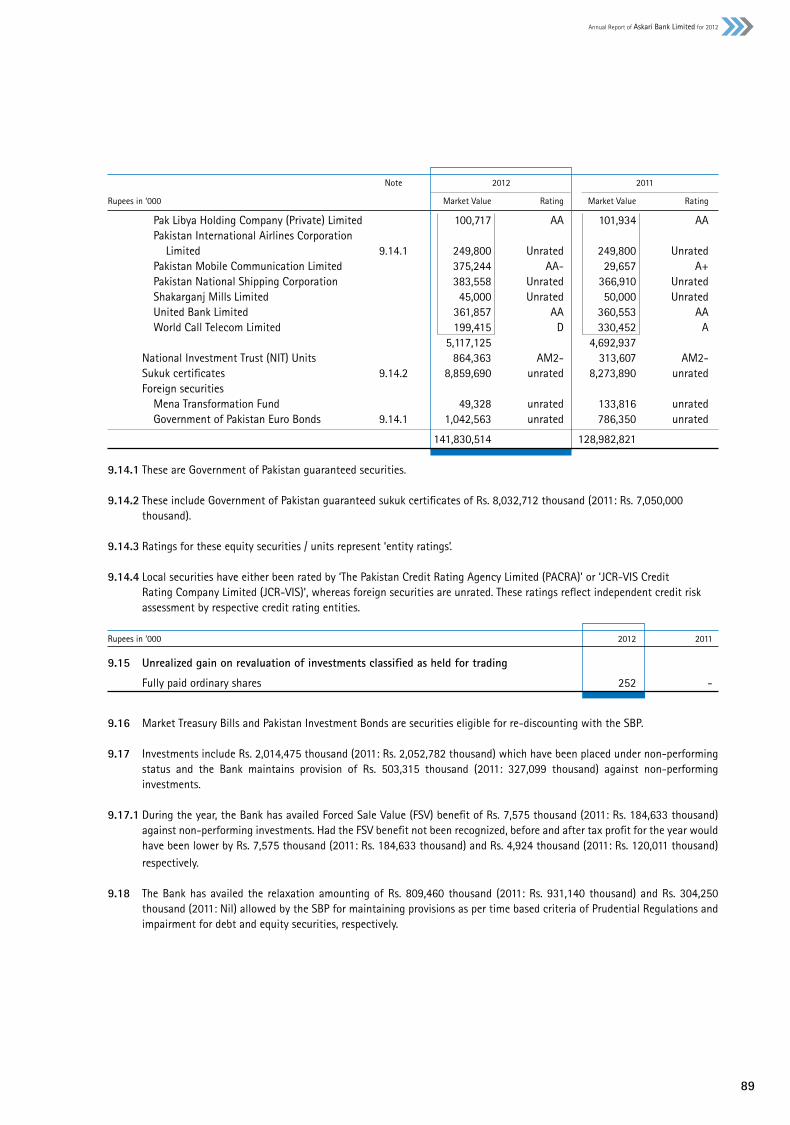
89
Annual Report of Askari Bank Limited for 2012
Note 2012 2011
Rupees in ‘000 Market Value Rating Market Value Rating
Pak Libya Holding Company (Private) Limited 100,717 AA 101,934 AA Pakistan International Airlines Corporation Limited 9.14.1 249,800 Unrated 249,800 Unrated Pakistan Mobile Communication Limited 375,244 AA- 29,657 A+ Pakistan National Shipping Corporation 383,558 Unrated 366,910 Unrated Shakarganj Mills Limited 45,000 Unrated 50,000 Unrated United Bank Limited 361,857 AA 360,553 AA World Call Telecom Limited 199,415 D 330,452 A 5,117,125 4,692,937 National Investment Trust (NIT) Units 864,363 AM2- 313,607 AM2- Sukuk certificates 9.14.2 8,859,690 unrated 8,273,890 unrated Foreign securities Mena Transformation Fund 49,328 unrated 133,816 unrated Government of Pakistan Euro Bonds 9.14.1 1,042,563 unrated 786,350 unrated
141,830,514 128,982,821 9.14.1 These are Government of Pakistan guaranteed securities. 9.14.2 These include Government of Pakistan guaranteed sukuk certificates of Rs. 8,032,712 thousand (2011: Rs. 7,050,000
thousand). 9.14.3 Ratings for these equity securities / units represent ‘entity ratings’. 9.14.4 Local securities have either been rated by ‘The Pakistan Credit Rating Agency Limited (PACRA)’ or ‘JCR-VIS Credit
Rating Company Limited (JCR-VIS)’, whereas foreign securities are unrated. These ratings reflect independent credit risk assessment by respective credit rating entities.
Rupees in ‘000 2012 2011
9.15 Unrealized gain on revaluation of investments classified as held for trading
Fully paid ordinary shares 252 -
9.16 Market Treasury Bills and Pakistan Investment Bonds are securities eligible for re-discounting with the SBP.
9.17 Investments include Rs. 2,014,475 thousand (2011: Rs. 2,052,782 thousand) which have been placed under non-performing status and the Bank maintains provision of Rs. 503,315 thousand (2011: 327,099 thousand) against non-performing investments.
9.17.1 During the year, the Bank has availed Forced Sale Value (FSV) benefit of Rs. 7,575 thousand (2011: Rs. 184,633 thousand) against non-performing investments. Had the FSV benefit not been recognized, before and after tax profit for the year would have been lower by Rs. 7,575 thousand (2011: Rs. 184,633 thousand) and Rs. 4,924 thousand (2011: Rs. 120,011 thousand) respectively.
9.18 The Bank has availed the relaxation amounting of Rs. 809,460 thousand (2011: Rs. 931,140 thousand) and Rs. 304,250 thousand (2011: Nil) allowed by the SBP for maintaining provisions as per time based criteria of Prudential Regulations and impairment for debt and equity securities, respectively.
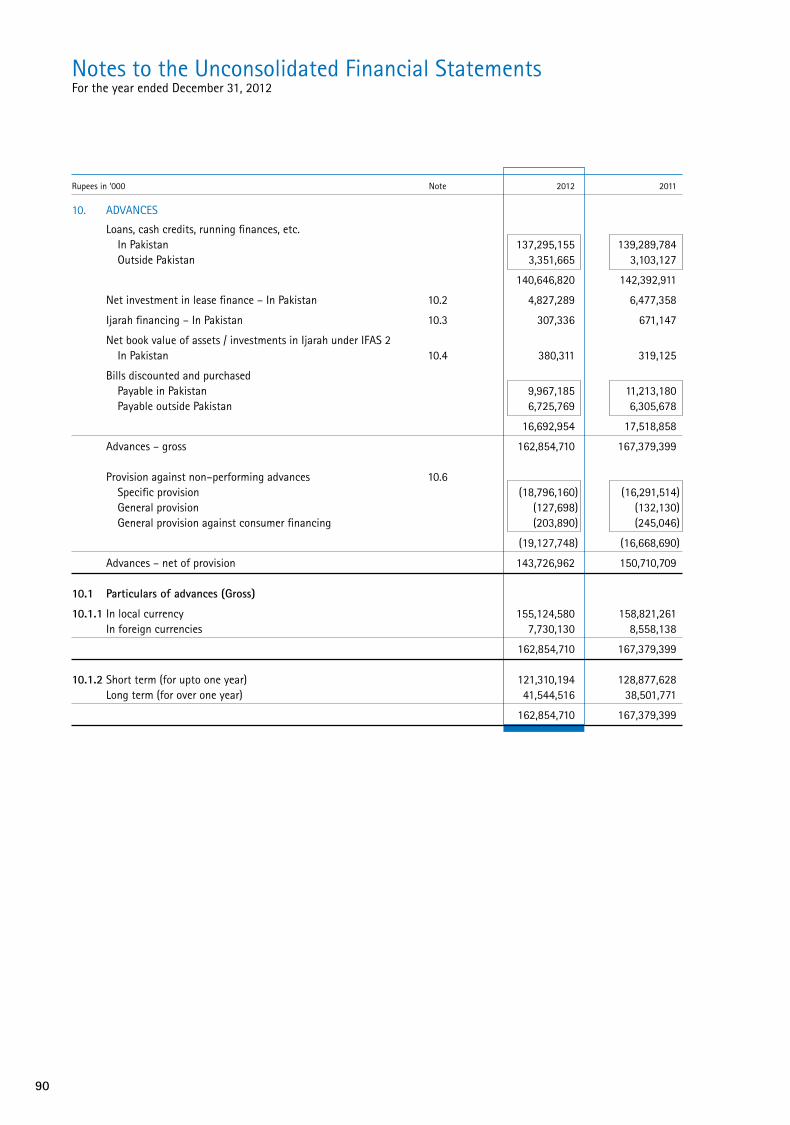
90
Rupees in ‘000 Note 2012 2011
10. ADVANCES
Loans, cash credits, running finances, etc. In Pakistan 137,295,155 139,289,784 Outside Pakistan 3,351,665 3,103,127
140,646,820 142,392,911
Net investment in lease finance – In Pakistan 10.2 4,827,289 6,477,358
Ijarah financing – In Pakistan 10.3 307,336 671,147
Net book value of assets / investments in Ijarah under IFAS 2 In Pakistan 10.4 380,311 319,125
Bills discounted and purchased Payable in Pakistan 9,967,185 11,213,180 Payable outside Pakistan 6,725,769 6,305,678
16,692,954 17,518,858
Advances – gross 162,854,710 167,379,399 Provision against non–performing advances 10.6 Specific provision (18,796,160) (16,291,514) General provision (127,698) (132,130) General provision against consumer financing (203,890) (245,046)
(19,127,748) (16,668,690)
Advances – net of provision 143,726,962 150,710,709 10.1 Particulars of advances (Gross)
10.1.1 In local currency 155,124,580 158,821,261 In foreign currencies 7,730,130 8,558,138
162,854,710 167,379,399 10.1.2 Short term (for upto one year) 121,310,194 128,877,628 Long term (for over one year) 41,544,516 38,501,771
162,854,710 167,379,399
Notes to the Unconsolidated Financial StatementsFor the year ended December 31, 2012
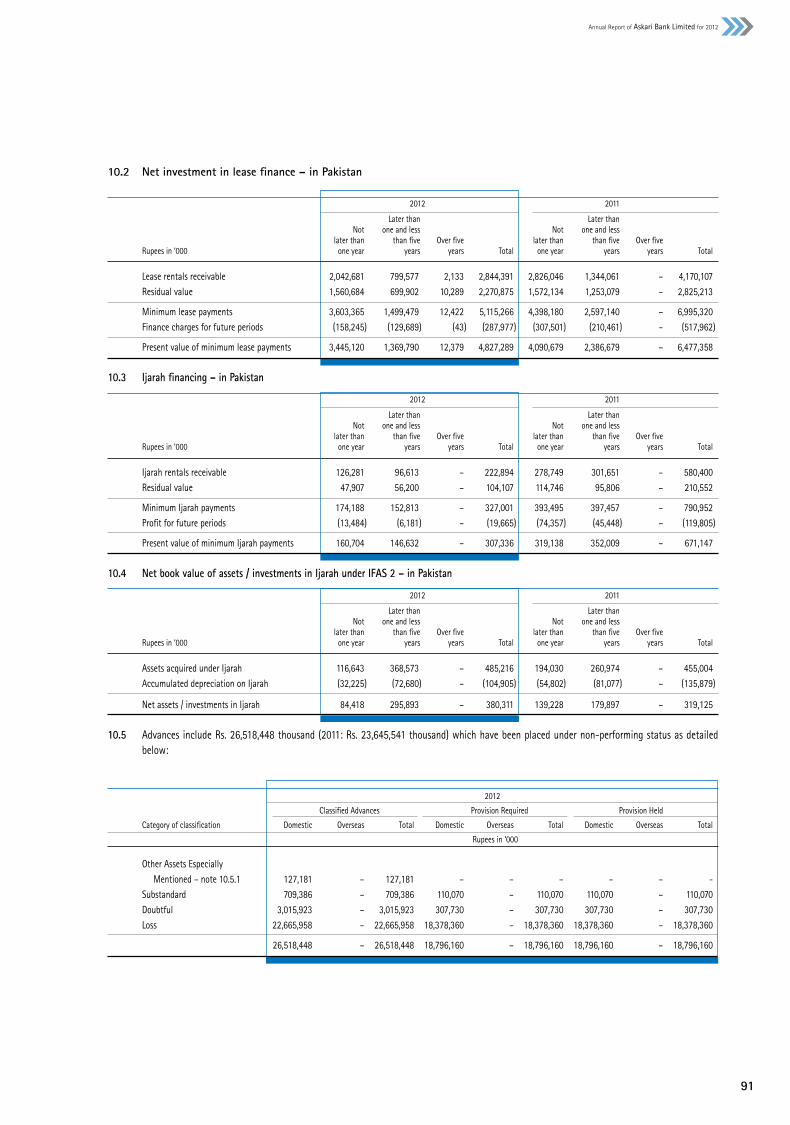
91
Annual Report of Askari Bank Limited for 2012
10.2 Net investment in lease finance – in Pakistan
2012 2011
Later than Later than Not one and less Not one and less later than than five Over five later than than five Over five Rupees in ‘000 one year years years Total one year years years Total
Lease rentals receivable 2,042,681 799,577 2,133 2,844,391 2,826,046 1,344,061 – 4,170,107 Residual value 1,560,684 699,902 10,289 2,270,875 1,572,134 1,253,079 – 2,825,213
Minimum lease payments 3,603,365 1,499,479 12,422 5,115,266 4,398,180 2,597,140 – 6,995,320 Finance charges for future periods (158,245) (129,689) (43) (287,977) (307,501) (210,461) – (517,962)
Present value of minimum lease payments 3,445,120 1,369,790 12,379 4,827,289 4,090,679 2,386,679 – 6,477,358
10.3 Ijarah financing – in Pakistan
2012 2011
Later than Later than Not one and less Not one and less later than than five Over five later than than five Over five Rupees in ‘000 one year years years Total one year years years Total
Ijarah rentals receivable 126,281 96,613 – 222,894 278,749 301,651 – 580,400 Residual value 47,907 56,200 – 104,107 114,746 95,806 – 210,552
Minimum Ijarah payments 174,188 152,813 – 327,001 393,495 397,457 – 790,952 Profit for future periods (13,484) (6,181) – (19,665) (74,357) (45,448) – (119,805)
Present value of minimum Ijarah payments 160,704 146,632 – 307,336 319,138 352,009 – 671,147
10.4 Net book value of assets / investments in Ijarah under IFAS 2 – in Pakistan
2012 2011
Later than Later than Not one and less Not one and less later than than five Over five later than than five Over five Rupees in ‘000 one year years years Total one year years years Total
Assets acquired under Ijarah 116,643 368,573 – 485,216 194,030 260,974 – 455,004 Accumulated depreciation on Ijarah (32,225) (72,680) – (104,905) (54,802) (81,077) – (135,879)
Net assets / investments in Ijarah 84,418 295,893 – 380,311 139,228 179,897 – 319,125
10.5 Advances include Rs. 26,518,448 thousand (2011: Rs. 23,645,541 thousand) which have been placed under non-performing status as detailed below:
2012
Classified Advances Provision Required Provision Held
Category of classification Domestic Overseas Total Domestic Overseas Total Domestic Overseas Total
Rupees in ‘000
Other Assets Especially Mentioned – note 10.5.1 127,181 – 127,181 – – – – – - Substandard 709,386 – 709,386 110,070 – 110,070 110,070 – 110,070 Doubtful 3,015,923 – 3,015,923 307,730 – 307,730 307,730 – 307,730 Loss 22,665,958 – 22,665,958 18,378,360 – 18,378,360 18,378,360 – 18,378,360
26,518,448 – 26,518,448 18,796,160 – 18,796,160 18,796,160 – 18,796,160

92
2011
Classified Advances Provision Required Provision Held
Category of classification Domestic Overseas Total Domestic Overseas Total Domestic Overseas Total
Rupees in ‘000
Other Assets Especially Mentioned – note 10.5.1 82,833 – 82,833 – – – – – – Substandard 822,789 – 822,789 70,785 – 70,785 70,785 – 70,785 Doubtful 1,754,185 – 1,754,185 353,690 – 353,690 353,690 – 353,690 Loss 20,985,734 – 20,985,734 15,867,039 – 15,867,039 15,867,039 – 15,867,039
23,645,541 – 23,645,541 16,291,514 – 16,291,514 16,291,514 – 16,291,514
10.5.1 This represents classification made for agricultural finances.
10.6 Particulars of provision against non–performing advances
2012 2011 Consumer Consumer financing financing Rupees in ‘000 Note Specific General –General Total Specific General –General Total
Opening balance 16,291,514 132,130 245,046 16,668,690 15,222,798 132,190 296,638 15,651,626 Transfer from investments 22,500 – – 22,500 – – – –
Charge for the year 3,532,354 9,575 332 3,542,261 3,877,730 13,963 - 3,891,693 Reversal for the year (1,050,208) (14,007) (41,488) (1,105,703) (2,164,986) (14,023) (51,592) (2,230,601) Net charge / (reversal) for the year 2,482,146 (4,432) (41,156) 2,436,558 1,712,744 (60) (51,592) 1,661,092 Reversal of provision on rescheduled / restructured classified advances 20.1 – – – – (71,692) – – (71,692) Amounts written off 10.8 – – – – (572,336) – – (572,336)
Closing balance 18,796,160 127,698 203,890 19,127,748 16,291,514 132,130 245,046 16,668,690
Rupees in ‘000 2012 2011
10.6.1 Provision against non–performing advances
Net charge for the year 2,436,558 1,661,092 Reversal of capital reserve (94,085) (30,969)
2,342,473 1,630,123
10.6.2 The SBP amended the Prudential Regulations vide BSD Circular No. 1 of 2011 dated October 21, 2011 in relation to provision
for loans and advances, thereby allowing benefit of Forced Sale Value (FSV) of pledged stocks, mortgaged residential, commercial and industrial properties (land and building only) and plant and machinery under charge held as collateral against non-performing advances. The FSV benefit availed in last years has been reduced by Rs. 596,999 thousand (net of FSV benefit availed during the year), which has resulted in increased charge for specific provision for the year ended by the same amount. The FSV benefit is not available for cash or stock dividend. Had the FSV benefit not recognized, before and after tax profit for the year ended would have been higher by Rs. 596,999 thousand (December 31, 2011: lower by Rs. 1,838,083 thousand) and Rs. 388,049 thousand (December 31, 2011: lower by Rs. 1,194,754 thousand) respectively.
10.6.3 The Bank has availed the relaxation of Rs. 262,880 thousand (2011: 249,030 thousand) allowed by the SBP for maintaining provisions as per time based criteria of Prudential Regulations.
10.6.4 The general provision is maintained at the rate of 0.1% on advances other than non-performing advances and consumer
financing.
Notes to the Unconsolidated Financial StatementsFor the year ended December 31, 2012
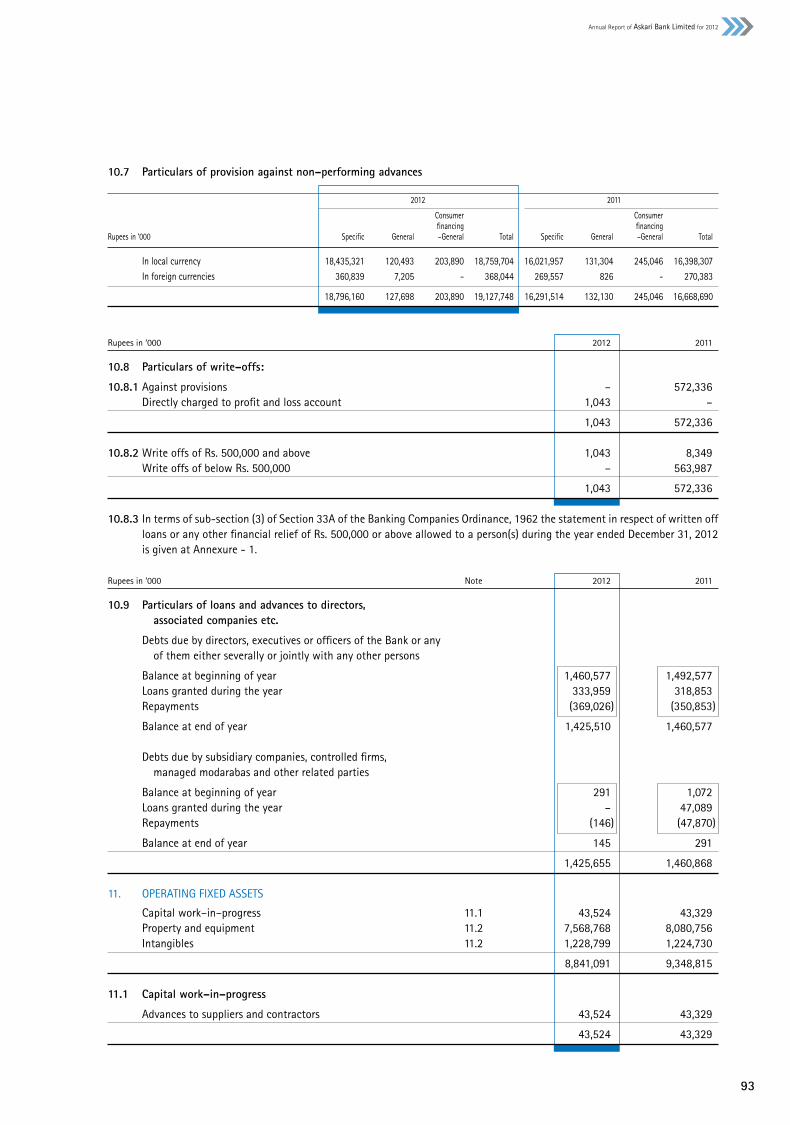
93
Annual Report of Askari Bank Limited for 2012
10.7 Particulars of provision against non–performing advances
2012 2011
Consumer Consumer financing financing Rupees in ‘000 Specific General –General Total Specific General –General Total
In local currency 18,435,321 120,493 203,890 18,759,704 16,021,957 131,304 245,046 16,398,307 In foreign currencies 360,839 7,205 - 368,044 269,557 826 - 270,383
18,796,160 127,698 203,890 19,127,748 16,291,514 132,130 245,046 16,668,690
Rupees in ‘000 2012 2011
10.8 Particulars of write–offs:
10.8.1 Against provisions – 572,336 Directly charged to profit and loss account 1,043 –
1,043 572,336 10.8.2 Write offs of Rs. 500,000 and above 1,043 8,349 Write offs of below Rs. 500,000 – 563,987
1,043 572,336 10.8.3 In terms of sub-section (3) of Section 33A of the Banking Companies Ordinance, 1962 the statement in respect of written off
loans or any other financial relief of Rs. 500,000 or above allowed to a person(s) during the year ended December 31, 2012 is given at Annexure - 1.
Rupees in ‘000 Note 2012 2011
10.9 Particulars of loans and advances to directors, associated companies etc.
Debts due by directors, executives or officers of the Bank or any of them either severally or jointly with any other persons
Balance at beginning of year 1,460,577 1,492,577 Loans granted during the year 333,959 318,853 Repayments (369,026) (350,853)
Balance at end of year 1,425,510 1,460,577 Debts due by subsidiary companies, controlled firms, managed modarabas and other related parties
Balance at beginning of year 291 1,072 Loans granted during the year – 47,089 Repayments (146) (47,870)
Balance at end of year 145 291
1,425,655 1,460,868 11. OPERATING FIXED ASSETS
Capital work–in–progress 11.1 43,524 43,329 Property and equipment 11.2 7,568,768 8,080,756 Intangibles 11.2 1,228,799 1,224,730
8,841,091 9,348,815 11.1 Capital work–in–progress
Advances to suppliers and contractors 43,524 43,329
43,524 43,329

94
Notes to the Unconsolidated Financial StatementsFor the year ended December 31, 2012
11.2 Property and equipment
2012 COST / REVALUED AMOUNT DEPRECIATION Book value Annual as at as at as at Charge as at as at rate of January 1, Deletions/ December 31, January 1, for the December 31, December 31, depreciation Rupees in ‘000 2012 Additions Adjustment transfers 2012 2012 year Adjustments Deletions 2012 2012 (%) Land -freehold - note 11.3 1,639,802 - - - 1,639,802 - - - - - 1,639,802 - Land -leasehold - note 11.3 2,151,818 - - - 2,151,818 - - - - - 2,151,818 - Buildings on freehold land 855,882 - - - 855,882 222,241 31,067 - - 253,308 602,574 5 Buildings on leasehold land 1,427,212 - - - 1,427,212 419,039 49,269 - - 468,308 958,904 5 Renovation of premises 1,828,178 70,870 (1,601) (169) 1,897,278 1,137,145 273,763 (11) (107) 1,410,790 486,488 20 Furniture, fixtures and office equipment 526,885 16,424 147 (6,109) 537,347 222,547 30,413 31 (2,467) 250,524 286,823 10 Carpets 23,180 3,527 - (2,272) 24,435 17,664 2,437 - (1,604) 18,497 5,938 20 Machine and equipments 1,321,306 63,118 50 (7,837) 1,376,637 779,061 113,464 (88) (5,820) 886,617 490,020 20 Computer equipments 2,080,728 82,212 342 (5,150) 2,158,132 1,022,895 202,659 295 (4,005) 1,221,844 936,288 20 Vehicles 223,584 43 (335) (11,163) 212,129 205,156 9,217 (356) (11,108) 202,909 9,220 20 Other assets 133,222 - (88,122) - 45,100 105,293 6,916 (68,002) - 44,207 893 20
12,211,797 236,194 (89,519) (32,700) 12,325,772 4,131,041 719,205 (68,131) (25,111) 4,757,004 7,568,768 Operating lease - Vehicles 18,209 - - (16,375) 1,834 18,209 - - (16,375) 1,834 - 20
12,230,006 236,194 (89,519) (49,075) 12,327,606 4,149,250 719,205 (68,131) (41,486) 4,758,838 7,568,768 Intangible Software 1,305,468 144,162 - - 1,449,630 80,738 140,093 - - 220,831 1,228,799 10
2011 COST / REVALUED AMOUNT DEPRECIATION Book value Annual as at as at as at Charge as at as at rate of January 1, December 31, January 1, for the December 31, December 31, depreciation Rupees in ‘000 2011 Additions Adjustment Deletions 2011 2011 year Adjustments Deletions 2011 2011 (%) Land -freehold - note 11.3 1,639,802 - - - 1,639,802 - - - - - 1,639,802 - Land -leasehold - note 11.3 2,105,372 46,446 - - 2,151,818 - - - - - 2,151,818 - Buildings on freehold land 793,893 826 61,163 - 855,882 188,824 32,655 762 - 222,241 633,641 5 Buildings on leasehold land 1,414,637 12,575 - - 1,427,212 367,447 51,592 - - 419,039 1,008,173 5 Renovation of premises 1,701,138 195,036 (64,650) (3,346) 1,828,178 871,515 269,417 (697) (3,090) 1,137,145 691,033 20 Furniture, fixtures and office equipment 516,294 16,322 271 (6,002) 526,885 192,219 32,368 278 (2,318) 222,547 304,338 10 Carpets 21,832 2,475 12 (1,139) 23,180 16,076 2,517 17 (946) 17,664 5,516 20 Machine and equipments 1,255,840 76,466 (366) (10,634) 1,321,306 662,190 124,996 277 (8,402) 779,061 542,245 20 Computer equipments 1,933,875 239,173 (79,307) (13,013) 2,080,728 845,385 191,864 (3,723) (10,631) 1,022,895 1,057,833 20 Vehicles 224,843 6,315 (40) (7,534) 223,584 191,755 17,930 59 (4,588) 205,156 18,428 20 Other assets 133,222 - - - 133,222 89,368 16,155 (230) - 105,293 27,929 20 11,740,748 595,634 (82,917) (41,668) 12,211,797 3,424,779 739,494 (3,257) (29,975) 4,131,041 8,080,756 Operating lease - Vehicles 18,209 - - - 18,209 16,531 1,678 - - 18,209 - 20 11,758,957 595,634 (82,917) (41,668) 12,230,006 3,441,310 741,172 (3,257) (29,975) 4,149,250 8,080,756 Intangible Software - 1,225,905 79,563 - 1,305,468 - 76,634 - 4,104 80,738 1,224,730 10

95
Annual Report of Askari Bank Limited for 2012
11.4 Detail of disposals of operating fixed assets
Particulars of Original Accumulated Book Sale Mode of Particulars of buyer assets cost depreciation value proceeds disposal
Rupees in ‘000
Vehicles Suzuki Vitara 1,607 1,581 26 563 As per Bank policy Mr. Abdul Waheed - Executive Honda Accord 2,514 2,514 - 880 - do - Mr. M. R. Mehkari - President and CEO Honda Civic 1,112 1,112 - 825 Tender Mr. Abdul Hameed Toyota Corolla 1,019 1,019 - 776 - do - Mr. Aziz Khan
Computer Equipments 1,665 1,293 372 25 Negotiation M/S Qadri Mustafi Engineering
7,917 7,519 398 3,069 Other assets having book value of less than Rs. 250,000/- or cost of less than Rs. 1,000,000/- other than vehicles sold to Bank’s executives / related party 41,158 33,967 7,191 10,264 2012 49,075 41,486 7,589 13,333
2011 41,668 29,975 11,693 11,713
11.2.1 Cost of fully depreciated property and equipment still in use amounts to Rs. 884,184 thousand (2011: Rs. 701,891 thousand).
11.3 The Bank’s freehold and leasehold land was revalued by the valuers approved by the Pakistan Banks Association on December 31, 2008 on the basis of their professional assessment of present market value. The amount of revaluation surplus on land is Rs. 1,697,325 thousand. The information relating to location of revalued land is as follows:
Revalued Amount City Rupees in ‘000 Name of Valuers
Karachi 472,659 Merchant and Associate, Sardar Enterprises, Tristar
International
Lahore 980,226 Merchant and Associate, Arch & Decor Islamabad 69,205 Empire Enterprises Rawalpindi 1,803,835 Merchant and Associate, Industrial Consultants, Samsco Quetta 187,720 Sadruddin Associates
3,513,645
Had the land not been revalued, the carrying amount of land as at December 31, 2012 would have been Rs. 2,094,295 thousand.

96
Rupees in ‘000 Note 2012 2011
12. OTHER ASSETS
Income / mark-up accrued in local currency 12.1 6,130,141 7,145,152 Income / mark-up accrued in foreign currencies 193,127 165,990 Advances, deposits, advance rent and other prepayments 797,301 1,454,544 Advance taxation (payments less provisions) 3,674,110 2,960,034 Non banking assets acquired in satisfaction of claims 12.2 4,289,885 3,485,578 Un-realised gain on forward foreign exchange contracts - net 80,587 327,317 Suspense account 71,625 50,691 Stationary and stamps in hand 35,377 46,447 Dividend receivable 53,752 8,834 Others 257,579 398,325
15,583,484 16,042,912 Less: Provision against other assets 12.3 (92,498) (97,662)
Other assets - net of provision 15,490,986 15,945,250 12.1 This balance has been arrived at after adjusting interest in suspense of Rs. 9,519,286 thousand (2011: Rs. 7,671,302
thousand).
12.2 Market value of non banking assets acquired in satisfaction of claims is Rs. 6,461,300 thousand (2011: Rs. 5,499,775 thousand). Further, additions include certain properties, acquired by the Bank through registered sale deeds, in its name, involving value of Rs. 532,337 thousand wherefor mutation formalities are in progress.
Rupees in ‘000 2012 2011
12.3 Provision against other assets
Opening balance 97,662 98,121
Provision recognised during the year 21,633 - Recovery from customer (13,000) -
8,633 - Written off during the year (13,797) (459)
Closing balance 92,498 97,662 13. BILLS PAYABLE
In Pakistan 3,700,156 2,756,032 14. BORROWINGS
In Pakistan 8,360,019 17,212,842 Outside Pakistan 12,598 60,628
8,372,617 17,273,470 14.1 Particulars of borrowings with respect to currencies
In local currency 8,360,019 17,212,842 In foreign currencies 12,598 60,628
8,372,617 17,273,470
Notes to the Unconsolidated Financial StatementsFor the year ended December 31, 2012

97
Annual Report of Askari Bank Limited for 2012
Rupees in ‘000 Note 2012 2011
14.2 Details of borrowings – secured / unsecured
In Pakistan - local currency Secured Borrowings from the State Bank of Pakistan: Export refinance scheme 14.2.1 7,170,013 8,317,225 Long term financing of export oriented projects 14.2.2 400,104 669,568 Long term financing facility 14.2.3 195,076 251,673 Refinance scheme for revival of agricultural activities in flood affected areas 14.2.4 2,745 31,045 Refinance scheme for revival of SME activities in flood affected areas 14.2.4 7,500 7,500
7,775,438 9,277,011 Repo borrowings from financial institutions - 7,935,831 Unsecured Call borrowings 14.2.5 500,000 - Overdrawn balance with other banks 84,581 -
584,581 -
8,360,019 17,212,842
Outside Pakistan - foreign currencies Overdrawn nostro accounts - unsecured 12,598 60,628
8,372,617 17,273,470
14.2.1 This facility is secured against demand promissory note executed in favour of the SBP. The effective mark-up rate is 8.5% (2011: 10%) per annum payable on a quarterly basis.
14.2.2 These carry mark-up rate of 5% (2011: 5%) per annum payable on a quarterly basis.
14.2.3 These carry mark-up ranging from 5.5% to 10.1% (2011: 6.5% to 8.6%) per annum payable on a quarterly basis.
14.2.4 These carry mark-up rate of 5% (2011: 5%) per annum payable on a quarterly basis.
14.2.5 These represent borrowings at mark-up rate of 8.75% (2011: Nil) per annum and have maturity upto seven days. Rupees in ‘000 2012 2011
15. DEPOSITS AND OTHER ACCOUNTS
Customers Fixed deposits 75,647,191 89,523,862 Savings deposits 155,646,270 141,028,007 Current accounts - non-remunerative 62,694,946 56,633,911 Special exporters’ account 22,282 11,509 Margin accounts 2,316,551 2,416,273 Others 406,476 380,598 Financial institutions Remunerative deposits 9,381,065 1,507,056 Non-remunerative deposits 822,435 1,777
306,937,216 291,502,993 15.1 Particulars of deposits
In local currency 274,501,211 256,920,834 In foreign currencies 32,436,005 34,582,159
306,937,216 291,502,993 Deposits include Rs. 18,631,133 thousand (2011: Rs. 19,758,975 thousand) due to related parties.
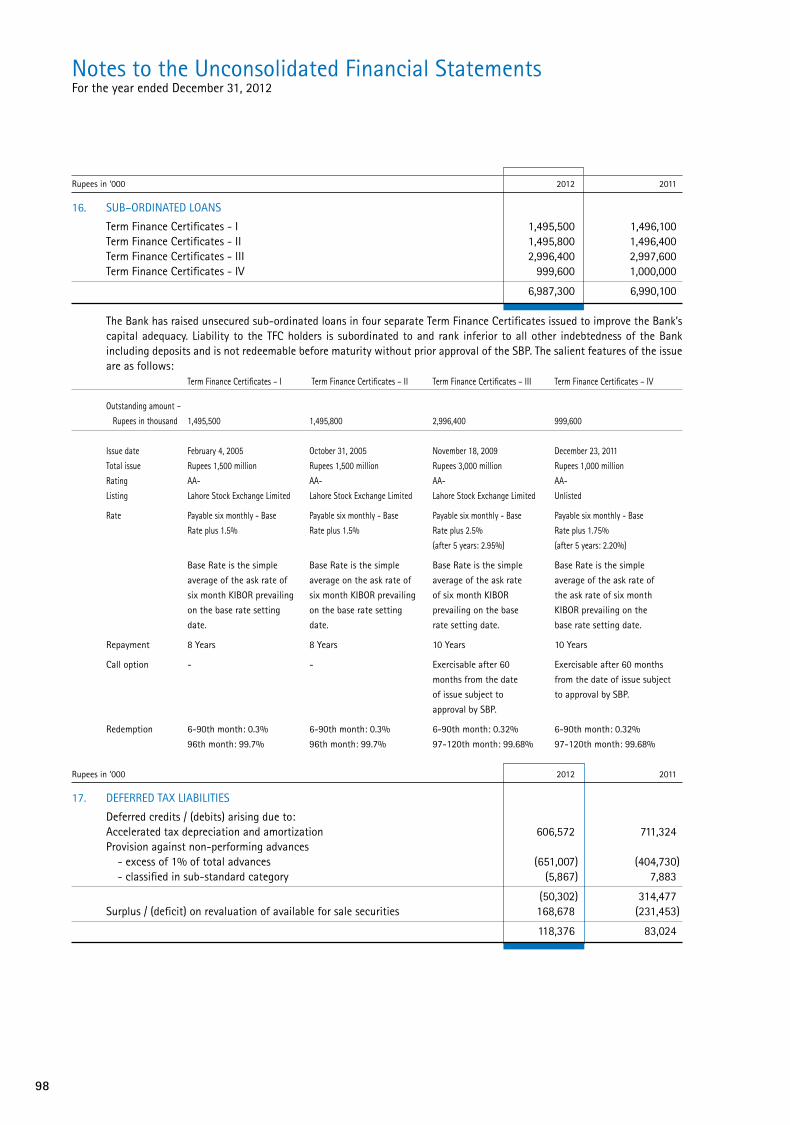
98
Rupees in ‘000 2012 2011
16. SUB–ORDINATED LOANS
Term Finance Certificates - I 1,495,500 1,496,100 Term Finance Certificates - II 1,495,800 1,496,400 Term Finance Certificates - III 2,996,400 2,997,600 Term Finance Certificates - IV 999,600 1,000,000
6,987,300 6,990,100
The Bank has raised unsecured sub-ordinated loans in four separate Term Finance Certificates issued to improve the Bank’s capital adequacy. Liability to the TFC holders is subordinated to and rank inferior to all other indebtedness of the Bank including deposits and is not redeemable before maturity without prior approval of the SBP. The salient features of the issue are as follows:
Term Finance Certificates – I Term Finance Certificates – II Term Finance Certificates – III Term Finance Certificates – IV
Outstanding amount –
Rupees in thousand 1,495,500 1,495,800 2,996,400 999,600
Issue date February 4, 2005 October 31, 2005 November 18, 2009 December 23, 2011
Total issue Rupees 1,500 million Rupees 1,500 million Rupees 3,000 million Rupees 1,000 million
Rating AA- AA- AA- AA-
Listing Lahore Stock Exchange Limited Lahore Stock Exchange Limited Lahore Stock Exchange Limited Unlisted
Rate Payable six monthly - Base Payable six monthly - Base Payable six monthly - Base Payable six monthly - Base
Rate plus 1.5% Rate plus 1.5% Rate plus 2.5% Rate plus 1.75%
(after 5 years: 2.95%) (after 5 years: 2.20%)
Base Rate is the simple Base Rate is the simple Base Rate is the simple Base Rate is the simple
average of the ask rate of average on the ask rate of average of the ask rate average of the ask rate of
six month KIBOR prevailing six month KIBOR prevailing of six month KIBOR the ask rate of six month
on the base rate setting on the base rate setting prevailing on the base KIBOR prevailing on the
date. date. rate setting date. base rate setting date.
Repayment 8 Years 8 Years 10 Years 10 Years
Call option - - Exercisable after 60 Exercisable after 60 months
months from the date from the date of issue subject
of issue subject to to approval by SBP.
approval by SBP.
Redemption 6-90th month: 0.3% 6-90th month: 0.3% 6-90th month: 0.32% 6-90th month: 0.32%
96th month: 99.7% 96th month: 99.7% 97-120th month: 99.68% 97-120th month: 99.68%
Rupees in ‘000 2012 2011
17. DEFERRED TAX LIABILITIES
Deferred credits / (debits) arising due to: Accelerated tax depreciation and amortization 606,572 711,324 Provision against non-performing advances - excess of 1% of total advances (651,007) (404,730) - classified in sub-standard category (5,867) 7,883
(50,302) 314,477 Surplus / (deficit) on revaluation of available for sale securities 168,678 (231,453)
118,376 83,024
Notes to the Unconsolidated Financial StatementsFor the year ended December 31, 2012

99
Annual Report of Askari Bank Limited for 2012
Rupees in ‘000 2012 2011
18. OTHER LIABILITIES Mark-up / return / interest payable in local currency 1,837,337 2,059,529 Mark-up / return / interest payable in foreign currencies 17,051 76,145 Unearned income / commission 168,876 188,368 Accrued expenses 696,837 338,596 Advance payments 59,315 52,068 Security deposit against lease / Ijarah financing 2,378,387 3,044,275 Unclaimed dividends 38,371 39,157 Branch adjustment account 858,692 622,392 Payable to defined contribution plan - 22,376 Payable against purchase of listed shares 140,574 162,103 Withholding taxes payable 39,367 43,795 Federal excise duty payable 3 2,503 Workers’ Welfare Fund 185,115 108,000 Others 832,031 615,114
7,251,956 7,374,421 19. SHARE CAPITAL
19.1 Authorized capital
2012 2011 Rupees in ‘000
Number of shares
1,300,000,000 1,300,000,000 Ordinary shares of Rs. 10 each 13,000,000 13,000,000
19.2 Issued, subscribed and paid up capital
2012 2011
Number of shares Ordinary shares of Rs. 10 each:
67,500,000 67,500,000 Fully paid in cash 675,000 675,000 717,297,769 611,245,019 Issued as bonus shares 7,172,978 6,112,451 28,273,315 28,273,315 Issued on ALL merger 282,733 282,733
813,071,084 707,018,334 8,130,711 7,070,184
19.3 Capital Risk Management
The Bank’s objectives when managing capital are to safeguard the Bank’s ability to continue as a going concern in order to provide returns for shareholders and benefits for other stakeholders and to maintain an optimal capital structure to reduce the cost of capital. In order to maintain or adjust the capital structure, the Bank may adjust the amount of dividend paid to shareholders, return capital to shareholders, issue new shares or sell assets to reduce debt.
In terms of BSD circular No. 7 of 2009 issued by the SBP, the Bank is required to enhance its existing paid up capital to Rs. 10 billion (net of losses) to be achieved in phased manner as follows:
Minimum paid up capital (net of losses)
By December 31, 2009 Rs. 6 billion By December 31, 2010 Rs. 7 billion By December 31, 2011 Rs. 8 billion By December 31, 2012 Rs. 9 billion By December 31, 2013 Rs. 10 billion
The Bank’s status of compliance with regard to above is stated in note 1.3.

100
Exchange Statutory Capital
translation Share premium reserve reserve General
Rupees in ‘000 reserve account note – 20.3 note - 20.1 reserve 2012 2011
20. RESERVES
Balance as at January 01 75,296 234,669 3,648,445 94,085 4,083,945 8,136,440 7,691,319 Effect of translation of net investment in Wholesale Bank Branch 7,363 - - - - 7,363 19,783 Transfer from un-appropriated profit - - 251,072 - 1,302,158 1,553,230 1,027,359 Bonus shares issued - - - - (1,060,527) (1,060,527) (642,744) Reversal of capital reserve - - - (94,085) - (94,085) (30,969) Effect of rescheduled / restructured classified advances - - - - - - 71,692
Balance as at December 31 82,659 234,669 3,899,517 - 4,325,576 8,542,421 8,136,440
20.1 This represents reserve created in compliance with BSD Circular No. 10 dated October 20, 2009 issued by the SBP to account for the effect of provision reversed on restructuring / rescheduling of classified advances overdue for less than one year. This reserve was not available for payment of cash or stock dividend. The reserve has been reversed on fulfilling the requirements of BSD Circular No. 10 dated October 20, 2009.
20.2 As at December 31, 2012, the Bank has availed net of tax benefit of Forced Sale Value (FSV) of Rs. 3,094,844 thousand (December 31, 2011: Rs. 3,477,969 thousand) in respect of pledged stocks, mortgaged residential, commercial, industrial properties (land and building only) and plant and machinery under charge held as collateral against non-performing assets allowed under BSD circular No. 1 of 2011 dated October 21, 2011 and referred in notes 9.17.1 and 10.6.2 above. Reserves and un-appropriated profit to that extent are not available for distribution by way of cash or stock dividend.
20.3 Under section 21 of the Banking Companies Ordinance, 1962, every Banking company incorporated in Pakistan is required to transfer not less than 20% of balance of profit to a statutory reserve until the amount in statutory reserve together with amount in share premium account equals to or exceed the paid-up capital of the Bank and thereafter 10% of the balance of profit of the holding company are to be transferred to this reserve.
Rupees in ‘000 2012 2011
21. SURPLUS ON REVALUATION OF ASSETS – NET OF TAX
Surplus on revaluation of land 1,697,325 1,697,325 Surplus / (deficit) on revaluation of available for sale securities i) Federal Government securities 781,542 (196,668) ii) Listed shares (34,407) (232,399) iii) Units of open end mutual funds 8,032 30,589 iv) Other securities (273,230) (262,816)
481,937 (661,294)
Less: related deferred tax (168,678) 231,453
313,259 (429,841)
2,010,584 1,267,484 22. CONTINGENCIES AND COMMITMENTS
22.1 Direct credit substitutes Government - 2,329,106 Others 5,373,983 7,047,996
5,373,983 9,377,102
Notes to the Unconsolidated Financial StatementsFor the year ended December 31, 2012

101
Annual Report of Askari Bank Limited for 2012
Rupees in ‘000 2012 2011
22.2 Transaction–related contingent liabilities
Money for which the Bank is contingently liable:
a) Contingent liability in respect of guarantees given on behalf of directors or officers or any of them (severally or jointly) with any other person, subsidiaries and associated undertakings. 233,955 270,352
b) Contingent liability in respect of guarantees given, favouring:
i) Government 79,212,961 54,928,965 ii) Banks and other financial institutions 808,020 744,007 iii) Others 13,813,083 15,582,567
93,834,064 71,255,539
94,068,019 71,525,891
These include guarantees amounting to Rs. 901,381 thousand (2011: Rs. 890,769 thousand) issued in the normal course of business which are in litigations, wherein the Bank has been merely impleaded and is not a party to the dispute.
Rupees in ‘000 2012 2011
22.3 Trade–related contingent liabilities 44,442,449 36,629,023
22.4 Other contingencies
22.4.1 These represent certain claims by third parties against the Bank, which are being contested in the Courts of law. The management is of the view that these relate to the normal course of business and are not likely to result in any liability against the Bank. 615,701 649,430
22.4.2 The Bank is contesting a case filed against it and some of its employees in the Sindh High Court for declaration and damages. Based on outside legal advice, the case of declaration is likely to be decided in Bank’s favor. However, in case of award of damages, the potential liability of the Bank is estimated at not more than Rs. 100 million.
22.4.3 The Competition Commission of Pakistan (CCP) in an order dated June 28, 2012 has penalized 1 Link (Guarantee) Limited and its member banks for allegedly following uncompetitive behaviour and imposition of uniform cost on cash withdrawals from ATMs; Askari Bank’s share of such penalty is Rs. 50 million. The Bank along with other banks has filed a constitutional petition before the honorable Sindh High Court, which has suspended the order of CCP till next hearing date.
22.5 Tax contingencies
For the Tax Years 2005 to 2008, there is a contingent liability of Rs. 681 million on account of amendment to assessments carried out by the Tax Department in the matters of taxation of commission & brokerage income at corporate tax rate instead of final tax regime and allocating financial expenses to exempt income and income taxable at a lower rate. Such issues have however been decided in the Bank’s favour by the Commissioner Inland Revenue (Appeals) [CIR(A)] for the Tax Year 2008 except for the matter of allocation of financial expenses. The Bank’s appeals are pending decision by the Appellate Tribunal Inland Revenue [ATIR] with respect to matters not decided in its favour.
Rupees in ‘000 2012 2011
22.6 Commitments in respect of forward lending
Commitments against “REPO” transactions Purchase and resale agreements 5,823,130 362,147 Sale and repurchase agreements - 7,953,517 22.7 Commitments in respect of forward exchange contracts
Purchase 13,497,314 23,775,757 Sale 8,926,334 14,977,195
The above commitments have maturities falling within one year.
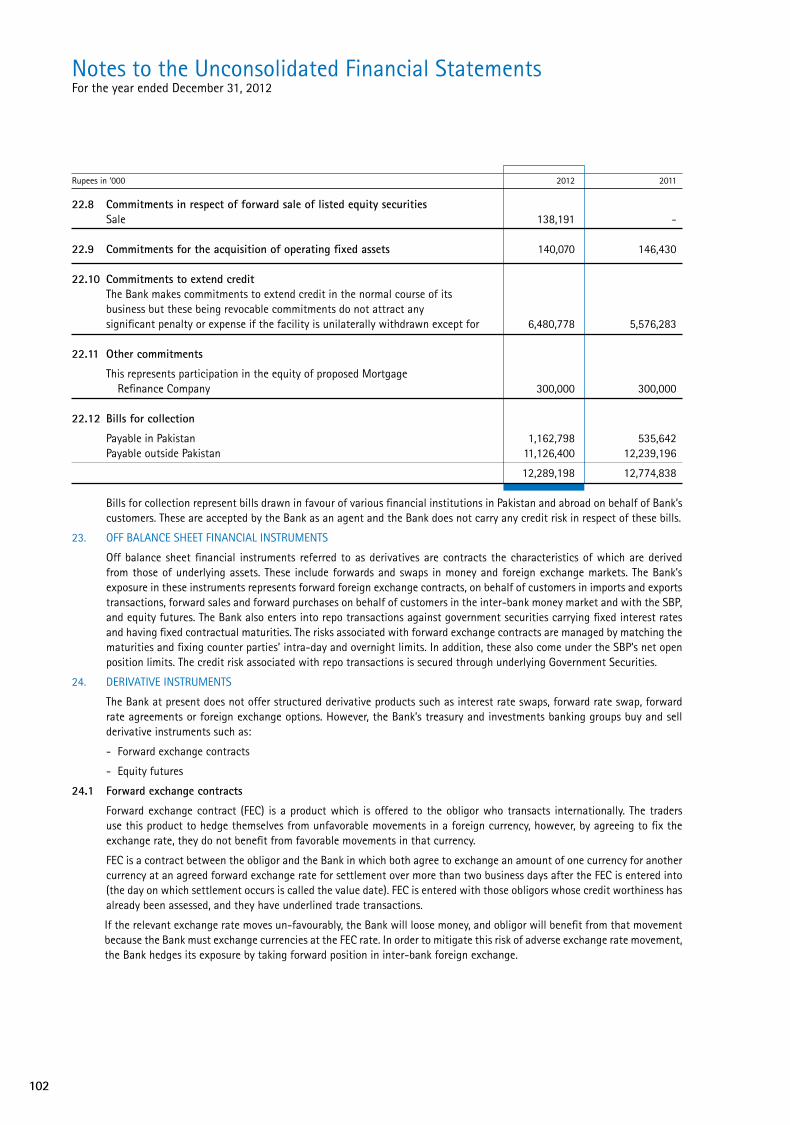
102
Rupees in ‘000 2012 2011
22.8 Commitments in respect of forward sale of listed equity securities Sale 138,191 -
22.9 Commitments for the acquisition of operating fixed assets 140,070 146,430
22.10 Commitments to extend credit The Bank makes commitments to extend credit in the normal course of its business but these being revocable commitments do not attract any significant penalty or expense if the facility is unilaterally withdrawn except for 6,480,778 5,576,283 22.11 Other commitments
This represents participation in the equity of proposed Mortgage Refinance Company 300,000 300,000 22.12 Bills for collection
Payable in Pakistan 1,162,798 535,642 Payable outside Pakistan 11,126,400 12,239,196
12,289,198 12,774,838 Bills for collection represent bills drawn in favour of various financial institutions in Pakistan and abroad on behalf of Bank’s
customers. These are accepted by the Bank as an agent and the Bank does not carry any credit risk in respect of these bills.
23. OFF BALANCE SHEET FINANCIAL INSTRUMENTS
Off balance sheet financial instruments referred to as derivatives are contracts the characteristics of which are derived from those of underlying assets. These include forwards and swaps in money and foreign exchange markets. The Bank’s exposure in these instruments represents forward foreign exchange contracts, on behalf of customers in imports and exports transactions, forward sales and forward purchases on behalf of customers in the inter-bank money market and with the SBP, and equity futures. The Bank also enters into repo transactions against government securities carrying fixed interest rates and having fixed contractual maturities. The risks associated with forward exchange contracts are managed by matching the maturities and fixing counter parties’ intra-day and overnight limits. In addition, these also come under the SBP’s net open position limits. The credit risk associated with repo transactions is secured through underlying Government Securities.
24. DERIVATIVE INSTRUMENTS
The Bank at present does not offer structured derivative products such as interest rate swaps, forward rate swap, forward rate agreements or foreign exchange options. However, the Bank’s treasury and investments banking groups buy and sell derivative instruments such as:
- Forward exchange contracts
- Equity futures
24.1 Forward exchange contracts
Forward exchange contract (FEC) is a product which is offered to the obligor who transacts internationally. The traders use this product to hedge themselves from unfavorable movements in a foreign currency, however, by agreeing to fix the exchange rate, they do not benefit from favorable movements in that currency.
FEC is a contract between the obligor and the Bank in which both agree to exchange an amount of one currency for another currency at an agreed forward exchange rate for settlement over more than two business days after the FEC is entered into (the day on which settlement occurs is called the value date). FEC is entered with those obligors whose credit worthiness has already been assessed, and they have underlined trade transactions.
If the relevant exchange rate moves un-favourably, the Bank will loose money, and obligor will benefit from that movement because the Bank must exchange currencies at the FEC rate. In order to mitigate this risk of adverse exchange rate movement, the Bank hedges its exposure by taking forward position in inter-bank foreign exchange.
Notes to the Unconsolidated Financial StatementsFor the year ended December 31, 2012

103
Annual Report of Askari Bank Limited for 2012
24.2 Equity futures
An equity futures contract is a standardized contract, traded on a futures counter of the stock exchange, to buy or sell a certain underlying scrip at a certain date in the future, at a specified price.
The Bank uses equity futures as a hedging instrument to hedge its equity portfolio against equity price risk. Only selected shares are allowed to be traded on futures exchange. Equity futures give flexibility to the Bank either to take delivery on the future settlement date or to settle it by adjusting the notional value of the contract based on the current market rates. Maximum exposure limit to the equity futures is 10% of tier I capital of the Bank, based on prevailing SBP regulations.
The accounting policies used to recognize and disclose derivatives are given in note 5.15.
Rupees in ‘000 Note 2012 2011
25. MARK–UP / RETURN / INTEREST EARNED
On loans and advances to: i) Customers 25.1 17,420,940 17,704,368 ii) Financial institutions 45,910 86,448 On investments i) Available for sale securities 14,156,786 13,876,815 ii) Held to maturity securities 447,735 543,789 iii) Held for trading – 2,916 On deposits with financial institutions 153,189 188,957 On securities purchased under resale agreements 177,627 363,058
32,402,187 32,766,351 25.1 This includes an amount of Rs. 7,080 thousand (2011: Rs. 29,972 thousand) on account of income received from related
parties. Rupees in ‘000 Note 2012 2011
26. MARK–UP / RETURN / INTEREST EXPENSED
On deposits 26.1 19,110,271 18,816,220 On securities sold under repurchase agreements 2,228,432 2,010,892 On sub–ordinated loans 962,708 921,388 On call money borrowings 19,630 52,632 On refinance borrowings from SBP 597,847 834,023 On long term finance for export oriented projects from SBP 48,506 55,509 On other short term borrowings 6,387 8,919
22,973,781 22,699,583 26.1 This includes an amount of Rs. 2,328,062 thousand (2011: Rs. 1,324,696 thousand) on account of mark-up / interest on
deposits of related parties. Rupees in ‘000 2012 2011
27. GAIN ON SALE OF SECURITIES – NET
Federal Government Securities Market Treasury Bills 98,930 113,283 Pakistan Investment Bonds 473,013 26,825 Term Finance Certificates - 17,308 Shares – listed 203,835 (52,271) Others (94,093) 202,067
681,685 307,212

104
Rupees in ‘000 Note 2012 2011
28. OTHER INCOME
Rent on property 28.1 31,079 38,017 Gain on sale of operating fixed assets 5,744 20 Rent of lockers 16,211 17,450 Gain on sale of non-banking asset 6,723 – Recovery of expenses from customers 301,203 284,271
360,960 339,758
28.1 This includes an amount of Rs. 29,574 thousand (2011: Rs. 24,941 thousand) on account of rent received from related parties. Rupees in ‘000 Note 2012 2011
29. ADMINISTRATIVE EXPENSES
Salaries, allowances, etc. 4,086,652 3,788,951 Charge for defined benefit plan 35.3 183,704 165,706 Contribution to defined contribution plan 36 144,542 129,699 Directors’ fees, allowances and other expenses 4,700 2,350 Rent, taxes, insurance, electricity, etc. 1,129,293 1,047,204 Legal and professional charges 69,212 51,647 Brokerage and commission 105,931 144,992 Communications 313,187 315,054 Repairs and maintenance 885,062 1,016,418 Stationery and printing 108,399 125,618 Advertisement and publicity 79,643 116,232 Donations - 16,000 Auditors’ remuneration 29.1 10,809 13,448 Depreciation 11.2 719,205 741,172 Amortization 11.2 140,093 76,634 Travelling and entertainment 104,148 79,614 Fuel and vehicle running expenses 543,333 462,842 Security service charges 270,802 263,847 Other expenditure 140,540 81,884
9,039,255 8,639,312 29.1 Auditors’ remuneration
Audit fee 2,800 2,500 Fee for the audit of Wholesale Bank Branch 2,214 2,096 Fee for the audit of provident and gratuity funds 167 121 Special certifications, half year review and the audit of consolidated financial statements 2,988 2,888 Tax services 1,815 5,112 Out–of–pocket expenses 825 731
10,809 13,448 30. OTHER CHARGES
Workers’ Welfare Fund 77,115 49,240 Penalties imposed by the State Bank of Pakistan 3,182 37,544
80,297 86,784
Notes to the Unconsolidated Financial StatementsFor the year ended December 31, 2012

105
Annual Report of Askari Bank Limited for 2012
Rupees in ‘000 Note 2012 2011
31. TAXATION
For the year Current 839,144 832,723 Deferred (364,779) (47,670)
474,365 785,053 31.1 Relationship between tax expense and accounting profit
Profit before taxation 1,729,727 2,412,751
Tax at applicable tax rate of 35 percent (2010: 35 percent) 605,404 844,463 Effect of: – Income chargeable to tax at lower rates (132,066) (72,367) – Permanent differences 1,114 12,872 – Others (87) 85
474,365 785,053
31.2 Tax status
i) The Bank has filed tax returns for and up to Tax Year 2012 (year ended 31 December 2011). The assessment for and up to Tax Year 2010 were amended by the Tax authorities mainly in the matters of admissibility of provisions against doubtful debts, diminution in the value of investments, bad debts written off, apportionment of expenses to income exempt from tax or taxable at a lower rate and basis of taxation of commission and brokerage income. The matter of provision against doubtful debts has been decided in favour of the Bank for and up to Tax Year 2006 up to the level of ATIR whereas partial relief has been provided by the CIR (A) on other matters. The Bank and the Tax Department have filed appeals and reference applications to the higher forums in relation to matters not decided in their favour.
Tax payments made in relation to the matters currently pending are being carried forward as management is confident of their realisation as and when the appeals are decided.
ii) Consequent upon the amalgamation with and into the Bank, the outstanding tax issues relating to erstwhile Askari Leasing Limited (ALL) are as follows:
Tax returns of ALL have been filed for and up to Tax Year 2010. The returns of ALL for the Tax Years 2003 to 2010 were amended by the tax authorities mainly in the matter of admissibility of initial allowance claimed on leased vehicles. On appeals filed by ALL, partial relief was provided by the CIR(A) by allowing initial allowance on commercial vehicles. Re-assessment has not yet been carried out by the Tax Department. A tax demand is however not likely to arise after re-assessment.
For and up to the Assessment Years 2002-2003, reference applications filed by the Tax Authorities in the matter of computation of lease income are pending decisions by the High Court. However the likelihood of an adverse decision is considered low due to a favorable decision of the High Court in a parallel case.
For and up to Assessment Year 2002-2003 and Tax Years 2003, 2004 and 2007 the Tax Department has filed appeals with the ATIR against the decision of CIR (A) that minimum tax was not chargeable on lease rentals / income. These are pending decision.
Rupees in ‘000 2012 2011
32. BASIC / DILUTED EARNINGS PER SHARE
Profit for the year – Rupees in ‘000 1,255,362 1,627,698
Weighted average number of Ordinary Shares – numbers 813,071,084 813,071,084
Basic / diluted earnings per share – Rupees 1.54 2.00 There is no dilutive effect on the basic earnings per share of the Bank.
Weighted average number of ordinary shares for 2011 has been restated to give effect of bonus shares issued during the year.
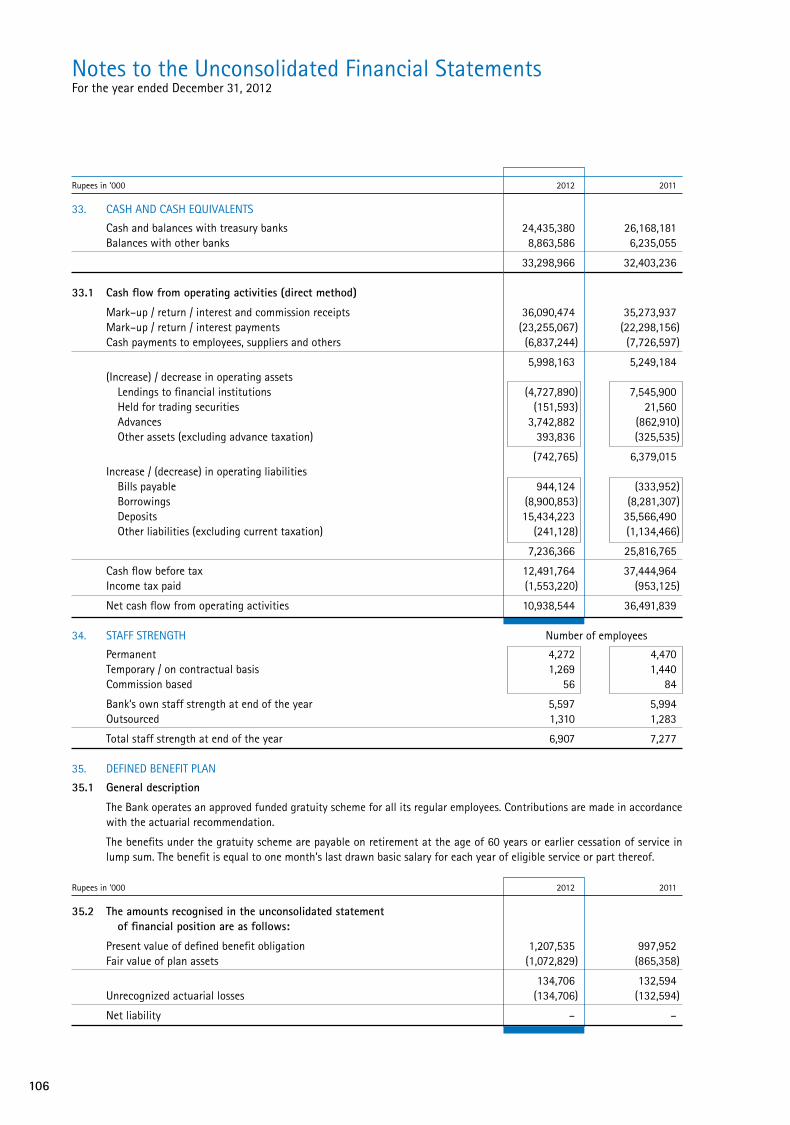
106
Rupees in ‘000 2012 2011
33. CASH AND CASH EQUIVALENTS
Cash and balances with treasury banks 24,435,380 26,168,181 Balances with other banks 8,863,586 6,235,055
33,298,966 32,403,236
33.1 Cash flow from operating activities (direct method)
Mark–up / return / interest and commission receipts 36,090,474 35,273,937 Mark–up / return / interest payments (23,255,067) (22,298,156) Cash payments to employees, suppliers and others (6,837,244) (7,726,597)
5,998,163 5,249,184 (Increase) / decrease in operating assets Lendings to financial institutions (4,727,890) 7,545,900 Held for trading securities (151,593) 21,560 Advances 3,742,882 (862,910) Other assets (excluding advance taxation) 393,836 (325,535)
(742,765) 6,379,015 Increase / (decrease) in operating liabilities Bills payable 944,124 (333,952) Borrowings (8,900,853) (8,281,307) Deposits 15,434,223 35,566,490 Other liabilities (excluding current taxation) (241,128) (1,134,466)
7,236,366 25,816,765
Cash flow before tax 12,491,764 37,444,964 Income tax paid (1,553,220) (953,125)
Net cash flow from operating activities 10,938,544 36,491,839 34. STAFF STRENGTH Number of employees
Permanent 4,272 4,470 Temporary / on contractual basis 1,269 1,440 Commission based 56 84
Bank’s own staff strength at end of the year 5,597 5,994 Outsourced 1,310 1,283
Total staff strength at end of the year 6,907 7,277
35. DEFINED BENEFIT PLAN
35.1 General description
The Bank operates an approved funded gratuity scheme for all its regular employees. Contributions are made in accordance with the actuarial recommendation.
The benefits under the gratuity scheme are payable on retirement at the age of 60 years or earlier cessation of service in lump sum. The benefit is equal to one month’s last drawn basic salary for each year of eligible service or part thereof.
Rupees in ‘000 2012 2011
35.2 The amounts recognised in the unconsolidated statement of financial position are as follows:
Present value of defined benefit obligation 1,207,535 997,952 Fair value of plan assets (1,072,829) (865,358)
134,706 132,594 Unrecognized actuarial losses (134,706) (132,594)
Net liability – –
Notes to the Unconsolidated Financial StatementsFor the year ended December 31, 2012
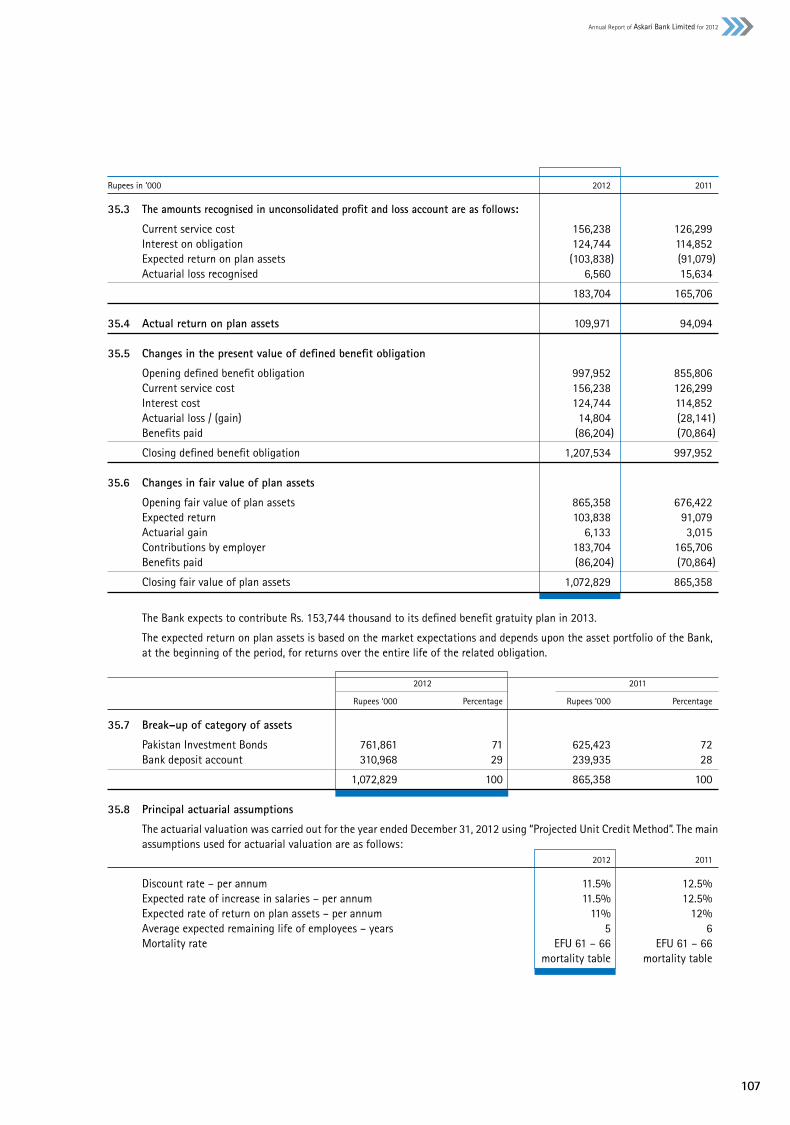
107
Annual Report of Askari Bank Limited for 2012
Rupees in ‘000 2012 2011
35.3 The amounts recognised in unconsolidated profit and loss account are as follows:
Current service cost 156,238 126,299 Interest on obligation 124,744 114,852 Expected return on plan assets (103,838) (91,079) Actuarial loss recognised 6,560 15,634
183,704 165,706 35.4 Actual return on plan assets 109,971 94,094 35.5 Changes in the present value of defined benefit obligation
Opening defined benefit obligation 997,952 855,806 Current service cost 156,238 126,299 Interest cost 124,744 114,852 Actuarial loss / (gain) 14,804 (28,141) Benefits paid (86,204) (70,864)
Closing defined benefit obligation 1,207,534 997,952
35.6 Changes in fair value of plan assets
Opening fair value of plan assets 865,358 676,422 Expected return 103,838 91,079 Actuarial gain 6,133 3,015 Contributions by employer 183,704 165,706 Benefits paid (86,204) (70,864)
Closing fair value of plan assets 1,072,829 865,358
The Bank expects to contribute Rs. 153,744 thousand to its defined benefit gratuity plan in 2013.
The expected return on plan assets is based on the market expectations and depends upon the asset portfolio of the Bank, at the beginning of the period, for returns over the entire life of the related obligation.
2012 2011
Rupees ‘000 Percentage Rupees ‘000 Percentage
35.7 Break–up of category of assets
Pakistan Investment Bonds 761,861 71 625,423 72 Bank deposit account 310,968 29 239,935 28
1,072,829 100 865,358 100 35.8 Principal actuarial assumptions
The actuarial valuation was carried out for the year ended December 31, 2012 using “Projected Unit Credit Method”. The main assumptions used for actuarial valuation are as follows:
2012 2011
Discount rate – per annum 11.5% 12.5% Expected rate of increase in salaries – per annum 11.5% 12.5% Expected rate of return on plan assets – per annum 11% 12% Average expected remaining life of employees – years 5 6 Mortality rate EFU 61 – 66 EFU 61 – 66 mortality table mortality table
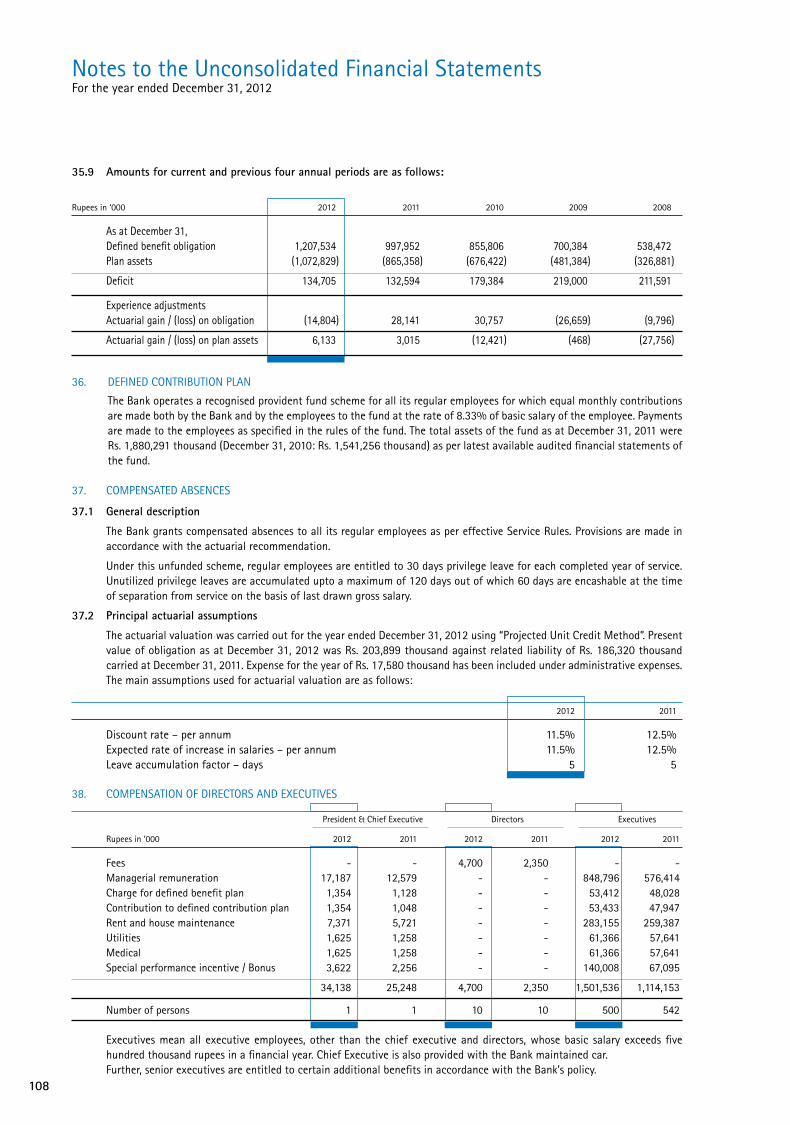
108
35.9 Amounts for current and previous four annual periods are as follows:
Rupees in ‘000 2012 2011 2010 2009 2008
As at December 31, Defined benefit obligation 1,207,534 997,952 855,806 700,384 538,472 Plan assets (1,072,829) (865,358) (676,422) (481,384) (326,881)
Deficit 134,705 132,594 179,384 219,000 211,591
Experience adjustments Actuarial gain / (loss) on obligation (14,804) 28,141 30,757 (26,659) (9,796)
Actuarial gain / (loss) on plan assets 6,133 3,015 (12,421) (468) (27,756)
36. DEFINED CONTRIBUTION PLAN
The Bank operates a recognised provident fund scheme for all its regular employees for which equal monthly contributions are made both by the Bank and by the employees to the fund at the rate of 8.33% of basic salary of the employee. Payments are made to the employees as specified in the rules of the fund. The total assets of the fund as at December 31, 2011 were Rs. 1,880,291 thousand (December 31, 2010: Rs. 1,541,256 thousand) as per latest available audited financial statements of the fund.
37. COMPENSATED ABSENCES
37.1 General description
The Bank grants compensated absences to all its regular employees as per effective Service Rules. Provisions are made in accordance with the actuarial recommendation.
Under this unfunded scheme, regular employees are entitled to 30 days privilege leave for each completed year of service. Unutilized privilege leaves are accumulated upto a maximum of 120 days out of which 60 days are encashable at the time of separation from service on the basis of last drawn gross salary.
37.2 Principal actuarial assumptions
The actuarial valuation was carried out for the year ended December 31, 2012 using “Projected Unit Credit Method”. Present value of obligation as at December 31, 2012 was Rs. 203,899 thousand against related liability of Rs. 186,320 thousand carried at December 31, 2011. Expense for the year of Rs. 17,580 thousand has been included under administrative expenses. The main assumptions used for actuarial valuation are as follows:
2012 2011
Discount rate – per annum 11.5% 12.5% Expected rate of increase in salaries – per annum 11.5% 12.5% Leave accumulation factor – days 5 5
38. COMPENSATION OF DIRECTORS AND EXECUTIVES
President & Chief Executive Directors Executives
Rupees in ‘000 2012 2011 2012 2011 2012 2011
Fees - - 4,700 2,350 - - Managerial remuneration 17,187 12,579 - - 848,796 576,414 Charge for defined benefit plan 1,354 1,128 - - 53,412 48,028 Contribution to defined contribution plan 1,354 1,048 - - 53,433 47,947 Rent and house maintenance 7,371 5,721 - - 283,155 259,387 Utilities 1,625 1,258 - - 61,366 57,641 Medical 1,625 1,258 - - 61,366 57,641 Special performance incentive / Bonus 3,622 2,256 - - 140,008 67,095
34,138 25,248 4,700 2,350 1,501,536 1,114,153
Number of persons 1 1 10 10 500 542
Executives mean all executive employees, other than the chief executive and directors, whose basic salary exceeds five hundred thousand rupees in a financial year. Chief Executive is also provided with the Bank maintained car. Further, senior executives are entitled to certain additional benefits in accordance with the Bank’s policy.
Notes to the Unconsolidated Financial StatementsFor the year ended December 31, 2012

109
Annual Report of Askari Bank Limited for 2012
39. FAIR VALUE OF FINANCIAL INSTRUMENTS
The fair value of quoted investments is based on quoted market prices and rates quoted at Reuters Pages (PKRV) with the exception of unlisted securities.
Fair value of remaining financial assets and liabilities except fixed term loans, staff loans, non–performing advances and fixed term deposits is not significantly different from the carrying amounts since assets and liabilities are either short term in nature or in the case of customer loans and deposits are frequently repriced.
Fair value of fixed term loans, staff loans, and fixed term deposits cannot be calculated with sufficient reliability due to absence of current and active market for such assets / liabilities and reliable data regarding market rates for similar instruments. The provision for non–performing advances is calculated in accordance with the Bank’s accounting policy as stated in note 5.4. The effective rates and maturity profile are stated in note 44.2.5 and 44.3.1 respectively.
40. SEGMENT DETAILS WITH RESPECT TO BUSINESS ACTIVITIES
The segment analysis with respect to business activity is as follows:
2012
Corporate Trading and Retail Commercial Payment and Agency Assets Retail Sub–Ordinated
Rupees in ‘000 Finance Sales Banking Banking Settlement Services Management Brokerage Loans Total
Total income 136,805 357,973 1,818,093 34,134,105 56,366 16,211 – – – 36,519,553 Total expenses 34,195 89,477 516,759 33,168,546 14,089 4,052 – – 962,708 34,789,826 Net income / (loss) 102,610 268,496 1,301,334 965,559 42,277 12,159 – – (962,708) 1,729,727 Segment Assets (Gross) 67,809 329,278 14,659,149 357,963,868 27,939 8,035 – – – 373,056,078 Segment Non Performing Loans – – 2,873,636 23,644,812 – – – – – 26,518,448 Segment Provision Required – – 2,523,806 17,476,645 – – – – – 20,000,451 Segment Liabilities 1,046 5,081 18,867,165 307,351,015 431 124 – – 7,142,759 333,367,621 Segment Return on net Assets (ROA) (%) 0.04 0.10 0.52 9.80 0.02 – – – – Segment Cost of funds (%) 0.01 0.03 0.16 10.06 – – – – 0.29
2011
Corporate Trading and Retail Commercial Payment and Agency Assets Retail Sub–Ordinated
Rupees in ‘000 Finance Sales Banking Banking Settlement Services Management Brokerage Loans Total
Total income 105,088 29,471 1,879,439 33,584,537 54,474 16,263 – – – 35,669,272 Total expenses 25,709 7,210 405,435 31,879,472 13,327 3,979 – – 921,389 33,256,521 Net income / (loss) 79,379 22,261 1,474,004 1,705,065 41,147 12,284 – – (921,389) 2,412,751 Segment Assets (Gross) 53,269 14,939 16,206,820 344,815,763 27,613 8,244 – – – 361,126,648 Segment Non Performing Loans – – 2,854,548 20,790,993 – – – – – 23,645,541 Segment Provision Required – – 2,465,021 14,905,321 – – – – – 17,370,342 Segment Liabilities 773 217 16,402,241 302,405,996 401 120 – – 7,170,292 325,980,040 Segment Return on net Assets (ROA) (%) 0.03 0.01 0.54 9.70 0.02 – – – – Segment Cost of funds (%) 0.01 – 0.13 10.20 – – – – 0.29
Assumptions used: – Administrative expenses have been allocated to segments based on respective segment income.
– Unallocatable assets representing 4.85% (2011: 5.01%) of the total assets have been allocated to segments based on their respective incomes.
– Unallocatable liabilities representing 1.73% (2011: 1.61%) of the total liabilities have been allocated to segments based on their respective assets.

110
41. TRUST ACTIVITIES
The Bank is not engaged in any significant trust activities. However, the Bank acts as security agent for some of the Term Finance Certificates it arranges and distributes on behalf of its customers.
42. RELATED PARTY TRANSACTIONS
Army Welfare Trust (AWT) holds 50.57% (2011: 50.57%) of the Bank’s share capital at the year end. The Bank has related party relationships with subsidiaries, entities under common directorship, its directors, key management personnel, entities over which the directors are able to exercise significant influence and employees’ funds.
Banking transactions with the related parties are executed substantially on the same terms, including mark–up rates and collateral, as those prevailing at the time for comparable transactions with unrelated parties and do not involve more than normal risk (i.e. under the comparable uncontrolled price method) other than those under terms of employment.
Details of transactions with related parties and balances with them at the year end are as follows:
December 31, 2012 December 31, 2011
Companies Companies
with common Associated with common Associated
Key directorship and Key directorship and
management having equity subsidiary Employees management having equity subsidiary Employees
Rupees in ‘000 Parent Personnel Directors under 20% companies funds Parent Personnel Directors under 20% companies funds
Balances outstanding as at
- Advances - 111,092 6,011 145 - - - 117,472 15,130 291 - -
- Deposits 17,755,898 28,306 39,306 349,635 405,377 52,611 19,327,756 43,868 98,100 171,830 49,407 68,014
- Outstanding commitments and contingent
liabilities for irrevocable commitments
and contingencies - - - 233,955 - - 277,859 - - 270,352 - -
- Investment in shares / units - at cost - - - 1,714,494 353,492 - - - - 1,614,504 353,492 -
- Security deposits against lease - - - 132 - - - - - 132 - -
- Investment in TFCs issued by the Bank - - - - 3,659 - - - - - 3,661 -
Transactions during the year ended
- Net mark-up / interest earned - 6,312 754 14 - - - 7,570 1,060 21,269 73 -
- Net mark-up / interest expensed 2,275,211 1,413 8,481 23,832 5,148 13,977 1,280,129 1,523 8,313 25,307 6,856 2,568
- Rent received against operating lease - - - - - - - - - 9,583 - -
- Contribution to employees’ funds - - - - - 328,246 - - - - - 295,405
- Investment made in subsidiary - - - - - - - - - - 68,284 -
- Investment in units of AIML funds - at cost - (net) - - - - - - - - - 38,106 - -
- Investment in units of AIML funds - purchase - - - 16,200,000 - -
- Investment in units of AIML funds - sale - - - 15,980,719 - -
- Assets sold to associated company - - - - - - - - - - 782 -
- Rent of property / service charges received 19,398 - - 4,764 5,412 - 15,629 - - 4,392 4,920 -
- Rent of property / service charges paid 67,737 - - 70,277 607 - 71,355 - - 77,062 - -
- Remuneration paid - 215,231 - - - - - 192,099 - - - -
- Post employment benefits - 16,983 - - - - - 14,862 - - - -
- Insurance claim received - - - - 317 - - - - - 1,246 -
- Insurance premium paid - - - - 26,905 - - - - - 47,156 -
- Dividend Income - - - 398,644 - - - - - 62,971 - -
- Security services costs - - - 198,679 - - - - - 189,053 - -
- Fee, commission and brokerage income received - - - 17 169 - 2 - - - 22 -
- Fees paid - - 4,700 - - - - - 2,350 - - -
Notes to the Unconsolidated Financial StatementsFor the year ended December 31, 2012
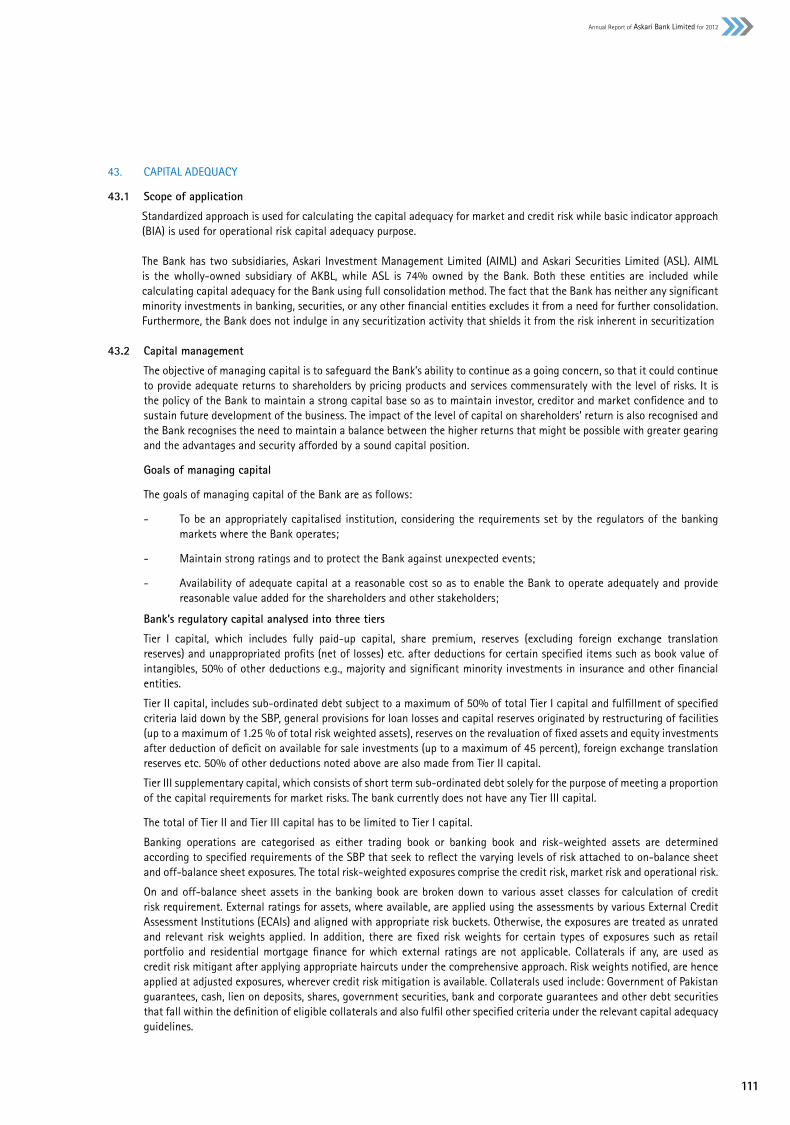
111
Annual Report of Askari Bank Limited for 2012
43. CAPITAL ADEQUACY
43.1 Scope of application
Standardized approach is used for calculating the capital adequacy for market and credit risk while basic indicator approach (BIA) is used for operational risk capital adequacy purpose.
The Bank has two subsidiaries, Askari Investment Management Limited (AIML) and Askari Securities Limited (ASL). AIML is the wholly-owned subsidiary of AKBL, while ASL is 74% owned by the Bank. Both these entities are included while calculating capital adequacy for the Bank using full consolidation method. The fact that the Bank has neither any significant minority investments in banking, securities, or any other financial entities excludes it from a need for further consolidation. Furthermore, the Bank does not indulge in any securitization activity that shields it from the risk inherent in securitization
43.2 Capital management
The objective of managing capital is to safeguard the Bank’s ability to continue as a going concern, so that it could continue to provide adequate returns to shareholders by pricing products and services commensurately with the level of risks. It is the policy of the Bank to maintain a strong capital base so as to maintain investor, creditor and market confidence and to sustain future development of the business. The impact of the level of capital on shareholders’ return is also recognised and the Bank recognises the need to maintain a balance between the higher returns that might be possible with greater gearing and the advantages and security afforded by a sound capital position.
Goals of managing capital
The goals of managing capital of the Bank are as follows:
- To be an appropriately capitalised institution, considering the requirements set by the regulators of the banking markets where the Bank operates;
- Maintain strong ratings and to protect the Bank against unexpected events;
- Availability of adequate capital at a reasonable cost so as to enable the Bank to operate adequately and provide reasonable value added for the shareholders and other stakeholders;
Bank’s regulatory capital analysed into three tiers
Tier I capital, which includes fully paid-up capital, share premium, reserves (excluding foreign exchange translation reserves) and unappropriated profits (net of losses) etc. after deductions for certain specified items such as book value of intangibles, 50% of other deductions e.g., majority and significant minority investments in insurance and other financial entities.
Tier II capital, includes sub-ordinated debt subject to a maximum of 50% of total Tier I capital and fulfillment of specified criteria laid down by the SBP, general provisions for loan losses and capital reserves originated by restructuring of facilities (up to a maximum of 1.25 % of total risk weighted assets), reserves on the revaluation of fixed assets and equity investments after deduction of deficit on available for sale investments (up to a maximum of 45 percent), foreign exchange translation reserves etc. 50% of other deductions noted above are also made from Tier II capital.
Tier III supplementary capital, which consists of short term sub-ordinated debt solely for the purpose of meeting a proportion of the capital requirements for market risks. The bank currently does not have any Tier III capital.
The total of Tier II and Tier III capital has to be limited to Tier I capital.
Banking operations are categorised as either trading book or banking book and risk-weighted assets are determined according to specified requirements of the SBP that seek to reflect the varying levels of risk attached to on-balance sheet and off-balance sheet exposures. The total risk-weighted exposures comprise the credit risk, market risk and operational risk.
On and off-balance sheet assets in the banking book are broken down to various asset classes for calculation of credit risk requirement. External ratings for assets, where available, are applied using the assessments by various External Credit Assessment Institutions (ECAIs) and aligned with appropriate risk buckets. Otherwise, the exposures are treated as unrated and relevant risk weights applied. In addition, there are fixed risk weights for certain types of exposures such as retail portfolio and residential mortgage finance for which external ratings are not applicable. Collaterals if any, are used as credit risk mitigant after applying appropriate haircuts under the comprehensive approach. Risk weights notified, are hence applied at adjusted exposures, wherever credit risk mitigation is available. Collaterals used include: Government of Pakistan guarantees, cash, lien on deposits, shares, government securities, bank and corporate guarantees and other debt securities that fall within the definition of eligible collaterals and also fulfil other specified criteria under the relevant capital adequacy guidelines.
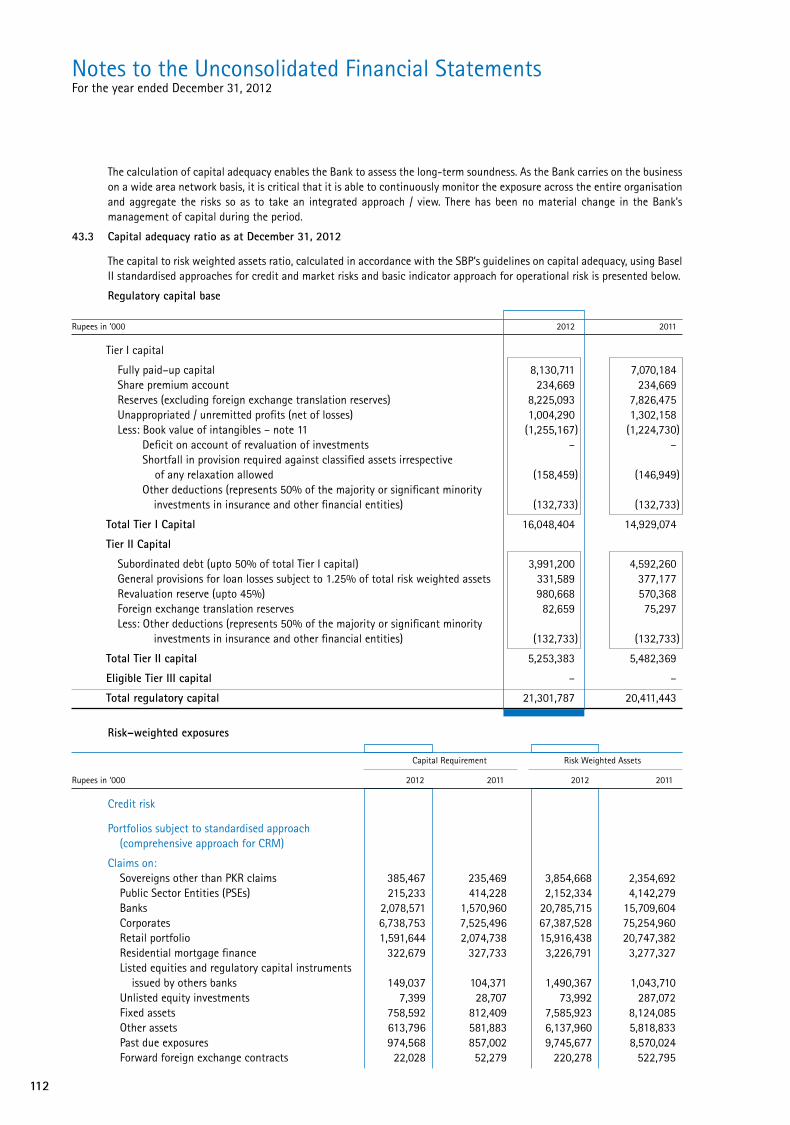
112
The calculation of capital adequacy enables the Bank to assess the long-term soundness. As the Bank carries on the business on a wide area network basis, it is critical that it is able to continuously monitor the exposure across the entire organisation and aggregate the risks so as to take an integrated approach / view. There has been no material change in the Bank’s management of capital during the period.
43.3 Capital adequacy ratio as at December 31, 2012
The capital to risk weighted assets ratio, calculated in accordance with the SBP’s guidelines on capital adequacy, using Basel II standardised approaches for credit and market risks and basic indicator approach for operational risk is presented below.
Regulatory capital base
Rupees in ‘000 2012 2011
Tier I capital
Fully paid–up capital 8,130,711 7,070,184 Share premium account 234,669 234,669 Reserves (excluding foreign exchange translation reserves) 8,225,093 7,826,475 Unappropriated / unremitted profits (net of losses) 1,004,290 1,302,158 Less: Book value of intangibles – note 11 (1,255,167) (1,224,730) Deficit on account of revaluation of investments – – Shortfall in provision required against classified assets irrespective of any relaxation allowed (158,459) (146,949) Other deductions (represents 50% of the majority or significant minority investments in insurance and other financial entities) (132,733) (132,733)
Total Tier I Capital 16,048,404 14,929,074
Tier II Capital
Subordinated debt (upto 50% of total Tier I capital) 3,991,200 4,592,260 General provisions for loan losses subject to 1.25% of total risk weighted assets 331,589 377,177 Revaluation reserve (upto 45%) 980,668 570,368 Foreign exchange translation reserves 82,659 75,297 Less: Other deductions (represents 50% of the majority or significant minority investments in insurance and other financial entities) (132,733) (132,733)
Total Tier II capital 5,253,383 5,482,369
Eligible Tier III capital – –
Total regulatory capital 21,301,787 20,411,443
Risk–weighted exposures
Capital Requirement Risk Weighted Assets
Rupees in ‘000 2012 2011 2012 2011
Credit risk
Portfolios subject to standardised approach (comprehensive approach for CRM)
Claims on: Sovereigns other than PKR claims 385,467 235,469 3,854,668 2,354,692 Public Sector Entities (PSEs) 215,233 414,228 2,152,334 4,142,279 Banks 2,078,571 1,570,960 20,785,715 15,709,604 Corporates 6,738,753 7,525,496 67,387,528 75,254,960 Retail portfolio 1,591,644 2,074,738 15,916,438 20,747,382 Residential mortgage finance 322,679 327,733 3,226,791 3,277,327 Listed equities and regulatory capital instruments issued by others banks 149,037 104,371 1,490,367 1,043,710 Unlisted equity investments 7,399 28,707 73,992 287,072 Fixed assets 758,592 812,409 7,585,923 8,124,085 Other assets 613,796 581,883 6,137,960 5,818,833 Past due exposures 974,568 857,002 9,745,677 8,570,024 Forward foreign exchange contracts 22,028 52,279 220,278 522,795
Notes to the Unconsolidated Financial StatementsFor the year ended December 31, 2012

113
Annual Report of Askari Bank Limited for 2012
Capital Requirement Risk Weighted Assets
Rupees in ‘000 2012 2011 2012 2011
Market risk Portfolios subject to standardised approach Interest rate risk 652,926 463,041 6,529,256 4,630,410 Equity position risk 1,047,968 662,140 10,479,682 6,621,395 Foreign exchange risk 122,736 11,913 1,227,363 119,134 Operational risk 2,355,340 2,261,726 23,553,401 22,617,255
TOTAL 18,036,737 17,984,095 180,367,373 179,840,957 Capital adequacy ratio
Total eligible regulatory capital held 21,301,787 20,411,443
Total risk weighted assets 180,367,373 179,840,957
Capital adequacy ratio 11.81% 11.35%
44. RISK MANAGEMENT
The Bank believes that effective risk management is of primary importance to achieve desired level of return while maintaining acceptable level of risk exposure. Robust risk management processes and framework are in place to achieve overall Bank’s objectives through a well thought out strategy, which enables the Bank to effectively manage, credit, market, operational and liquidity risk in a proactive manner.
The Bank’s approach is to ensure that risk management is deeply and firmly embedded in the culture of the Bank. All employees are therefore considered responsible for identification, measurement, monitoring and controlling risks within the scope of their assigned responsibilities. As a result of changing risk environment, the Bank continuously monitors and conducts holistic assessment of complex transactions on an integrated basis.
The Bank has a Board Risk Management Committee (BRMC) in place and the head of risk reports directly to BRMC for independent assurance. BRMC is responsible to review the extent of design and adequacy of risk management framework. BRMC oversees that risks are managed within the level of tolerance and risk appetite of the Bank.
44.1 Credit Risk
Credit risk arises from the potential that an obligor is either unwilling to perform on an obligation or its ability is impaired resulting in economic loss to the Bank. The Bank takes necessary measures to control such risk by monitoring credit exposures, limiting transactions with specific counter parties with increased likelihood of default and continually assessing the creditworthiness of counter parties.
The Bank has built and maintains a sound loan portfolio in terms of a well defined credit policy and credit risk policy approved by the board of directors. Its credit evaluation system comprises of well-designed credit appraisal, sanctioning and review procedures for the purpose of emphasizing prudence in its lending activities and ensuring quality of asset portfolio. Advances portfolio constitutes more than 40% of the total asset base and is also the largest source of credit risk for the Bank. Moreover, more than 80% of Bank’s capital requirement pertains to credit risk. The Bank’s advances portfolio is well diversified across various business segments, industries and geographical locations.
Risk mitigants have been put in place at all stages of credit risk cycle i.e. identification, measurement, monitoring, controlling and reporting for effective risk management. Accordingly, portfolio monitoring function is in place at the Bank with dedicated resources to ensure that risk is not only minimized but is optimized in risk / return perspective.
Credit risk review is conducted at obligor as well as at portfolio level to ensure adherence to regulatory as well as the Bank’s policies and procedures. The review process ensures that a sound and proactive risk management culture is maintained across the Bank. Meanwhile, an advances review committee has been established at the Bank. The committee comprises of the stakeholders from all the concerned functional units to oversee credit related activities across the Bank.
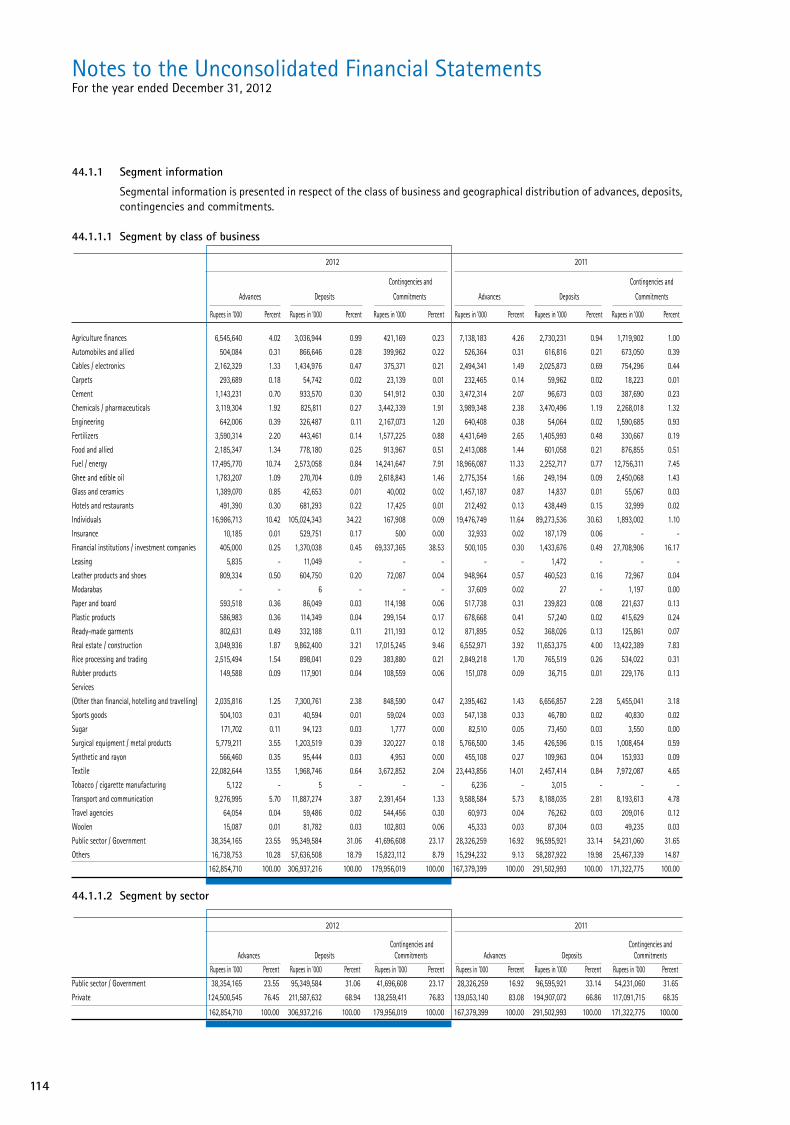
114
44.1.1 Segment information
Segmental information is presented in respect of the class of business and geographical distribution of advances, deposits, contingencies and commitments.
44.1.1.1 Segment by class of business
2012 2011
Contingencies and Contingencies and
Advances Deposits Commitments Advances Deposits Commitments
Rupees in ‘000 Percent Rupees in ‘000 Percent Rupees in ‘000 Percent Rupees in ‘000 Percent Rupees in ‘000 Percent Rupees in ‘000 Percent
Agriculture finances 6,545,640 4.02 3,036,944 0.99 421,169 0.23 7,138,183 4.26 2,730,231 0.94 1,719,902 1.00
Automobiles and allied 504,084 0.31 866,646 0.28 399,962 0.22 526,364 0.31 616,816 0.21 673,050 0.39
Cables / electronics 2,162,329 1.33 1,434,976 0.47 375,371 0.21 2,494,341 1.49 2,025,873 0.69 754,296 0.44
Carpets 293,689 0.18 54,742 0.02 23,139 0.01 232,465 0.14 59,962 0.02 18,223 0.01
Cement 1,143,231 0.70 933,570 0.30 541,912 0.30 3,472,314 2.07 96,673 0.03 387,690 0.23
Chemicals / pharmaceuticals 3,119,304 1.92 825,811 0.27 3,442,339 1.91 3,989,348 2.38 3,470,496 1.19 2,268,018 1.32
Engineering 642,006 0.39 326,487 0.11 2,167,073 1.20 640,408 0.38 54,064 0.02 1,590,685 0.93
Fertilizers 3,590,314 2.20 443,461 0.14 1,577,225 0.88 4,431,649 2.65 1,405,993 0.48 330,667 0.19
Food and allied 2,185,347 1.34 778,180 0.25 913,967 0.51 2,413,088 1.44 601,058 0.21 876,855 0.51
Fuel / energy 17,495,770 10.74 2,573,058 0.84 14,241,647 7.91 18,966,087 11.33 2,252,717 0.77 12,756,311 7.45
Ghee and edible oil 1,783,207 1.09 270,704 0.09 2,618,843 1.46 2,775,354 1.66 249,194 0.09 2,450,068 1.43
Glass and ceramics 1,389,070 0.85 42,653 0.01 40,002 0.02 1,457,187 0.87 14,837 0.01 55,067 0.03
Hotels and restaurants 491,390 0.30 681,293 0.22 17,425 0.01 212,492 0.13 438,449 0.15 32,999 0.02
Individuals 16,986,713 10.42 105,024,343 34.22 167,908 0.09 19,476,749 11.64 89,273,536 30.63 1,893,002 1.10
Insurance 10,185 0.01 529,751 0.17 500 0.00 32,933 0.02 187,179 0.06 - -
Financial institutions / investment companies 405,000 0.25 1,370,038 0.45 69,337,365 38.53 500,105 0.30 1,433,676 0.49 27,708,906 16.17
Leasing 5,835 - 11,049 - - - - - 1,472 - - -
Leather products and shoes 809,334 0.50 604,750 0.20 72,087 0.04 948,964 0.57 460,523 0.16 72,967 0.04
Modarabas - - 6 - - - 37,609 0.02 27 - 1,197 0.00
Paper and board 593,518 0.36 86,049 0.03 114,198 0.06 517,738 0.31 239,823 0.08 221,637 0.13
Plastic products 586,983 0.36 114,349 0.04 299,154 0.17 678,668 0.41 57,240 0.02 415,629 0.24
Ready-made garments 802,631 0.49 332,188 0.11 211,193 0.12 871,895 0.52 368,026 0.13 125,861 0.07
Real estate / construction 3,049,936 1.87 9,862,400 3.21 17,015,245 9.46 6,552,971 3.92 11,653,375 4.00 13,422,389 7.83
Rice processing and trading 2,515,494 1.54 898,041 0.29 383,880 0.21 2,849,218 1.70 765,519 0.26 534,022 0.31
Rubber products 149,588 0.09 117,901 0.04 108,559 0.06 151,078 0.09 36,715 0.01 229,176 0.13
Services
(Other than financial, hotelling and travelling) 2,035,816 1.25 7,300,761 2.38 848,590 0.47 2,395,462 1.43 6,656,857 2.28 5,455,041 3.18
Sports goods 504,103 0.31 40,594 0.01 59,024 0.03 547,138 0.33 46,780 0.02 40,830 0.02
Sugar 171,702 0.11 94,123 0.03 1,777 0.00 82,510 0.05 73,450 0.03 3,550 0.00
Surgical equipment / metal products 5,779,211 3.55 1,203,519 0.39 320,227 0.18 5,766,500 3.45 426,596 0.15 1,008,454 0.59
Synthetic and rayon 566,460 0.35 95,444 0.03 4,953 0.00 455,108 0.27 109,963 0.04 153,933 0.09
Textile 22,082,644 13.55 1,968,746 0.64 3,672,852 2.04 23,443,856 14.01 2,457,414 0.84 7,972,087 4.65
Tobacco / cigarette manufacturing 5,122 - 5 - - - 6,236 - 3,015 - - -
Transport and communication 9,276,995 5.70 11,887,274 3.87 2,391,454 1.33 9,588,584 5.73 8,188,035 2.81 8,193,613 4.78
Travel agencies 64,054 0.04 59,486 0.02 544,456 0.30 60,973 0.04 76,262 0.03 209,016 0.12
Woolen 15,087 0.01 81,782 0.03 102,803 0.06 45,333 0.03 87,304 0.03 49,235 0.03
Public sector / Government 38,354,165 23.55 95,349,584 31.06 41,696,608 23.17 28,326,259 16.92 96,595,921 33.14 54,231,060 31.65
Others 16,738,753 10.28 57,636,508 18.79 15,823,112 8.79 15,294,232 9.13 58,287,922 19.98 25,467,339 14.87
162,854,710 100.00 306,937,216 100.00 179,956,019 100.00 167,379,399 100.00 291,502,993 100.00 171,322,775 100.00
44.1.1.2 Segment by sector
2012 2011
Contingencies and Contingencies and Advances Deposits Commitments Advances Deposits Commitments
Rupees in ‘000 Percent Rupees in ‘000 Percent Rupees in ‘000 Percent Rupees in ‘000 Percent Rupees in ‘000 Percent Rupees in ‘000 Percent
Public sector / Government 38,354,165 23.55 95,349,584 31.06 41,696,608 23.17 28,326,259 16.92 96,595,921 33.14 54,231,060 31.65
Private 124,500,545 76.45 211,587,632 68.94 138,259,411 76.83 139,053,140 83.08 194,907,072 66.86 117,091,715 68.35
162,854,710 100.00 306,937,216 100.00 179,956,019 100.00 167,379,399 100.00 291,502,993 100.00 171,322,775 100.00
Notes to the Unconsolidated Financial StatementsFor the year ended December 31, 2012
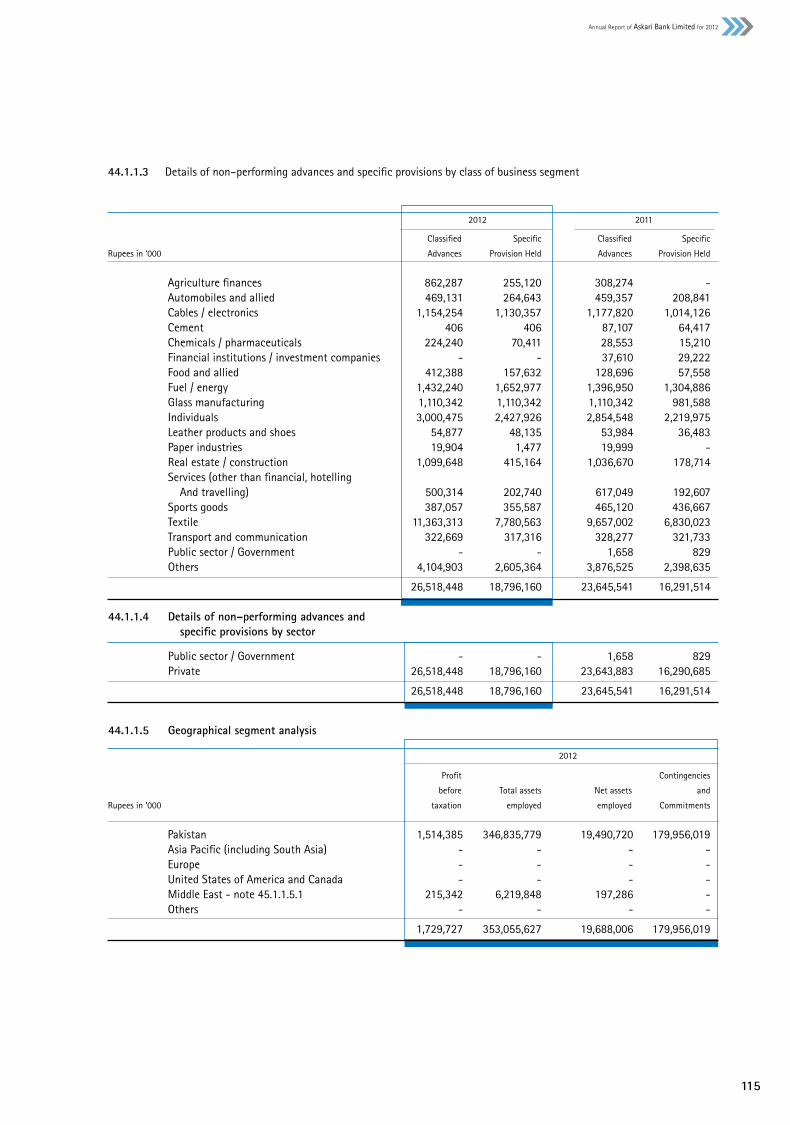
115
Annual Report of Askari Bank Limited for 2012
44.1.1.3 Details of non–performing advances and specific provisions by class of business segment
2012 2011
Classified Specific Classified Specific
Rupees in ‘000 Advances Provision Held Advances Provision Held
Agriculture finances 862,287 255,120 308,274 - Automobiles and allied 469,131 264,643 459,357 208,841 Cables / electronics 1,154,254 1,130,357 1,177,820 1,014,126 Cement 406 406 87,107 64,417 Chemicals / pharmaceuticals 224,240 70,411 28,553 15,210 Financial institutions / investment companies - - 37,610 29,222 Food and allied 412,388 157,632 128,696 57,558 Fuel / energy 1,432,240 1,652,977 1,396,950 1,304,886 Glass manufacturing 1,110,342 1,110,342 1,110,342 981,588 Individuals 3,000,475 2,427,926 2,854,548 2,219,975 Leather products and shoes 54,877 48,135 53,984 36,483 Paper industries 19,904 1,477 19,999 - Real estate / construction 1,099,648 415,164 1,036,670 178,714 Services (other than financial, hotelling And travelling) 500,314 202,740 617,049 192,607 Sports goods 387,057 355,587 465,120 436,667 Textile 11,363,313 7,780,563 9,657,002 6,830,023 Transport and communication 322,669 317,316 328,277 321,733 Public sector / Government - - 1,658 829 Others 4,104,903 2,605,364 3,876,525 2,398,635
26,518,448 18,796,160 23,645,541 16,291,514
44.1.1.4 Details of non–performing advances and specific provisions by sector
Public sector / Government - - 1,658 829 Private 26,518,448 18,796,160 23,643,883 16,290,685
26,518,448 18,796,160 23,645,541 16,291,514
44.1.1.5 Geographical segment analysis
2012
Profit Contingencies
before Total assets Net assets and
Rupees in ‘000 taxation employed employed Commitments
Pakistan 1,514,385 346,835,779 19,490,720 179,956,019 Asia Pacific (including South Asia) - - - - Europe - - - - United States of America and Canada - - - - Middle East - note 45.1.1.5.1 215,342 6,219,848 197,286 - Others - - - -
1,729,727 353,055,627 19,688,006 179,956,019

116
2011
Profit Contingencies
before Total assets Net assets and
Rupees in ‘000 taxation employed employed Commitments
Pakistan 2,145,390 336,869,734 17,643,841 171,322,775 Asia Pacific (including South Asia) - - - - Europe - - - - United States of America and Canada - - - - Middle East - note 45.1.1.5.1 267,361 6,886,572 132,425 - Others - - - -
2,412,751 343,756,306 17,776,266 171,322,775
44.1.1.5.1 These do not include intra group items of Rs. 5,910,280 thousand (2011: Rs. 6,639,796 thousand) eliminated upon consolidation of foreign branch.
44.1.1.5.2 Contingencies and commitments include amounts given in note 22 except bills for collection.
44.1.2 Credit risk – general disclosures Basel II specific
Basel II standardized approach is used for calculating the capital adequacy for credit risk with comprehensive approach for credit risk mitigation.
44.1.2.1 Types of exposures and ECAIs used
For domestic claims, ECAIs recommended by the State Bank of Pakistan (SBP), namely Pakistan Credit Rating Agency Limited (PACRA) and JCR-VIS Credit Rating Company Limited (JCR-VIS) were used. For foreign currency claims on sovereigns, risk weights were assigned on the basis of the credit ratings assigned by Moody’s. For claims on foreign entities, rating of S&P, Moody’s and Fitch Ratings were used. Foreign exposures not rated by any of the aforementioned rating agencies were categorized as unrated.
Type of exposures for which each agency is used in the year ended 2012 is presented below:
Exposures JCR–VIS PACRA Moody’s S&P Fitch
Sovereigns other than PKR claims – – 3 – – PSEs 3 3 – – – Banks 3 3 3 3 3
Corporates 3 3 – – –
Credit exposures subject to standardised approach
2012 2011
Rating Amount Deduction Net Amount Deduction Net
Exposures category outstanding CRM Amount outstanding CRM Amount
Rupees in ‘000
Sovereigns 6 2,569,779 - 2,569,779 2,354,692 - 2,354,692 PSEs 1 7,062,936 - 7,062,936 8,147,961 1,118,196 7,029,765 Banks 1,2,3 6,010,629 - 6,010,629 7,324,556 - 7,324,556 Banks 4,5 784,441 - 784,441 71,512 - 71,512 Corporates 1 12,065,791 1,687,793 10,377,998 12,039,779 - 12,039,779 Corporates 2 15,348,631 - 15,348,631 10,611,848 - 10,611,848 Corporates 3,4 - - - 943,202 8,241 934,962 Corporates 5,6 2,077,994 - 2,077,994 2,337,992 110,928 2,227,064 Unrated 217,525,139 32,196,410 185,328,729 220,891,888 15,726,950 205,164,938
Total 263,445,340 33,884,203 229,561,137 264,723,430 16,964,315 247,759,116
Notes to the Unconsolidated Financial StatementsFor the year ended December 31, 2012
117
Annual Report of Askari Bank Limited for 2012
Following is the list of main types of collateral taken by the Bank.
– Government and Trustee Securities
– Defense Saving Certificates
– Fixed Deposits (TDR)
– Lien on Deposits
– Cash Margin
– Shares Listed on Main Index
– Shares Listed on Non Main Index
– Government Guarantees
44.2 Market Risk
Market risk is the risk that the value of on and off-balance sheet positions of a financial institution will be adversely affected by movements in market rates or prices such as interest rates, foreign exchange rates, equity prices and credit spreads resulting in a loss to earnings and capital.
The Bank’s Risk Management Process seeks to identify, measure, monitor, and control market risks in order to shield against adverse movements in market factors and to attain an efficient risk/return profile of its open positions. The Risk Management Division has developed and implemented market risk policy and risk measurement /monitoring methodology for review and reporting of market risk. The Bank makes use of the globally established value-at-risk (VaR) methodology to measure traded market risk.
In addition, sensitivity analysis is carried out to gauge the impact of extreme market movements on traded exposures. Meanwhile, stress testing is used to analyze the impact of both the abnormal market movements across different markets as well as to assess non-traded market risk, in particular interest rate risk in the banking book. The performance of the Bank’s traded portfolios is evaluated through the use of risk / return analysis. Risk is kept under check through the revaluation of all traded market risk exposed positions on a daily basis, and controlled by ensuring that these positions do not breach regulatory limits and the Bank’s own internally-established risk tolerance limits.
44.2.1 Market risk – General disclosures Basel II specific
Basel II standardized approach is used for calculating the capital adequacy for market risk.

118
44.2.2 Foreign Exchange Risk
Foreign exchange risk, or the risk that the Bank’s earnings and / or capital can fluctuate due to changes in foreign exchange rates, arises out from the Bank’s foreign exchange exposure which consists of foreign currency cash in hand, nostro / vostro accounts, forward contracts, forward bookings with exporters, foreign bills purchased, foreign currency placements with SBP and the Bank’s Wholesale Banking Branch, foreign currency lendings / deposits and capital investments in offshore operations. The Bank’s treasury manages consolidated foreign exchange exposure by matching foreign currency assets and liabilities in spot and forward. The foreign exchange exposure and nostro balances are maintained within regulatory limits and VaR is calculated for consolidated foreign exchange exposure on a daily basis. The impact of a change in USD / PKR parity on the net open position is also determined through daily sensitivity analysis.
2012
Net foreign
Off–balance currency
(Rupees in ‘000) Assets Liabilities sheet items exposure
Pakistan Rupees 326,072,623 300,926,699 (4,570,980) 20,574,944 U.S. Dollars 21,095,490 26,846,992 4,443,198 (1,308,304) Pound Sterling 2,969,482 3,069,622 13,468 (86,672) Japanese Yen 4,256 64 - 4,192 Euro 2,400,048 2,517,557 131,604 14,095 Other European Currencies 34,006 (345) (9,723) 24,628 Other Currencies 479,722 7,032 (7,567) 465,123
353,055,627 333,367,621 - 19,688,006 2011
Net foreign
Off–balance currency
(Rupees in ‘000) Assets Liabilities sheet items exposure
Pakistan Rupees 317,477,650 290,842,524 (8,798,561) 17,836,565 U.S. Dollars 22,235,112 29,968,450 7,293,834 (439,504) Pound Sterling 1,286,206 2,744,387 1,454,082 (4,099) Japanese Yen 5,527 978 37,126 41,675 Euro 2,414,123 2,401,385 (136) 12,602 Other European Currencies 11,292 - - 11,292 Other Currencies 326,396 22,316 13,655 317,735
343,756,306 325,980,040 - 17,776,266
44.2.3 Equity position risk
Equity position risk is the risk that the value of equity positions inside the trading book and banking book will change as a result of general and specific equity market movements. The Bank bifurcates its direct investment in equity into held for trading, available for sale, and strategic portfolios. Held for trading equity exposures are of a short term nature and are undertaken to earn profit by exploiting market imperfections and short term price fluctuations. Equities held in the available for sale portfolio are with the intent to earn profit from fundamentals. Strategic investments are undertaken in line with the long-term strategy of the Bank, i.e. to build strategic interest in other concerns. The Bank also carries indirect equity exposure through financing against shares and reverse repos against shares.
All equity positions in the trading book are subject to exposure limits established by the Bank in conformity with the general limits prescribed by SBP. These limits include intraday limits, stop-loss limits, exposure limits, portfolio limits, and sectoral limits. The Bank carries out revaluation and calculates VaR on a daily basis for equity exposures in the trading book.
Notes to the Unconsolidated Financial StatementsFor the year ended December 31, 2012

119
Annual Report of Askari Bank Limited for 2012
44.2.4 Yield / interest rate risk in the banking book (IRRBB) – Basel II Specific
The Bank’s interest rate exposure arises out from its investment, lending, and borrowing activities. Interest rate risk in the banking book in its various forms is the risk of adverse changes in earnings and/or capital due to (i) timing differences or mismatches in the maturity/repricing period of financial assets and liabilities (repricing risk), (ii) differences in the basis used for calculating interest rates received and paid (basis risk), (iii) and options implicit or explicit in the Bank’s financial assets and liabilities (options risk). The Asset and Liability Management Committee (ALCO) of the Bank monitors and controls mismatch of interest rate sensitive assets and liabilities on an ongoing basis through its regular meetings. Market risk and Middle Office calculate price sensitivity measures such as duration, convexity and probabilistic loss measures such as VaR for the Bank’s debt investments to assess the impact of interest rate changes on value of the portfolio. Interest rate risk stress tests are carried out bi-annually to assess the impact of a parallel shift in the yield curve on the Bank’s capital using rate sensitive positions for on and off-balance sheet items.
44.2.5 Mismatch of interest rate sensitive assets and liabilities
Yield / interest rate sensitivity position for on-balance sheet instruments is based on the earlier of contractual re-pricing or maturity date and for off-balance sheet instruments is based on settlement date.
2012
Effective Exposed to yield/ interest risk Non–interest
Yield / Over 1 Over 3 Over 6 Over 1 Over 2 Over 3 Over 5 bearing
Interest Upto 1 to 3 to 6 Months to 1 to 2 to 3 to 5 to 10 Above 10 financial
Rupees in ‘000 rate Total Month Months Months Year Years Years Years Years Years instruments
On–balance sheet financial instruments
Assets
Cash and balances with treasury banks 0.00% 24,435,380 4,886,149 - - - - - - - - 19,549,231
Balances with other banks 1.11% 8,863,586 6,478,269 - - - - - - - - 2,385,317
Lendings to financial institutions 9.14% 6,319,474 5,833,725 - - 485,749 - - - - - -
Investments 11.26% 145,378,148 10,408,609 6,289,702 29,313,891 70,794,031 1,095,111 4,453,048 11,488,746 5,827,531 179,630 5,527,849
Advances 12.23% 143,726,962 43,048,390 66,534,365 23,761,159 5,365,247 831,196 322,171 572,951 889,750 2,401,733 -
Other assets 6,542,101 - - - - - - - - - 6,542,101
335,265,651 70,655,142 72,824,067 53,075,050 76,645,027 1,926,307 4,775,219 12,061,697 6,717,281 2,581,363 34,004,498
Liabilities
Bills payable 3,700,156 - - - - - - - - - 3,700,156
Borrowings 12.49% 8,372,617 5,515,911 204,083 2,584,187 4,762 19,823 19,823 19,823 4,205 - -
Deposits and other accounts 6.75% 306,937,216 101,286,169 65,807,558 57,471,799 12,883,361 1,630,309 610,820 945,363 39,148 - 66,262,689
Sub-ordinated loans 13.72% 6,987,300 - 1,495,500 5,491,800 - - - - - - -
Liabilities against assets subject to
finance lease - - - - - - - - - - -
Other liabilities 5,940,588 - - - - - - - - - 5,940,588
331,937,880 106,802,080 67,507,141 65,547,786 12,888,123 1,650,132 630,643 965,186 43,353 - 81,844,027
On-balance sheet gap 3,327,771 (36,146,938) 5,316,926 (12,472,736) 63,756,904 276,175 4,144,576 11,096,511 6,673,928 2,581,363 (47,839,529)
Off-balance sheet financial instruments
Purchase and resale agreements 8.16% 5,823,130 5,823,130 - - - - - - - - -
Sale and repurchase agreements - - - - - - - - - - - -
Commitments to extend credits 6,480,778 6,480,778 - - - - - - - - -
Off-balance sheet gap (657,648) (657,648) - - - - - - - - -
Total yield / interest risk sensitivity gap (36,804,586) 5,316,926 (12,472,736) 63,756,904 276,175 4,144,576 11,096,511 6,673,928 2,581,363 (47,839,529)
Cumulative yield / interest risk sensitivity gap (31,487,660) (43,960,396) 19,796,508 20,072,683 24,217,259 35,313,770 41,987,698 44,569,061
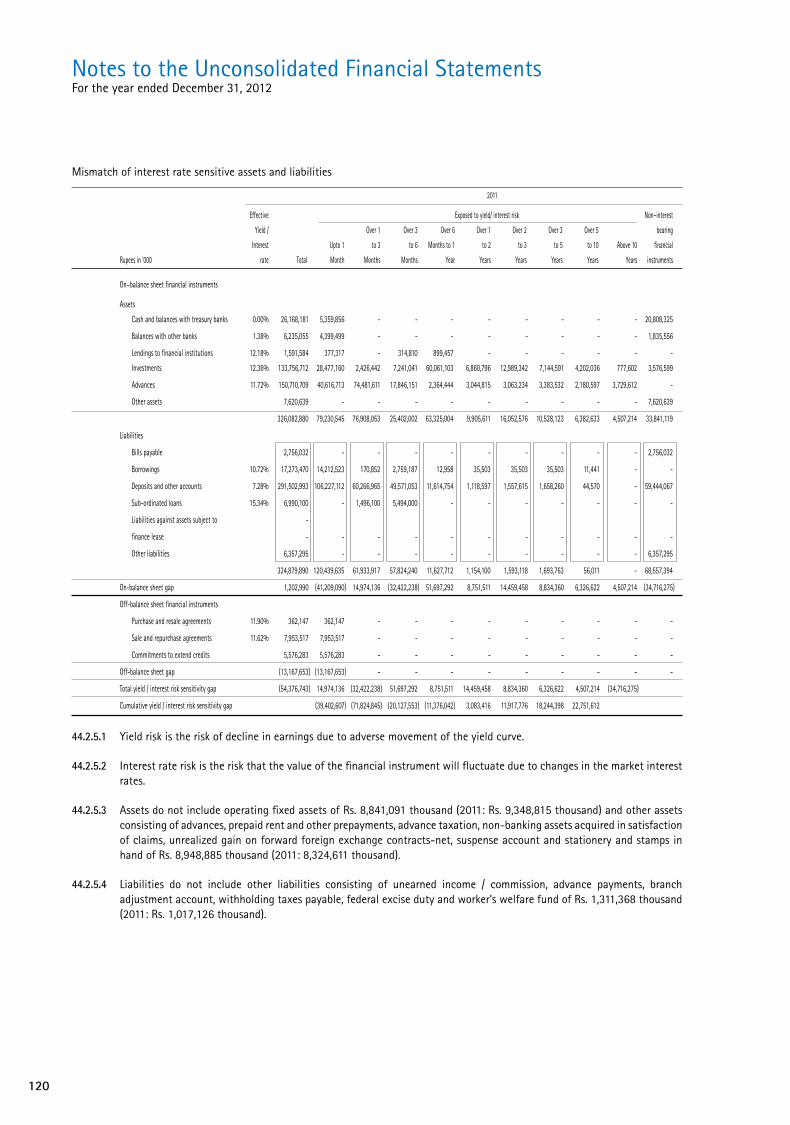
120
Mismatch of interest rate sensitive assets and liabilities
2011
Effective Exposed to yield/ interest risk Non–interest
Yield / Over 1 Over 3 Over 6 Over 1 Over 2 Over 3 Over 5 bearing
Interest Upto 1 to 3 to 6 Months to 1 to 2 to 3 to 5 to 10 Above 10 financial
Rupees in ‘000 rate Total Month Months Months Year Years Years Years Years Years instruments
On–balance sheet financial instruments
Assets
Cash and balances with treasury banks 0.00% 26,168,181 5,359,856 - - - - - - - - 20,808,325
Balances with other banks 1.38% 6,235,055 4,399,499 - - - - - - - - 1,835,556
Lendings to financial institutions 12.18% 1,591,584 377,317 - 314,810 899,457 - - - - - -
Investments 12.36% 133,756,712 28,477,160 2,426,442 7,241,041 60,061,103 6,860,796 12,989,342 7,144,591 4,202,036 777,602 3,576,599
Advances 11.72% 150,710,709 40,616,713 74,481,611 17,846,151 2,364,444 3,044,815 3,063,234 3,383,532 2,180,597 3,729,612 -
Other assets 7,620,639 - - - - - - - - - 7,620,639
326,082,880 79,230,545 76,908,053 25,402,002 63,325,004 9,905,611 16,052,576 10,528,123 6,382,633 4,507,214 33,841,119
Liabilities
Bills payable 2,756,032 - - - - - - - - - 2,756,032
Borrowings 10.72% 17,273,470 14,212,523 170,852 2,759,187 12,958 35,503 35,503 35,503 11,441 - -
Deposits and other accounts 7.28% 291,502,993 106,227,112 60,266,965 49,571,053 11,614,754 1,118,597 1,557,615 1,658,260 44,570 - 59,444,067
Sub-ordinated loans 15.34% 6,990,100 - 1,496,100 5,494,000 - - - - - - -
Liabilities against assets subject to -
finance lease - - - - - - - - - - -
Other liabilities 6,357,295 - - - - - - - - - 6,357,295
324,879,890 120,439,635 61,933,917 57,824,240 11,627,712 1,154,100 1,593,118 1,693,763 56,011 - 68,557,394
On-balance sheet gap 1,202,990 (41,209,090) 14,974,136 (32,422,238) 51,697,292 8,751,511 14,459,458 8,834,360 6,326,622 4,507,214 (34,716,275)
Off-balance sheet financial instruments
Purchase and resale agreements 11.90% 362,147 362,147 - - - - - - - - -
Sale and repurchase agreements 11.62% 7,953,517 7,953,517 - - - - - - - - -
Commitments to extend credits 5,576,283 5,576,283 - - - - - - - - -
Off-balance sheet gap (13,167,653) (13,167,653) - - - - - - - - -
Total yield / interest risk sensitivity gap (54,376,743) 14,974,136 (32,422,238) 51,697,292 8,751,511 14,459,458 8,834,360 6,326,622 4,507,214 (34,716,275)
Cumulative yield / interest risk sensitivity gap (39,402,607) (71,824,845) (20,127,553) (11,376,042) 3,083,416 11,917,776 18,244,398 22,751,612
44.2.5.1 Yield risk is the risk of decline in earnings due to adverse movement of the yield curve.
44.2.5.2 Interest rate risk is the risk that the value of the financial instrument will fluctuate due to changes in the market interest rates.
44.2.5.3 Assets do not include operating fixed assets of Rs. 8,841,091 thousand (2011: Rs. 9,348,815 thousand) and other assets consisting of advances, prepaid rent and other prepayments, advance taxation, non-banking assets acquired in satisfaction of claims, unrealized gain on forward foreign exchange contracts-net, suspense account and stationery and stamps in hand of Rs. 8,948,885 thousand (2011: 8,324,611 thousand).
44.2.5.4 Liabilities do not include other liabilities consisting of unearned income / commission, advance payments, branch adjustment account, withholding taxes payable, federal excise duty and worker’s welfare fund of Rs. 1,311,368 thousand (2011: Rs. 1,017,126 thousand).
Notes to the Unconsolidated Financial StatementsFor the year ended December 31, 2012

121
Annual Report of Askari Bank Limited for 2012
44.3 Liquidity risk
Liquidity risk reflects an enterprises inability in raising funds to meet commitments. The Bank’s liquidity position is managed by the Asset and Liability Management Committee (ALCO). ALCO monitors the maintenance of financial position liquidity ratios, depositors concentration both in terms of the overall funding mix and avoidance of undue reliance on large individual deposits and liquidity contingency plans. Moreover, core retail deposits (current accounts and saving accounts) form a considerable part of the Bank’s overall funding and significant importance is attached to the stability and growth of these deposits.
44.3.1 Maturities of assets and liabilities
2012
Over 1 Over 3 Over 6 Over 1 Over 2 Over 3 Over 5
Upto 1 to 3 to 6 Months to to 2 to 3 to 5 to 10 Above 10
Rupees in ‘000 Total Month Months Months 1 Year Years Years Years Years Years
Assets
Cash and balances with treasury banks 24,435,380 24,435,380 - - - - - - - -
Balances with other banks 8,863,586 8,863,586 - - - - - - - -
Lendings to financial institutions 6,319,474 5,833,725 - - 485,749 - - - - -
Investments 145,378,148 10,720,499 5,943,257 19,261,205 72,428,216 7,346,074 6,551,380 14,002,825 7,907,412 1,217,280
Advances 143,726,962 22,835,553 34,979,153 18,884,444 29,852,156 6,872,817 5,302,015 9,975,339 9,067,809 5,957,676
Operating fixed assets 8,841,091 67,932 114,696 173,437 303,356 629,122 523,751 769,040 1,331,135 4,928,622
Deferred tax assets - - - - - - - - - -
Other assets 15,490,986 3,625,424 - - - 2,416,949 2,416,949 2,343,888 2,343,888 2,343,888
353,055,627 76,382,099 41,037,106 38,319,086 103,069,477 17,264,962 14,794,095 27,091,092 20,650,244 14,447,466
Liabilities
Bills payable 3,700,156 1,217,788 - 224,401 2,257,967 - - - - -
Borrowings 8,372,617 5,515,911 204,083 2,584,187 4,762 19,823 19,823 19,823 4,205 -
Deposits and other accounts 306,937,216 50,044,480 29,761,991 18,267,862 12,883,360 47,090,636 46,071,147 49,653,386 26,648,135 26,516,219
Sub-ordinated loans 6,987,300 - 1,495,500 1,100 1,496,300 1,600 1,600 3,200 3,988,000 -
Liabilities against assets subject to - - - - - - - - -
finance lease - - - - - - - - - -
Deferred tax liabilities 118,376 - 168,678 - - - - (50,302) - -
Other liabilities 7,251,956 3,848,695 - - - 1,701,632 850,816 425,408 212,704 212,701
333,367,621 60,626,874 31,630,252 21,077,550 16,642,389 48,813,691 46,943,386 50,051,515 30,853,044 26,728,920
Net assets 19,688,006 15,755,225 9,406,854 17,241,536 86,427,088 (31,548,729) (32,149,291) (22,960,423) (10,202,800) (12,281,454)
Share Capital 8,130,711
Reserves 8,542,421
Unappropriated profit 1,004,290
Surplus on revaluation of assets 2,010,584
19,688,006

122
Maturities of assets and liabilities
2011
Over 1 Over 3 Over 6 Over 1 Over 2 Over 3 Over 5
Upto 1 to 3 to 6 Months to to 2 to 3 to 5 to 10 Above 10
Rupees in ‘000 Total Month Months Months 1 Year Years Years Years Years Years
Assets
Cash and balances with treasury banks 26,168,181 26,168,181 - - - - - - - -
Balances with other banks 6,235,055 6,235,055 - - - - - - - -
Lendings to financial institutions 1,591,584 377,317 - 314,810 899,457 - - - - -
Investments 133,756,712 5,252,128 10,029,232 25,537,182 57,057,088 5,438,510 10,788,259 14,126,597 4,845,121 682,594
Advances 150,710,709 54,991,880 21,581,917 21,457,550 17,984,793 11,249,983 5,350,800 4,784,773 8,418,520 4,890,493
Operating fixed assets 9,348,815 70,295 135,714 198,305 392,805 687,354 534,469 1,744,942 737,870 4,847,061
Deferred tax assets - - - - - - - - - -
Other assets 15,945,250 3,731,737 - - - 2,487,825 2,487,825 2,412,621 2,412,621 2,412,621
343,756,306 96,826,593 31,746,863 47,507,847 76,334,143 19,863,672 19,161,353 23,068,933 16,414,132 12,832,769
Liabilities
Bills payable 2,756,032 907,059 - 167,143 1,681,830 - - - - -
Borrowings 17,273,470 14,212,523 170,852 2,759,187 12,958 35,503 35,503 35,503 11,441 -
Deposits and other accounts 291,502,993 59,849,619 27,687,834 14,137,287 11,614,754 37,747,514 38,186,532 52,633,911 24,845,056 24,800,486
Sub-ordinated loans 6,990,100 - 300 1,100 1,400 2,992,900 1,600 3,200 3,989,600 -
Liabilities against assets subject to - - - - - - - -
finance lease - - - - - - - - - -
Deferred tax liabilities 83,024 - (231,453) - - - - 314,477 - -
Other liabilities 7,374,421 3,913,802 - - - 1,730,309 865,155 432,577 216,289 216,289
325,980,040 78,883,003 27,627,533 17,064,717 13,310,942 42,506,226 39,088,790 53,419,668 29,062,386 25,016,775
Net assets 17,776,266 17,943,590 4,119,330 30,443,130 63,023,201 (22,642,554) (19,927,437) (30,350,735) (12,648,254) (12,184,006)
Share Capital 7,070,184
Reserves 8,136,440
Unappropriated profit 1,302,158
Surplus on revaluation of assets 1,267,484
17,776,266
44.3.1.1 In compliance with the BSD circular letter No. 03 of 2011 dated February 22, 2011, all assets and liabilities with contractual maturities have been reported as per their remaining maturities, and where contractual maturities are not available, such assets and liabilities have been reported as per their expected maturities, determined on the basis of behaviour study of three years’ historic data under volatility methodology. These bases have also been approved by the ALCO of the Bank.
44.4 Operational risk
Operational risk is the risk of loss resulting from inadequate or failed internal processes, people, systems and external events. The Bank strives to manage operational risk within acceptable levels through sound operational risk management practices. Board Risk Management Committee defines the operational risk appetite and tolerance limits.
Operational risk governance structure adopted by the Bank is embedded within three lines of defense: strategic, macro and micro. Bank has recently updated its operational risk management framework to align it with global/local best market practices. Moreover, the Bank has also formulated Operational Risk Management Committee (ORMC) which serves as a management level committee to oversee, supervise and direct operational risk framework across the Bank. Further, the committee is responsible for strengthening internal control environment through implementation of policies and procedure, enhancement in tools and reporting structures.
To ensure effectiveness, business continuity plan (BCP) and business continuity management (BCM) is adopted throughout the organization in a proactive manner by making use of requisite tools and strategies.
Notes to the Unconsolidated Financial StatementsFor the year ended December 31, 2012

123
Annual Report of Askari Bank Limited for 2012
44.4.1 Operational risk disclosures Basel II
Basel II basic indicator approach is used for calculating the capital adequacy for operational risk.
45. GENERAL
45.1 Non-adjusting events after the balance sheet date
The Board of Directors in its meeting held on February 18, 2013 has proposed the following appropriation, which will be approved in the forthcoming annual general meeting. The unconsolidated financial statements for the year ended December 31, 2012 do not include the effect of the appropriation which will be accounted for in the unconsolidated financial statements for the year ending December 31, 2013 as follows:
Rupees in ‘000 2012 2011
Transfer from unappropriated profit to: General reserve 1,004,290 1,302,158
Transfer from general reserve to: Reserve for issue of bonus shares - 1,060,528
45.2 Captions as prescribed by BSD Circular No. 4 dated February 17, 2006 issued by the SBP in respect of which there are no amounts have not been reproduced in these unconsolidated financial statements except for the unconsolidated statement of financial position and unconsolidated profit and loss account.
46. DATE OF AUTHORIZATION
These unconsolidated financial statements were authorised for issue on February 18, 2013 by the Board of Directors of the Bank.
M. R. Mehkari Dr. Bashir Ahmad Khan Lt. Gen. (R) Tahir Mahmood Lt. Gen. Javed Iqbal President & Chief Executive Director Director Chairman

124
Statement in terms of sub-section (3) of section 33-A of the Banking Companies Ordinance, 1962 in respect of written off loans or any other financial reliefs of Rs 500,000 or above allowed to a person(s) during the year ended December 31, 2012. (Rupees in ‘000)
Outstanding liabilities at the beginning of the year Other Interest/ FinancialSr. Name and address Name of Individuals / Interest/ Principal Mark–up reliefNo. of the Borrower Partners / Directors Father’s / Husband’s Name Principal Mark–up Others Total Written–off Written–off provided Total
1 Hillat Textile Mills (Pvt) Ltd. Muhammad Imran Mian Muhammad Arshad 10,187 5,214 - 15,401 - 5,214 - 5,214 31-KM, Multan Road, Lahore 35202-1629168-3 Aliya Imran Muhammad Imran 35202-7248245-0 2 Bilal Textiles (Pvt) Limited Saleem Umer Mian Muhammad Umar 55,142 24,396 - 79,538 - 24,396 - 24,396 P-102, Jail Road, Faisalabad 33100-0902344-5 Naeem Umer Mian Muhammad Umar 33100-0571105-5 Mian Habibullah Mian Muhammad Umar 32405-6085591-5 Bilal Umer Mian Muhammad Saleem Umer 33100-5720610-3 3 Muhammad Sharif Chaudhary Muhammad Sharif Chaudhary Chaudhry Jalal Din 1,995 1,276 - 3,271 - 771 - 771 329 Block M, Moden Town Extension 35202-5927561-9 Lahore 4 Top Fashion Garments Nauman Zaheer Zaheer Ahmed 8,593 1,445 - 10,038 1,043 1,445 - 2,488 Plot No.1-D/5, Street No.18/1, 42101-1843232-5 Sector 16-B, North Karachi Industrial Area, Karachi. 5 S. Essa Asif Kapadia Ismail Kapadia 14,977 4,616 - 19,593 - 2,133 - 2,133 1103, 1104, Business Centre, Mumtaz 42301-5125756-9 Hassan Road, Karachi Saleem Kapadia Ismail Kapadia 42201-0737639-5 Arif Kapadia Ismail Kapadia 42201-4231223-3 Shafi Kapadia Ismail Kapadia 42301-8575273-5 6 Textile Farms Syed Mazhar Ali Zaidi Syed Haziq Ali Zaidi 8,381 2,945 - 11,326 - 2,385 - 2,385 Plot No.DP-4, Sector 21, Korangi 42201-4025527-5 Industrial Area, Karachi Asma Zaidi Syed Mazhar Ali Zaidi 42201-0408336-4
7 Sara Industries Anwar Ahmed Khan Muhammad Iqbal Khan 22,230 6,610 - 28,840 - 3,957 - 3,957 No.706, 7th Floor, Ibrahim Trade 90309-0105588-7 Tower, Shahrah-e-Faisal, Karachi 8 Mian Ali Hassan Mian Ali Hassan Ch. Zahoor Ahmed 4,000 1,040 - 5,040 - 540 - 540 441-442-B, Peoples Colony No.1 33100-0387878-9 Faisalabad. 9 Muhammad Khalid Muhammad Khalid Muhammad Ashraf 2,700 1,367 - 4,067 - 1,367 - 1,367 P-600, St. No.9-A, Mustafaabad 33100-3487758-9 Faisalabad. 10 Nauman Bashir Khan Nauman Bashir Khan Muhammad Bashir 935 1,151 - 2,086 - 593 - 593 House No.142, Block Q, Phase-II 42201-6029743-5 DHA, Lahore
Annexure–1Annexure ‘1’ referred to in note 10.8.3 to these unconsolidated financial statements
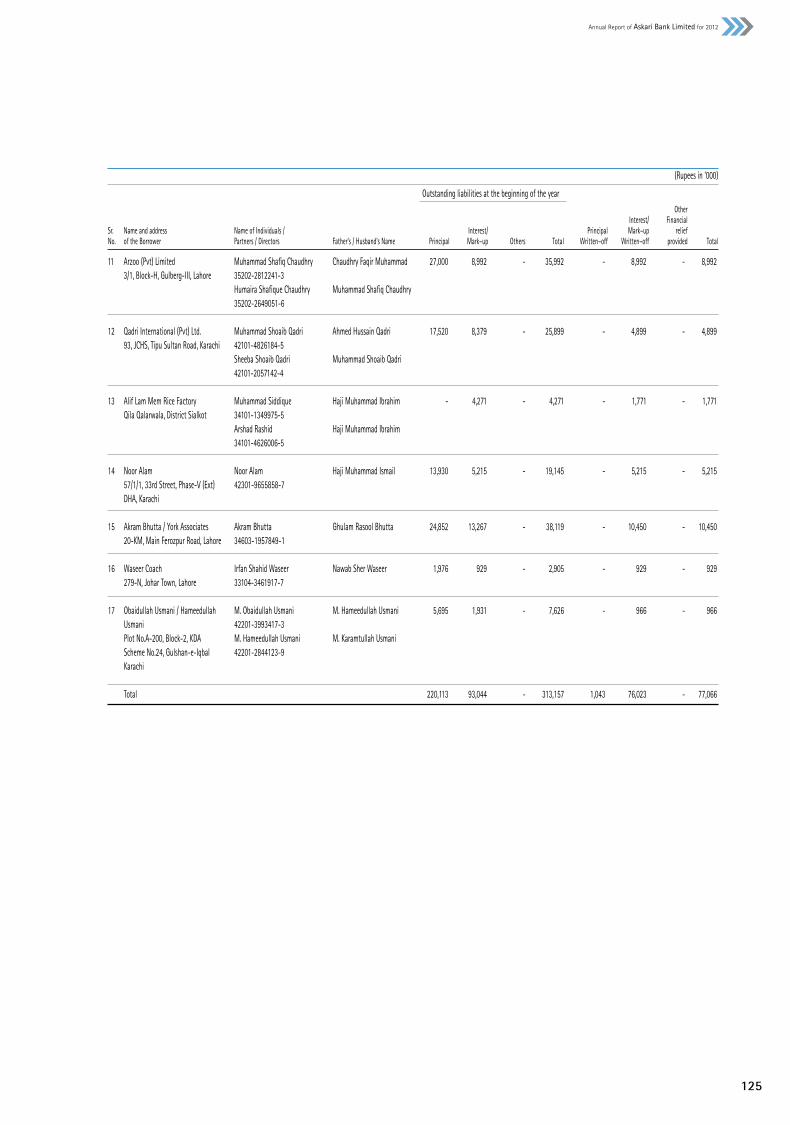
125
Annual Report of Askari Bank Limited for 2012
(Rupees in ‘000)
Outstanding liabilities at the beginning of the year Other Interest/ FinancialSr. Name and address Name of Individuals / Interest/ Principal Mark–up reliefNo. of the Borrower Partners / Directors Father’s / Husband’s Name Principal Mark–up Others Total Written–off Written–off provided Total
11 Arzoo (Pvt) Limited Muhammad Shafiq Chaudhry Chaudhry Faqir Muhammad 27,000 8,992 - 35,992 - 8,992 - 8,992 3/1, Block-H, Gulberg-III, Lahore 35202-2812241-3 Humaira Shafique Chaudhry Muhammad Shafiq Chaudhry 35202-2649051-6 12 Qadri International (Pvt) Ltd. Muhammad Shoaib Qadri Ahmed Hussain Qadri 17,520 8,379 - 25,899 - 4,899 - 4,899 93, JCHS, Tipu Sultan Road, Karachi 42101-4826184-5 Sheeba Shoaib Qadri Muhammad Shoaib Qadri 42101-2057142-4 13 Alif Lam Mem Rice Factory Muhammad Siddique Haji Muhammad Ibrahim - 4,271 - 4,271 - 1,771 - 1,771 Qila Qalarwala, District Sialkot 34101-1349975-5 Arshad Rashid Haji Muhammad Ibrahim 34101-4626006-5 14 Noor Alam Noor Alam Haji Muhammad Ismail 13,930 5,215 - 19,145 - 5,215 - 5,215 57/1/1, 33rd Street, Phase-V (Ext) 42301-9655858-7 DHA, Karachi 15 Akram Bhutta / York Associates Akram Bhutta Ghulam Rasool Bhutta 24,852 13,267 - 38,119 - 10,450 - 10,450 20-KM, Main Ferozpur Road, Lahore 34603-1957849-1 16 Waseer Coach Irfan Shahid Waseer Nawab Sher Waseer 1,976 929 - 2,905 - 929 - 929 279-N, Johar Town, Lahore 33104-3461917-7 17 Obaidullah Usmani / Hameedullah M. Obaidullah Usmani M. Hameedullah Usmani 5,695 1,931 - 7,626 - 966 - 966 Usmani 42201-3993417-3 Plot No.A-200, Block-2, KDA M. Hameedullah Usmani M. Karamtullah Usmani Scheme No.24, Gulshan-e-Iqbal 42201-2844123-9 Karachi Total 220,113 93,044 - 313,157 1,043 76,023 - 77,066

126
The Bank is operating 32 Islamic banking branches including 2 sub-branches at the end of 2012 as compared to 31 Islamic banking branches including 2 sub-branches at the end of 2011.
Rupees in ‘000 2012 2011
ASSETS Cash and balances with treasury banks 837,972 713,256 Balances with and due from financial institutions 899,960 528,613 Investments 10,201,914 9,818,059 Islamic financing and related assets A-2.1 3,127,541 3,077,645 Operating fixed assets 216,087 264,397 Deffered tax assets - - Other assets 505,564 554,875
Total Assets 15,789,038 14,956,845 LIABILITIES Bills payable 129,735 98,876 Due to financial institutions 500,000 - Deposits and other accounts -Current accounts 3,105,265 2,301,298 -Saving accounts 3,582,107 2,977,415 -Term deposits 6,030,957 5,462,224 -Others 54,469 27,491 -Deposit from financial institutions - remunerative 1,112,699 1,072,428 -Deposits from financial institutions - non remunerative 2,304 1,777 Due to head office 156,176 1,679,067 Other liabilities 312,571 416,871
14,986,283 14,037,447
NET ASSETS 802,755 919,398
REPRESENTED BY Islamic banking fund 1,000,000 1,000,000 Reserves - - Unappropriated / unremitted loss (129,324) (205,102)
870,676 794,898 (Deficit) / surplus on revaluation of assets (67,921) 124,500
802,755 919,398 Remuneration to Shariah Advisor 1,347 1,253 CHARITY FUND Opening balance 213 2,700 Additions during the year 3,111 3,107 Payments / utilization during the year (3,286) (5,594)
Closing Balance 38 213
A-2.1 Islamic financing and related assets Islamic modes of financing A-2.1.1 3,095,960 3,036,063 Advance against islamic financing 31,581 41,582 Inventories - -
3,127,541 3,077,645
A-2.1.1 Islamic modes of financing Murabaha 536,565 184,085 Ijara 619,847 867,935 Musharaka - - Diminishing musharaka 1,420,998 1,530,939 Salam 498,532 440,818 Other islamic modes 20,018 12,286
3,095,960 3,036,063
Annexure–2Islamic Banking Business - Balance SheetAs at December 31, 2012

127
Annual Report of Askari Bank Limited for 2012
Rupees in ‘000 2012 2011
Profit / return earned on financings, investments and placements 1,520,806 1,312,988 Return on deposits and other dues expensed 887,972 831,691
Net spread earned 632,834 481,297 (Reversal) / provision against non-performing financings (21,712) 7,379 Provision / (reversal) of diminution in the value of investments 67,969 (85,680) Bad debts written off directly - -
46,257 (78,301)
Income after provisions 586,577 559,598 Other Income
Fee, commission and brokerage income 20,631 25,542 Dividend income - - Income from dealing in foreign currencies 1,883 1,858 Capital gain on sale of securities - - Unrealised gain / (loss) on revaluation of investments classified as held for trading - - Other income 18,791 31,606
Total other income 41,305 59,006
627,882 618,604 Other expenses
Administrative expenses 551,902 518,560 Other provisions / write offs - - Other charges 202 1,495
Total other expenses 552,104 520,055
75,778 98,549 Extra ordinary / unusual items - -
Profit before taxation 75,778 98,549
Annexure–2Islamic Banking Business - Profit and Loss AccountFor the year ended December 31, 2012

128
Alhamdolillah! During the year 2012, Askari Bank Limited continued with its branch expansion plan, and operated with 32 Islamic Banking Branches and 02 Islamic Banking Sub-branches, covering all major cities of the Country. Insha’Allah, the increased outreach, will strengthen our ability to offer products and services conforming to Shariah principales.
During the year under review, comprehensive Shariah Audit of all Islamic Banking Branches was conducted, resulting in strengthening of Shariah Compliance framework for Islamic Banking Services. As part of continuous improvement, customer specific transactions process flows and text of guarantee were approved to ensure Shariah Compliance, while offering financing products to the customers. Furthermore, the profit & loss distribution and pool management for Mudarabah based deposits has been standardized as per SBP instructions.
As per Shariah requirements, special care is continuously taken, on an ongoing basis, to ensure that the funds and products of Islamic Banking are managed separately from the conventional banking side. All funds are obtained and invested in Halal modes of financing, investments and placements, under my supervision, as the Shariah Advisor of the Bank.
I have examined each class of transaction, relevant documentation and procedures, on test check basis, conducted during the year. In order to facilitate this work, Shariah Auditors and Shariah Compliance department are functioning under my supervision.
Any earnings that have been realized from sources, or means, prohibited by Shariah rules and principles have been credited to charity account.
The allocation of funds, weightages, profit sharing ratios, profits and charging of losses (if any), relating to PLS accounts conform to the basis vetted by me as the Shariah advisor, in accordance with the Shariah rules and principles.
In my opinion, the affairs of Askari Bank Limited - Islamic Banking have been carried out in accordance with rules and principles of Shariah, SBP regulations and guidelines related to Shariah compliance and other rules, as well as with specific fatawa and rulings issued by me, as Shariah Advisor, from time to time. We remain fully committed to contributing to capacity building and promoting the cause of Islamic Banking in Pakistan. May Allah Almighty bless our efforts!
Dr. Muhammad Tahir MansooriShariah Advisor
Annexure–2Shariah Advisor’s Report 2012

129
Annual Report of Askari Bank Limited for 2012
Consolidated Financial Statements of
Askari Bank LimitedFor the year ended December 31, 2012

130
This page is intentionally left blank

131
Annual Report of Askari Bank Limited for 2012
Auditors’ Report to the Members of Askari Bank Limited
We have audited the annexed consolidated financial statements comprising consolidated statement of financial position of Askari Bank Limited and its subsidiary companies as at 31 December 2012 and the related consolidated profit and loss account, consolidated statement of comprehensive income, consolidated cash flow statement and consolidated statement of changes in equity together with the notes forming part thereof, for the year then ended. These consolidated financial statements include unaudited certified returns from the branches except for 20 branches which have been audited by us and one branch audited by us and one branch audited by the other auditors abroad. We have also expressed separate opinions on the financial statements of Askari Bank Limited and its subsidiary companies namely Askari Securities Limited and Askari Investment Management Limited. These financial statements are the responsibility of the Holding Company’s management. Our responsibility is to express an opinion on these financial statements based on our audit.
Our audit was conducted in accordance with the International Standards on Auditing and accordingly included such tests of accounting records and such other auditing procedures as we considered necessary in the circumstances.
In our opinion, the consolidated financial statements present fairly the financial position of Askari Bank Limited and its subsidiary companies as at 31 December 2012 and the results of their operations for the year then ended.
Islamabad KPMG Taseer Hadi & Co.February 26, 2013 Chartered Accountants
Engagement Partner
Muhammad Rehan Chughtai
KPMG Taseer Hadi & Co., a Partnership firm registered in Pakistanand a member firm of the KPMG network of independent memberfirms affiliated with KPMG International Cooperative(“KPMG International”), a Swiss entity.
KPMG Taseer Hadi & Co.Chartered AccountantsSixth Floor, State Life Building No. 5Jinnah Avenue, Blue AreaIslamabad, Pakistan
Telephone + 92 (51) 282 3558 + 92 (51) 282 5956Fax + 92 (51) 282 2671Internet www.kpmg.com.pk

132
Consolidated Statement of Financial PositionAs at December 31, 2012
Rupees in ‘000 Note 2012 2011
Assets
Cash and balances with treasury banks 6 24,435,422 26,168,206 Balances with other banks 7 8,865,303 6,236,116 Lendings to financial institutions 8 6,341,474 1,613,584 Investments 9 145,354,253 133,655,387 Advances 10 143,727,835 150,712,556 Operating fixed assets 11 8,901,522 9,451,033 Deferred tax assets - - Other assets 12 15,585,465 16,028,838
353,211,274 343,865,720 Liabilities
Bills payable 13 3,700,156 2,756,032 Borrowings 14 8,376,740 17,274,979 Deposits and other accounts 15 306,929,729 291,499,395 Sub-ordinated loans 16 6,987,300 6,990,100 Liabilities against assets subject to finance lease 17 1,018 2,893 Deferred tax liabilities 18 83,139 46,908 Other liabilities 19 7,305,811 7,413,555
333,383,893 325,983,862
Net assets 19,827,381 17,881,858 Represented by
Share capital 20 8,130,711 7,070,184 Reserves 21 8,541,776 8,135,795 Unappropriated profit 1,114,869 1,380,018
17,787,356 16,585,997 Non-controlling interest 29,441 28,377
17,816,797 16,614,374 Surplus on revaluation of assets - net of tax 22 2,010,584 1,267,484
19,827,381 17,881,858 Contingencies and commitments 23
The annexed notes 1 to 46 form an integral part of these consolidated financial statements.
M. R. Mehkari Dr. Bashir Ahmad Khan Lt. Gen. (R) Tahir Mahmood Lt. Gen. Javed Iqbal President & Chief Executive Director Director Chairman
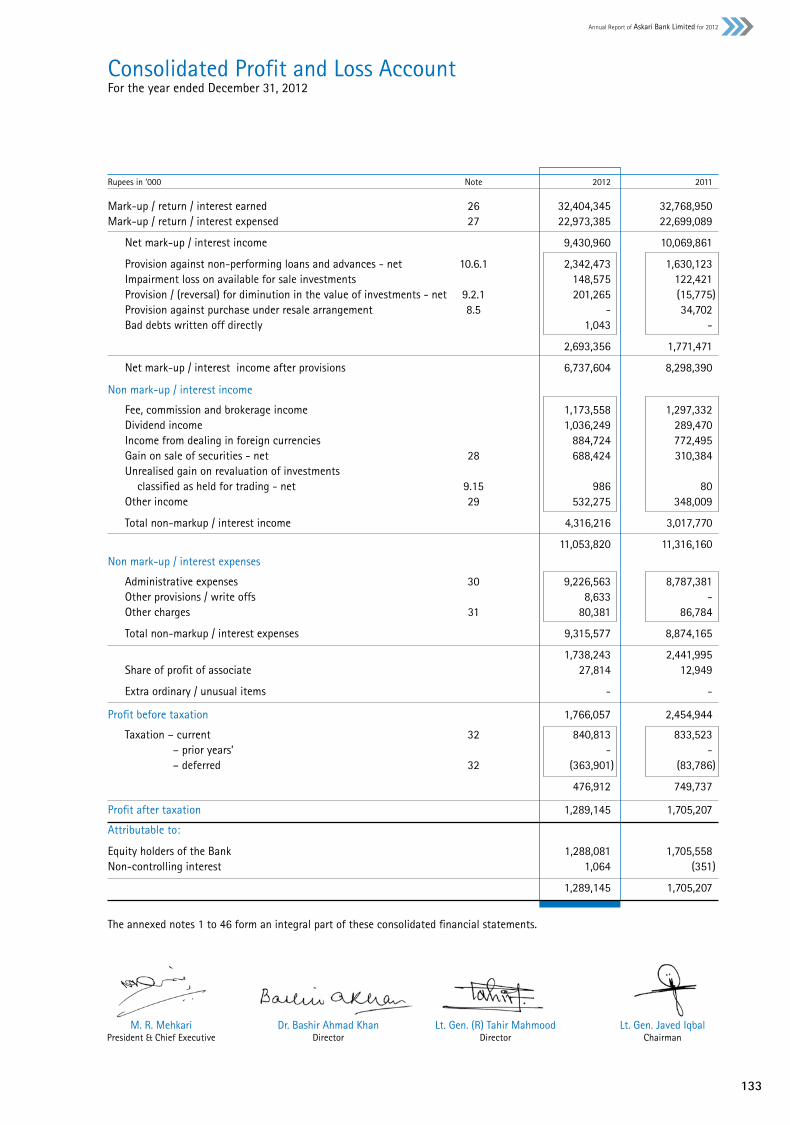
133
Annual Report of Askari Bank Limited for 2012
M. R. Mehkari Dr. Bashir Ahmad Khan Lt. Gen. (R) Tahir Mahmood Lt. Gen. Javed Iqbal President & Chief Executive Director Director Chairman
Rupees in ‘000 Note 2012 2011
Mark-up / return / interest earned 26 32,404,345 32,768,950 Mark-up / return / interest expensed 27 22,973,385 22,699,089
Net mark-up / interest income 9,430,960 10,069,861
Provision against non-performing loans and advances - net 10.6.1 2,342,473 1,630,123 Impairment loss on available for sale investments 148,575 122,421 Provision / (reversal) for diminution in the value of investments - net 9.2.1 201,265 (15,775) Provision against purchase under resale arrangement 8.5 - 34,702 Bad debts written off directly 1,043 -
2,693,356 1,771,471
Net mark-up / interest income after provisions 6,737,604 8,298,390
Non mark-up / interest income
Fee, commission and brokerage income 1,173,558 1,297,332 Dividend income 1,036,249 289,470 Income from dealing in foreign currencies 884,724 772,495 Gain on sale of securities - net 28 688,424 310,384 Unrealised gain on revaluation of investments classified as held for trading - net 9.15 986 80 Other income 29 532,275 348,009
Total non-markup / interest income 4,316,216 3,017,770
11,053,820 11,316,160 Non mark-up / interest expenses
Administrative expenses 30 9,226,563 8,787,381 Other provisions / write offs 8,633 - Other charges 31 80,381 86,784
Total non-markup / interest expenses 9,315,577 8,874,165
1,738,243 2,441,995 Share of profit of associate 27,814 12,949
Extra ordinary / unusual items - -
Profit before taxation 1,766,057 2,454,944
Taxation – current 32 840,813 833,523 – prior years’ - - – deferred 32 (363,901) (83,786)
476,912 749,737
Profit after taxation 1,289,145 1,705,207
Attributable to:
Equity holders of the Bank 1,288,081 1,705,558 Non-controlling interest 1,064 (351)
1,289,145 1,705,207
The annexed notes 1 to 46 form an integral part of these consolidated financial statements.
Consolidated Profit and Loss AccountFor the year ended December 31, 2012

134
M. R. Mehkari Dr. Bashir Ahmad Khan Lt. Gen. (R) Tahir Mahmood Lt. Gen. Javed Iqbal President & Chief Executive Director Director Chairman
Rupees in ‘000 2012 2011
Profit after taxation 1,289,145 1,705,207
Other comprehensive income
Effect of rescheduled / restructured classified
advances (94,085) 40,723
Effect of translation of net investment in
Wholesale Bank Branch 7,363 19,783
Total comprehensive income 1,202,423 1,765,713
Attributable to:
Equity holders of the Bank 1,201,359 1,766,064
Non-controlling interest 1,064 (351)
1,202,423 1,765,713
The annexed notes 1 to 46 form an integral part of these consolidated financial statements.
Consolidated Statement of Comprehensive IncomeFor the year ended December 31, 2012
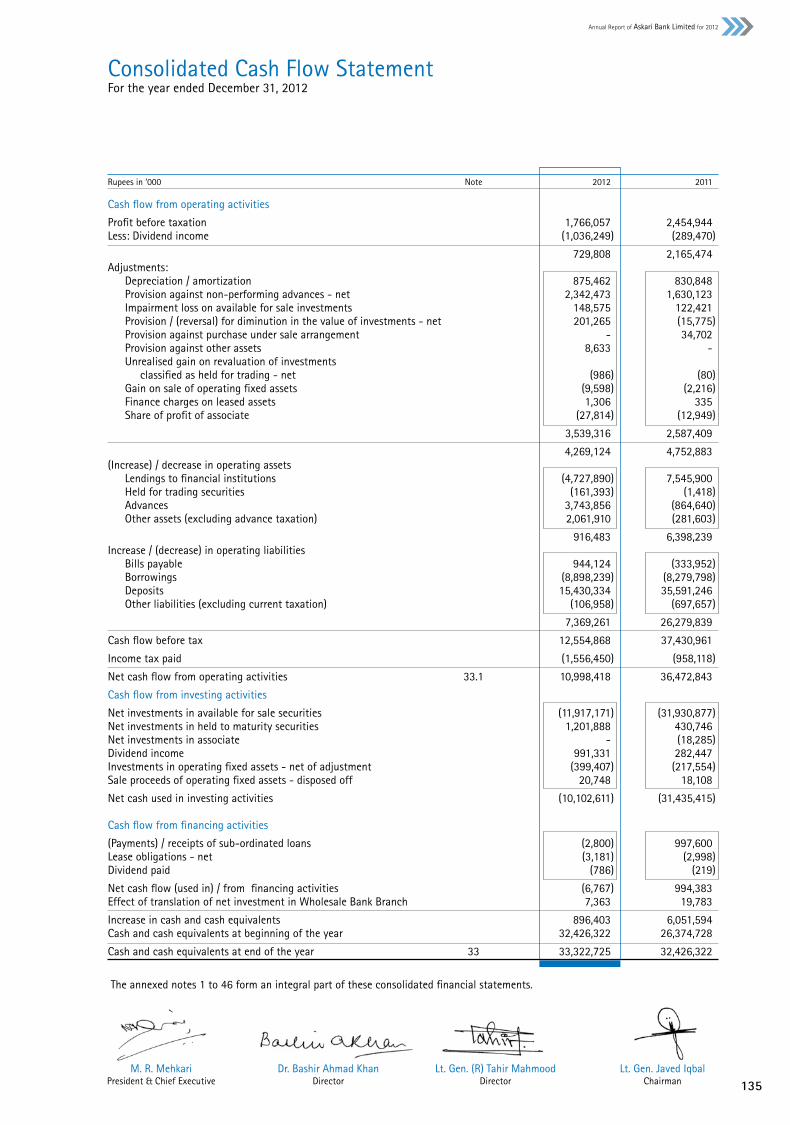
135
Annual Report of Askari Bank Limited for 2012
Rupees in ‘000 Note 2012 2011
Cash flow from operating activities
Profit before taxation 1,766,057 2,454,944 Less: Dividend income (1,036,249) (289,470)
729,808 2,165,474 Adjustments: Depreciation / amortization 875,462 830,848 Provision against non-performing advances - net 2,342,473 1,630,123 Impairment loss on available for sale investments 148,575 122,421 Provision / (reversal) for diminution in the value of investments - net 201,265 (15,775) Provision against purchase under sale arrangement - 34,702 Provision against other assets 8,633 - Unrealised gain on revaluation of investments classified as held for trading - net (986) (80) Gain on sale of operating fixed assets (9,598) (2,216) Finance charges on leased assets 1,306 335 Share of profit of associate (27,814) (12,949)
3,539,316 2,587,409
4,269,124 4,752,883 (Increase) / decrease in operating assets Lendings to financial institutions (4,727,890) 7,545,900 Held for trading securities (161,393) (1,418) Advances 3,743,856 (864,640) Other assets (excluding advance taxation) 2,061,910 (281,603)
916,483 6,398,239 Increase / (decrease) in operating liabilities Bills payable 944,124 (333,952) Borrowings (8,898,239) (8,279,798) Deposits 15,430,334 35,591,246 Other liabilities (excluding current taxation) (106,958) (697,657)
7,369,261 26,279,839
Cash flow before tax 12,554,868 37,430,961
Income tax paid (1,556,450) (958,118)
Net cash flow from operating activities 33.1 10,998,418 36,472,843
Cash flow from investing activities
Net investments in available for sale securities (11,917,171) (31,930,877)Net investments in held to maturity securities 1,201,888 430,746 Net investments in associate - (18,285)Dividend income 991,331 282,447 Investments in operating fixed assets - net of adjustment (399,407) (217,554)Sale proceeds of operating fixed assets - disposed off 20,748 18,108
Net cash used in investing activities (10,102,611) (31,435,415) Cash flow from financing activities
(Payments) / receipts of sub-ordinated loans (2,800) 997,600 Lease obligations - net (3,181) (2,998)Dividend paid (786) (219)
Net cash flow (used in) / from financing activities (6,767) 994,383 Effect of translation of net investment in Wholesale Bank Branch 7,363 19,783
Increase in cash and cash equivalents 896,403 6,051,594 Cash and cash equivalents at beginning of the year 32,426,322 26,374,728
Cash and cash equivalents at end of the year 33 33,322,725 32,426,322
The annexed notes 1 to 46 form an integral part of these consolidated financial statements.
Consolidated Cash Flow StatementFor the year ended December 31, 2012
M. R. Mehkari Dr. Bashir Ahmad Khan Lt. Gen. (R) Tahir Mahmood Lt. Gen. Javed Iqbal President & Chief Executive Director Director Chairman
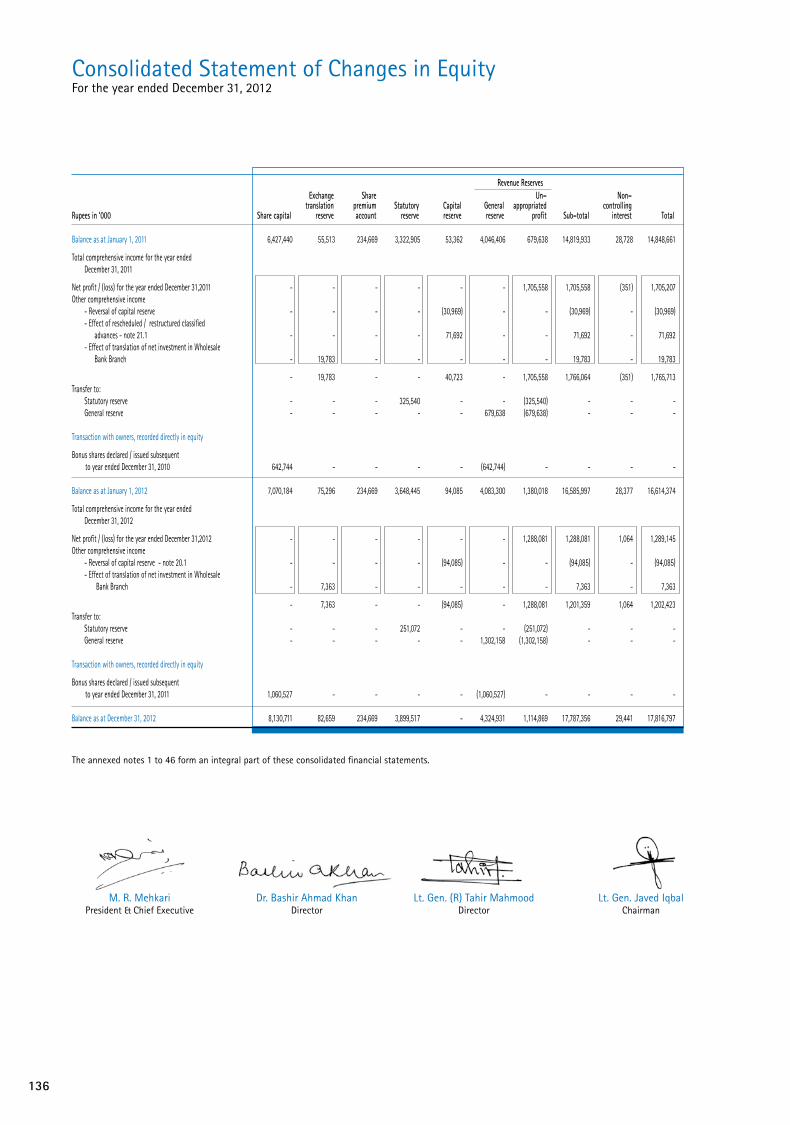
136
Revenue Reserves Exchange Share Un– Non– translation premium Statutory Capital General appropriated controlling Rupees in ‘000 Share capital reserve account reserve reserve reserve profit Sub–total interest Total Balance as at January 1, 2011 6,427,440 55,513 234,669 3,322,905 53,362 4,046,406 679,638 14,819,933 28,728 14,848,661
Total comprehensive income for the year ended December 31, 2011
Net profit / (loss) for the year ended December 31,2011 - - - - - - 1,705,558 1,705,558 (351) 1,705,207 Other comprehensive income - Reversal of capital reserve - - - - (30,969) - - (30,969) - (30,969) - Effect of rescheduled / restructured classified advances - note 21.1 - - - - 71,692 - - 71,692 - 71,692 - Effect of translation of net investment in Wholesale Bank Branch - 19,783 - - - - - 19,783 - 19,783
- 19,783 - - 40,723 - 1,705,558 1,766,064 (351) 1,765,713 Transfer to: Statutory reserve - - - 325,540 - - (325,540) - - - General reserve - - - - - 679,638 (679,638) - - - Transaction with owners, recorded directly in equity
Bonus shares declared / issued subsequent to year ended December 31, 2010 642,744 - - - - (642,744) - - - - Balance as at January 1, 2012 7,070,184 75,296 234,669 3,648,445 94,085 4,083,300 1,380,018 16,585,997 28,377 16,614,374
Total comprehensive income for the year ended December 31, 2012
Net profit / (loss) for the year ended December 31,2012 - - - - - - 1,288,081 1,288,081 1,064 1,289,145 Other comprehensive income - Reversal of capital reserve - note 20.1 - - - - (94,085) - - (94,085) - (94,085) - Effect of translation of net investment in Wholesale Bank Branch - 7,363 - - - - - 7,363 - 7,363
- 7,363 - - (94,085) - 1,288,081 1,201,359 1,064 1,202,423 Transfer to: Statutory reserve - - - 251,072 - - (251,072) - - - General reserve - - - - - 1,302,158 (1,302,158) - - - Transaction with owners, recorded directly in equity
Bonus shares declared / issued subsequent to year ended December 31, 2011 1,060,527 - - - - (1,060,527) - - - - Balance as at December 31, 2012 8,130,711 82,659 234,669 3,899,517 - 4,324,931 1,114,869 17,787,356 29,441 17,816,797
The annexed notes 1 to 46 form an integral part of these consolidated financial statements.
M. R. Mehkari Dr. Bashir Ahmad Khan Lt. Gen. (R) Tahir Mahmood Lt. Gen. Javed Iqbal President & Chief Executive Director Director Chairman
Consolidated Statement of Changes in EquityFor the year ended December 31, 2012

137
Annual Report of Askari Bank Limited for 2012
1. STATUS AND NATURE OF BUSINESS
1.1 The Group consists of Askari Bank Limited, the holding company, Askari Investment Management Limited, a wholly owned subsidiary company and Askari Securities Limited, a partly owned subsidiary company.
Askari Bank Limited (the Bank) was incorporated in Pakistan on October 09, 1991 as a Public Limited Company and is listed on the Karachi, Lahore and Islamabad Stock Exchanges. The registered office of the Bank is situated at AWT Plaza, The Mall, Rawalpindi.
The Bank obtained its business commencement certificate on February 26, 1992 and started operations from April 01, 1992. Army Welfare Trust (AWT) holds 50.57 % (2011: 50.57 %) of the Bank’s share capital at the year end. The Bank has 261 branches (2011: 245 branches); 260 in Pakistan and Azad Jammu and Kashmir, including 32 (2011: 31) Islamic Banking branches, 24 (2011: 21) sub-branches and a Wholesale Bank Branch in the Kingdom of Bahrain.
The Bank is a scheduled commercial bank and is principally engaged in the business of banking as defined in the Banking Companies Ordinance, 1962.
Askari Investment Management Limited (AIML) was incorporated in Pakistan on May 30, 2005 as a public limited company. AIML is a Non Banking Finance Company (NBFC), under license by the Securities and Exchange Commission of Pakistan (SECP) to undertake asset management and investment advisory services under the Non-Banking Finance Companies and Notified Entities Regulations, 2007 (NBFC & NE Regulations). The license was obtained on September 21, 2005. AIML is a wholly owned subsidiary of the Bank with its registered office in Islamabad. AIML obtained its certificate of commencement of business on September 22, 2005.
Askari Securities Limited (ASL) was incorporated in Pakistan on October 1, 1999 under the Companies Ordinance, 1984 as a public limited company. The Bank holds 74% Ordinary Shares of ASL. The principal activity includes share brokerage, investment advisory and consultancy services. The registered office of ASL is situated at ISE Towers, 55-B, Jinnah Avenue, Islamabad. The remaining 26% shares are held by AWT. Non-controlling interest as disclosed on consolidated statement of financial position represents AWT’s share in ASL which is the parent entity of the Bank.
The financial statements of AIML and ASL have been consolidated based on their audited financial statements for the year ended December 31, 2012.
1.2 Army Welfare Trust (AWT), the majority shareholder of the Bank as on the date of statement of financial position, has signed an agreement with Fauji Consortium; Fauji Foundation, Fauji Fertilizer Company Limited and Fauji Fertilizer Bin Qasim Limited for the sale of its entire shareholding in the Bank at a purchase price of Rs. 24.32 per share. The sale and purchase is subject to approval of the State Bank of Pakistan (SBP) and the Securities and Exchange Commission of Pakistan (SECP). Intimation to this effect was made by the Bank to the Stock Exchanges on February 07, 2013 and February 08, 2013.
1.3 SBP’s BSD Circular No. 7 dated April 15, 2009 sets out the minimum paid-up capital requirement (MCR) for banks to be raised to Rs. 10 billion in a phased manner by December 31, 2013. The required MCR (net of losses) as of December 31, 2012 is Rs. 9 billion. The paid-up capital of the Bank as of December 31, 2012 amounted to Rs. 8.13 billion, and thus remained short by Rs. 870 million of the prescribed level. As stated in note 1.2 above, the sale process of the Bank’s shareholding by AWT, also requires a public offer to be conducted under the Listed Companies (Substantial Acquisition of Voting Shares and Takeovers) Ordinance, 2002 read with Listed Companies (Substantial Acquisition of Voting Shares and Takeovers) Regulations, 2008. In terms of Regulation No. 7 of the said Regulations, and during the period stated therein, it is not possible for the Bank to issue any rights or bonus shares.
Based on the above, the management and the Board of Directors of the Bank, after taking into account that the Bank intends to meet the MCR as prescribed under the aforementioned SBP circular, have resolved that it is not possible to do so at present in view of the restriction imposed by Regulation No. 7 of the above stated Regulations. The Bank has also apprised the SBP and sought relaxation from meeting the minimum capital requirement of Rs. 9 billion for the year 2012.
1.4 As per Regulation 4 and Schedule I of NBFC Regulations, 2008 and SRO 764 of 2009 AIML is required to maintain minimum equity of Rs. 150 million and Rs. 200 million to undertake asset management services and Rs. 30 million for investment advisory services as on 31 December 2012 and 30 June 2013 respectively. AIML’s equity as at 31 December 2012 amounts to Rs. 160.32 million. AIML filed an application with Securities and Exchange Commission of Pakistan (SECP) on 24 December 2012 seeking extension in time to maintain minimum equity requirement. SECP in its letter dated 7 January 2013 granted extension of three months until 31 March 2013 to meet minimum equity requirement of Rs. 180 million.
2. BASIS OF PRESENTATION
2.1 These consolidated financial statements have been presented in accordance with the requirements of format prescribed by the SBP’s BSD Circular No. 4 dated February 17, 2006.
2.2 In accordance with the directives of the Federal Government regarding shifting of the banking system to Islamic modes, the SBP has issued various circulars from time to time. One permissible form of trade related mode of financing comprises of purchase of goods by the Group from its customers and resale to them at appropriate mark-up in price on a deferred payment basis. The purchases and sales arising under these arrangements are not reflected in these consolidated financial statements as such but are restricted to the amount of facilities actually utilized and the appropriate portion of mark-up thereon.
2.3 The financial results of the Islamic banking branches have been consolidated in these consolidated financial statements for reporting purposes, after eliminating material inter-branch transactions / balances. Key figures of the Islamic banking branches are disclosed in Annexure-2 to unconsolidated financial statements.
2.4 Items included in the consolidated financial statements are measured using the currency of the primary economic environment in which the Group operates. The consolidated financial statements are presented in Pak. Rupee, which is the Group’s functional currency. Figures have been rounded off to the nearest thousand of rupees unless otherwise stated.
Notes to the Consolidated Financial StatementsFor the year ended December 31, 2012

138
3. STATEMENT OF COMPLIANCE
These consolidated financial statements have been prepared in accordance with the approved accounting standards as applicable in Pakistan and the requirements of the Companies Ordinance, 1984 and the Banking Companies Ordinance, 1962. Approved accounting standards comprise of such International Financial Reporting Standards (IFRS) issued by the International Accounting Standard Board (IASB) and Islamic Financial Accounting Standards (IFAS) issued by the Institute of Chartered Accountants of Pakistan (ICAP) as are notified under the Companies Ordinance, 1984, provisions of and directives issued under the Companies Ordinance, 1984 and the Banking Companies Ordinance, 1962 and directives issued by the Securities and Exchange Commission of Pakistan and the State Bank of Pakistan. In case requirements differ, the provisions of and directives issued under the Companies Ordinance, 1984 and the Banking Companies Ordinance, 1962 and the directives issued by the SBP shall prevail.
International Accounting Standard 39, “Financial Instruments: Recognition and Measurement”, International Accounting Standard 40, “Investment Property” and International Financial Reporting Standard 7,”Financial Instruments: Disclosure” are not applicable to banking companies in Pakistan. Accordingly, the requirements of these Standards have not been considered in the preparation of these consolidated financial statements. However, investments have been classified and valued in accordance with the requirements prescribed by the SBP through various circulars.
Standards, interpretations and amendments to approved accounting standards that are not yet effective The following standards, amendments and interpretations of approved accounting standards will be effective for accounting
periods beginning after January 01, 2013:
- IAS 27 Separate Financial Statements (2011) - (effective for annual periods beginning on or after 1 January 2013). IAS 27 (2011) supersedes IAS 27 (2008). Three new standards IFRS 10 - Consolidated Financial Statements, IFRS 11- Joint Arrangements and IFRS 12- Disclosure of Interest in Other Entities dealing with IAS 27 would be applicable effective January 01, 2013. IAS 27 (2011) carries forward the existing accounting and disclosure requirements for separate financial statements, with some minor clarifications. The amendments are not expected to impact the current transactions of the Group.
- IAS 28 Investments in Associates and Joint Ventures (2011) - (effective for annual periods beginning on or after January 01, 2013). IAS 28 (2011) supersedes IAS 28 (2008). IAS 28 (2011) makes the amendments to apply IFRS 5 to an investment, or a portion of an investment, in an associate or a joint venture that meets the criteria to be classified as held for sale; and on cessation of significant influence or joint control, even if an investment in an associate becomes an investment in a joint venture. The amendments are not expected to impact the current transactions of the Group.
- IAS 19 Employee Benefits (amended 2011) - (effective for annual periods beginning on or after January 01, 2013). The amended IAS 19 includes the amendments that require actuarial gains and losses to be recognised immediately in other comprehensive income; this change will remove the corridor method and eliminate the ability for entities to recognise all changes in the defined benefit obligation and in plan assets in profit or loss, which currently is allowed under IAS 19; and that the expected return on plan assets recognised in profit or loss is calculated based on the rate used to discount the defined benefit obligation. Following this change, unrecognised actuarial loss of Rs. 134,706 thousand will be recorded immediately in other comprehensive income.
- Presentation of Items of Other Comprehensive Income (Amendments to IAS 1) - (effective for annual periods beginning on or after July 01, 2012). The amendments require that an entity present separately the items of other comprehensive income that would be reclassified to profit or loss in the future if certain conditions are met from those that would never be reclassified to profit or loss. The amendments do not address which items are presented in other comprehensive income or which items need to be reclassified. The requirements of other approved accounting standards continue to apply in this regard. The amendments are not expected to impact the current transactions of the Group.
- Offsetting Financial Assets and Financial Liabilities (Amendments to IAS 32) – (effective for annual periods beginning on or after January 01, 2014). The amendments address inconsistencies in current practice when applying the offsetting criteria in IAS 32 Financial Instruments: Presentation. The amendments clarify the meaning of ‘currently has a legally enforceable right of set-off’; and that some gross settlement systems may be considered equivalent to net settlement. The amendments are not expected to impact the current transactions of the Group.
- IFRIC 20 - Stripping cost in the production phase of a surface mining (effective for annual periods beginning on or after January 01, 2013). The interpretation requires production stripping cost in a surface mine to be capitalized if certain criteria are met. The amendments have no impact on the consolidated financial statements of the Group.
Annual Improvements 2009–2011 (effective for annual periods beginning on or after January 01, 2013). The new cycle of improvements contains amendments to the following standards, with consequential amendments to other standards and interpretations:
- IAS 1 Presentation of Financial Statements is amended to clarify that only one comparative period – which is the preceding period – is required for a complete set of financial statements. If an entity presents additional comparative information, then that additional information need not be in the form of a complete set of financial statements. However, such information should be accompanied by related notes and should be in accordance with IFRS. Furthermore, it clarifies that the ‘third statement of financial position’ is only required if the effect of restatement is material to statement of financial position.
- IAS 16 Property, Plant and Equipment is amended to clarify the accounting of spare parts, stand-by equipment and servicing equipment. The definition of ‘property, plant and equipment’ in IAS 16 is now considered in determining whether these items should be accounted for under that standard. If these items do not meet the definition, then they are accounted for using IAS 2 Inventories. The amendments have no impact on financial statements of the Group.
Notes to the Consolidated Financial StatementsFor the year ended December 31, 2012

139
Annual Report of Askari Bank Limited for 2012
- IAS 32 Financial Instruments: Presentation - is amended to clarify that IAS 12 Income Taxes applies to the accounting for income taxes relating to distributions to holders of an equity instrument and transaction costs of an equity transaction. The amendment removes a perceived inconsistency between IAS 32 and IAS 12.
- IAS 34 Interim Financial Reporting is amended to align the disclosure requirements for segment assets and segment liabilities in interim financial reports with those in IFRS 8 Operating Segments. IAS 34 now requires the disclosure of a measure of total assets and liabilities for a particular reportable segment. In addition, such disclosure is only required when the amount is regularly provided to the chief operating decision maker and there has been a material change from the amount disclosed in the last annual financial statements for that reportable segment. The amendments have no impact on financial statements of the Group.
4. BASIS OF MEASUREMENT
These consolidated financial statements have been prepared under the historical cost convention as modified for certain investments which are carried at fair value, freehold and leasehold land which are shown at revalued amounts and staff retirement gratuity and compensated absences which are carried at present value of defined benefit obligations net of fair value of plan assets and unrecognised actuarial losses.
Use of critical accounting estimates and judgments The preparation of consolidated financial statements in conformity with approved accounting standards as applicable in
Pakistan requires the use of certain accounting estimates. It also requires management to exercise its judgment in the process of applying the Group’s accounting policies. The Group uses estimates and assumptions concerning the future. The resulting accounting estimate will, by definition, seldom equal the related actual results. Estimates and judgments are continually evaluated and are based on historical experience and other factors, including expectations of future events that are believed to be reasonable under the circumstances. The areas involving a higher degree of judgment or complexity, or areas where assumptions and estimates are significant to the financial statements are as follows:
i) classification of investments (note 5.4) ii) provision against investments (note 5.4), advances (note 5.5) and other assets (note 5.7) iii) valuation and impairment of available for sale securities (note 5.4) iv) useful life of property and equipments, intangible assets and revaluation of land (note 5.6) v) taxation (note 5.9) vi) staff retirement benefits (note 5.10)
5. SUMMARY OF SIGNIFICANT ACCOUNTING POLICIES
5.1 Basis of consolidation Subsidiaries The consolidated financial statements include the financial statements of the Bank and its subsidiary companies, AIML with
100% holding (2011: 100%) and ASL with 74% holding (2011: 74%) collectively referred to as “the Group”.
Subsidiaries are those enterprises in which the holding company directly or indirectly controls, beneficially owns or holds more than 50% of the voting securities or otherwise has the power to elect and appoint more than 50% of its directors. The financial statements of the subsidiaries are included in the consolidated financial statements from the date control commences until the date that control ceases.
The assets and liabilities of subsidiary companies have been consolidated on a line by line basis and the carrying value of investment held by the holding company is eliminated against holding company’s share in paid up capital of the subsidiaries.
Material intra-group balances and transactions have been eliminated.
Non-controlling interests are that part of net results of the operations and of net assets of the subsidiary attributable to interests which are not owned by the Bank. Non-controlling interests are presented as separate item in the consolidated financial statements.
Associate Associate is the entity in which the Group has significant influence, but not control over the financial and operating
policies. Significant influence exists when the Group holds between 20 to 50 percent of the voting power of another entity. The consolidated financial statements include the Group’s share of the results of the associate. Investment in associate is accounted for using equity method of accounting and was initially recognized at cost.
5.2 Cash and cash equivalents Cash and cash equivalents comprise of cash and balances with treasury banks, balances with other banks, call money
lendings and term deposits with other banks .
5.3 Sale and repurchase agreements Securities sold under repurchase agreement (repo) are retained in the consolidated financial statements as investments
and a liability for consideration received is included in borrowings. Conversely, consideration for securities purchased under resale agreement (reverse repo) are included in lendings to financial institutions. The difference between sale and repurchase / purchase and resale price is recognised as mark-up / return expensed and earned on a time proportion basis as the case may be. Repo and reverse repo balances are reflected under borrowings from and lendings to financial institutions respectively.

140
5.4 Investments Investments are classified as follows:
Held for trading These represent securities acquired with the intention to trade by taking advantage of short-term market / interest rate
movements. These are marked to market and surplus / deficit arising on revaluation of ‘held for trading’ investments is taken to profit and loss account in accordance with the requirements prescribed by the SBP through various circulars.
Available for sale These represent securities which do not fall under ‘held for trading’ or ‘held to maturity’ categories. In accordance with the
requirements of the SBP’s BSD Circular No. 20 dated August 04, 2000, available for sale securities for which ready quotations are available on Reuters Page (PKRV) or Stock Exchanges are valued at market value and the resulting surplus / deficit is kept in a separate account and is shown below the shareholders’ equity in the consolidated statement of financial position. Where the decline in prices of available for sale equity securities is significant or prolonged, it is considered impaired and included in the consolidated profit and loss account. Impairment loss on available for sale debt securities is determined in accordance with the requirements of Prudential Regulations issued by the SBP.
Unquoted equity securities are valued at cost less impairment, if any. Impairment is included in the consolidated profit and loss account.
Unquoted debt securities are valued using the market value of secondary market where available.
Investments in other unquoted securities are valued at cost less impairment losses, determined in accordance with the requirements of Prudential Regulations issued by the SBP.
Held to maturity These represent securities acquired with the intention and ability to hold them upto maturity. These are carried at amortized
cost less impairment, determined in accordance with the requirements of Prudential Regulations issued by the SBP.
All purchases and sale of investment that require delivery within the time frame established by regulations or market convention are recognized at the trade date, which is the date the Group commits to purchase or sell the investments.
5.5 Advances Advances are stated net of provisions for non-performing advances. Provision for advances is determined in accordance
with the requirements of the Prudential Regulations issued by the SBP from time to time. In addition, a general provision is maintained for advances other than consumer advances as per details given in note 10.6.4.
The provisions against non-performing advances are charged to the consolidated profit and loss account. Advances are written off when there is no realistic prospect of recovery.
The SBP has notified for adoption of “Islamic Financial Accounting Standard 2 Ijarah” (IFAS-2) which is applicable for accounting period beginning on or after January 01, 2009. Consequent to the adoption of IFAS-2, such Ijarahs booked on or after January 01, 2009 are stated at cost less accumulated depreciation and impairment if any, and are shown under advances.
Leases where the Group transfers substantially all the risks and rewards incidental to ownership of an asset to the lessee are classified as finance leases. A receivable is recognised at an amount equal to the present value of the lease payments including any guaranteed residual value. Finance lease receivables are included in advances to the customers.
The rentals received / receivable on above Ijarahs are recorded as income / revenue. Depreciation on Ijarah assets is charged to the consolidated profit and loss account by applying the straight line method whereby the depreciable value of Ijarah assets is written off over the Ijarah period. The Group charges depreciation from the date of delivery of respective assets to Mustajir upto the date of maturity / termination of Ijarah agreement.
5.6 Capital work-in-progress, operating fixed assets and depreciation
Capital work-in-progress Capital work-in-progress is stated at cost less impairment losses, if any.
Owned assets Fixed assets are stated at cost less impairment losses and accumulated depreciation except for freehold / leasehold land.
Land is carried at revalued amounts which is not depreciated.
Land is revalued by professionally qualified valuers with sufficient regularity to ensure that the net carrying amount does not differ materially from their fair value. Surplus / (deficit) arising on revaluation of fixed assets is credited / (debited) to the surplus on revaluation of assets account and is shown below the shareholders’ equity in the consolidated statement of financial position. Except to the extent actually realised on disposal of land which are revalued, the surplus on revaluation of land shall not be applied to set-off or reduce any deficit or loss, whether past, current or future, or in any manner applied, adjusted or treated so as to add to the income, profit or surplus of the Group or utilized directly or indirectly by way of dividend or issue of bonus shares.
Intangible assets Intangible assets are carried at cost less accumulated amortization and impairment losses, if any.
Trading Right Entitlement Certificates (TREC) has indefinite useful life and accordingly is not amortized however tested for impairment only. Impairment loss is recognized in profit and loss account.
Notes to the Consolidated Financial StatementsFor the year ended December 31, 2012

141
Annual Report of Askari Bank Limited for 2012
Depreciation / amortization Depreciation / amortization is computed over the estimated useful lives of the related assets at the rates set out in note 11.2.
The cost of assets is depreciated / amortized on the diminishing balance method, except for vehicles, carpets, renovations, other assets and intangibles which are depreciated / amortized on a straight line basis. Depreciation / amortization is charged for the full month of purchase / acquisition / availability for use of an asset while no depreciation / amortization is charged in the month of disposal of an asset. Maintenance and normal repairs are charged to the consolidated profit and loss account as and when incurred. Major renewals and improvements are capitalized. Gains and losses on disposal of operating fixed assets are taken to the consolidated profit and loss account.
In making estimates of the depreciation / amortization, the management uses useful life and residual value which reflects the pattern in which economic benefits are expected to be consumed by the Group. The useful life and the residual value are reviewed at each financial year end and any change in these estimates in future years might effect the carrying amounts of the respective item of operating fixed assets with the corresponding effect on depreciation / amortization charge.
Assets subject to finance lease Assets held under finance lease are accounted for by recording the assets and related liabilities at the amounts determined
on the basis of lower of fair value of the assets and the present value of minimum lease payments. Finance charge is allocated to the accounting periods in a manner so as to provide a constant periodic rate of charge on the outstanding liability. Depreciation is charged on leased assets on the basis similar to that of the owned assets.
5.7 Impairment The carrying amount of the Group’s assets are reviewed at the date of consolidated statement of financial position to
determine whether there is any indication of impairment. If such indications exist, the asset’s recoverable amount is estimated in order to determine the extent of the impairment loss, if any. Impairment loss is recognised as expense in the consolidated profit and loss account. An impairment loss is reversed only to the extent that the asset’s carrying amount does not exceed the carrying amount that would have been determined, net of depreciation or amortisation, if no impairment loss had been recognised.
5.8 Deposits Deposits are recorded at the amount of proceeds received. Mark-up accrued on deposits is recognised separately as part of
other liabilities and is charged to consolidated profit and loss account on a time proportion basis.
5.9 Taxation Income tax on the consolidated profit or loss for the year comprises current and deferred tax. Income tax is recognised in the
consolidated profit and loss account, except to the extent that it relates to items recognised directly in other comprehensive income or below equity, in which case it is recognised in other comprehensive income or below equity.
Current Provision for current tax is the expected tax payable on the taxable profit for the year using tax rates applicable at the date
of consolidated statement of financial position and any adjustment to tax payable for previous years.
Deferred
Deferred tax is provided for by using the balance sheet liability method, providing for temporary differences between the carrying amounts of assets and liabilities for financial reporting purposes and the amount used for taxation purposes. The amount of deferred tax provided is based on the expected manner of realization or settlement of the carrying amount of assets and liabilities using tax rates enacted or substantially enacted at the date of consolidated statement of financial position. A deferred tax asset is recognised only to the extent that it is probable that the future taxable profit will be available and credits can be utilized. Deferred tax assets are reduced to the extent it is no longer probable that the related tax benefit will be realised.
Deferred tax, on revaluation of investments, if any, is recognised as an adjustment to surplus / (deficit) arising on such revaluation.
5.10 Staff retirement benefits Defined benefit plan The Bank and ASL operate an approved funded gratuity scheme for all its regular employees. Contributions are made in
accordance with the actuarial recommendation. The actuarial valuation is carried out periodically using “Projected Unit Credit Method”. The actuarial gains / losses in excess of corridor limit (10% of higher of present value of obligation and fair value of plan assets) are recognized over the expected remaining working life of their employees.
AIML was operating a funded gratuity plan, for all eligible employees who have completed the specified minimum qualifying period of service. As per the Board Resolution dated November 26, 2012, the Company has discontinued “Defined benefit scheme” by deciding to discontinue gratuity scheme. Employees are duly compensated with change in their gross salary structure.
Accordingly, contribution to gratuity ceased with effect from November 30, 2012. To avoid retrospective effect the current applicable amounts have been frozen in individual employee’s name till November 30, 2012. The frozen amount will become payable to employee when they leave AIML and on completion of qualifying period of three years of employment with AIML. AIML has taken a conservative approach by providing for the amounts till November 30, 2012 (assuming that all employees will complete their qualifying period).
Defined contribution plan The Bank operates a recognised provident fund scheme for all its regular employees for which equal monthly contributions
are made both by the Bank and by the employees at the rate of 8.33% of the basic salary of the employee.
142
AIML operates a funded staff provident fund scheme as a defined contribution plan for all eligible employees. Equal monthly contributions are made by AIML and the staff at the rate of 6% of the salary.
ASL operates funded provident fund scheme for all its regular employees for which equal monthly contributions are made by ASL and the employees at the rate of 10% of basic salary of the employee.
Compensated absences The Bank and ASL provide compensated absences to all its regular employees. Liability for unfunded scheme is recognized
on the basis of actuarial valuation using the “Projected Unit Credit Method”. Provision for the year is charged to the consolidated profit and loss account. The amount recognised in the consolidated statement of financial position represents the present value of defined benefit obligations.
AIML was providing compensated absences to all its regular employees. During the year as per the Board resolution dated November 26, 2012 the compensated absences will not be encashable after December 31, 2012. All employees will have to avail leaves within a period of two years from the date of entitlement of leaves.
5.11 Revenue recognition Mark-up / interest on advances and return on investments is recognised on accrual basis except on classified advances and
investments which is recognized on receipt basis. Mark-up / interest on rescheduled / restructured advances and investments is recognised as permitted by the regulations of the SBP or overseas regulatory authority of the country where branch operates, except where in the opinion of the management it would not be prudent to do so.
Fees, commission and brokerage income is recognised at the time of performance of service.
Dividend income is recognised when the Group’s right to receive the income is established.
Gains and losses on sale of investments are included in income currently.
Financing method is used in accounting for income from lease financing. Under this method, the unearned lease income (excess of the sum of the total lease rentals and estimated residual value over the cost of leased assets) is deferred and taken to income over the term of the lease period so as to produce a constant periodic rate of return on the outstanding net investment in lease. Repossessed vehicles on account of loan default are recorded in memorandum account.
Unrealised lease income is suspended on classified leases, in accordance with the requirements of the Prudential Regulations issued by the SBP. Gains / losses on termination of lease contracts, documentation charges, front-end fees and other lease income are recognised as income on receipt basis.
Murabaha transactions are reflected as receivable at the invoiced amount. Actual sale and purchase are not reflected as the goods are purchased by the customer as agent of the Group and all documents relating to purchase are in customers’ name. However, the profit on that sale not due for the payment is deferred by recording a credit to the “Deferred Murabaha Income” account.
Profits on Diminishing Musharaka financings are recognised on accrual basis.
Consistent with prior years, profit required to be suspended in compliance with the Prudential Regulations issued by the SBP is recorded on receipt basis.
5.12 Foreign currencies Foreign currency transactions Foreign currency transactions are translated into Pak. Rupee at the exchange rates prevailing on the date of transaction.
Monetary assets and liabilities in foreign currencies are translated to Pak. Rupee at the exchange rates prevailing at the date of consolidated statement of financial position. Outstanding foreign bills purchased are valued at the rates applicable to the remaining maturities. Exchange gains and losses are included in consolidated profit and loss account currently.
Foreign operation The assets and liabilities of Wholesale Bank Branch are translated to Pak. Rupee at exchange rates prevailing at the date of
consolidated statement of financial position. The results of foreign operations are translated at the average rate of exchange for the year.
Translation gains and losses Translation gains and losses arising on revaluation of net investment in foreign operations are taken to equity under
“Exchange Translation Reserve” through other comprehensive income and on disposal are recognised in consolidated profit and loss account.
Commitments Commitments for outstanding forward foreign exchange contracts are valued at the rates applicable to the remaining
maturities.5.13 Provisions Provisions are recognised when there are present, legal or constructive obligations as a result of past events, it is probable
that an out flow of resources embodying economic benefits will be required to settle the obligation and a reliable estimate of the amounts can be made. Provision for guarantee claims and other off balance sheet obligations is recognized when intimated and reasonable certainty exists to settle the obligations. Expected recoveries are recognized by debiting customer accounts. Charge to consolidated profit and loss account is stated net off expected recoveries.
5.14 Off-setting Financial assets and financial liabilities are only set-off and the net amount is reported in the consolidated financial
statements when there is a legally enforceable right to set-off the recognised amount and the Group intends either to settle on a net basis, or to realise the assets and to settle the liabilities simultaneously.
Notes to the Consolidated Financial StatementsFor the year ended December 31, 2012

143
Annual Report of Askari Bank Limited for 2012
5.15 Financial assets and liabilities Financial assets and financial liabilities are recognised at the time when the Bank becomes a party to the contractual
provision of the instrument. Financial assets are de-recognised when the contractual right to future cash flows from the asset expires or is transferred along with the risk and reward of the asset. Financial liabilities are de-recognised when obligation specific in the contract discharge, cancel or expire. Any gain or loss on de-recognition of the financial asset and liability is recognised in the profit and loss account of the current period. The particular recognition and subsequent measurement methods adopted for significant financial assets and financial liabilities are disclosed in the individual policy statements associated with them.
5.16 Derivative financial instruments Derivative financial instruments are initially recognized at fair value on the date on which the derivative contract is
entered into and are subsequently re–measured at fair value using appropriate valuation techniques. All derivative financial instruments are carried as assets when fair value is positive and liabilities when fair value is negative. Any change in the fair value of derivative financial instruments is taken to the consolidated profit and loss account.
5.17 Appropriations subsequent to date of consolidated statement of financial position Appropriations subsequent to year end are recognised during the year in which those appropriations are made.
5.18 Segment reporting A segment is a distinguishable component of the Group that is engaged in providing products or services (business segment)
or in providing product or services within a particular economic environment (geographical segment), which is subject to risks and rewards that are different from those of other segments. The Group’s primary format of reporting is based on business segments.
5.18.1 Business segment Corporate finance Corporate financing includes corporate and investment banking activities such as mergers and acquisition, underwriting,
privatization, securitisation, IPO’s related activities and secondary private placements.
Trading and Sales Trading and sales includes the Group’s treasury and money market activities.
Retail Banking Retail banking segment provides services to small borrowers and include loans, deposits and other transactions with retail
customers and credit card business.
Commercial Banking Commercial banking segment provides services related to project finance, export finance, trade finance, leasing, lending,
guarantees, bills of exchange and deposits from corporate customers.
Payment and settlement Payment and settlement includes income from payments and collections, funds transfer, clearing and settlement.
Agency services Agency services include income from rent of lockers provided to customers.
Retail brokerage Retail brokerage segment provides share brokerage, share trading and corporate advisory services.
Asset management Asset management segment represents wealth management, cash management and fund management services
Sub-ordinated loans It represents Term Finance Certificates issued by the Group.
5.18.2 Geographical segments The Group operates in two geographic regions; Pakistan and the Middle East.
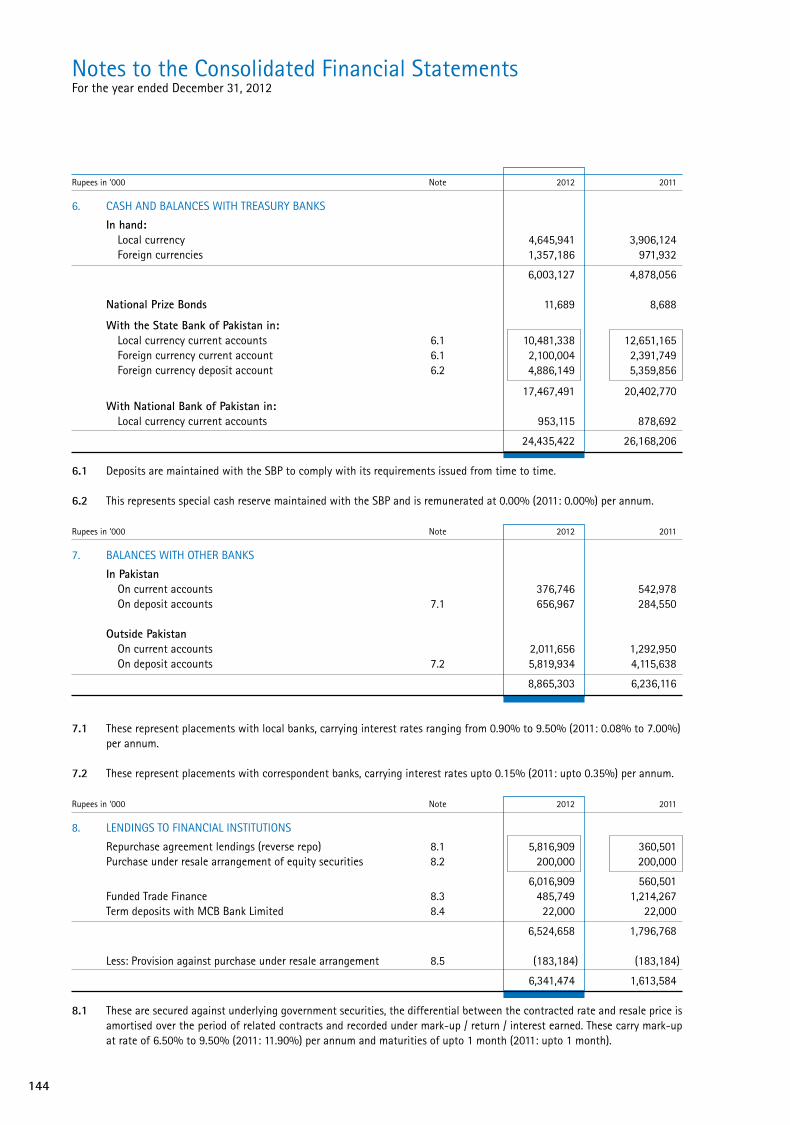
144
Rupees in ‘000 Note 2012 2011
6. CASH AND BALANCES WITH TREASURY BANKS
In hand: Local currency 4,645,941 3,906,124 Foreign currencies 1,357,186 971,932
6,003,127 4,878,056 National Prize Bonds 11,689 8,688
With the State Bank of Pakistan in: Local currency current accounts 6.1 10,481,338 12,651,165 Foreign currency current account 6.1 2,100,004 2,391,749 Foreign currency deposit account 6.2 4,886,149 5,359,856
17,467,491 20,402,770 With National Bank of Pakistan in: Local currency current accounts 953,115 878,692
24,435,422 26,168,206 6.1 Deposits are maintained with the SBP to comply with its requirements issued from time to time.
6.2 This represents special cash reserve maintained with the SBP and is remunerated at 0.00% (2011: 0.00%) per annum. Rupees in ‘000 Note 2012 2011
7. BALANCES WITH OTHER BANKS
In Pakistan On current accounts 376,746 542,978 On deposit accounts 7.1 656,967 284,550 Outside Pakistan On current accounts 2,011,656 1,292,950 On deposit accounts 7.2 5,819,934 4,115,638
8,865,303 6,236,116 7.1 These represent placements with local banks, carrying interest rates ranging from 0.90% to 9.50% (2011: 0.08% to 7.00%)
per annum. 7.2 These represent placements with correspondent banks, carrying interest rates upto 0.15% (2011: upto 0.35%) per annum. Rupees in ‘000 Note 2012 2011
8. LENDINGS TO FINANCIAL INSTITUTIONS
Repurchase agreement lendings (reverse repo) 8.1 5,816,909 360,501 Purchase under resale arrangement of equity securities 8.2 200,000 200,000
6,016,909 560,501 Funded Trade Finance 8.3 485,749 1,214,267 Term deposits with MCB Bank Limited 8.4 22,000 22,000
6,524,658 1,796,768 Less: Provision against purchase under resale arrangement 8.5 (183,184) (183,184)
6,341,474 1,613,584 8.1 These are secured against underlying government securities, the differential between the contracted rate and resale price is
amortised over the period of related contracts and recorded under mark-up / return / interest earned. These carry mark-up at rate of 6.50% to 9.50% (2011: 11.90%) per annum and maturities of upto 1 month (2011: upto 1 month).
Notes to the Consolidated Financial StatementsFor the year ended December 31, 2012

145
Annual Report of Askari Bank Limited for 2012
8.2 These represent shares of companies purchased under resale agreement and carried mark-up at 18.01% (2011: 18.01%) per annum.
8.3 These represent finance provided by Wholesale Bank Branch to Bank of Ceylon, Sri Lanka at mark-up rate of 2.06 % (2011: 2.01% to 2.03%) per annum with maturities of upto January 2013 and July 2013 (2011: upto April 2012 and December 2012).
8.4 Term deposit represents 6 months deposit (2011: 3 months) maturing on February 16, 2013 (2011: February 10, 2012). This term deposit carries mark-up at 8.65% (2011: 10.3%) per annum. Term deposit is under lien with MCB Bank Limited against the running finance facility under mark-up basis.
Rupees in ‘000 2012 2011
8.5 Particulars of provision against purchase under resale arrangement
Opening balance 183,184 148,482 Charge for the year - 34,702
Closing balance 183,184 183,184 8.6 Particulars of lending In local currency 6,038,909 582,501 In foreign currencies 485,749 1,214,267
6,524,658 1,796,768 2012 2011
Further Further Held by given as Held by given asRupees in ‘000 the Bank collateral Total the Bank collateral Total
8.7 Securities held as collateral against lendings to financial institutions
Market Treasury Bills 5,666,972 – 5,666,972 360,501 – 360,501 Pakistan Investment Bonds 149,937 – 149,937 – – – Purchase under resale arrangement of listed shares 200,000 – 200,000 200,000 – 200,000
6,016,909 – 6,016,909 560,501 – 560,501 Market value of securities held as collateral is Rs. 5,854,838 thousand (2011: Rs. 377,645 thousand).

146
9. INVESTMENTS 2012 2011
Held by Given as Held by Given asRupees in ‘000 Note the Bank collateral Total the Bank collateral Total
9.1 Investments by types Held for trading securities
Fully paid ordinary shares 151,674 - 151,674 1,491 - 1,491
Units of open end mutual funds 9.4 56,201 - 56,201 44,911 - 44,911
207,875 - 207,875 46,402 - 46,402
Available for sale securities
Market Treasury Bills 9.16 98,661,356 - 98,661,356 85,163,963 7,933,076 93,097,039
Pakistan Investment Bonds 9.16 22,098,414 - 22,098,414 18,760,393 36,602 18,796,995
Fully paid ordinary shares / units 2,520,257 - 2,520,257 1,637,867 - 1,637,867
Units of open end mutual funds 9.4 1,708,814 - 1,708,814 1,574,714 - 1,574,714
Fully paid preference shares 9.6 233,324 - 233,324 67,000 - 67,000
Term Finance Certificates 5,328,870 - 5,328,870 4,908,959 - 4,908,959
National Investment Trust (NIT) Units 864,395 - 864,395 372,762 - 372,762
Sukuk Certificates 9.9 8,928,672 - 8,928,672 8,150,281 - 8,150,281
Government of Pakistan Euro Bonds 9.10 1,037,900 - 1,037,900 948,612 - 948,612
Foreign securities 9.11 49,328 - 49,328 133,555 - 133,555
141,431,330 - 141,431,330 121,718,106 7,969,678 129,687,784
Held to maturity securities
Term Finance Certificates 116,348 - 116,348 523,726 - 523,726
Pakistan Investment Bonds 9.16 742,377 - 742,377 1,070,676 - 1,070,676
Government of Pakistan Euro Bonds 9.2.4 1,155,746 - 1,155,746 1,038,061 - 1,038,061
Sukuk Certificates 9.13 1,594,167 - 1,594,167 1,728,334 - 1,728,334
Credit Linked Notes - - - 449,729 - 449,729
3,608,638 - 3,608,638 4,810,526 - 4,810,526
Investment in associate
Askari General Insurance Company Limited 9.12 132,481 - 132,481 104,667 - 104,667
Investment at cost 145,380,324 - 145,380,324 126,679,701 7,969,678 134,649,379
Provision for diminution in value of investments 9.2.1 (508,994) - (508,994) (332,778) - (332,778)
Investments (net of provision) 144,871,330 - 144,871,330 126,346,923 7,969,678 134,316,601
Unrealised gain on revaluation of
held for trading securities - net 9.15 986 - 986 80 - 80
Surplus / (deficit) on revaluation of
available for sale securities - net 481,937 - 481,937 (665,819) 4,525 (661,294)
Total investments 145,354,253 - 145,354,253 125,681,184 7,974,203 133,655,387
Market value of held to maturity securities as at December 31, 2012 is Rs. 3,609,976 thousand (2011: Rs. 4,605,207 thousand).
Notes to the Consolidated Financial StatementsFor the year ended December 31, 2012

147
Annual Report of Askari Bank Limited for 2012
Rupees in ‘000 2012 2011
9.2 Investments by segments Federal Government Securities 9.2.3 Market Treasury Bills 98,661,356 93,097,039 Pakistan Investment Bonds 22,840,791 19,867,671 Government of Pakistan Euro Bonds 9.2.4 2,193,646 1,986,673 Sukuk Certificates 9,282,712 8,300,000
132,978,505 123,251,383 Fully paid up ordinary shares / units Listed companies / funds 9.3 2,798,732 1,688,345 Unlisted companies 9.5 5,680 55,680
2,804,412 1,744,025 Units of open end mutual funds 9.4 1,765,015 1,619,625 Fully paid preference shares Listed companies 9.6 208,324 42,000 Unlisted companies 9.6 25,000 25,000 Term Finance Certificates 9.7 Listed Term Finance Certificates 2,343,871 2,529,589 Unlisted Term Finance Certificates 3,101,347 2,903,096 5,445,218 5,432,685 Foreign Securities Mena Transformation Fund 9.11 49,328 133,555 Credit Linked Notes - 449,729 49,328 583,284 Other Investments Sukuk Certificates 1,240,127 1,578,615 National Investment Trust (NIT) - Units 864,395 372,762
2,104,522 1,951,377
Total investment at cost 145,380,324 134,649,379 Provision for diminution in value of investments 9.2.1 (508,994) (332,779)
Investments - net of provisions 144,871,330 134,316,600 Unrealised gain on revaluation of held for trading securities - net 9.15 986 80 Surplus / (deficit) on revaluation of available for sale securities - net 481,937 (661,294) Total investments 145,354,253 133,655,386 9.2.1 Particulars of provision for diminution in value of investments Opening balance 332,779 348,554 Charge for the year 201,265 - Reversal of provision during the year (25,050) (15,775)
Closing balance 508,994 332,779 9.2.2 Particulars of provision in respect of type and segment Available for sale securities Fully paid ordinary shares - unlisted 5,680 5,680 Preference shares - unlisted 25,000 27,550 Term finance certificates 236,026 102,728 Sukuk certificates 242,288 174,320 Held to maturity securities Term finance certificates - 22,500
508,994 332,778

148
Notes to the Consolidated Financial StatementsFor the year ended December 31, 2012
9.3 Investments in listed companies shares / units Average cost/ No. of book value ordinary shares / units per share/unit Note 2012 2011
2012 2011 Rupees Name of companies / mutual funds Rupees in ‘000 2012
300,000 306,827 67.79 Adamjee Insurance Company Limited 20,336 17,523 14,489,931 - 32.67 Agritech Limited 9.3.1 473,343 - 675,772 611 67.32 Allied Bank Limited 45,491 37 8,795,384 8,376,556 15.06 Askari General Insurance Company Limited 9.12 132,481 104,667 6,504,096 13,100 7.21 Atlas Fund of Funds 46,891 79 - 914 - Attock Cement Pakistan Limited - 48 120,000 310 436.63 Attock Petroleum Limited 52,395 118 - 7,581,585 - Azgard Nine Limited - 26,959 7,697,900 6,411 16.84 Bank Alfalah Limited 129,636 69 1,352,000 - 32.06 Bank Al Habib Limited 43,346 - 532,000 - 9.35 Bank Islami Pakistan 4,973 - 325,000 - 111.57 Habib Bank Limited 36,261 - 3,000,000 - 7.87 JS Growth Fund 23,614 - 1,873,500 1,772,402 54.33 D. G. Khan Cement Company Limited 101,785 41,717 - 867,000 - Engro Chemical (Pakistan) Limited - 100,204 1,251,500 - 89.92 Engro Corporation Limited 112,531 - 1,000,000 - 9.51 Engro Ploymer Limited 9,513 - - 610,500 - Fauji Fertilizer Company Limited - 99,395 - 677,710 - Golden Arrow Selected Stock Fund - 2,196 2,600,000 2,600,000 37.97 Hub Power Company Limited 98,721 99,308 - 336,252 - ICI Pakistan Limited - 49,901 20,000 4,110,064 4.00 Jahangir Siddiqui and Company Limited 80 21,003 2,100,000 2,248,380 44.23 Kot Addu Power Company Limited 92,887 98,921 - 10,000 - Lotte Pakistan Pta Limited - 154 400,000 582,507 173.07 MCB Bank Limited 69,229 97,363 6,537,034 24,034 9.32 Meezan Balanced Fund 60,914 211 - 2,224 - Meezan Bank Limited - 38 1,801,500 1,192,604 46.89 National Bank of Pakistan 84,479 53,693 265,000 130,000 255.15 National Refinery Limited 67,616 35,845 - 13,473 - NIB Bank Limited - 21 7,000,000 - 14.19 Nishat Chunian Power Limited 99,296 - 1,000,000 2,059,020 27.73 Nishat (Chunian) Limited 27,725 44,272 4,007,383 - 10.00 Karachi Stock Exchange Limited (KSE) 11.2.2 40,074 - 3,034,603 - 1.48 Islamabad Stock Exchange Limited (ISE) 11.2.2 4,505 - 6,305,000 6,230,000 15.85 Nishat Power Limited 99,927 98,859 880,000 1,980,591 55.21 Nishat Mills Limited 48,588 99,804 510,000 790 173.29 Oil and Gas Development Company Limited 88,380 113 - 438,400 - Packages Limited - 39,149 7,583,700 7,583,700 9.96 Pak Oman Advantage Fund 75,516 75,516 275,000 2,867 357.83 Pakistan Oilfields Limited 98,403 945 672,000 519,588 147.31 Pakistan Petroleum Limited 98,994 98,816 3,267,521 3,415,352 19.33 Pakistan Re-Insurance Company Limited 63,147 65,831 440,000 360,000 225.60 Pakistan State Oil Company Limited 99,262 98,989 3,250,000 8,041,738 17.94 Pakistan Telecommunication Company Limited 58,305 99,969 6,700,000 65,479 14.17 PICIC Growth Fund 94,958 827 200,000 - 5.83 PICIC Investment Fund 1,166 -
9.2.3 Principal terms of investments in Federal Government Securities
Principal Coupon Name of investment Maturity Payment Rate Payment
Market Treasury Bills January 2013 to November 2013 On maturity 9.18% to 11.94% at maturity Pakistan Investment Bonds June 2013 to June 2024 On maturity 8% to 12% semi-annually Government of Pakistan Euro Bonds March 2016 to June 2017 On maturity 6.88% to 7.13% semi-annually Sukuk Certificates - House Building Finance Corporation May 2014 Semi-annually 6 months KIBOR semi-annually plus 1% - Pakistan Domestic Sukuk Company Limited December 2013 to September 2015 On maturity Weighted average semi-annually yield of 6 months market treasury bills - WAPDA July 2017 On maturity 6 months KIBOR semi-annually minus 0.25%
9.2.4 These represent investments by Wholesale Bank Branch carrying mark-up at 6.88% and 7.13% and having maturities upto June 2017.
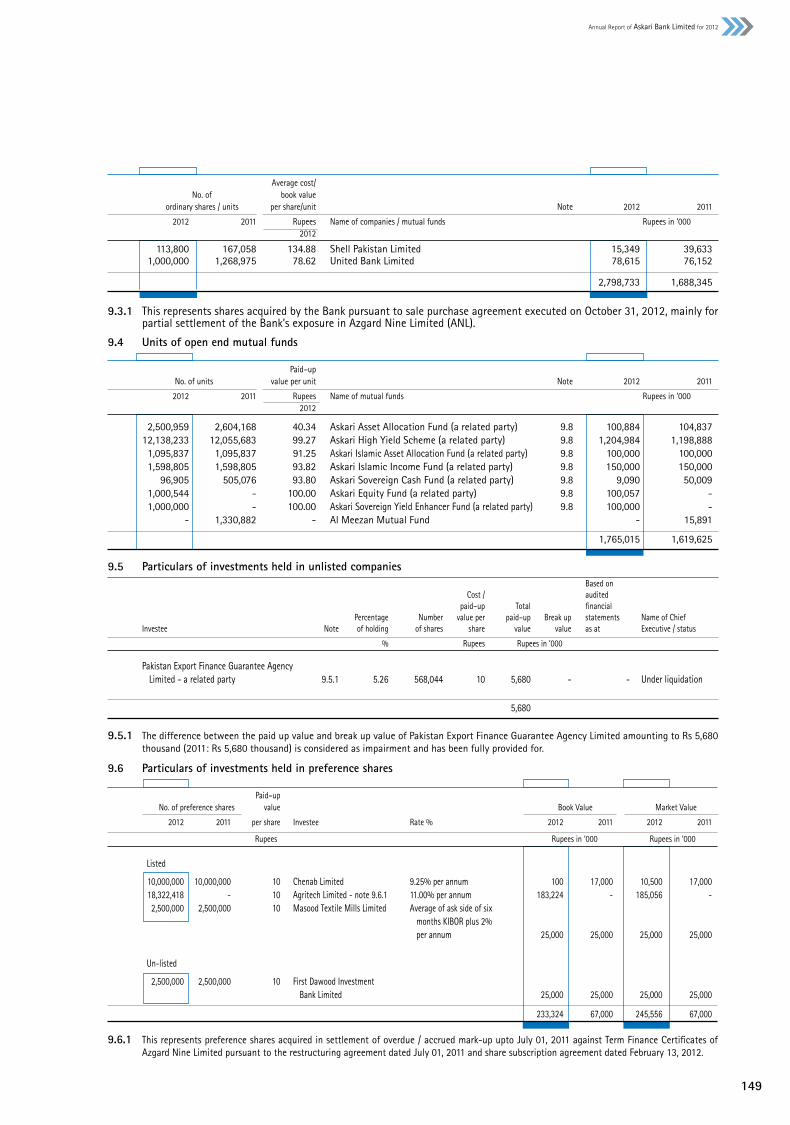
149
Annual Report of Askari Bank Limited for 2012
9.5 Particulars of investments held in unlisted companies Based on Cost / audited paid–up Total financial Percentage Number value per paid–up Break up statements Name of Chief Investee Note of holding of shares share value value as at Executive / status
% Rupees Rupees in ‘000
Pakistan Export Finance Guarantee Agency Limited - a related party 9.5.1 5.26 568,044 10 5,680 - - Under liquidation 5,680 9.5.1 The difference between the paid up value and break up value of Pakistan Export Finance Guarantee Agency Limited amounting to Rs 5,680
thousand (2011: Rs 5,680 thousand) is considered as impairment and has been fully provided for.
9.6 Particulars of investments held in preference shares
Paid–up No. of preference shares value Book Value Market Value
2012 2011 per share Investee Rate % 2012 2011 2012 2011
Rupees Rupees in ‘000 Rupees in ‘000
Listed
10,000,000 10,000,000 10 Chenab Limited 9.25% per annum 100 17,000 10,500 17,000 18,322,418 - 10 Agritech Limited - note 9.6.1 11.00% per annum 183,224 - 185,056 - 2,500,000 2,500,000 10 Masood Textile Mills Limited Average of ask side of six months KIBOR plus 2% per annum 25,000 25,000 25,000 25,000
Un-listed
2,500,000 2,500,000 10 First Dawood Investment Bank Limited 25,000 25,000 25,000 25,000
233,324 67,000 245,556 67,000
9.6.1 This represents preference shares acquired in settlement of overdue / accrued mark-up upto July 01, 2011 against Term Finance Certificates of Azgard Nine Limited pursuant to the restructuring agreement dated July 01, 2011 and share subscription agreement dated February 13, 2012.
9.4 Units of open end mutual funds
Paid–up No. of units value per unit Note 2012 2011
2012 2011 Rupees Name of mutual funds Rupees in ‘000 2012
2,500,959 2,604,168 40.34 Askari Asset Allocation Fund (a related party) 9.8 100,884 104,837 12,138,233 12,055,683 99.27 Askari High Yield Scheme (a related party) 9.8 1,204,984 1,198,888 1,095,837 1,095,837 91.25 Askari Islamic Asset Allocation Fund (a related party) 9.8 100,000 100,000 1,598,805 1,598,805 93.82 Askari Islamic Income Fund (a related party) 9.8 150,000 150,000 96,905 505,076 93.80 Askari Sovereign Cash Fund (a related party) 9.8 9,090 50,009 1,000,544 - 100.00 Askari Equity Fund (a related party) 9.8 100,057 - 1,000,000 - 100.00 Askari Sovereign Yield Enhancer Fund (a related party) 9.8 100,000 - - 1,330,882 - Al Meezan Mutual Fund - 15,891
1,765,015 1,619,625
Average cost/ No. of book value ordinary shares / units per share/unit Note 2012 2011
2012 2011 Rupees Name of companies / mutual funds Rupees in ‘000 2012
113,800 167,058 134.88 Shell Pakistan Limited 15,349 39,633 1,000,000 1,268,975 78.62 United Bank Limited 78,615 76,152
2,798,733 1,688,345
9.3.1 This represents shares acquired by the Bank pursuant to sale purchase agreement executed on October 31, 2012, mainly for partial settlement of the Bank’s exposure in Azgard Nine Limited (ANL).

150
Notes to the Consolidated Financial StatementsFor the year ended December 31, 2012
9.7 Investment in Term Finance Certificates
Redeemed value No. of certificates Company’s Name per certificate 2012 2011 2012 2011 Rupees Rupees in ‘000
Listed
13,669 13,669 Allied Bank Limited 4,988 68,181 68,208 95,600 35,000 Bank Alfalah Limited 4,737 452,868 141,318 - 30,000 Bank Al-Habib Limited - - 99,740 - 8,000 Orix Leasing Limited - - 6,672 37,230 37,230 Pace Pakistan Limited 4,832 179,882 177,576 97,493 97,493 Pak Arab Fertilizer Limited 1,497 145,929 355,132 41,000 40,000 Pakistan Mobile Communication Limited 3,129 128,280 99,840 140,000 140,000 Engro Fertilizer Limited 5,000 700,000 700,000 4,600 4,600 Faysal Bank Limited 1,247 5,736 11,477 12,000 12,000 Soneri Bank Limited 1,247 14,964 44,892 10,000 10,000 Standard Chartered Bank Limited 1,250 12,500 34,960 72,432 92,432 United Bank Limited 4,883 353,651 423,657 133,023 133,023 Worldcall Telecom Limited 2,119 281,880 366,117
Book value as on December 31 2,343,871 2,529,589
Unlisted
145,000 145,000 Agritech Limited - note 9.7.2 4,875 706,884 712,379 30,000 30,000 Avari Hotels Limited 4,246 127,372 127,372 (Chief Executive: Mr. Byram Dinshawji Avari) 86,000 86,000 Azgard Nine Limited - note 9.3.1 & 9.6.1 2,168 186,457 429,969 50,600 35,600 Bank Alfalah Limited 5,141 260,146 182,389 50,000 - Bank Al-Habib Limited 5,198 259,912 - 3,700 3,700 Bunny’s Limited 5,000 18,500 18,500 (Chief Executive: Mr. Haroon Shafique Chaudhary) - 20,000 Dewan Farooq Spinning Mills Limited - - 25,000 74,900 74,900 Jahangir Siddique and Company Limited 4,963 371,728 367,850 - 10,000 KASB Securities Limited - - 16,668 3,560 3,560 Orix Leasing Pakistan Limited 16,661 59,312 176,237 10,077 10,077 Pak Hy Oils Limited 5,000 50,385 50,385 (Chief Executive: Mr. Tariq Siddique Paracha) 20,000 20,000 Pak Libya Holding Company (Private) Limited 4,997 99,940 99,980 (Chief Executive: Mr. Abid Aziz) 60,000 5,931 Pakistan Mobile Communication Limited 4,706 282,353 29,657 (Chief Executive: Mr. Rashid Naseer Khan) 50,000 50,000 Pakistan International Airlines Corporation Limited 4,996 249,800 249,800 102,282 83,865 Pakistan National Shipping Corporation 3,750 383,557 366,910 10,000 10,000 Shakarganj Mills Limited 4,500 45,000 50,000
Book value as on December 31 3,101,346 2,903,096
9.7.1 These carry rate of return ranging from 10.36% to 15.00% (2011: 8.45% to 15.64%) per annum and having remaining maturity periods of upto 8 years (2011: 9 years).
9.7.2 In the current year, AIML received 1,077 term finance certificates of Agritech Limited against settlement of unpaid mark-up of Rs. 5.3 million. The investment and the related interest have not been recognized in these financial statements.
9.8 This represents investment in funds managed by Askari Investment Management Limited.

151
Annual Report of Askari Bank Limited for 2012
9.9 Sukuk certificates – available for sale
Name of Investee Rate Maturity 2012 2011
Rupees in ‘000
Eden Builders (Private) Limited Average of offer side of 3 March 8, 2014 37,500 67,500 month KIBOR plus 2.3% p.a. (floor 3.5%, cap 35%) House Building Finance Corporation Average of offer side of 6 month May 8, 2014 30,000 50,000 KIBOR plus 1% p.a. JDW Sugar Mills Limited Average of offer side of 3 month June 20, 2014 KIBOR plus 1.25% p.a. (floor 3%, cap 25%) 66,666 111,111 K.S. Sulmanji and Esmailji and Average of offer side of 3 month June 30, 2014 Sons (Private) Limited KIBOR plus 1.4% p.a. 106,346 106,346 Kohat Cement Limited Average of offer side of 3 month September 20, 2016 KIBOR plus 1.5% p.a. 57,378 176,500 Agritech Limited Average of offer side of 6 month August 6, 2019 KIBOR plus 2% p.a. 299,963 299,963 Pak Electron Limited Average of offer side of 3 month June 28, 2013 10,714 10,736 KIBOR plus 1.75% p.a. Pakistan Domestic Sukuk Weighted average yield of 6 months December 20, 2013 2,000,000 2,000,000 Company Limited market treasury bills Pakistan Domestic Sukuk Weighted average yield of 6 months September 18, 2015 1,002,712 - Company Limited market treasury bills Pakistan Domestic Sukuk Weighted average yield of 6 months March 7, 2014 3,000,000 3,000,000 Company Limited market treasury bills Pakistan Domestic Sukuk Weighted average yield of 6 months Company Limited market treasury bills December 26, 2014 2,000,000 2,000,000 Shahraj Fabric Limited Average of offer side of 6 month December 31, 2012 150,000 150,000 KIBOR plus 2.1% p.a.
Sitara Peroxide Limited Average of offer side of 1 month February 19, 2020 167,393 178,125 KIBOR plus 1% p.a. 8,928,672 8,150,281
9.10 These represent investments by Wholesale Bank Branch carrying mark-up at 6.88% and 7.13% and having maturities upto June 2017.
9.11 The Group has invested in MENA Transformation Fund I.L.P., a closed end fund having six years term.
9.12 Investment in associate represents 27.18% (2011: 27.18%) investment in the equity of Askari General Insurance Company Limited (AGICO).
2012 2011 Rupees in ‘000
Cost of investment 29,466 29,466 Acquired on merger of ALL 24,237 24,237 Share of Profit - net of tax 78,778 50,964 132,481 104,667
Summary of financial information of AGICO is given below: Based on
September 30, December 31, 2012 2011Rupees in ‘000 (Un–audited) (Audited)
Assets 1,647,025 1,544,980 Liabilities 1,159,604 1,112,773 Equity 487,421 432,207 Revenue 515,226 633,283 Profit after tax 55,213 65,434 Fair value of investment in AGICO as at December 31, 2012 is Rs. 118,738 thousand (December 31, 2011: Rs. 67,599
thousand). 3,075 shares are held in the name of a nominee director of the Bank in AGICO.
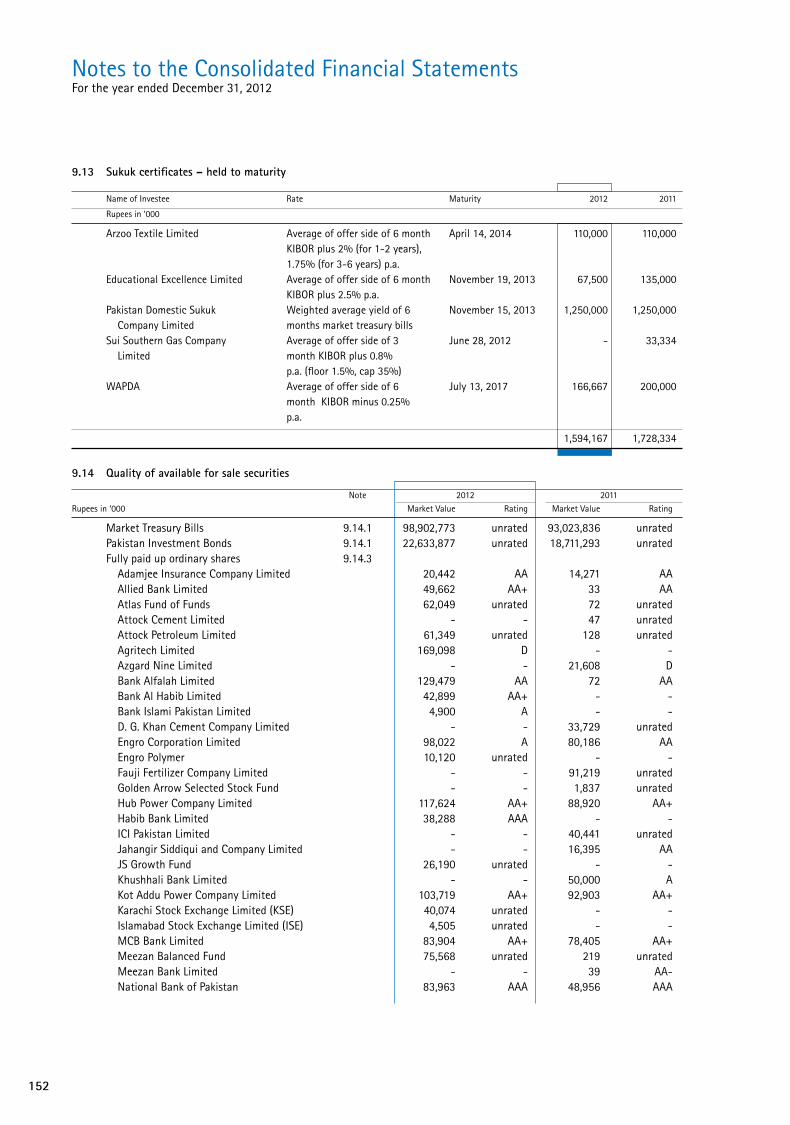
152
Notes to the Consolidated Financial StatementsFor the year ended December 31, 2012
9.13 Sukuk certificates – held to maturity
Name of Investee Rate Maturity 2012 2011
Rupees in ‘000
Arzoo Textile Limited Average of offer side of 6 month April 14, 2014 110,000 110,000 KIBOR plus 2% (for 1-2 years), 1.75% (for 3-6 years) p.a. Educational Excellence Limited Average of offer side of 6 month November 19, 2013 67,500 135,000 KIBOR plus 2.5% p.a. Pakistan Domestic Sukuk Weighted average yield of 6 November 15, 2013 1,250,000 1,250,000 Company Limited months market treasury bills Sui Southern Gas Company Average of offer side of 3 June 28, 2012 - 33,334 Limited month KIBOR plus 0.8% p.a. (floor 1.5%, cap 35%) WAPDA Average of offer side of 6 July 13, 2017 166,667 200,000 month KIBOR minus 0.25% p.a.
1,594,167 1,728,334
9.14 Quality of available for sale securities
Note 2012 2011Rupees in ‘000 Market Value Rating Market Value Rating
Market Treasury Bills 9.14.1 98,902,773 unrated 93,023,836 unrated Pakistan Investment Bonds 9.14.1 22,633,877 unrated 18,711,293 unrated Fully paid up ordinary shares 9.14.3 Adamjee Insurance Company Limited 20,442 AA 14,271 AA Allied Bank Limited 49,662 AA+ 33 AA Atlas Fund of Funds 62,049 unrated 72 unrated Attock Cement Limited - - 47 unrated Attock Petroleum Limited 61,349 unrated 128 unrated Agritech Limited 169,098 D - - Azgard Nine Limited - - 21,608 D Bank Alfalah Limited 129,479 AA 72 AA Bank Al Habib Limited 42,899 AA+ - - Bank Islami Pakistan Limited 4,900 A - - D. G. Khan Cement Company Limited - - 33,729 unrated Engro Corporation Limited 98,022 A 80,186 AA Engro Polymer 10,120 unrated - - Fauji Fertilizer Company Limited - - 91,219 unrated Golden Arrow Selected Stock Fund - - 1,837 unrated Hub Power Company Limited 117,624 AA+ 88,920 AA+ Habib Bank Limited 38,288 AAA - - ICI Pakistan Limited - - 40,441 unrated Jahangir Siddiqui and Company Limited - - 16,395 AA JS Growth Fund 26,190 unrated - - Khushhali Bank Limited - - 50,000 A Kot Addu Power Company Limited 103,719 AA+ 92,903 AA+ Karachi Stock Exchange Limited (KSE) 40,074 unrated - - Islamabad Stock Exchange Limited (ISE) 4,505 unrated - - MCB Bank Limited 83,904 AA+ 78,405 AA+ Meezan Balanced Fund 75,568 unrated 219 unrated Meezan Bank Limited - - 39 AA- National Bank of Pakistan 83,963 AAA 48,956 AAA

153
Annual Report of Askari Bank Limited for 2012
Note 2012 2011
Rupees in ‘000 Market Value Rating Market Value Rating
National Refinery Limited 56,101 AAA 31,550 AAA NIB Bank Limited - - 23 AA- Nishat (Chunian) Limited 35,040 A- 36,774 unrated Nishat Chunian Power Limited 147,070 A - - Nishat Mills Limited 41,503 AA- 79,913 AA- Nishat Power Limited 122,948 A+ 80,678 AA- Oil and Gas Development Company Limited 98,231 AAA 120 AAA Packages Limited - - 36,264 AA Pak Oman Advantage Fund 70,073 A+ 69,163 AA- Pakistan Export Finance Guarantee Agency - - - - Pakistan Oilfields Limited 120,324 unrated 993 unrated Pakistan Petroleum Limited 118,803 unrated 87,457 unrated Pakistan Re-Insurance Limited 79,891 AA 52,938 AA Pakistan State Oil Company Limited 102,172 AA+ 81,796 AA+ Pakistan Telecommunication Company Limited 43,375 unrated 83,554 unrated PICIC Growth Fund 109,880 unrated 816 unrated PICIC Investment Fund 1,414 unrated Shell Pakistan Limited 15,498 unrated 31,788 unrated United Bank Limited 83,670 AA+ 66,482 AA+ Fully paid preference shares Agritech Limited 185,056 unrated Chenab Limited 10,500 unrated 17,000 unrated Masood Textile Mills Limited 25,000 unrated 25,000 unrated First Dawood Investment Bank Limited - unrated - unrated Units of open end mutual fund Askari High Yield Scheme 1,099,848 A+ (f) 1,178,518 A+ (f) Askari Asset Allocation Fund 115,620 4-Star 94,033 4-Star Askari Islamic Asset Allocation Fund 126,249 unrated 107,047 unrated Askari Islamic Income Fund 160,717 AA- (f) 161,315 AA- (f) Askari Sovereign Yield Enhancer Fund 100,980 AA- (f) - - Askari Equity Fund 113,466 unrated - - Askari Sovereign Cash Fund - - 50,788 AA+ (f) Al-Meezan Mutual Fund - - 13,602 unrated
Term Finance Certificates Agritech Limited 602,726 D 608,131 D Allied Bank Limited 69,409 AA 68,361 AA- Avari Hotels Limited 122,943 A- 121,558 A- Azgard Nine Limited 171,050 D 394,258 D Bank Alfalah Limited 671,162 AA- 180,940 AA- Bank Al-Habib Limited 283,754 AA - -
Bunny’s Limited 18,500 Unrated 18,500 Unrated Engro Fertilizer Limited 657,902 A 707,167 AA Jahangir Siddiqui and Company Limited 375,745 AA 377,827 AA KASB Securities Limited - - 16,631 A+ Orix Leasing Pakistan Limited 59,366 AA+ 185,469 AA+ Pace Pakistan Limited 179,882 Unrated 125,050 Unrated Pak Arab Fertilizer Limited 146,295 AA 362,344 AA Pak Hy Oils Limited 50,385 Unrated 50,385 Unrated

154
Notes to the Consolidated Financial StatementsFor the year ended December 31, 2012
Note 2012 2011
Rupees in ‘000 Market Value Rating Market Value Rating
Pak Libya Holding Company (Pvt) Limited 100,717 AA 101,934 AA Pakistan International Airlines Corporation Limited 9.14.1 249,800 Unrated 249,800 Unrated Pakistan Mobile Communication Limited 375,244 AA- 29,657 A+ Pakistan National Shipping Corporation 383,558 Unrated 366,910 Unrated Shakarganj Mills Limited 45,000 Unrated 50,000 Unrated United Bank Limited 361,857 AA 360,553 AA World Call Telecom Limited 199,415 D 330,452 A
5,124,710 4,705,927
National Investment Trust (NIT) Units 864,363 AM2- 313,607 AM2- Sukuk certificates 9.14.2 8,859,690 unrated 8,273,890 unrated Foreign securities Mena Transformation Fund 49,328 unrated 133,816 unrated Government of Pakistan Euro Bonds 9.14.1 1,042,563 unrated 786,350 unrated
141,882,587 128,995,811
9.14.1 These are Government of Pakistan guaranteed securities. 9.14.2 These include Government of Pakistan guaranteed sukuk certificates of Rs. 8,032,712 thousand (2011: Rs. 7,050,000
thousand). 9.14.3 Ratings for these equity securities / units and term finance certificates represent ‘entity ratings’. 9.14.4 Local securities have either been rated by ‘The Pakistan Credit Rating Agency Limited (PACRA)’ or ‘JCR-VIS Credit
Rating Company Limited (JCR-VIS), whereas foreign securities are unrated. These ratings reflect independent credit risk assessment by respective credit rating entities.
Rupees in ‘000 2012 2011
9.15 Unrealized gain on revaluation of investments classified as held for trading
Fully paid ordinary shares / units 986 80
9.16 Market Treasury Bills and Pakistan Investment Bonds are securities eligible for re-discounting with the SBP.
9.17 Investments include Rs. 2,014,475 thousand (2011: Rs. 2,052,782 thousand) which have been placed under non-performing status and the Bank maintains provision of Rs. 503,315 thousand (2011: Rs. 327,099 thousand ) against non-performing investments.
9.17.1 During the year, the Group has availed Forced Sale Value (FSV) benefit of Rs. 7,575 thousand (2011: Rs. 184,633 thousand) against non-performing investments. Had the FSV benefit not been recognized, before and after tax profit for the year would have been lower by Rs. 7,575 thousand (2011: Rs. 184,633 thousand) and Rs. 4,924 thousand (2011: Rs. 120,011 thousand) respectively.
9.18 The Group has availed the relaxation of Rs. 809,460 thousand (2011: Rs. 931,140 thousand) and Rs. 304,250 thousand (2011: Nil) allowed by the SBP for maintaining provisions as per time based criteria of Prudential Regulations for debt securities and impairment for equity securities, respectively.

155
Annual Report of Askari Bank Limited for 2012
Rupees in ‘000 Note 2012 2011
10. ADVANCES
Loans, cash credits, running finances, etc. In Pakistan 137,296,028 139,291,631 Outside Pakistan 3,351,665 3,103,127
140,647,693 142,394,758
Net investment in lease finance - In Pakistan 10.2 4,827,289 6,477,358
Ijarah financing - In Pakistan 10.3 307,336 671,147
Net book value of assets / investments in Ijarah under IFAS 2 in Pakistan 10.4 380,311 319,125
Bills discounted and purchased Payable in Pakistan 9,967,185 11,213,180 Payable outside Pakistan 6,725,769 6,305,678
16,692,954 17,518,858
Advances - gross 162,855,583 167,381,246 Provision against non-performing advances 10.6 Specific provision (18,796,160) (16,291,514) General provision (127,698) (132,130) General provision against consumer financing (203,890) (245,046)
(19,127,748) (16,668,690)
Advances - net of provision 143,727,835 150,712,556 10.1 Particulars of advances (Gross)
10.1.1 In local currency 155,125,453 158,823,108 In foreign currencies 7,730,130 8,558,138
162,855,583 167,381,246 10.1.2 Short term (for upto one year) 121,310,194 128,879,475 Long term (for over one year) 41,545,389 38,501,771
162,855,583 167,381,246
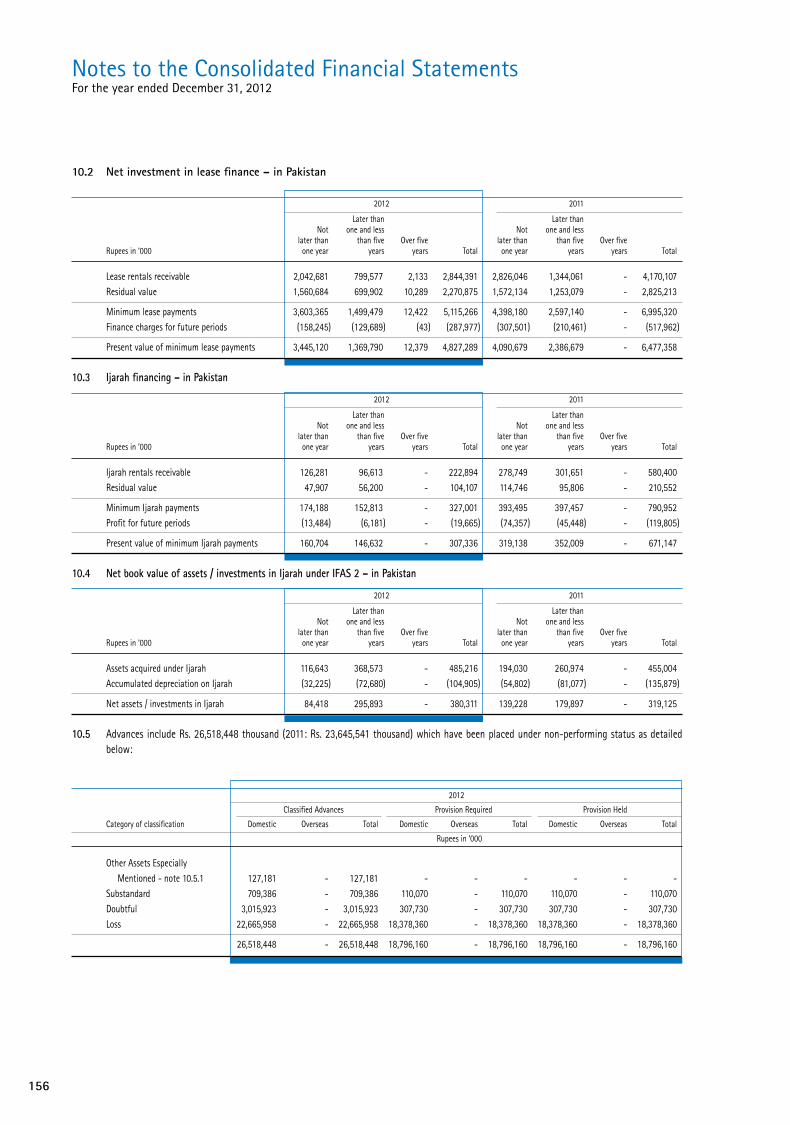
156
Notes to the Consolidated Financial StatementsFor the year ended December 31, 2012
10.2 Net investment in lease finance – in Pakistan
2012 2011
Later than Later than Not one and less Not one and less later than than five Over five later than than five Over five Rupees in ‘000 one year years years Total one year years years Total
Lease rentals receivable 2,042,681 799,577 2,133 2,844,391 2,826,046 1,344,061 - 4,170,107 Residual value 1,560,684 699,902 10,289 2,270,875 1,572,134 1,253,079 - 2,825,213
Minimum lease payments 3,603,365 1,499,479 12,422 5,115,266 4,398,180 2,597,140 - 6,995,320 Finance charges for future periods (158,245) (129,689) (43) (287,977) (307,501) (210,461) - (517,962)
Present value of minimum lease payments 3,445,120 1,369,790 12,379 4,827,289 4,090,679 2,386,679 - 6,477,358
10.3 Ijarah financing – in Pakistan
2012 2011
Later than Later than Not one and less Not one and less later than than five Over five later than than five Over five Rupees in ‘000 one year years years Total one year years years Total
Ijarah rentals receivable 126,281 96,613 - 222,894 278,749 301,651 - 580,400 Residual value 47,907 56,200 - 104,107 114,746 95,806 - 210,552
Minimum Ijarah payments 174,188 152,813 - 327,001 393,495 397,457 - 790,952 Profit for future periods (13,484) (6,181) - (19,665) (74,357) (45,448) - (119,805)
Present value of minimum Ijarah payments 160,704 146,632 - 307,336 319,138 352,009 - 671,147
10.4 Net book value of assets / investments in Ijarah under IFAS 2 – in Pakistan
2012 2011
Later than Later than Not one and less Not one and less later than than five Over five later than than five Over five Rupees in ‘000 one year years years Total one year years years Total
Assets acquired under Ijarah 116,643 368,573 - 485,216 194,030 260,974 - 455,004 Accumulated depreciation on Ijarah (32,225) (72,680) - (104,905) (54,802) (81,077) - (135,879)
Net assets / investments in Ijarah 84,418 295,893 - 380,311 139,228 179,897 - 319,125
10.5 Advances include Rs. 26,518,448 thousand (2011: Rs. 23,645,541 thousand) which have been placed under non-performing status as detailed below:
2012
Classified Advances Provision Required Provision Held
Category of classification Domestic Overseas Total Domestic Overseas Total Domestic Overseas Total
Rupees in ‘000
Other Assets Especially Mentioned - note 10.5.1 127,181 - 127,181 - - - - - - Substandard 709,386 - 709,386 110,070 - 110,070 110,070 - 110,070 Doubtful 3,015,923 - 3,015,923 307,730 - 307,730 307,730 - 307,730 Loss 22,665,958 - 22,665,958 18,378,360 - 18,378,360 18,378,360 - 18,378,360
26,518,448 - 26,518,448 18,796,160 - 18,796,160 18,796,160 - 18,796,160

157
Annual Report of Askari Bank Limited for 2012
2011
Classified Advances Provision Required Provision Held
Category of classification Domestic Overseas Total Domestic Overseas Total Domestic Overseas Total
Rupees in ‘000
Other Assets Especially Mentioned - note 10.5.1 82,833 - 82,833 - - - - - - Substandard 822,789 - 822,789 70,785 - 70,785 70,785 - 70,785 Doubtful 1,754,185 - 1,754,185 353,690 - 353,690 353,690 - 353,690 Loss 20,985,734 - 20,985,734 15,867,039 - 15,867,039 15,867,039 - 15,867,039
23,645,541 - 23,645,541 16,291,514 - 16,291,514 16,291,514 - 16,291,514
10.5.1 This represents classification made for agricultural finances.
10.6 Particulars of provision against non–performing advances
2012 2011 Consumer Consumer financing financing Rupees in ‘000 Note Specific General –General Total Specific General –General Total
Opening balance 16,291,514 132,130 245,046 16,668,690 15,222,798 132,190 296,638 15,651,626 Transfer from investments 22,500 - - 22,500 - - - -
Charge for the year 3,532,354 9,575 332 3,542,261 3,877,730 13,963 - 3,891,693 Reversal for the year (1,050,208) (14,007) (41,488) (1,105,703) (2,164,986) (14,023) (51,592) (2,230,601)
Net charge / (reversal) for the year 2,482,146 (4,432) (41,156) 2,436,558 1,712,744 (60) (51,592) 1,661,092 Reversal of provision on rescheduled / restructured classified advances 21.1 - - - - (71,692) - - (71,692) Amounts written off 10.8 - - - - (572,336) - - (572,336)
Closing balance 18,796,160 127,698 203,890 19,127,748 16,291,514 132,130 245,046 16,668,690
Rupees in ‘000 2012 2011
10.6.1 Provision against non–performing advances
Net charge for the year 2,436,558 1,661,092 Reversal of capital reserve (94,085) (30,969)
2,342,473 1,630,123
10.6.2 The SBP amended the Prudential Regulations vide BSD Circular No. 1 of 2011 dated October 21, 2011 in relation to provision
for loans and advances, thereby allowing benefit of Forced Sale Value (FSV) of pledged stocks, mortgaged residential, commercial and industrial properties (land and building only) and plant and machinery under charge held as collateral against non-performing advances. The FSV benefit availed in last years has been reduced by Rs. 596,999 thousand (net of FSV benefit availed during the year), which has resulted in increased charge for specific provision for the year ended by the same amount. The FSV benefit is not available for cash or stock dividend. Had the FSV benefit not recognized, before and after tax profit for the year ended would have been higher by Rs. 596,999 thousand (2011: lower by Rs. 1,838,083 thousand) and Rs. 388,049 thousand (2011: lower by Rs. 1,194,754 thousand) respectively.
10.6.3 The Group has availed the relaxation of Rs. 262,880 thousand (2011: Rs. 249,030 thousand) allowed by the SBP for maintaining provisions as per time based criteria of Prudential Regulations.
10.6.4 The general provision is maintained at the rate of 0.1% on advances other than non-performing advances and consumer
financing. 10.7 Particulars of provision against non–performing advances

158
Notes to the Consolidated Financial StatementsFor the year ended December 31, 2012
2012 2011
Consumer Consumer financing financing Rupees in ‘000 Specific General –General Total Specific General –General Total
In local currency 18,435,321 120,493 203,890 18,759,704 16,021,957 131,304 245,046 16,398,307 In foreign currencies 360,839 7,205 - 368,044 269,557 826 - 270,383
18,796,160 127,698 203,890 19,127,748 16,291,514 132,130 245,046 16,668,690
Rupees in ‘000 2012 2011
10.8 Particulars of write–offs:
10.8.1 Against provisions – 572,336 Directly charged to profit and loss account 1,043 –
1,043 572,336 10.8.2 Write offs of Rs. 500,000 and above 1,043 8,349 Write offs of below Rs. 500,000 – 563,987
1,043 572,336 10.8.3 In terms of sub-section (3) of Section 33A of the Banking Companies Ordinance, 1962 the statement in respect of written off
loans or any other financial relief of Rs. 500,000 or above allowed to a person(s) during the year ended December 31, 2012 is given at Annexure - 1 to the unconsolidated financial statements.
Rupees in ‘000 Note 2012 2011
10.9 Particulars of loans and advances to directors, associated companies etc.
Debts due by directors, executives or officers of the Bank or any of them either severally or jointly with any other persons
Balance at beginning of year 1,462,780 1,493,499 Loans granted during the year 333,959 320,134 Repayments (369,026) (350,853)
Balance at end of year 1,427,713 1,462,780 Debts due by subsidiary companies, controlled firms, managed modarabas and other related parties
Balance at beginning of year 291 1,072 Loans granted during the year - 47,089 Repayments (146) (47,870)
Balance at end of year 145 291
1,427,858 1,463,071 11. OPERATING FIXED ASSETS
Capital work-in-progress 11.1 43,524 51,948 Property and equipment 11.2 7,610,632 8,115,106 Intangibles 11.2 1,247,366 1,283,979
8,901,522 9,451,033 11.1 Capital work–in–progress
Advances to suppliers and contractors 43,524 51,948
43,524 51,948

159
Annual Report of Askari Bank Limited for 2012
11.2 Property and equipment
2012 COST / REVALUED AMOUNT DEPRECIATION Book value Annual as at as at as at Charge as at as at rate of January 1, Deletions/ December 31, January 1, for the December 31, December 31, depreciation Rupees in ‘000 2012 Additions Adjustment transfers 2012 2012 year Adjustments Deletions 2012 2012 (%) Land -freehold - note 11.3 1,639,802 - - - 1,639,802 - - - - - 1,639,802 - Land -leasehold - note 11.3 2,151,818 - - - 2,151,818 - - - - - 2,151,818 - Buildings on freehold land 855,882 - - - 855,882 222,241 31,067 - - 253,308 602,574 5 Buildings on leasehold land 1,428,212 1,400 - - 1,429,612 419,144 49,337 - - 468,481 961,131 5 Renovation of premises 1,843,268 88,472 (1,601) (169) 1,929,970 1,149,456 275,406 (11) (107) 1,424,744 505,226 10 - 20 Furniture, fixtures and office equipment 535,163 21,820 147 (6,179) 550,951 225,042 33,791 31 (2,481) 256,383 294,568 10 - 33 Carpets 23,180 3,527 - (2,272) 24,435 17,664 2,437 - (1,604) 18,497 5,938 20 Machine and equipments 1,321,307 63,118 50 (7,837) 1,376,638 779,061 113,464 (88) (5,820) 886,617 490,021 20 Computer equipments 2,095,907 83,766 342 (5,150) 2,174,865 1,028,777 208,210 295 (4,005) 1,233,277 941,588 20 - 33 Vehicles 241,839 43 (335) (20,244) 221,303 209,447 12,605 (356) (16,925) 204,771 16,532 20 Other assets 133,222 - (88,122) - 45,100 105,292 6,916 (68,002) - 44,206 894 20
12,269,600 262,146 (89,519) (41,851) 12,400,376 4,156,124 733,233 (68,131) (30,942) 4,790,284 7,610,092 Operating Lease - Vehicles 18,209 - - (16,375) 1,834 18,209 - - (16,375) 1,834 - 20
12,287,809 262,146 (89,519) (58,226) 12,402,210 4,174,333 733,233 (68,131) (47,317) 4,792,118 7,610,092 Assets held under finance lease Vehicles 6,443 - - (3,150) 3,293 4,813 849 - (2,909) 2,753 540 20
12,294,252 262,146 (89,519) (61,376) 12,405,503 4,179,146 734,082 (68,131) (50,226) 4,794,871 7,610,632
Intangible Software 1,314,491 148,596 - - 1,463,087 87,517 141,380 - - 228,897 1,234,190 10 Trading Right Entitlement Certificates - note 11.2.2 - - - 12,426 12,426 - - - - - 12,426 - Stock Exchange membership cards - note 11.2.2 57,005 750 - (57,005) 750 - - - - - 750 -
1,371,496 149,346 - (44,579) 1,476,263 87,517 141,380 - - 228,897 1,247,366 2011 COST / REVALUED AMOUNT DEPRECIATION Book value Annual as at as at as at Charge as at as at rate of January 1, December 31, January 1, for the December 31, December 31, depreciation Rupees in ‘000 2011 Additions Adjustment Deletions 2011 2011 year Adjustments Deletions 2011 2011 (%) Land -freehold - note 11.3 1,639,802 - - - 1,639,802 - - - - - 1,639,802 - Land -leasehold - note 11.3 2,105,372 46,446 - - 2,151,818 - - - - - 2,151,818 - Buildings on freehold land 793,893 826 61,163 - 855,882 188,824 32,655 762 - 222,241 633,641 5 Buildings on leasehold land 1,415,637 12,575 - - 1,428,212 367,504 51,640 - - 419,144 1,009,068 5 Renovation of premises 1,721,325 195,036 (64,650) (8,443) 1,843,268 882,344 274,624 (697) (6,815) 1,149,456 693,812 20 Furniture, fixtures and office equipment 523,982 17,849 271 (6,939) 535,163 194,209 33,193 278 (2,638) 225,042 310,121 10 - 33 Carpets 21,832 2,475 12 (1,139) 23,180 16,076 2,517 17 (946) 17,664 5,516 20 Machine and equipment 1,255,840 76,467 (366) (10,634) 1,321,307 662,190 124,996 277 (8,402) 779,061 542,246 20 Computer equipment 1,953,486 243,710 (88,035) (13,254) 2,095,907 855,572 193,617 (9,713) (10,699) 1,028,777 1,067,130 20 Vehicles 236,685 14,563 (40) (9,369) 241,839 194,102 20,792 59 (5,506) 209,447 32,392 20 Other assets 133,222 - - - 133,222 89,367 16,155 (230) - 105,292 27,930 20
11,801,076 609,947 (91,645) (49,778) 12,269,600 3,450,188 750,189 (9,247) (35,006) 4,156,124 8,113,476 -
Operating Lease - Vehicles 18,209 - - - 18,209 16,531 1,678 - - 18,209 - 20
11,819,285 609,947 (91,645) (49,778) 12,287,809 3,466,719 751,867 (9,247) (35,006) 4,174,333 8,113,476 Assets held under finance lease Vehicles 10,043 - - (3,600) 6,443 5,735 1,558 - (2,480) 4,813 1,630 20
11,829,328 609,947 (91,645) (53,378) 12,294,252 3,472,454 753,425 (9,247) (37,486) 4,179,146 8,115,106 -
Intangible Software - 1,226,200 88,291 - 1,314,491 - 77,423 - 10,094 87,517 1,226,974 10 Stock Exchange membership cards 57,005 - - - 57,005 - - - - - 57,005 -
57,005 1,226,200 88,291 - 1,371,496 - 77,423 - 10,094 87,517 1,283,979
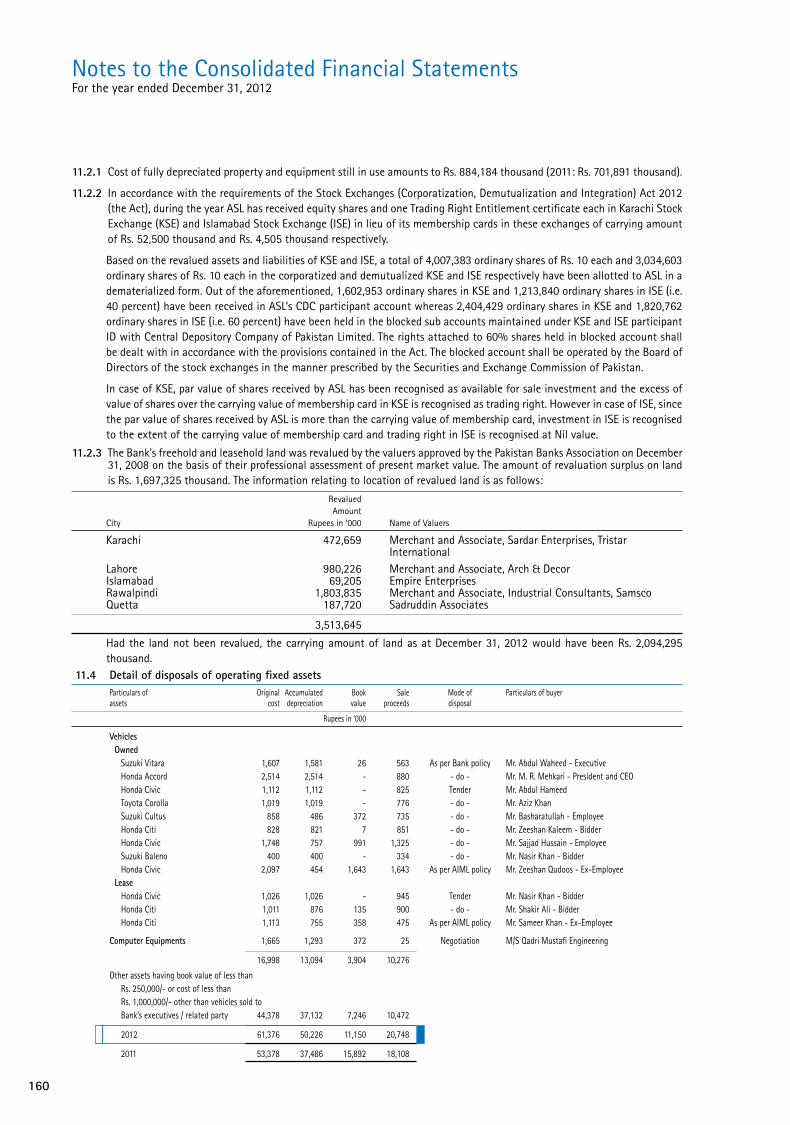
160
Notes to the Consolidated Financial StatementsFor the year ended December 31, 2012
11.4 Detail of disposals of operating fixed assets Particulars of Original Accumulated Book Sale Mode of Particulars of buyer assets cost depreciation value proceeds disposal
Rupees in ‘000
Vehicles Owned Suzuki Vitara 1,607 1,581 26 563 As per Bank policy Mr. Abdul Waheed - Executive Honda Accord 2,514 2,514 - 880 - do - Mr. M. R. Mehkari - President and CEO Honda Civic 1,112 1,112 - 825 Tender Mr. Abdul Hameed Toyota Corolla 1,019 1,019 - 776 - do - Mr. Aziz Khan Suzuki Cultus 858 486 372 735 - do - Mr. Basharatullah - Employee Honda Citi 828 821 7 851 - do - Mr. Zeeshan Kaleem - Bidder Honda Civic 1,748 757 991 1,325 - do - Mr. Sajjad Hussain - Employee Suzuki Baleno 400 400 - 334 - do - Mr. Nasir Khan - Bidder Honda Civic 2,097 454 1,643 1,643 As per AIML policy Mr. Zeeshan Qudoos - Ex-Employee Lease Honda Civic 1,026 1,026 - 945 Tender Mr. Nasir Khan - Bidder Honda Citi 1,011 876 135 900 - do - Mr. Shakir Ali - Bidder Honda Citi 1,113 755 358 475 As per AIML policy Mr. Sameer Khan - Ex-Employee
Computer Equipments 1,665 1,293 372 25 Negotiation M/S Qadri Mustafi Engineering
16,998 13,094 3,904 10,276
Other assets having book value of less than Rs. 250,000/- or cost of less than Rs. 1,000,000/- other than vehicles sold to Bank’s executives / related party 44,378 37,132 7,246 10,472
2012 61,376 50,226 11,150 20,748
2011 53,378 37,486 15,892 18,108
11.2.1 Cost of fully depreciated property and equipment still in use amounts to Rs. 884,184 thousand (2011: Rs. 701,891 thousand).
11.2.2 In accordance with the requirements of the Stock Exchanges (Corporatization, Demutualization and Integration) Act 2012 (the Act), during the year ASL has received equity shares and one Trading Right Entitlement certificate each in Karachi Stock Exchange (KSE) and Islamabad Stock Exchange (ISE) in lieu of its membership cards in these exchanges of carrying amount of Rs. 52,500 thousand and Rs. 4,505 thousand respectively.
Based on the revalued assets and liabilities of KSE and ISE, a total of 4,007,383 ordinary shares of Rs. 10 each and 3,034,603 ordinary shares of Rs. 10 each in the corporatized and demutualized KSE and ISE respectively have been allotted to ASL in a dematerialized form. Out of the aforementioned, 1,602,953 ordinary shares in KSE and 1,213,840 ordinary shares in ISE (i.e. 40 percent) have been received in ASL’s CDC participant account whereas 2,404,429 ordinary shares in KSE and 1,820,762 ordinary shares in ISE (i.e. 60 percent) have been held in the blocked sub accounts maintained under KSE and ISE participant ID with Central Depository Company of Pakistan Limited. The rights attached to 60% shares held in blocked account shall be dealt with in accordance with the provisions contained in the Act. The blocked account shall be operated by the Board of Directors of the stock exchanges in the manner prescribed by the Securities and Exchange Commission of Pakistan.
In case of KSE, par value of shares received by ASL has been recognised as available for sale investment and the excess of value of shares over the carrying value of membership card in KSE is recognised as trading right. However in case of ISE, since the par value of shares received by ASL is more than the carrying value of membership card, investment in ISE is recognised to the extent of the carrying value of membership card and trading right in ISE is recognised at Nil value.
11.2.3 The Bank’s freehold and leasehold land was revalued by the valuers approved by the Pakistan Banks Association on December 31, 2008 on the basis of their professional assessment of present market value. The amount of revaluation surplus on land is Rs. 1,697,325 thousand. The information relating to location of revalued land is as follows:
Revalued Amount City Rupees in ‘000 Name of Valuers
Karachi 472,659 Merchant and Associate, Sardar Enterprises, Tristar International
Lahore 980,226 Merchant and Associate, Arch & Decor Islamabad 69,205 Empire Enterprises Rawalpindi 1,803,835 Merchant and Associate, Industrial Consultants, Samsco Quetta 187,720 Sadruddin Associates
3,513,645
Had the land not been revalued, the carrying amount of land as at December 31, 2012 would have been Rs. 2,094,295 thousand.

161
Annual Report of Askari Bank Limited for 2012
Rupees in ‘000 Note 2012 2011
12. OTHER ASSETS
Income / mark-up accrued in local currency 12.1 6,131,115 7,145,475 Income / mark-up accrued in foreign currencies 193,127 165,990 Advances, deposits, advance rent and other prepayments 822,506 1,479,261 Advance taxation (payments less provisions) 3,693,655 2,978,018 Non banking assets acquired in satisfaction of claims 12.2 4,289,885 3,485,578 Un-realised gain on forward foreign exchange contracts - net 80,587 327,317 Suspense account 71,625 50,691 Stationary and stamps in hand 35,379 46,448 Dividend receivable 53,752 8,834 Others 12.3 372,547 505,103
15,744,178 16,192,715 Provision against other assets 12.4 (158,713) (163,877)
Other assets - net of provision 15,585,465 16,028,838
12.1 This balance has been arrived at after adjusting interest in suspense of Rs. 9,519,286 thousand (2011: Rs. 7,671,302 thousand).
12.2 Market value of non banking assets acquired in satisfaction of claims is Rs. 6,461,300 thousand (2011: Rs. 5,499,775 thousand). Further, additions include certain properties, acquired by the Bank through registered sale deeds, in its name, involving value of Rs. 532,337 thousand wherefor mutation formalities are in progress.
12.3 This includes an amount related to recovery of Rs. 57,297 thousand from a customer of ASL, on which arbitration committee of Islamabad Stock Exchange had decided the arbitration proceedings in favor of ASL in 2003. The customer had filed a suit against ASL challenging the decision of arbitration committee. ASL had filed a case in the District Court Islamabad against the customer for the recovery of amount receivable. In January 2009, the District Court Islamabad transferred the case to the High Court Islamabad on the grounds that the amount of the case is beyond the pecuniary jurisdiction of the District Court. The case is currently pending with the High Court Islamabad.
Rupees in ‘000 2012 2011
12.4 Provision against other assets
Opening balance 163,877 164,336
Provision recognised during the year 21,633 - Recovery from customer (13,000) -
8,633 - Written off during the year (13,797) (459)
Closing balance 158,713 163,877 13. BILLS PAYABLE
In Pakistan 3,700,156 2,756,032 14. BORROWINGS
In Pakistan 8,364,142 17,214,351 Outside Pakistan 12,598 60,628
8,376,740 17,274,979 14.1 Particulars of borrowings with respect to currencies
In local currency 8,364,142 17,214,351 In foreign currencies 12,598 60,628
8,376,740 17,274,979

162
Notes to the Consolidated Financial StatementsFor the year ended December 31, 2012
Rupees in ‘000 Note 2012 2011
14.2 Details of borrowings – secured / unsecured
In Pakistan - local currency Secured Borrowings from the State Bank of Pakistan: Export refinance scheme 14.2.1 7,170,013 8,317,225 Long term financing of export oriented projects 14.2.2 400,104 669,568 Long term financing facility 14.2.3 195,076 251,673 Refinance scheme for revival of agricultural activities in flood affected areas 14.2.4 2,745 31,045 Refinance scheme for revival of SME activities in flood affected areas 14.2.4 7,500 7,500
7,775,438 9,277,011
Repo borrowings from financial institutions Repo borrowings - 7,935,831 Others 14.2.5 4,123 1,509 Unsecured Call borrowings 14.2.6 500,000 - Overdrawn balance with other banks 84,581 -
584,581 -
8,364,142 17,214,351
Outside Pakistan - foreign currencies Overdrawn nostro accounts - unsecured 12,598 60,628
8,376,740 17,274,979 14.2.1 This facility is secured against demand promissory note executed in favour of the SBP. The effective mark-up rate is 8.5%
(2011: 10%) per annum payable on a quarterly basis.
14.2.2 These carry mark-up rate of 5% (2011: 5%) per annum payable on a quarterly basis.
14.2.3 These carry mark-up ranging from 5.5% to 10.1% (2011: 6.5% to 8.6%) per annum payable on a quarterly basis.
14.2.4 These carry mark-up rate of 5% (2011: 5%) per annum payable on a quarterly basis.
14.2.5 This represents running finance facility of ASL obtained from MCB Bank Limited, secured against lien on its term deposits. The mark-up rate is 6 months KIBOR plus 1.37% per annum payable on quarterly basis with maturity upto 1 month.
14.2.6 These represent borrowings at mark-up rate of 8.75% (2011: Nil) per annum and have maturity upto seven days.
Rupees in ‘000 2012 2011
15. DEPOSITS AND OTHER ACCOUNTS
Customers Fixed deposits 75,647,191 89,523,862 Savings deposits 155,646,270 141,026,934 Current accounts - non-remunerative 62,694,946 56,631,386 Special exporters’ account 22,282 11,509 Margin accounts 2,316,551 2,416,273 Others 398,989 380,598 Financial institutions Remunerative deposits 9,381,065 1,507,056 Non-remunerative deposits 822,435 1,777
306,929,729 291,499,395
15.1 Particulars of deposits
In local currency 274,493,724 256,917,236 In foreign currencies 32,436,005 34,582,159
306,929,729 291,499,395
Deposits include Rs. 18,623,646 thousand (2011: Rs. 19,755,378 thousand) due to related parties.
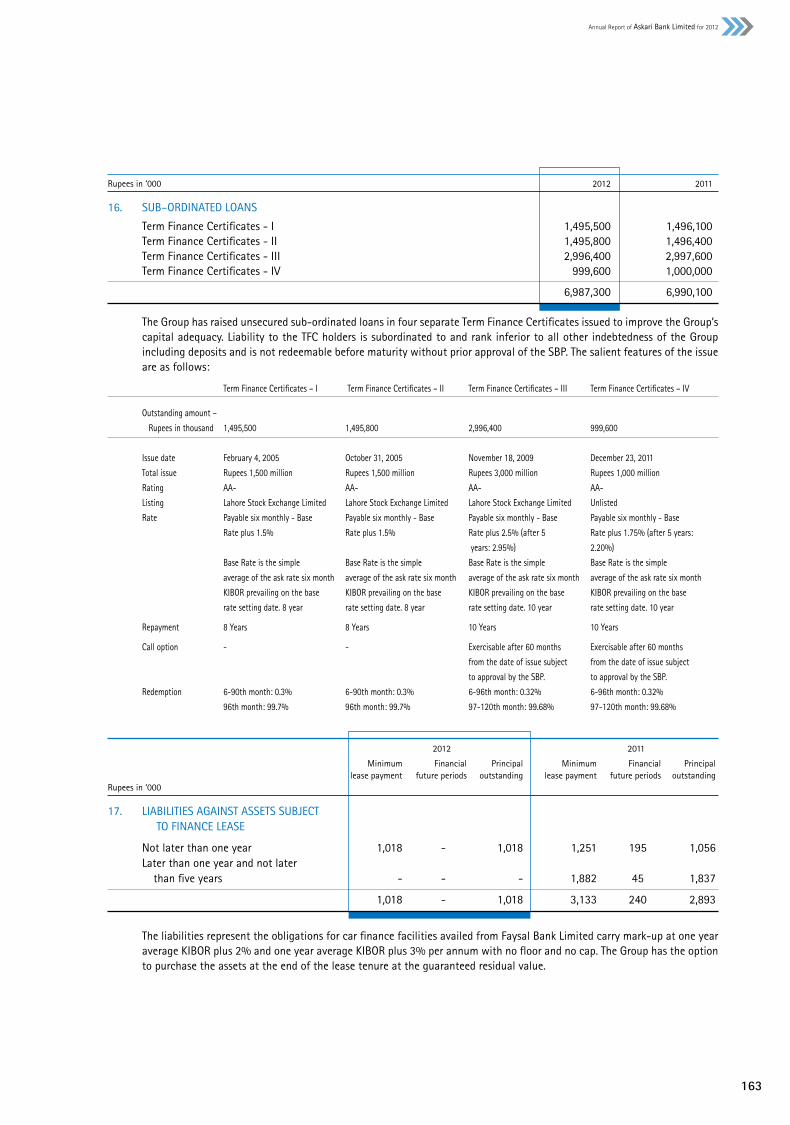
163
Annual Report of Askari Bank Limited for 2012
Rupees in ‘000 2012 2011
16. SUB–ORDINATED LOANS
Term Finance Certificates - I 1,495,500 1,496,100 Term Finance Certificates - II 1,495,800 1,496,400 Term Finance Certificates - III 2,996,400 2,997,600 Term Finance Certificates - IV 999,600 1,000,000
6,987,300 6,990,100
The Group has raised unsecured sub-ordinated loans in four separate Term Finance Certificates issued to improve the Group’s capital adequacy. Liability to the TFC holders is subordinated to and rank inferior to all other indebtedness of the Group including deposits and is not redeemable before maturity without prior approval of the SBP. The salient features of the issue are as follows:
Term Finance Certificates – I Term Finance Certificates – II Term Finance Certificates – III Term Finance Certificates – IV
Outstanding amount –
Rupees in thousand 1,495,500 1,495,800 2,996,400 999,600
Issue date February 4, 2005 October 31, 2005 November 18, 2009 December 23, 2011
Total issue Rupees 1,500 million Rupees 1,500 million Rupees 3,000 million Rupees 1,000 million
Rating AA- AA- AA- AA-
Listing Lahore Stock Exchange Limited Lahore Stock Exchange Limited Lahore Stock Exchange Limited Unlisted
Rate Payable six monthly - Base Payable six monthly - Base Payable six monthly - Base Payable six monthly - Base
Rate plus 1.5% Rate plus 1.5% Rate plus 2.5% (after 5 Rate plus 1.75% (after 5 years:
years: 2.95%) 2.20%)
Base Rate is the simple Base Rate is the simple Base Rate is the simple Base Rate is the simple
average of the ask rate six month average of the ask rate six month average of the ask rate six month average of the ask rate six month
KIBOR prevailing on the base KIBOR prevailing on the base KIBOR prevailing on the base KIBOR prevailing on the base
rate setting date. 8 year rate setting date. 8 year rate setting date. 10 year rate setting date. 10 year
Repayment 8 Years 8 Years 10 Years 10 Years
Call option - - Exercisable after 60 months Exercisable after 60 months
from the date of issue subject from the date of issue subject
to approval by the SBP. to approval by the SBP.
Redemption 6-90th month: 0.3% 6-90th month: 0.3% 6-96th month: 0.32% 6-96th month: 0.32%
96th month: 99.7% 96th month: 99.7% 97-120th month: 99.68% 97-120th month: 99.68%
2012 2011
Minimum Financial Principal Minimum Financial Principal lease payment future periods outstanding lease payment future periods outstandingRupees in ‘000
17. LIABILITIES AGAINST ASSETS SUBJECT TO FINANCE LEASE
Not later than one year 1,018 - 1,018 1,251 195 1,056 Later than one year and not later than five years - - - 1,882 45 1,837
1,018 - 1,018 3,133 240 2,893
The liabilities represent the obligations for car finance facilities availed from Faysal Bank Limited carry mark-up at one year average KIBOR plus 2% and one year average KIBOR plus 3% per annum with no floor and no cap. The Group has the option to purchase the assets at the end of the lease tenure at the guaranteed residual value.

164
Notes to the Consolidated Financial StatementsFor the year ended December 31, 2012
Rupees in ‘000 Note 2012 2011
18. DEFERRED TAX LIABILITIES
Deferred credits / (debits) arising due to: Accelerated tax depreciation 610,110 716,235 Assets subject to finance lease (356) (121) Provision for staff benefits (350) (3,119) Provision against non-performing advances - excess of 1% of total advances (651,007) (404,730) - classified in sub-standard category (5,867) 7,883 Unused tax losses (38,069) (37,787)
(85,539) 278,361 Surplus / (deficit) on revaluation of available for sale securities 168,678 (231,453)
83,139 46,908
19. OTHER LIABILITIES
Mark-up / return / interest payable in local currency 1,837,570 2,059,529 Mark-up / return / interest payable in foreign currencies 17,051 76,145 Unearned income / commission 168,876 188,368 Accrued expenses 703,274 350,920 Advance payments 59,315 52,068 Security deposit against lease / Ijarah financing 2,378,387 3,044,275 Unclaimed dividends 38,371 39,157 Branch adjustment account 858,692 622,392 Payable to defined benefit plan 35 9,475 3,336 Payable to defined contribution plan 14 22,376 Payable against purchase of listed shares 169,289 179,406 Withholding taxes payable 39,818 44,362 Federal excise duty payable 3 2,503 Workers’ Welfare Fund 185,199 108,000 Others 840,477 620,718
7,305,811 7,413,555 20. SHARE CAPITAL
20.1 Authorized capital
2012 2011 Rupees in ‘000
Number of shares
1,300,000,000 1,300,000,000 Ordinary shares of Rs. 10 each 13,000,000 13,000,000
20.2 Issued, subscribed and paid up capital
2012 2011
Number of shares Ordinary shares of Rs. 10 each:
67,500,000 67,500,000 Fully paid in cash 675,000 675,000 717,297,769 611,245,019 Issued as bonus shares 7,172,978 6,112,451 28,273,315 28,273,315 Issued on ALL merger 282,733 282,733
813,071,084 707,018,334 8,130,711 7,070,184
20.3 Capital Risk Management
The Group’s objectives when managing capital are to safeguard the Group’s ability to continue as a going concern in order to provide returns for shareholders and benefits for other stakeholders and to maintain an optimal capital structure to reduce the cost of capital. In order to maintain or adjust the capital structure, the Group may adjust the amount of dividend paid to shareholders, return capital to shareholders, issue new shares or sell assets to reduce debt.
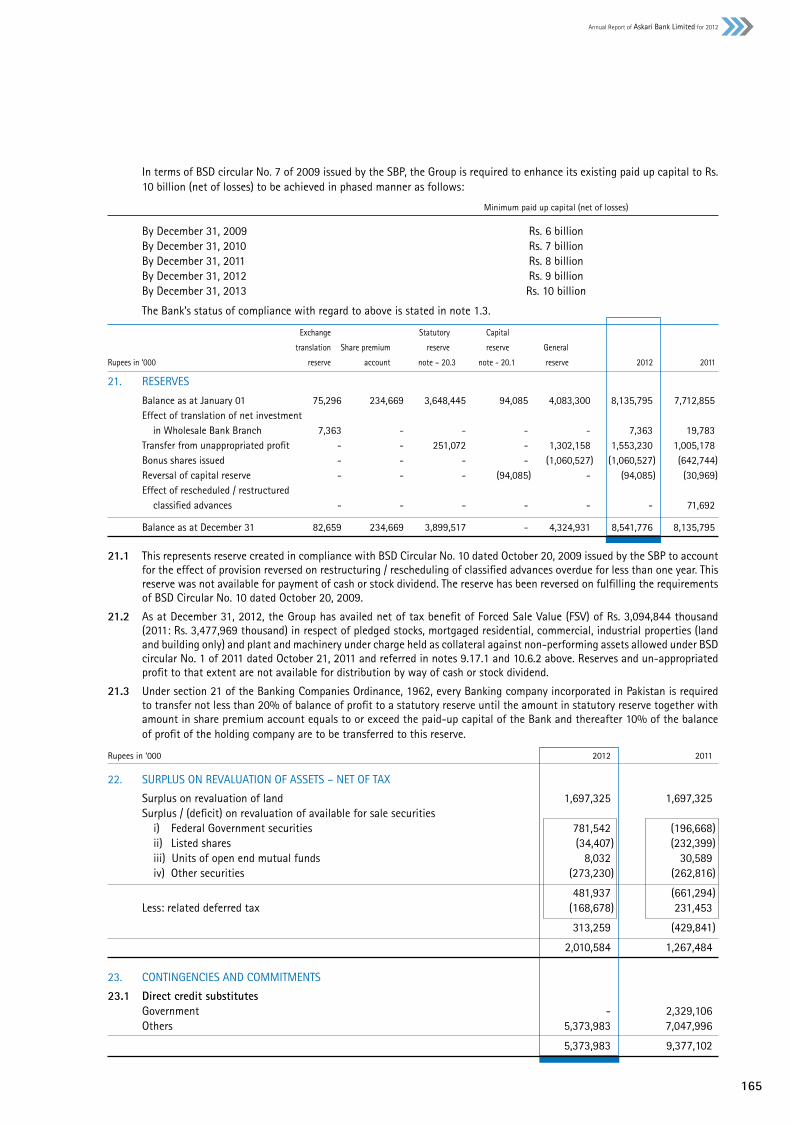
165
Annual Report of Askari Bank Limited for 2012
In terms of BSD circular No. 7 of 2009 issued by the SBP, the Group is required to enhance its existing paid up capital to Rs. 10 billion (net of losses) to be achieved in phased manner as follows:
Minimum paid up capital (net of losses)
By December 31, 2009 Rs. 6 billion By December 31, 2010 Rs. 7 billion By December 31, 2011 Rs. 8 billion By December 31, 2012 Rs. 9 billion By December 31, 2013 Rs. 10 billion
The Bank’s status of compliance with regard to above is stated in note 1.3.
Exchange Statutory Capital
translation Share premium reserve reserve General
Rupees in ‘000 reserve account note – 20.3 note - 20.1 reserve 2012 2011
21. RESERVES
Balance as at January 01 75,296 234,669 3,648,445 94,085 4,083,300 8,135,795 7,712,855 Effect of translation of net investment in Wholesale Bank Branch 7,363 - - - - 7,363 19,783 Transfer from unappropriated profit - - 251,072 - 1,302,158 1,553,230 1,005,178 Bonus shares issued - - - - (1,060,527) (1,060,527) (642,744) Reversal of capital reserve - - - (94,085) - (94,085) (30,969) Effect of rescheduled / restructured classified advances - - - - - - 71,692
Balance as at December 31 82,659 234,669 3,899,517 - 4,324,931 8,541,776 8,135,795
21.1 This represents reserve created in compliance with BSD Circular No. 10 dated October 20, 2009 issued by the SBP to account for the effect of provision reversed on restructuring / rescheduling of classified advances overdue for less than one year. This reserve was not available for payment of cash or stock dividend. The reserve has been reversed on fulfilling the requirements of BSD Circular No. 10 dated October 20, 2009.
21.2 As at December 31, 2012, the Group has availed net of tax benefit of Forced Sale Value (FSV) of Rs. 3,094,844 thousand (2011: Rs. 3,477,969 thousand) in respect of pledged stocks, mortgaged residential, commercial, industrial properties (land and building only) and plant and machinery under charge held as collateral against non-performing assets allowed under BSD circular No. 1 of 2011 dated October 21, 2011 and referred in notes 9.17.1 and 10.6.2 above. Reserves and un-appropriated profit to that extent are not available for distribution by way of cash or stock dividend.
21.3 Under section 21 of the Banking Companies Ordinance, 1962, every Banking company incorporated in Pakistan is required to transfer not less than 20% of balance of profit to a statutory reserve until the amount in statutory reserve together with amount in share premium account equals to or exceed the paid-up capital of the Bank and thereafter 10% of the balance of profit of the holding company are to be transferred to this reserve.
Rupees in ‘000 2012 2011
22. SURPLUS ON REVALUATION OF ASSETS – NET OF TAX
Surplus on revaluation of land 1,697,325 1,697,325 Surplus / (deficit) on revaluation of available for sale securities i) Federal Government securities 781,542 (196,668) ii) Listed shares (34,407) (232,399) iii) Units of open end mutual funds 8,032 30,589 iv) Other securities (273,230) (262,816)
481,937 (661,294) Less: related deferred tax (168,678) 231,453
313,259 (429,841)
2,010,584 1,267,484 23. CONTINGENCIES AND COMMITMENTS
23.1 Direct credit substitutes Government - 2,329,106 Others 5,373,983 7,047,996
5,373,983 9,377,102

166
Notes to the Consolidated Financial StatementsFor the year ended December 31, 2012
Rupees in ‘000 2012 2011
23.2 Transaction–related contingent liabilities
Money for which the group is contingently liable:
a) Contingent liability in respect of guarantees given on behalf of directors or officers or any of them (severally or jointly) with any other person, subsidiaries and associated undertakings. 233,955 270,352
b) Contingent liability in respect of guarantees given, favouring:
i) Government 79,212,961 54,928,965 ii) Banks and other financial institutions 808,020 744,007 iii) Others 13,813,083 15,582,567
93,834,064 71,255,539
94,068,019 71,525,891
These include guarantees amounting to Rs. 901,381 thousand (2011: Rs. 890,769 thousand) issued in the normal course of business which are in litigations, wherein the Group has been merely impleaded and is not a party to the dispute
Rupees in ‘000 2012 2011
23.3 Trade–related contingent liabilities 44,442,449 36,629,023
23.4 Other contingencies
23.4.1 These represent certain claims by third parties against the Group, which are being contested in the Courts of law. The management is of the view that these relate to the normal course of business and are not likely to result in any liability against the Group. 615,701 649,430
23.4.2 The Bank is contesting a case filed against it and some of its employees in the Sindh High Court for declaration and damages. Based on outside legal advice, the case of declaration is likely to be decided in Bank’s favor. However, in case of award of damages, the potential liability of the Bank is estimated at not more than Rs. 100 million.
23.4.3 The Competition Commission of Pakistan (CCP) in an order dated June 28, 2012 has penalized 1 Link (Guarantee) Limited and its member banks for allegedly following uncompetitive behaviour and imposition of uniform cost on cash withdrawals from ATMs; Askari Bank’s share of such penalty is Rs. 50 million. The Bank along with other banks has filed a constitutional petition before the honorable Sindh High Court, which has suspended the order of CCP till next hearing date.
23.5 Tax contingencies
i) For the Tax Years 2005 to 2008, there is a contingent liability of Rs. 681 million on account of amendment to assessments carried out by the Tax Department in the matters of taxation of commission & brokerage income at corporate tax rate instead of final tax regime and allocating financial expenses to exempt income and income taxable at a lower rate. Such issues have however been decided in the Bank’s favour by the CIR (A) for the Tax Year 2008 except for the matter of allocation of financial expenses. The Bank’s appeals are pending decision by the ATIR with respect to matters not decided in its favour.
ii) ASL appealed before the Appellate Tribunal Inland Revenue (ATIR) against the order passed by the Commissioner Inland Revenue (Appeals) [CIR(A)] related to tax year 2006 assessing net income at Rs. 27,486,803 against the declared loss of Rs. 9,306,446 due to disallowing provision for doubtful debts and commission expense resulting in income tax demand of Rs. 9,565,724. The ATIR has directed the CIR(A) to re-examine the case and issue a fresh appellate order. The matter is pending adjudication by the CIR(A).
iii) Group’s share of income tax demand of Rs. 1,794 thousand, not acknowledged as debt, has been challenged by AGICO and is currently in appeal; AGICO expects favourable outcome of appeal.
Rupees in ‘000 2012 2011
23.6 Commitments in respect of forward lending
Commitments against “REPO” transactions Purchase and resale agreements 5,823,130 362,147 Sale and repurchase agreements - 7,953,517
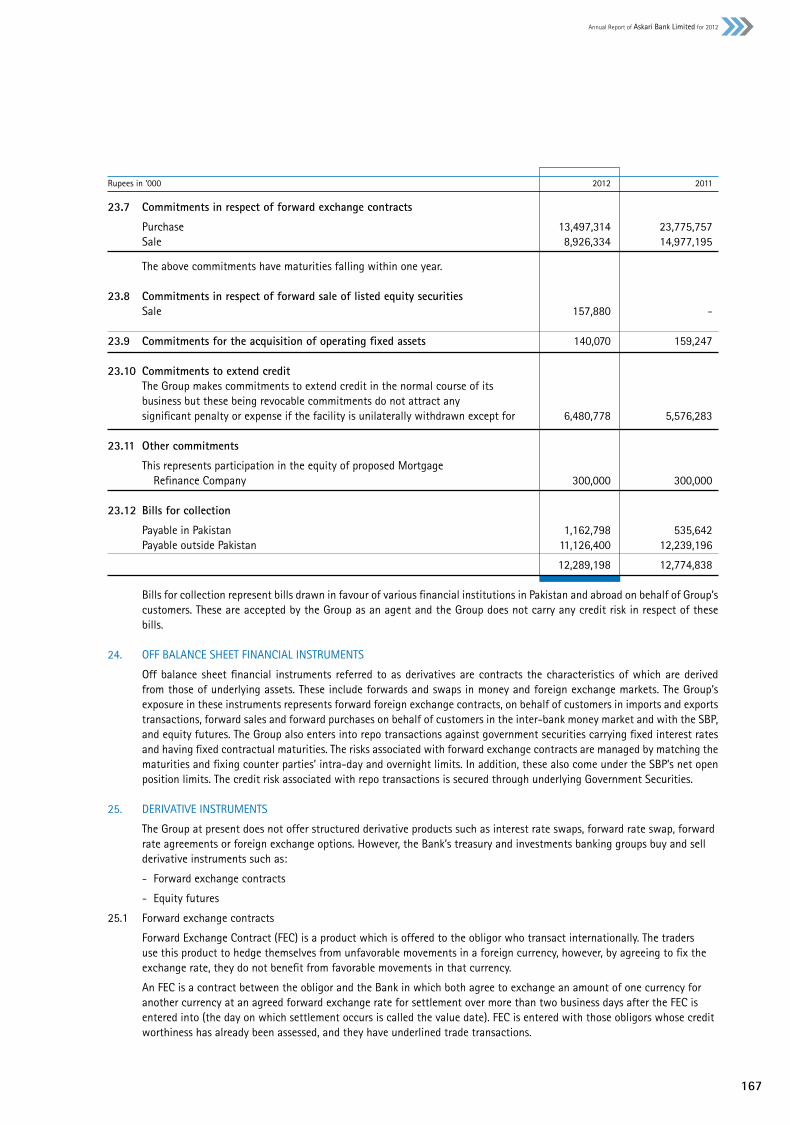
167
Annual Report of Askari Bank Limited for 2012
Rupees in ‘000 2012 2011
23.7 Commitments in respect of forward exchange contracts
Purchase 13,497,314 23,775,757 Sale 8,926,334 14,977,195
The above commitments have maturities falling within one year.
23.8 Commitments in respect of forward sale of listed equity securities Sale 157,880 -
23.9 Commitments for the acquisition of operating fixed assets 140,070 159,247
23.10 Commitments to extend credit The Group makes commitments to extend credit in the normal course of its business but these being revocable commitments do not attract any significant penalty or expense if the facility is unilaterally withdrawn except for 6,480,778 5,576,283 23.11 Other commitments
This represents participation in the equity of proposed Mortgage Refinance Company 300,000 300,000 23.12 Bills for collection
Payable in Pakistan 1,162,798 535,642 Payable outside Pakistan 11,126,400 12,239,196
12,289,198 12,774,838 Bills for collection represent bills drawn in favour of various financial institutions in Pakistan and abroad on behalf of Group’s
customers. These are accepted by the Group as an agent and the Group does not carry any credit risk in respect of these bills.
24. OFF BALANCE SHEET FINANCIAL INSTRUMENTS
Off balance sheet financial instruments referred to as derivatives are contracts the characteristics of which are derived from those of underlying assets. These include forwards and swaps in money and foreign exchange markets. The Group’s exposure in these instruments represents forward foreign exchange contracts, on behalf of customers in imports and exports transactions, forward sales and forward purchases on behalf of customers in the inter-bank money market and with the SBP, and equity futures. The Group also enters into repo transactions against government securities carrying fixed interest rates and having fixed contractual maturities. The risks associated with forward exchange contracts are managed by matching the maturities and fixing counter parties’ intra-day and overnight limits. In addition, these also come under the SBP’s net open position limits. The credit risk associated with repo transactions is secured through underlying Government Securities.
25. DERIVATIVE INSTRUMENTS
The Group at present does not offer structured derivative products such as interest rate swaps, forward rate swap, forward rate agreements or foreign exchange options. However, the Bank’s treasury and investments banking groups buy and sell derivative instruments such as:
- Forward exchange contracts
- Equity futures
25.1 Forward exchange contracts
Forward Exchange Contract (FEC) is a product which is offered to the obligor who transact internationally. The traders use this product to hedge themselves from unfavorable movements in a foreign currency, however, by agreeing to fix the exchange rate, they do not benefit from favorable movements in that currency.
An FEC is a contract between the obligor and the Bank in which both agree to exchange an amount of one currency for another currency at an agreed forward exchange rate for settlement over more than two business days after the FEC is entered into (the day on which settlement occurs is called the value date). FEC is entered with those obligors whose credit worthiness has already been assessed, and they have underlined trade transactions.

168
Notes to the Consolidated Financial StatementsFor the year ended December 31, 2012
If the relevant exchange rate moves un-favourably, the Bank will loose money, and obligor will benefit from that movement because the Bank must exchange currencies at the FEC rate. In order to mitigate this risk of adverse exchange rate movement, the Bank hedges its exposure by taking forward position in inter-bank foreign exchange.
25.2 Equity futures
An equity futures contract is a standardized contract, traded on a futures counter of the stock exchange, to buy or sell a certain underlying scrip at a certain date in the future, at a specified price.
The Bank uses equity futures as a hedging instrument to hedge its equity portfolio, in both held for trading and available for sale, against equity price risk. Only selected shares are allowed to be traded on futures exchange. Equity futures give flexibility to the Bank either to take delivery on the future settlement date or to settle it by adjusting the notional value of the contract based on the current market rates. Maximum exposure limit to the equity futures is 10% of tier I capital of the Bank, based on prevailing SBP regulations.
The accounting policies used to recognize and disclose derivatives are given in note 5.16.
Rupees in ‘000 Note 2012 2011
26. MARK–UP / RETURN / INTEREST EARNED
On loans and advances to: i) Customers 26.1 17,423,089 17,704,368 ii) Financial institutions 45,910 86,448 On investments i) Available for sale securities 14,156,795 13,876,815 ii) Held to maturity securities 447,735 543,789 iii) Held for trading - 2,916 On deposits with financial institutions 153,189 191,556 On securities purchased under resale agreements 177,627 363,058
32,404,345 32,768,950 26.1 This includes an amount of Rs. 6,684 thousand (2011: Rs. 29,972 thousand) on account of income received from related
parties. Rupees in ‘000 Note 2012 2011
27. MARK–UP / RETURN / INTEREST EXPENSED
On deposits 27.1 19,109,875 18,815,726 On securities sold under repurchase agreements 2,228,432 2,010,892 On sub-ordinated loans 962,708 921,388 On call money borrowings 19,630 52,632 On refinance borrowings from SBP 597,847 834,023 On long term finance for export oriented projects from SBP 48,506 55,509 On other short term borrowings 6,387 8,919
22,973,385 22,699,089 27.1 This includes an amount of Rs. 2,328,062 thousand (2011: Rs. 1,324,696 thousand) on account of mark-up / interest on
deposits of related parties. Rupees in ‘000 2012 2011
28. GAIN ON SALE OF SECURITIES – NET
Federal Government Securities Market Treasury Bills 98,930 113,283 Pakistan Investment Bonds 473,013 26,825 Term Finance Certificates - 17,308 Shares - listed 203,835 (49,099) Others (87,354) 202,067
688,424 310,384

169
Annual Report of Askari Bank Limited for 2012
Rupees in ‘000 Note 2012 2011
29. OTHER INCOME
Rent on property 29.1 30,611 37,592 Gain on sale of operating fixed assets 9,598 2,216 Rent of lockers 16,211 17,450 Income from non-banking assets and profit from sale of non-banking assets 6,723 - Recovery of expenses from customers 306,301 284,253 Others 162,831 6,498
532,275 348,009 29.1 This includes an amount of Rs. 29,106 thousand (2011: Rs. 24,941 thousand) on account of rent received from related
parties. Rupees in ‘000 Note 2012 2011
30. ADMINISTRATIVE EXPENSES
Salaries, allowances, etc. 4,172,826 3,870,116 Charge for defined benefit plan 35.3 191,179 168,020 Contribution to defined contribution plan 36 146,324 130,040 Directors’ fees, allowances and other expenses 7,031 2,350 Rent, taxes, insurance, electricity, etc. 1,150,567 1,067,302 Legal and professional charges 70,541 57,386 Brokerage and commission 133,119 155,944 Communications 321,058 316,060 Repairs and maintenance 888,735 1,018,788 Stationery and printing 110,386 128,122 Advertisement and publicity 82,216 77,852 Donations - 16,000 Auditors’ remuneration 30.1 11,864 14,420 Depreciation 11.2 734,082 753,425 Amortization 11.2 141,380 77,423 Travelling and entertainment 105,973 79,614 Fuel and vehicle running expenses 543,333 462,842 Security service charges 270,802 263,847 Finance charges on leased assets 1,306 335 Other expenditure 143,841 127,495
9,226,563 8,787,381 30.1 Auditors’ remuneration
Audit fee - Parent 2,800 2,500 - Subsidiaries 700 675 Fee for the audit of Wholesale Bank Branch 2,214 2,096 Fee for the audit of provident and gratuity funds 167 121 Special certifications, half year review and the audit of consolidated financial statements 3,208 3,108 Tax services 1,815 5,112 Out-of-pocket expenses 960 808
11,864 14,420 31. OTHER CHARGES
Workers’ Welfare Fund 77,199 49,240 Penalties imposed by the State Bank of Pakistan 3,182 37,544
80,381 86,784

170
Notes to the Consolidated Financial StatementsFor the year ended December 31, 2012
Rupees in ‘000 2012 2011
32. TAXATION
For the year Current 840,813 833,523 Deferred (363,901) (83,786)
476,912 749,737
32.1 Relationship between tax expense and accounting profit Profit before taxation 1,766,057 2,454,944
Tax at applicable tax rate of 35 percent (2011: 35 percent) 618,120 859,230 Effect of: – Income chargeable to tax at lower rates (132,066) (72,367) – Permanent differences 1,114 12,872 - Minimum tax 1,669 - – Deferred tax not recognised by ASL 1,518 - – Deferred tax asset of prior years’ losses of AIML (615) (37,787) – Others (12,828) (12,211)
476,912 749,737 32.2 Tax status
i) The Bank has filed tax returns for and up to Tax Year 2012 (year ended 31 December 2011). The assessment for and up to Tax Year 2010 were amended by the Tax authorities mainly in the matters of admissibility of provisions against doubtful debts, diminution in the value of investments, bad debts written off, apportionment of expenses to income exempt from tax or taxable at a lower rate and basis of taxation of commission and brokerage income. The matter of provision against doubtful debts has been decided in favour of the Bank for and up to Tax Year 2006 up to the level of Appellate Tribunal Inland Revenue [ATIR] whereas partial relief has been provided by the Commissioner Inland Revenue (Appeals) [CIR(A)] on other matters. The Bank and the Tax Department have filed appeals and reference applications to the higher forums in relation to matters not decided in their favour.
Tax payments made in relation to the matters currently pending are being carried forward as management is confident of their realisation as and when the appeals are decided.
ii) Consequent upon the amalgamation with and into the Bank, the outstanding tax issues relating to erstwhile Askari Leasing Limited (ALL) are as follows:
Tax returns of ALL have been filed for and up to Tax Year 2010. The returns of ALL for the Tax Years 2003 to 2010 were amended by the tax authorities mainly in the matter of admissibility of initial allowance claimed on leased vehicles. On appeals filed by ALL, partial relief was provided by the CIR(A) by allowing initial allowance on commercial vehicles. Re-assessment has not yet been carried out by the Tax Department. A tax demand is however not likely to arise after re-assessment.
For and up to the Assessment Years 2002-2003, reference applications filed by the Tax Authorities in the matter of computation of lease income are pending decisions by the Honorable High Court. However the likelihood of an adverse decision is considered low due to a favorable decision of the High Court in a parallel case.
For and up to Assessment Year 2002-2003 and Tax Years 2003, 2004 and 2007 the Tax Department has filed appeals with the ATIR against the decision of CIR (A) that minimum tax was not chargeable on lease rentals / income. These are pending decision.
Rupees in ‘000 2012 2011
33. CASH AND CASH EQUIVALENTS
Cash and balances with treasury banks 24,435,422 26,168,206 Balances with other banks 8,865,303 6,236,116 Term deposits with MCB Bank 22,000 22,000
33,322,725 32,426,322

171
Annual Report of Askari Bank Limited for 2012
Rupees in ‘000 2012 2011
33.1 Cash flow from operating activities (direct method) Mark-up / return / interest and commission receipts 36,118,782 35,383,189 Mark-up / return / interest payments (23,254,438) (22,297,662) Cash payments to employees, suppliers and others (6,839,843) (7,865,829)
6,024,501 5,219,698 (Increase) / decrease in operating assets Lendings to financial institutions (4,727,890) 7,545,900 Held for trading securities (161,393) (1,418) Advances 3,743,856 (864,640) Other assets (excluding advance taxation) 426,565 (315,479)
(718,862) 6,364,363 Increase / (decrease) in operating liabilities Bills payable 944,124 (333,952) Borrowings (8,898,239) (8,279,798) Deposits 15,430,334 35,591,246 Other liabilities (excluding current taxation) (226,990) (1,130,596)
7,249,229 25,846,900
Cash flow before tax 12,554,868 37,430,961
Income tax paid (1,556,450) (958,118)
Net cash flow from operating activities 10,998,418 36,472,843
34. STAFF STRENGTH Number of employees
Permanent 4,360 4,557 Temporary / on contractual basis 1,277 1,448 Commission based 56 84
Bank’s own staff strength at end of the year 5,693 6,089 Outsourced 1,310 1,283
Total staff strength at end of the year 7,003 7,372
35. DEFINED BENEFIT PLAN
35.1 General description
The Bank and ASL operates approved funded gratuity schemes for all regular employees. Contributions are made in accordance with the actuarial recommendation.
The benefits under the gratuity schemes are payable on retirement at the age of 60 years or earlier cessation of service in lumpsum. The benefit is equal to one month’s last drawn basic salary for each year of eligible service or part thereof.
Rupees in ‘000 2012 2011
35.2 The amounts recognised in the unconsolidated statement of financial position are as follows:
Present value of defined benefit obligation 1,219,553 1,001,255 Fair value of plan assets (1,075,372) (866,311)
144,181 134,944 Unrecognized actuarial losses (134,706) (131,608)
Net liability 9,475 3,336 35.3 The amounts recognised in consolidated profit and loss account are as follows:
Current service cost 164,341 128,419 Interest on obligation 125,060 115,153 Expected return on plan assets (105,531) (91,152) Non-vested past service cost 349 - Actuarial loss recognised 6,960 15,600
191,179 168,020
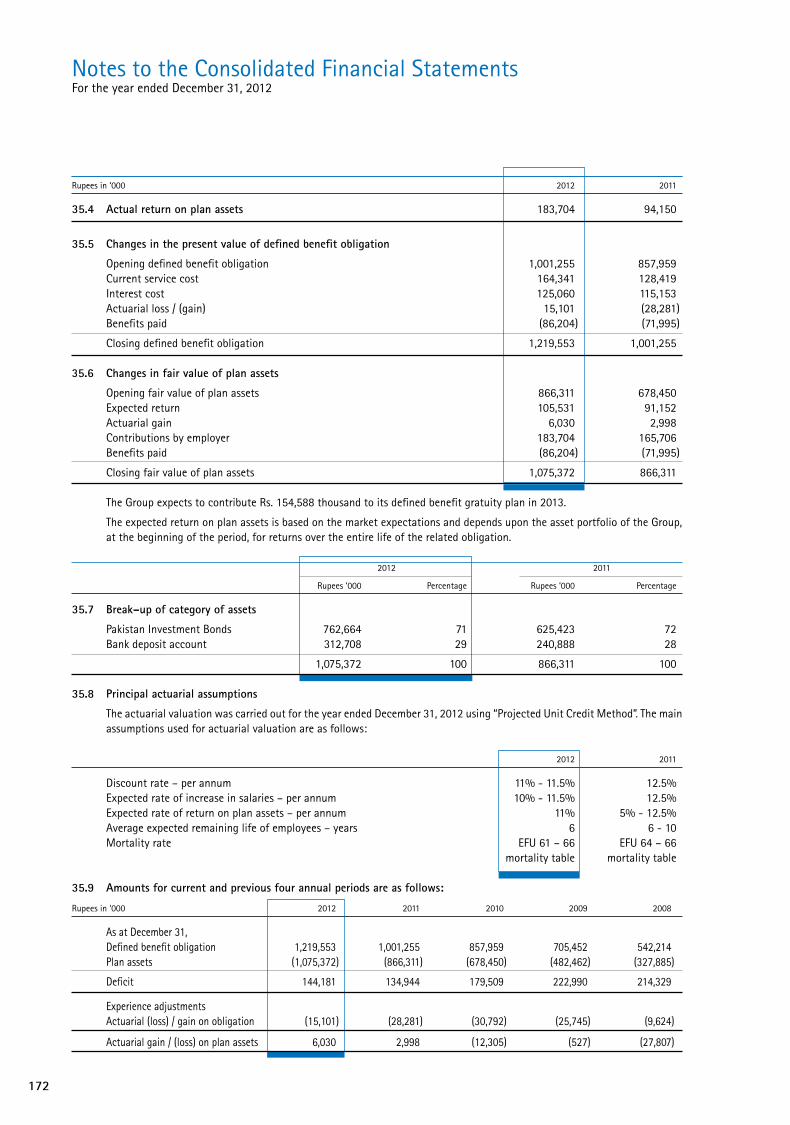
172
Notes to the Consolidated Financial StatementsFor the year ended December 31, 2012
Rupees in ‘000 2012 2011
35.4 Actual return on plan assets 183,704 94,150
35.5 Changes in the present value of defined benefit obligation
Opening defined benefit obligation 1,001,255 857,959 Current service cost 164,341 128,419 Interest cost 125,060 115,153 Actuarial loss / (gain) 15,101 (28,281) Benefits paid (86,204) (71,995)
Closing defined benefit obligation 1,219,553 1,001,255 35.6 Changes in fair value of plan assets
Opening fair value of plan assets 866,311 678,450 Expected return 105,531 91,152 Actuarial gain 6,030 2,998 Contributions by employer 183,704 165,706 Benefits paid (86,204) (71,995)
Closing fair value of plan assets 1,075,372 866,311 The Group expects to contribute Rs. 154,588 thousand to its defined benefit gratuity plan in 2013.
The expected return on plan assets is based on the market expectations and depends upon the asset portfolio of the Group, at the beginning of the period, for returns over the entire life of the related obligation.
2012 2011
Rupees ‘000 Percentage Rupees ‘000 Percentage
35.7 Break–up of category of assets
Pakistan Investment Bonds 762,664 71 625,423 72 Bank deposit account 312,708 29 240,888 28
1,075,372 100 866,311 100 35.8 Principal actuarial assumptions
The actuarial valuation was carried out for the year ended December 31, 2012 using “Projected Unit Credit Method”. The main assumptions used for actuarial valuation are as follows:
2012 2011
Discount rate – per annum 11% - 11.5% 12.5% Expected rate of increase in salaries – per annum 10% - 11.5% 12.5% Expected rate of return on plan assets – per annum 11% 5% - 12.5% Average expected remaining life of employees – years 6 6 - 10 Mortality rate EFU 61 – 66 EFU 64 – 66 mortality table mortality table 35.9 Amounts for current and previous four annual periods are as follows:
Rupees in ‘000 2012 2011 2010 2009 2008
As at December 31, Defined benefit obligation 1,219,553 1,001,255 857,959 705,452 542,214 Plan assets (1,075,372) (866,311) (678,450) (482,462) (327,885)
Deficit 144,181 134,944 179,509 222,990 214,329
Experience adjustments Actuarial (loss) / gain on obligation (15,101) (28,281) (30,792) (25,745) (9,624)
Actuarial gain / (loss) on plan assets 6,030 2,998 (12,305) (527) (27,807)

173
Annual Report of Askari Bank Limited for 2012
36. DEFINED CONTRIBUTION PLAN
The Bank operates a recognised provident fund scheme for all regular employees for which equal monthly contributions are made both by the Bank and by the employees to the fund at the rate of 8.33% of basic salary of the employee. Payments are made to the employees as specified in the rules of the fund. The total assets of the fund as at December 31, 2011 were Rs. 1,880,291 thousand (December 31, 2010: Rs. 1,541,256 thousand) as per latest available audited financial statements of the fund.
ASL operates a funded provident fund scheme for all its regular employees for which equal monthly contributions are made by the Company and the employees at the rate of 10% of basic salary of the employee.
37. COMPENSATED ABSENCES
37.1 General description
The Bank, AIML and ASL grant compensated absences to all regular employees as per effective Service Rules. Provisions are made in accordance with the actuarial recommendation.
Under this unfunded scheme, regular employees of the Bank are entitled to 30 days privilege leave for each completed year of service. Unutilized privilege leaves are accumulated upto a maximum of 120 days out of which 60 days are encashable at the time of separation from service on the basis of last drawn gross salary.
Under this unfunded scheme, regular employees of AIML are entitled to 4 weeks privilege leave for each completed year of service. Unutilized privilege leaves are accumulated upto a maximum of 8 weeks which are encashable at the time of separation from service on the basis of last drawn gross salary.
Under this unfunded scheme, category A and B employees and category C employees of ASL are entitled to 30 days and 15 days privilege leave for each completed year of service respectively. Unutilized privilege leaves are accumulated upto a maximum of 90 days and 45 days for category A and B employees and category C employees respectively which are encashable at the time of separation from service on the basis of last drawn gross salary.
37.2 Principal actuarial assumptions
The actuarial valuation was carried out for the year ended December 31, 2012 using “Projected Unit Credit Method”. Present value of obligation as at December 31, 2012 was Rs. 206,786 thousand against related liability of Rs. 189,207 thousand carried at December 31, 2012. Expense for the year of Rs. 19,020 thousand has been included under administrative expenses. The main assumptions used for actuarial valuation are as follows:
2012 2011
Discount rate – per annum 11% - 11.5% 12.5% Expected rate of increase in salaries – per annum 10% - 11.5% 12.5% Leave accumulation factor – days 5 - 11 5 - 11
38. COMPENSATION OF DIRECTORS AND EXECUTIVES
President & Chief Executive Directors Executives
Rupees in ‘000 2012 2011 2012 2011 2012 2011
Fees - - 6,826 2,350 225 100 Managerial remuneration 17,187 12,579 - - 894,669 605,742 Charge for defined benefit plan 1,354 1,128 - - 53,412 48,028 Contribution to defined contribution plan 1,354 1,048 - - 57,436 49,880 Rent and house maintenance 7,371 5,721 - - 284,467 260,317 Utilities 1,625 1,258 - - 61,658 57,848 Medical 1,625 1,258 - - 61,366 57,641 Special performance incentive / Bonus 3,622 2,256 - - 141,583 67,095 Others - - - - 3,428 4,567
34,138 25,248 6,826 2,350 1,558,224 1,151,218
Number of persons 1 1 10 10 530 560
Executives mean all executive employees, other than the chief executive and directors, whose basic salary exceeds five hundred thousand rupees in a financial year. Chief Executive is also provided with the Bank maintained car.
Further, senior executives are entitled to certain additional benefits in accordance with the Group’s policy.
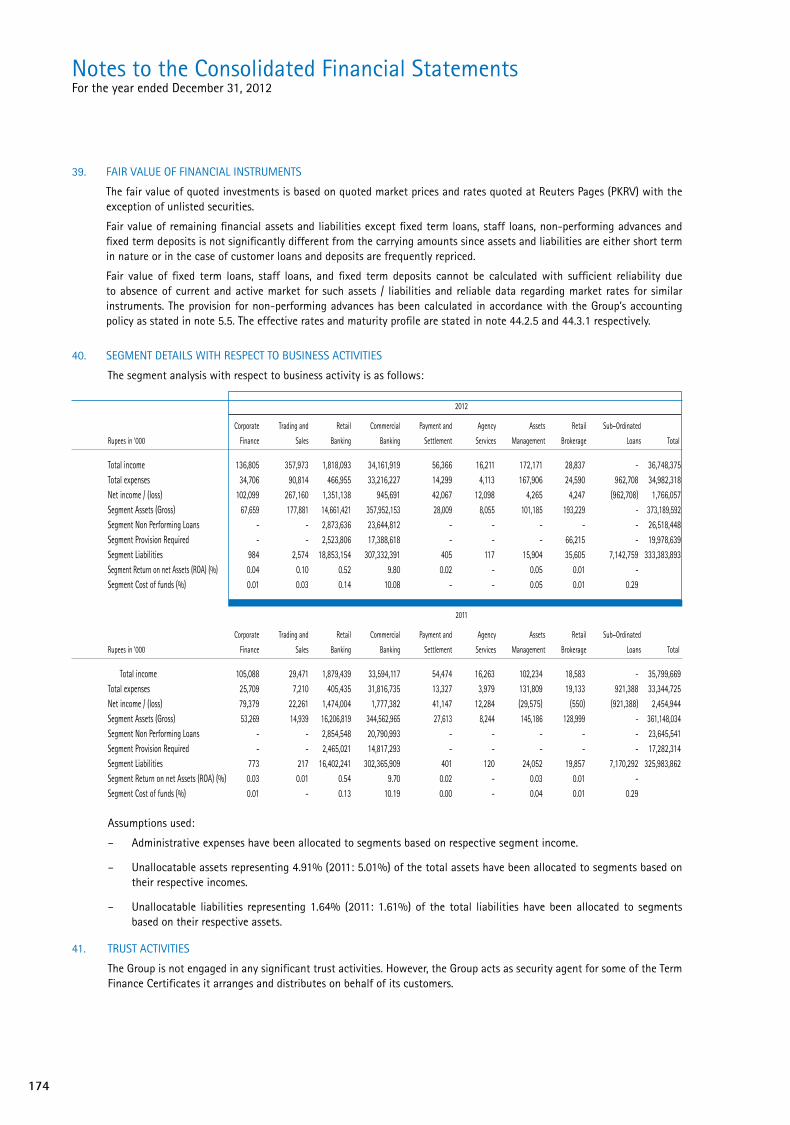
174
Notes to the Consolidated Financial StatementsFor the year ended December 31, 2012
39. FAIR VALUE OF FINANCIAL INSTRUMENTS
The fair value of quoted investments is based on quoted market prices and rates quoted at Reuters Pages (PKRV) with the exception of unlisted securities.
Fair value of remaining financial assets and liabilities except fixed term loans, staff loans, non-performing advances and fixed term deposits is not significantly different from the carrying amounts since assets and liabilities are either short term in nature or in the case of customer loans and deposits are frequently repriced.
Fair value of fixed term loans, staff loans, and fixed term deposits cannot be calculated with sufficient reliability due to absence of current and active market for such assets / liabilities and reliable data regarding market rates for similar instruments. The provision for non-performing advances has been calculated in accordance with the Group’s accounting policy as stated in note 5.5. The effective rates and maturity profile are stated in note 44.2.5 and 44.3.1 respectively.
40. SEGMENT DETAILS WITH RESPECT TO BUSINESS ACTIVITIES
The segment analysis with respect to business activity is as follows: 2012
Corporate Trading and Retail Commercial Payment and Agency Assets Retail Sub–Ordinated
Rupees in ‘000 Finance Sales Banking Banking Settlement Services Management Brokerage Loans Total
Total income 136,805 357,973 1,818,093 34,161,919 56,366 16,211 172,171 28,837 - 36,748,375 Total expenses 34,706 90,814 466,955 33,216,227 14,299 4,113 167,906 24,590 962,708 34,982,318 Net income / (loss) 102,099 267,160 1,351,138 945,691 42,067 12,098 4,265 4,247 (962,708) 1,766,057 Segment Assets (Gross) 67,659 177,881 14,661,421 357,952,153 28,009 8,055 101,185 193,229 - 373,189,592 Segment Non Performing Loans - - 2,873,636 23,644,812 - - - - - 26,518,448 Segment Provision Required - - 2,523,806 17,388,618 - - - 66,215 - 19,978,639 Segment Liabilities 984 2,574 18,853,154 307,332,391 405 117 15,904 35,605 7,142,759 333,383,893 Segment Return on net Assets (ROA) (%) 0.04 0.10 0.52 9.80 0.02 - 0.05 0.01 - Segment Cost of funds (%) 0.01 0.03 0.14 10.08 - - 0.05 0.01 0.29 2011
Corporate Trading and Retail Commercial Payment and Agency Assets Retail Sub–Ordinated
Rupees in ‘000 Finance Sales Banking Banking Settlement Services Management Brokerage Loans Total
Total income 105,088 29,471 1,879,439 33,594,117 54,474 16,263 102,234 18,583 - 35,799,669 Total expenses 25,709 7,210 405,435 31,816,735 13,327 3,979 131,809 19,133 921,388 33,344,725 Net income / (loss) 79,379 22,261 1,474,004 1,777,382 41,147 12,284 (29,575) (550) (921,388) 2,454,944 Segment Assets (Gross) 53,269 14,939 16,206,819 344,562,965 27,613 8,244 145,186 128,999 - 361,148,034 Segment Non Performing Loans - - 2,854,548 20,790,993 - - - - - 23,645,541 Segment Provision Required - - 2,465,021 14,817,293 - - - - - 17,282,314 Segment Liabilities 773 217 16,402,241 302,365,909 401 120 24,052 19,857 7,170,292 325,983,862 Segment Return on net Assets (ROA) (%) 0.03 0.01 0.54 9.70 0.02 - 0.03 0.01 - Segment Cost of funds (%) 0.01 - 0.13 10.19 0.00 - 0.04 0.01 0.29
Assumptions used:
– Administrative expenses have been allocated to segments based on respective segment income.
– Unallocatable assets representing 4.91% (2011: 5.01%) of the total assets have been allocated to segments based on their respective incomes.
– Unallocatable liabilities representing 1.64% (2011: 1.61%) of the total liabilities have been allocated to segments based on their respective assets.
41. TRUST ACTIVITIES
The Group is not engaged in any significant trust activities. However, the Group acts as security agent for some of the Term Finance Certificates it arranges and distributes on behalf of its customers.

175
Annual Report of Askari Bank Limited for 2012
42. RELATED PARTY TRANSACTIONS
Army Welfare Trust (AWT) holds 50.57% (2011: 50.57%) of the Bank’s share capital at the year end. The Group has related party relationships with entities under common directorship, its directors, key management personnel, entities over which the directors are able to exercise significant influence and employees’ funds.
Banking transactions with the related parties are executed substantially on the same terms, including mark-up rates and collateral, as those prevailing at the time for comparable transactions with unrelated parties and do not involve more than normal risk (i.e. under the comparable uncontrolled price method) other than those under terms of employment.
Details of transactions with related parties and balances with them at the year end were as follows:
December 31, 2012 December 31, 2011
Companies Companies with common with common Key directorship Key directorship management having equity Associated Employee management having equity Associated Employees Rupees in ‘000 Parent Personnel Directors under 20% company funds Parent Personnel Directors under 20% company funds
Balances outstanding at the year end - Advances - 111,092 6,011 145 - - - 117,472 15,130 291 - - - Deposits 17,755,898 28,306 39,306 349,635 405,377 52,611 19,327,756 43,868 98,100 171,830 46,865 68,014 - Outstanding commitments and contingent liabilities for irrevocable commitments and contingencies - - - 233,955 - - 277,859 - - 270,352 - - - Investment in shares / units - at cost - - - 1,770,695 353,492 - - - - 1,614,504 53,703 - - Security deposits against lease - - - 132 - - - - - 132 - - - Investment in TFCs issued by the Bank - - - - 3,659 - - - - - 3,661 - - Reimbursable expenses on behalf of Askari High Yield Scheme - - - 2,602 - - - - - 1,705 - - - Management fee and commission receivable from Askari High Yield Scheme - - - 2,405 - - - - - 2,418 - - - Reimbursable expenses on behalf of Askari Asset Allocation Fund - - - 150 - - - - - 285 - - - Management fee and commission receivable from Askari Asset Allocation Fund - - - 461 - - - - - 430 - - - Reimbursable expenses on behalf of Askari Islamic Income Fund - - - - - - - - - 62 - - - Management fee and commission receivable from Askari Islamic Income Fund - - - 1,046 - - - - - 389 - - - Reimbursable expenses on behalf of Askari Islamic Asset Allocation Fund - - - 88 - - - - - 47 - - - Management fee and commission receivable from Askari Islamic Asset Allocation Fund - - - 392 - - - - - 292 - - - Reimbursable expenses on behalf of Askari Sovereign Cash Fund - - - - - - - - - 996 - - - Management fee and commission receivable from Askari Sovereign Cash Fund - - - 4,655 - - - - - 6,224 - - - Reimbursable expenses on behalf of Askari Equity Fund - - - 1,002 - - - - - 1,010 - - - Management fee and commission receivable Askari Equity Fund 347 - - - - - - - - - - - - Management fee and commission receivable Askari Sovereign Yield Enhancer 1,883 - - - - - - - - - - - - Reimbursable expenses on behalf of Askari Sovereign Yield Enhancer - - - 1,349 - - - - - 1,010 - - - Pre-paid insurance premium by AIML - - - - - - - - - 197 - - Payable to employee funds by AIML - - - - - - - - - - - 3,337 Transactions during the year - Net mark-up / interest earned - 6,312 754 14 - - - 7,570 1,060 21,269 - - - Net mark-up / interest expensed 2,275,211 1,413 8,481 23,832 5,148 13,977 1,280,129 1,523 8,313 25,307 4,914 2,568 - Rent received against operating lease - - - - - - - 9,583 - - - Contribution to employees’ funds - - - - - 337,503 - - - - - 298,060 - Investment made in units of AIML funds - at cost - (net) - - - - - - - 38,106 - - - Investment in units of AIML funds - purchase - 16,211,000 - - - Investment in units of AIML funds - sale - 15,982,760 - - - Rent of property / service charges received 19,398 - - 4,764 5,412 - 15,629 - - 4,392 4,494 - - Rent of property / service charges paid 67,737 - - 70,277 607 - 71,355 - - 77,062 - - - Remuneration paid - 234,849 - - - - - 205,827 - - - - - Post employment benefits - 18,469 - - - - - 15,766 - - - - - Insurance claim received - - - - 317 - - - - - 424 - - Insurance premium paid - - - - 27,690 - - - - 768 47,924 - - Dividend Income - - - 398,644 - - - - - 62,971 - - - Security services costs - - - 198,950 - - - - - 189,080 - - - Fee, commission and brokerage income - - - 161,643 169 - 2 - 19 95,639 21 - - Lease rentals paid - - - - - - - - - - Fees paid - - 6,826 - - - - 100 2,350 - - -

176
Notes to the Consolidated Financial StatementsFor the year ended December 31, 2012
43. CAPITAL ADEQUACY
43.1 Scope of application
Standardized approach is used for calculating the capital adequacy for market and credit risk while basic indicator approach (BIA) is used for operational risk capital adequacy purpose.
The Bank has two subsidiaries, Askari Investment Management Limited (AIML) and Askari Securities Limited (ASL). AIML is the wholly-owned subsidiary of AKBL, while ASL is 74% owned by the Bank. Both these entities are included while calculating capital adequacy for the Group using full consolidation method. The fact that the Group has neither any significant minority investments in banking, securities, or any other financial entities excludes it from a need for further consolidation. Furthermore, the Group does not indulge in any securitization activity that shields it from the risk inherent in securitization.
43.2 Capital management
The objective of managing capital is to safeguard the Group’s ability to continue as a going concern, so that it could continue to provide adequate returns to shareholders by pricing products and services commensurately with the level of risks. It is the policy of the Group to maintain a strong capital base so as to maintain investor, creditor and market confidence and to sustain future development of the business. The impact of the level of capital on shareholders’ return is also recognised and the Group recognises the need to maintain a balance between the higher returns that might be possible with greater gearing and the advantages and security afforded by a sound capital position.
Goals of managing capital
The goals of managing capital of the Bank are as follows:
- To be an appropriately capitalised institution, considering the requirements set by the regulators of the banking markets where the Group operates;
- Maintain strong ratings and to protect the Group against unexpected events;
- Availability of adequate capital at a reasonable cost so as to enable the Group to operate adequately and provide reasonable value added for the shareholders and other stakeholders;
Bank’s regulatory capital analysed into three tiers
Tier I capital, which includes fully paid-up capital, share premium, reserves (excluding foreign exchange translation reserves) and unappropriated profits (net of losses) etc. after deductions for certain specified items such as book value of intangibles, 50% of other deductions e.g., majority and significant minority investments in insurance and other financial entities.
Tier II capital, includes sub-ordinated debt subject to a maximum of 50% of total Tier I capital and fulfillment of specified criteria laid down by the SBP, general provisions for loan losses and capital reserves originated by restructuring of facilities (up to a maximum of 1.25 % of total risk weighted assets), reserves on the revaluation of fixed assets and equity investments after deduction of deficit on available for sale investments (up to a maximum of 45 percent), foreign exchange translation reserves etc. 50% of other deductions noted above are also made from Tier II capital.
Tier III supplementary capital, which consists of short term sub-ordinated debt solely for the purpose of meeting a proportion of the capital requirements for market risks. The Group currently does not have any Tier III capital.
The total of Tier II and Tier III capital has to be limited to Tier I capital.
Banking operations are categorised as either trading book or banking book and risk-weighted assets are determined according to specified requirements of the SBP that seek to reflect the varying levels of risk attached to on-balance sheet and off-balance sheet exposures. The total risk-weighted exposures comprise the credit risk, market risk and operational risk.
On and off-balance sheet assets in the banking book are broken down to various asset classes for calculation of credit risk requirement. External ratings for assets, where available, are applied using the assessments by various External Credit Assessment Institutions (ECAIs) and aligned with appropriate risk buckets. Otherwise, the exposures are treated as unrated and relevant risk weights applied. In addition, there are fixed risk weights for certain types of exposures such as retail portfolio and residential mortgage finance for which external ratings are not applicable. Collaterals if any, are used as credit risk mitigant after applying appropriate haircuts under the comprehensive approach. Risk weights notified, are hence applied at adjusted exposures, wherever credit risk mitigation is available. Collaterals used include: Government of Pakistan guarantees, cash, lien on deposits, shares, government securities, bank and corporate guarantees and other debt securities that fall within the definition of eligible collaterals and also fulfill other specified criteria under the relevant capital adequacy guidelines.
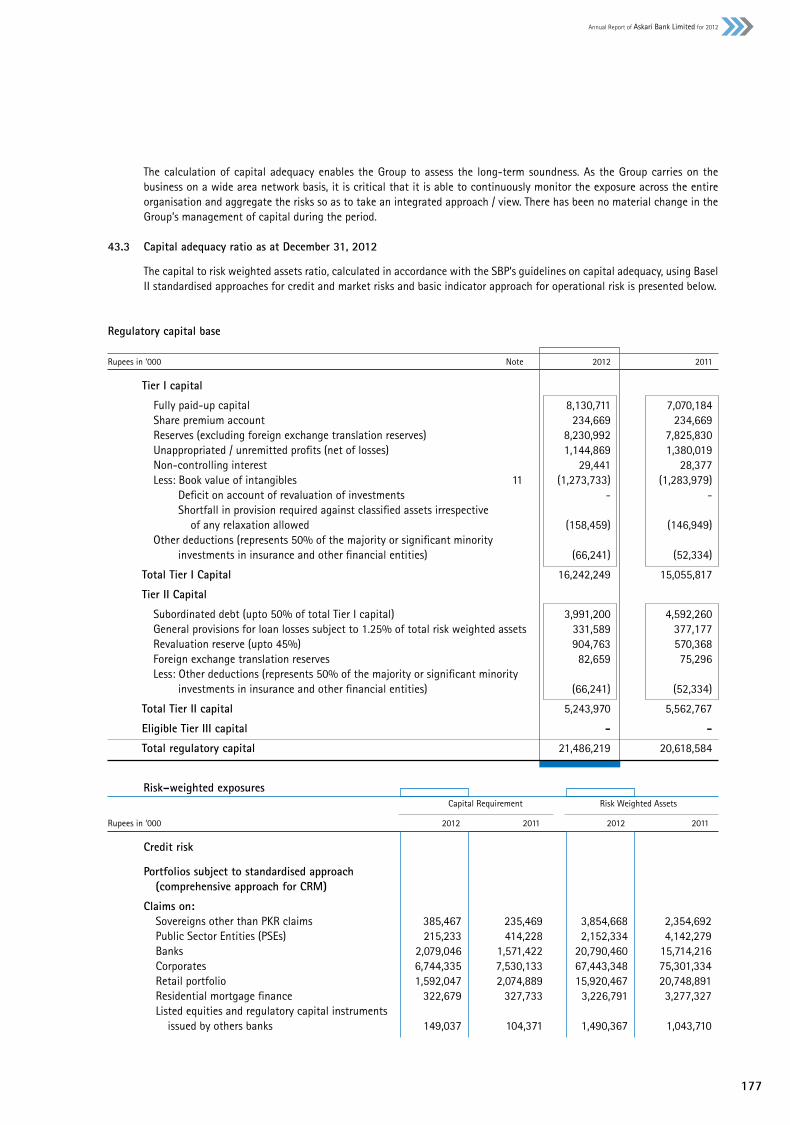
177
Annual Report of Askari Bank Limited for 2012
The calculation of capital adequacy enables the Group to assess the long-term soundness. As the Group carries on the business on a wide area network basis, it is critical that it is able to continuously monitor the exposure across the entire organisation and aggregate the risks so as to take an integrated approach / view. There has been no material change in the Group’s management of capital during the period.
43.3 Capital adequacy ratio as at December 31, 2012
The capital to risk weighted assets ratio, calculated in accordance with the SBP’s guidelines on capital adequacy, using Basel II standardised approaches for credit and market risks and basic indicator approach for operational risk is presented below.
Regulatory capital base
Rupees in ‘000 Note 2012 2011
Tier I capital
Fully paid-up capital 8,130,711 7,070,184 Share premium account 234,669 234,669 Reserves (excluding foreign exchange translation reserves) 8,230,992 7,825,830 Unappropriated / unremitted profits (net of losses) 1,144,869 1,380,019 Non-controlling interest 29,441 28,377 Less: Book value of intangibles 11 (1,273,733) (1,283,979) Deficit on account of revaluation of investments - - Shortfall in provision required against classified assets irrespective of any relaxation allowed (158,459) (146,949) Other deductions (represents 50% of the majority or significant minority investments in insurance and other financial entities) (66,241) (52,334)
Total Tier I Capital 16,242,249 15,055,817
Tier II Capital
Subordinated debt (upto 50% of total Tier I capital) 3,991,200 4,592,260 General provisions for loan losses subject to 1.25% of total risk weighted assets 331,589 377,177 Revaluation reserve (upto 45%) 904,763 570,368 Foreign exchange translation reserves 82,659 75,296 Less: Other deductions (represents 50% of the majority or significant minority investments in insurance and other financial entities) (66,241) (52,334)
Total Tier II capital 5,243,970 5,562,767
Eligible Tier III capital - -
Total regulatory capital 21,486,219 20,618,584
Risk–weighted exposures Capital Requirement Risk Weighted Assets
Rupees in ‘000 2012 2011 2012 2011
Credit risk
Portfolios subject to standardised approach (comprehensive approach for CRM)
Claims on: Sovereigns other than PKR claims 385,467 235,469 3,854,668 2,354,692 Public Sector Entities (PSEs) 215,233 414,228 2,152,334 4,142,279 Banks 2,079,046 1,571,422 20,790,460 15,714,216 Corporates 6,744,335 7,530,133 67,443,348 75,301,334 Retail portfolio 1,592,047 2,074,889 15,920,467 20,748,891 Residential mortgage finance 322,679 327,733 3,226,791 3,277,327 Listed equities and regulatory capital instruments issued by others banks 149,037 104,371 1,490,367 1,043,710

178
Notes to the Consolidated Financial StatementsFor the year ended December 31, 2012
Capital Requirement Risk Weighted Assets
Rupees in ‘000 2012 2011 2012 2011
Unlisted equity investments 7,399 28,707 73,992 287,072 Fixed assets 762,779 816,705 7,627,789 8,167,053 Other assets 620,820 587,001 6,208,199 5,870,006 Past due exposures 974,587 857,002 9,745,871 8,570,024 Forward foreign exchange contracts 22,028 52,280 220,278 522,795
Market risk Portfolios subject to standardised approach Interest rate risk 652,926 463,041 6,529,256 4,630,410 Equity position risk 1,059,371 671,436 10,593,714 6,714,359 Foreign exchange risk 122,736 11,913 1,227,363 119,134
Operational risk 2,379,343 2,279,178 23,793,434 22,791,784
TOTAL 18,089,833 18,025,508 180,898,331 180,255,086 Capital adequacy ratio
Total eligible regulatory capital held 21,486,219 20,618,584
Total risk weighted assets 180,898,331 180,255,086
Capital adequacy ratio 11.88% 11.44%
44. RISK MANAGEMENT
The Group believes that effective risk management is of primary importance to achieve desired level of return while maintaining acceptable level of risk exposure. Robust risk management processes and framework are in place to achieve overall the Group’s objectives through a well thought out strategy, which enables the Group to effectively manage, credit, market, operational and liquidity risk in a proactive manner.
The Group’s approach is to ensure that risk management is deeply and firmly embedded in the culture of the Group. All employees are therefore considered responsible for identification, measurement, monitoring and controlling risks within the scope of their assigned responsibilities. As a result of changing risk environment, the Group continuously monitors and conducts holistic assessment of complex transactions on an integrated basis.
The Group has a Board Risk Management Committee (BRMC) in place and the head of risk reports directly to BRMC for independent assurance. BRMC is responsible to review the extent of design and adequacy of risk management framework. BRMC oversees that risks are managed within the level of tolerance and risk appetite of the Group.
44.1 Credit Risk
Credit risk arises from the potential that an obligor is either unwilling to perform on an obligation or its ability is impaired resulting in economic loss to the Group. The Group takes necessary measures to control such risk by monitoring credit exposures, limiting transactions with specific counter parties with increased likelihood of default and continually assessing the creditworthiness of counter parties.
The Group has built and maintains a sound loan portfolio in terms of a well defined credit policy and credit risk policy approved by the board of directors. Its credit evaluation system comprises of well-designed credit appraisal, sanctioning and review procedures for the purpose of emphasizing prudence in its lending activities and ensuring quality of asset portfolio. Advances portfolio constitutes more than 40% of the total asset base and is also the largest source of credit risk for the Group. Moreover, more than 80% of the Group’s capital requirement pertains to credit risk. The Group’s advances portfolio is well diversified across various business segments, industries and geographical locations.
Risk mitigants have been put in place at all stages of credit risk cycle i.e. identification, measurement, monitoring, controlling and reporting for effective risk management. Accordingly, portfolio monitoring function is in place at the Group with dedicated resources to ensure that risk is not only minimized but is optimized in risk / return perspective.
Credit risk review is conducted at obligor as well as at portfolio level to ensure adherence to regulatory as well as the Group’s policies and procedures. The review process ensures that a sound and proactive risk management culture is maintained across the Group. Meanwhile, an advances review committee has been established at the Group. The committee comprises of the stakeholders from all the concerned functional units to oversee credit related activities across the Group.

179
Annual Report of Askari Bank Limited for 2012
44.1.1 Segment information
Segmental Information is presented in respect of the class of business and geographical distribution of advances, deposits, contingencies and commitments.
44.1.1.1 Segment by class of business
2012 2011
Contingencies and Contingencies and
Advances Deposits Commitments Advances Deposits Commitments
Rupees in ‘000 Percent Rupees in ‘000 Percent Rupees in ‘000 Percent Rupees in ‘000 Percent Rupees in ‘000 Percent Rupees in ‘000 Percent
Agriculture / agribusiness 6,545,640 4.02 3,036,944 0.99 421,169 0.23 7,138,183 4.26 2,730,231 0.94 1,719,902 1.00
Automobiles and allied 504,084 0.31 866,646 0.28 399,962 0.22 526,364 0.31 616,816 0.21 673,050 0.39
Cables / electronics 2,162,329 1.33 1,434,976 0.47 375,371 0.21 2,494,341 1.49 2,025,873 0.69 754,296 0.44
Carpets 293,689 0.18 54,742 0.02 23,139 0.01 232,465 0.14 59,962 0.02 18,223 0.01
Cement 1,143,231 0.70 933,570 0.30 541,912 0.30 3,472,314 2.07 96,673 0.03 387,690 0.23
Chemicals / pharmaceuticals 3,119,304 1.92 825,811 0.27 3,442,339 1.91 3,989,348 2.38 3,470,496 1.19 2,268,018 1.32
Engineering 642,006 0.39 326,487 0.11 2,167,073 1.20 640,408 0.38 54,064 0.02 1,590,685 0.93
Fertilizers 3,590,314 2.20 443,461 0.14 1,577,225 0.88 4,431,649 2.65 1,405,993 0.48 330,667 0.19
Food and allied 2,185,347 1.34 778,180 0.25 913,967 0.51 2,413,088 1.44 601,058 0.21 876,855 0.51
Fuel / energy 17,495,770 10.75 2,573,058 0.84 14,241,647 7.91 18,966,087 11.33 2,252,717 0.77 12,756,311 7.45
Ghee and edible oil 1,783,207 1.09 270,704 0.09 2,618,843 1.46 2,775,354 1.66 249,194 0.09 2,450,068 1.43
Glass and ceramics 1,389,070 0.85 42,653 0.01 40,002 0.02 1,457,187 0.87 14,837 0.01 55,067 0.03
Hotels and restaurants 491,390 0.30 681,293 0.22 17,425 0.01 212,492 0.13 438,449 0.15 32,999 0.02
Individuals 16,986,713 10.44 105,024,343 34.22 167,908 0.09 19,478,596 11.64 89,273,536 30.63 1,893,002 1.10
Insurance 10,185 0.01 529,751 0.17 500 0.00 32,933 0.02 187,179 0.06 - -
Financial institutions / investment companies 405,000 0.25 1,370,038 0.45 69,337,365 38.53 500,105 0.30 1,433,676 0.49 27,708,906 16.17
Leasing 5,835 0.00 11,049 - - - - - 1,472 - - -
Leather products and shoes 809,334 0.50 604,750 0.20 72,087 0.04 948,964 0.57 460,523 0.16 72,967 0.04
Modarabas - - 6 0.00 - - 37,609 0.02 27 0.00 1,197 0.00
Paper and board 593,518 0.36 86,049 0.03 114,198 0.06 517,738 0.31 239,823 0.08 221,637 0.13
Plastic products 586,983 0.36 114,349 0.04 299,154 0.17 678,668 0.41 57,240 0.02 415,629 0.24
Ready made garments 802,631 0.49 332,188 0.11 211,193 0.12 871,895 0.52 368,026 0.13 125,861 0.07
Real estate / construction 3,049,936 1.87 9,862,400 3.21 17,015,245 9.45 6,552,971 3.91 11,653,375 4.00 13,434,981 7.84
Rice processing and trading 2,515,494 1.54 898,041 0.29 383,880 0.21 2,849,218 1.70 765,519 0.26 534,022 0.31
Rubber products 149,588 0.09 117,901 0.04 108,559 0.06 151,078 0.09 36,715 0.01 229,176 0.13
Services (other than financial,
hotelling and travelling) 2,035,816 1.25 7,300,761 2.38 848,590 0.47 2,395,462 1.43 6,656,857 2.28 5,455,041 3.18
Sports goods 504,103 0.31 40,594 0.01 59,024 0.03 547,138 0.33 46,780 0.02 40,830 0.02
Sugar 171,702 0.11 94,123 0.03 1,777 0.00 82,510 0.05 73,450 0.03 3,550 0.00
Surgical equipment / metal products 5,779,211 3.55 1,203,519 0.39 320,227 0.18 5,766,500 3.45 426,596 0.15 1,008,454 0.59
Synthetic and rayon 566,460 0.35 95,444 0.03 4,953 0.00 455,108 0.27 109,963 0.04 153,933 0.09
Textile 22,082,644 13.56 1,968,746 0.64 3,672,852 2.04 23,443,856 14.01 2,457,414 0.84 7,972,087 4.65
Tobacco / cigarette manufacturing 5,122 0.00 5 0.00 - - 6,236 0.00 3,015 0.00 - -
Transport and communication 9,276,995 5.70 11,887,274 3.87 2,391,454 1.33 9,588,584 5.73 8,188,035 2.81 8,193,613 4.78
Travel agencies 64,054 0.04 59,486 0.02 544,456 0.30 60,973 0.04 76,262 0.03 209,016 0.12
Woolen 15,087 0.01 81,782 0.03 102,803 0.06 45,333 0.03 87,304 0.03 49,235 0.03
Public sector / Government 38,354,165 23.55 95,349,584 31.07 41,696,608 23.17 28,326,259 16.92 96,595,921 33.14 54,231,060 31.65
Others 16,739,626 10.28 57,629,021 18.78 15,842,801 8.80 15,294,232 9.14 58,284,324 19.99 25,417,564 14.86
162,855,583 100.00 306,929,729 100.00 179,975,708 100.00 167,381,246 100.00 291,499,395 100.00 171,285,592 100.00
44.1.1.2 Segment by sector
2012 2011
Contingencies and Contingencies and
Advances Deposits Commitments Advances Deposits Commitments
Rupees in ‘000 Percent Rupees in ‘000 Percent Rupees in ‘000 Percent Rupees in ‘000 Percent Rupees in ‘000 Percent Rupees in ‘000 Percent
Percent
Public sector / Government 38,354,165 23.55 95,349,584 31.07 41,696,608 23.17 28,326,259 16.92 96,595,921 33.14 54,231,060 31.66
Private 124,501,418 76.45 211,580,145 68.93 138,279,100 76.83 139,054,987 83.08 194,903,474 66.86 117,054,532 68.34
162,855,583 100.00 306,929,729 100.00 179,975,708 100.00 167,381,246 100.00 291,499,395 100.00 171,285,592 100.00

180
Notes to the Consolidated Financial StatementsFor the year ended December 31, 2012
44.1.1.3 Details of non–performing advances and specific provisions by class of business segment
2012 2011
Classified Specific Classified Specific
Rupees in ‘000 Advances Provision Held Advances Provision Held
Agriculture finances 862,287 255,120 308,274 - Automobiles and allied 469,131 264,643 459,357 208,841 Cables / electronics 1,154,254 1,130,357 1,177,820 1,014,126 Cement 406 406 87,107 64,417 Chemicals / pharmaceuticals 224,240 70,411 28,553 15,210 Financial institutions / investment companies - - 37,610 29,222 Food and allied 412,388 157,632 128,696 57,558 Fuel / energy 1,432,240 1,652,977 1,396,950 1,304,886 Glass manufacturing 1,110,342 1,110,342 1,110,342 981,588 Individuals 3,000,475 2,427,926 2,854,548 2,219,975 Leather products and shoes 54,877 48,135 53,984 36,483 Paper industries 19,904 1,477 19,999 - Real estate / construction 1,099,648 415,164 1,036,670 178,714 Services (other than financial, hotelling and travelling) 500,314 202,740 617,049 192,607 Sports goods 387,057 355,587 465,120 436,667 Textile 11,363,313 7,780,563 9,657,002 6,830,023 Transport and communication 322,669 317,316 328,277 321,733 Public sector / Government - - 1,658 829 Others 4,104,903 2,605,364 3,876,525 2,398,635
26,518,448 18,796,160 23,645,541 16,291,514
44.1.1.4 Details of non–performing advances and specific provisions by sector
Public sector / Government - - 1,658 829 Private 26,518,448 18,796,160 23,643,883 16,290,685
26,518,448 18,796,160 23,645,541 16,291,514
44.1.1.5 Geographical segment analysis
2012
Profit Contingencies
before Total assets Net assets and
Rupees in ‘000 taxation employed employed Commitments
Pakistan 1,550,715 346,991,426 19,630,095 179,975,708 Asia Pacific (including South Asia) - - - - Europe - - - - United States of America and Canada - - - - Middle East - Note 44.1.1.5.1 215,342 6,219,848 197,286 - Others - - - -
1,766,057 353,211,274 19,827,381 179,975,708

181
Annual Report of Askari Bank Limited for 2012
2011
Profit Contingencies
before Total assets Net assets and
Rupees in ‘000 taxation employed employed Commitments
Pakistan 2,187,583 336,971,583 17,741,868 171,335,592 Asia Pacific (including South Asia) - - - - Europe - - - - United States of America and Canada - - - - Middle East - Note 44.1.1.5.1 267,361 6,894,137 139,990 - Others - - - -
2,454,944 343,865,720 17,881,858 171,335,592
44.1.1.5.1 These do not include intra group items of Rs. 5,910,280 thousand (2011: Rs. 6,639,796 thousand) eliminated upon consolidation of foreign branch.
44.1.1.5.2 Contingencies and commitments include amounts given in note 23 except bills for collection.
44.1.2 Credit risk – general disclosures Basel II specific
Basel II standardized approach is used for calculating the capital adequacy for credit risk with comprehensive approach for credit risk mitigation.
44.1.2.1 Types of exposures and ECAIs used
For domestic claims, ECAIs recommended by the SBP, namely Pakistan Credit Rating Agency Limited (PACRA) and JCR-VIS Credit Rating Company Limited (JCR-VIS) were used. For foreign currency claims on sovereigns, risk weights were assigned on the basis of the credit ratings assigned by Moody’s. For claims on foreign entities, rating of S&P, Moody’s and Fitch Ratings were used. Foreign exposures not rated by any of the aforementioned rating agencies were categorized as unrated.
Type of exposures for which each agency is used in the year ended 2012 is presented below:
Exposures JCR–VIS PACRA Moody’s S&P Fitch
Sovereigns other than PKR claims – – 3 – – PSEs 3 3 – – – Banks 3 3 3 3 3
Corporates 3 3 – – –
Credit exposures subject to standardised approach
2012 2011
Rating Amount Deduction Net Amount Deduction Net
Exposures category outstanding CRM Amount outstanding CRM Amount
Rupees in ‘000
Sovereigns 6 2,569,779 - 2,569,779 2,354,692 - 2,354,692 PSEs 1 7,062,936 - 7,062,936 8,147,961 1,118,196 7,029,765 Banks 1,2,3 6,010,629 - 6,010,629 7,324,556 - 7,324,556 Banks 4,5 784,441 - 784,441 71,512 - 71,512 Corporates 1 12,065,791 1,687,793 10,377,998 12,039,779 - 12,039,779 Corporates 2 15,348,631 - 15,348,631 10,611,848 - 10,611,848 Corporates 3,4 - - - 943,202 8,241 934,961 Corporates 5,6 2,085,488 - 2,085,488 2,350,981 110,928 2,240,053 Unrated 217,730,695 32,196,604 185,534,091 221,043,381 15,727,145 205,316,236
Total 263,658,390 33,884,397 229,773,993 264,887,912 16,964,510 247,923,402

182
Notes to the Consolidated Financial StatementsFor the year ended December 31, 2012
Following is the list of main types of collateral taken by the Group.
– Government and Trustee Securities
– Defense Saving Certificates
– Fixed Deposits (TDR)
– Lien on Deposits
– Cash Margin
– Shares Listed on Main Index
– Shares Listed on Non Main Index
– Government Guarantees
44.2 Market Risk
Market risk is the risk that the value of on and off-balance sheet positions of a financial institution will be adversely affected by movements in market rates or prices such as interest rates, foreign exchange rates, equity prices and credit spreads resulting in a loss to earnings and capital.
The Bank’s Risk Management Process seeks to identify, measure, monitor and control market risks in order to shield against adverse movements in market factors and to attain an efficient risk / return profile of its open positions. The Risk Management Division has developed and implemented market risk policy and risk measurement /monitoring methodology for review and reporting of market risk. The Group makes use of the globally established value-at-risk (VaR) methodology to measure traded market risk.
In addition, sensitivity analysis is carried out to gauge the impact of extreme market movements on traded exposures. Meanwhile, stress testing is used to analyze the impact of both the abnormal market movements across different markets as well as to assess non-traded market risk, in particular interest rate risk in the banking book. The performance of the Group’s traded portfolios is evaluated through the use of risk / return analysis. Risk is kept under check through the revaluation of all traded market risk exposed positions on a daily basis, and controlled by ensuring that these positions do not breach regulatory limits and the Group’s own internally-established risk tolerance limits.
44.2.1 Market risk – General disclosures Basel II specific
Basel II standardized approach is used for calculating the capital adequacy for market risk.

183
Annual Report of Askari Bank Limited for 2012
44.2.2 Foreign Exchange Risk
Foreign exchange risk, or the risk that the Group’s earnings and / or capital can fluctuate due to changes in foreign exchange rates, arises out from the Group’s foreign exchange exposure which consists of foreign currency cash in hand, nostro / vostro accounts, forward contracts, forward bookings with exporters, foreign bills purchased, foreign currency placements with SBP and the Group’s Wholesale Bank Branch, foreign currency lendings / deposits and capital investments in offshore operations. The Group’s Treasury manages consolidated foreign exchange exposure by matching foreign currency assets and liabilities in spot and forward. The foreign exchange exposure and nostro balances are maintained within regulatory limits and VaR is calculated for consolidated foreign exchange exposure on a daily basis. The impact of a change in USD / PKR parity on the net open position is also determined through daily sensitivity analysis.
2012
Net foreign
Off–balance currency
(Rupees in ‘000) Assets Liabilities sheet items exposure
Pakistan Rupees 326,228,270 300,942,971 (4,570,980) 20,714,319 U.S. Dollars 21,095,490 26,846,992 4,443,198 (1,308,304) Pound Sterling 2,969,482 3,069,622 13,468 (86,672) Japanese Yen 4,256 64 - 4,192 Euro 2,400,048 2,517,557 131,604 14,095 Other European Currencies 34,006 (345) (9,723) 24,628 Other Currencies 479,722 7,032 (7,567) 465,123
353,211,274 333,383,893 - 19,827,381
2011
Net foreign
Off–balance currency
(Rupees in ‘000) Assets Liabilities sheet items exposure
Pakistan Rupees 317,587,064 290,846,346 (8,798,561) 17,942,157 U.S. Dollars 22,235,112 29,968,450 7,293,834 (439,504) Pound Sterling 1,286,206 2,744,387 1,454,082 (4,099) Japanese Yen 5,527 978 37,126 41,675 Euro 2,414,123 2,401,385 (136) 12,602 Other European Currencies 11,292 - - 11,292 Other Currencies 326,396 22,316 13,655 317,735
343,865,720 325,983,862 - 17,881,858
44.2.3 Equity position risk
Equity position risk is the risk that the value of equity positions inside the trading book and banking book will change as a result of general and specific equity market movements. The Group bifurcates its direct investment in equity into held for trading, available for sale and strategic portfolios. Held for trading equity exposures are of a short term nature and are undertaken to earn profit by exploiting market imperfections and short term price fluctuations. Equities held in the available for sale portfolio are with the intent to earn profit from fundamentals. Strategic investments are undertaken in line with the long-term strategy of the Group, i.e. to build strategic interest in other concerns. The Group also carries indirect equity exposure through financing against shares and reverse repos against shares.
All equity positions in the trading book are subject to exposure limits established by the Group in conformity with the
general limits prescribed by the SBP. These limits include intraday limits, stop-loss limits, exposure limits, portfolio limits, and sectoral limits. The Group carries out revaluation and calculates VaR on a daily basis for equity exposures in the trading book.

184
Notes to the Consolidated Financial StatementsFor the year ended December 31, 2012
44.2.4 Yield / interest rate risk in the banking book (IRRBB) – Basel II Specific
The Group’s interest rate exposure arises out from its investment, lending and borrowing activities. Interest rate risk in the banking book in its various forms is the risk of adverse changes in earnings and / or capital due to (i) timing differences or mismatches in the maturity / repricing period of financial assets and liabilities (repricing risk), (ii) differences in the basis used for calculating interest rates received and paid (basis risk), (iii) and options implicit or explicit in the Group’s financial assets and liabilities (options risk). The Asset and Liability Management Committee (ALCO) of the Group monitors and controls mismatch of interest rate sensitive assets and liabilities on an ongoing basis through its regular meetings. Market risk and Middle Office calculate price sensitivity measures such as duration, convexity and probabilistic loss measures such as VaR for the Group’s debt investments to assess the impact of interest rate changes on value of the portfolio. Interest rate risk stress tests are carried out bi-annually to assess the impact of a parallel shift in the yield curve on the Group’s capital using rate sensitive positions for on and off-balance sheet items.
44.2.5 Mismatch of interest rate sensitive assets and liabilities
Yield / interest rate sensitivity position for on-balance sheet instruments is based on the earlier of contractual re-pricing or maturity date and for off-balance sheet instruments is based on settlement date.
2012
Effective Exposed to yield/ interest risk Non–interest
Yield / Over 1 Over 3 Over 6 Over 1 Over 2 Over 3 Over 5 bearing
Interest Upto 1 to 3 to 6 Months to 1 to 2 to 3 to 5 to 10 Above 10 financial
Rupees in ‘000 rate Total Month Months Months Year Years Years Years Years Years instruments
On–balance sheet financial instruments
Assets
Cash and balances with treasury banks 0.00% 24,435,422 4,886,149 - - - - - - - - 19,549,273
Balances with other banks 1.11% 8,865,303 6,476,901 - - - - - - - - 2,388,402
Lendings to financial institutions 9.14% 6,341,474 5,833,725 22,000 - 485,749 - - - - - -
Investments 11.26% 145,354,253 10,408,609 6,289,702 29,313,891 70,801,525 1,095,111 4,453,048 11,488,746 5,827,531 179,630 5,496,460
Advances 12.23% 143,727,835 43,048,390 66,534,365 23,761,159 5,366,120 831,196 322,171 572,951 889,750 2,401,733 -
Other assets - 6,591,828 - - - - - - - - - 6,591,828
335,316,115 70,653,774 72,846,067 53,075,050 76,653,394 1,926,307 4,775,219 12,061,697 6,717,281 2,581,363 34,025,963
Liabilities
Bills payable - 3,700,156 - - - - - - - - - 3,700,156
Borrowings 12.49% 8,376,740 5,515,911 208,206 2,584,187 4,762 19,823 19,823 19,823 4,205 - -
Deposits and other accounts 6.75% 306,929,729 101,286,169 65,800,071 57,471,799 12,883,361 1,630,309 610,820 945,363 39,148 - 66,262,689
Sub-ordinated loans 13.72% 6,987,300 - 1,495,500 5,491,800 - - - - - - -
Liabilities against assets subject to
finance lease 11.25% 1,018 - - - 1,018 - - - - - -
Other liabilities - 5,993,908 - - - - - - - - - 5,993,908
331,988,851 106,802,080 67,503,777 65,547,786 12,889,141 1,650,132 630,643 965,186 43,353 - 75,956,753
On-balance sheet gap 3,327,264 (36,148,306) 5,342,290 (12,472,736) 63,764,253 276,175 4,144,576 11,096,511 6,673,928 2,581,563 (41,930,790)
Off-balance sheet financial instruments
Purchase and resale agreements 8.16% 5,823,130 5,823,130 - - - - - - - - -
Commitments to extend credits - 6,480,778 6,480,778 - - - - - - - - -
Off-balance sheet gap (657,648) (657,648) - - - - - - - - -
Total yield / interest risk sensitivity gap (36,805,954) 5,342,290 (12,472,736) 63,764,253 276,175 4,144,576 11,096,511 6,673,928 2,581,563 (41,930,790)
Cumulative yield / interest risk sensitivity gap (31,463,664) (43,936,400) 19,827,853 20,104,028 24,248,604 35,345,115 42,019,043 44,600,406
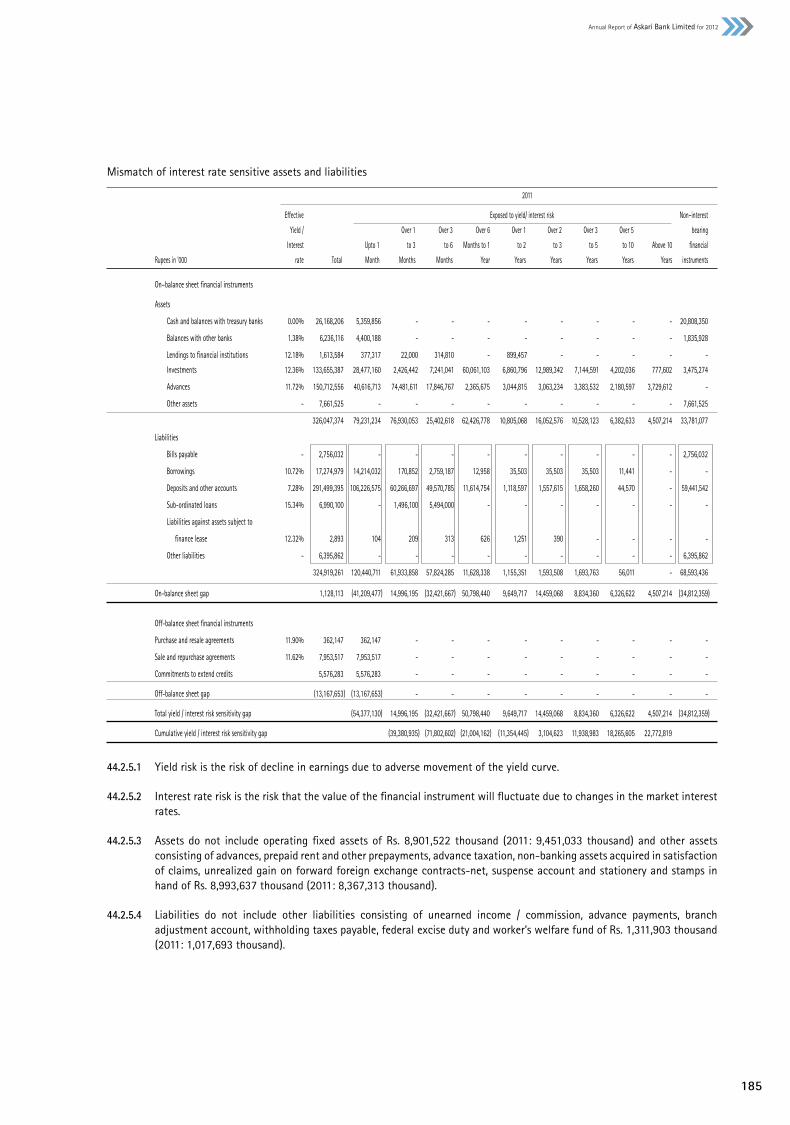
185
Annual Report of Askari Bank Limited for 2012
Mismatch of interest rate sensitive assets and liabilities
2011
Effective Exposed to yield/ interest risk Non–interest
Yield / Over 1 Over 3 Over 6 Over 1 Over 2 Over 3 Over 5 bearing
Interest Upto 1 to 3 to 6 Months to 1 to 2 to 3 to 5 to 10 Above 10 financial
Rupees in ‘000 rate Total Month Months Months Year Years Years Years Years Years instruments
On–balance sheet financial instruments
Assets
Cash and balances with treasury banks 0.00% 26,168,206 5,359,856 - - - - - - - - 20,808,350
Balances with other banks 1.38% 6,236,116 4,400,188 - - - - - - - - 1,835,928
Lendings to financial institutions 12.18% 1,613,584 377,317 22,000 314,810 - 899,457 - - - - -
Investments 12.36% 133,655,387 28,477,160 2,426,442 7,241,041 60,061,103 6,860,796 12,989,342 7,144,591 4,202,036 777,602 3,475,274
Advances 11.72% 150,712,556 40,616,713 74,481,611 17,846,767 2,365,675 3,044,815 3,063,234 3,383,532 2,180,597 3,729,612 -
Other assets - 7,661,525 - - - - - - - - - 7,661,525
326,047,374 79,231,234 76,930,053 25,402,618 62,426,778 10,805,068 16,052,576 10,528,123 6,382,633 4,507,214 33,781,077
Liabilities
Bills payable - 2,756,032 - - - - - - - - - 2,756,032
Borrowings 10.72% 17,274,979 14,214,032 170,852 2,759,187 12,958 35,503 35,503 35,503 11,441 - -
Deposits and other accounts 7.28% 291,499,395 106,226,575 60,266,697 49,570,785 11,614,754 1,118,597 1,557,615 1,658,260 44,570 - 59,441,542
Sub-ordinated loans 15.34% 6,990,100 - 1,496,100 5,494,000 - - - - - - -
Liabilities against assets subject to
finance lease 12.32% 2,893 104 209 313 626 1,251 390 - - - -
Other liabilities - 6,395,862 - - - - - - - - - 6,395,862
324,919,261 120,440,711 61,933,858 57,824,285 11,628,338 1,155,351 1,593,508 1,693,763 56,011 - 68,593,436
On-balance sheet gap 1,128,113 (41,209,477) 14,996,195 (32,421,667) 50,798,440 9,649,717 14,459,068 8,834,360 6,326,622 4,507,214 (34,812,359)
Off-balance sheet financial instruments
Purchase and resale agreements 11.90% 362,147 362,147 - - - - - - - - -
Sale and repurchase agreements 11.62% 7,953,517 7,953,517 - - - - - - - - -
Commitments to extend credits 5,576,283 5,576,283 - - - - - - - - -
Off-balance sheet gap (13,167,653) (13,167,653) - - - - - - - - -
Total yield / interest risk sensitivity gap (54,377,130) 14,996,195 (32,421,667) 50,798,440 9,649,717 14,459,068 8,834,360 6,326,622 4,507,214 (34,812,359)
Cumulative yield / interest risk sensitivity gap (39,380,935) (71,802,602) (21,004,162) (11,354,445) 3,104,623 11,938,983 18,265,605 22,772,819
44.2.5.1 Yield risk is the risk of decline in earnings due to adverse movement of the yield curve.
44.2.5.2 Interest rate risk is the risk that the value of the financial instrument will fluctuate due to changes in the market interest rates.
44.2.5.3 Assets do not include operating fixed assets of Rs. 8,901,522 thousand (2011: 9,451,033 thousand) and other assets consisting of advances, prepaid rent and other prepayments, advance taxation, non-banking assets acquired in satisfaction of claims, unrealized gain on forward foreign exchange contracts-net, suspense account and stationery and stamps in hand of Rs. 8,993,637 thousand (2011: 8,367,313 thousand).
44.2.5.4 Liabilities do not include other liabilities consisting of unearned income / commission, advance payments, branch adjustment account, withholding taxes payable, federal excise duty and worker’s welfare fund of Rs. 1,311,903 thousand (2011: 1,017,693 thousand).

186
Notes to the Consolidated Financial StatementsFor the year ended December 31, 2012
44.3 Liquidity risk
Liquidity risk reflects an enterprises inability in raising funds to meet commitments. The Group’s liquidity position is managed by the Asset and Liability Management Committee (ALCO). ALCO monitors the maintenance of financial position liquidity ratios, depositors concentration both in terms of the overall funding mix and avoidance of undue reliance on large individual deposits and liquidity contingency plans. Moreover, core retail deposits (current accounts and saving accounts) form a considerable part of the Group’s overall funding and significant importance is attached to the stability and growth of these deposits.
44.3.1 Maturities of assets and liabilities 2012
Over 1 Over 3 Over 6 Over 1 Over 2 Over 3 Over 5
Upto 1 to 3 to 6 Months to to 2 to 3 to 5 to 10 Above 10
Rupees in ‘000 Total Month Months Months 1 Year Years Years Years Years Years
Assets
Cash and balances with treasury banks 24,435,422 24,435,422 - - - - - - - -
Balances with other banks 8,865,303 8,865,303 - - - - - - - -
Lendings to financial institutions 6,341,474 5,833,725 22,000 - 485,749 - - - - -
Investments 145,354,253 10,776,529 5,951,738 19,261,205 72,472,795 7,346,074 6,551,380 13,869,841 7,907,410 1,217,280
Advances 143,727,835 22,835,553 34,979,153 18,884,444 29,853,029 6,872,817 5,302,015 9,975,339 9,067,809 5,957,676
Operating fixed assets 8,901,522 68,396 115,480 174,622 305,430 633,422 527,331 774,297 1,340,234 4,962,310
Deferred tax assets - - - - - - - - - -
Other assets 15,585,465 3,647,540 - - - 2,431,688 2,431,688 2,358,183 2,358,183 2,358,183
353,211,274 76,462,460 41,068,371 38,320,271 103,117,002 17,284,001 14,812,414 26,977,659 20,673,666 14,495,459
Liabilities
Bills payable 3,700,156 1,217,788 - 224,401 2,257,967 - - - - -
Borrowings 8,376,740 5,515,911 204,083 2,588,310 4,762 19,823 19,823 19,823 4,205 -
Deposits and other accounts 306,929,729 50,044,480 29,761,991 18,260,375 12,883,360 47,090,636 46,071,147 49,653,386 26,648,135 26,516,219
Sub-ordinated loans 6,987,300 - 1,495,500 1,100 1,496,300 1,600 1,600 3,200 3,988,000 -
Liabilities against assets subject to
finance lease 1,018 72 141 267 538 - - - - -
Deferred tax liabilities 83,139 - 168,678 - - - - (85,539) - -
Other liabilities 7,305,811 3,875,822 - - - 1,714,266 857,133 428,569 214,284 215,737
333,383,893 60,654,073 31,630,393 21,074,453 16,642,927 48,826,325 46,949,703 50,019,439 30,854,624 26,731,956
Net assets 19,827,381 15,808,387 9,437,978 17,245,818 86,474,075 (31,542,324) (32,137,290) (23,041,780) (10,180,986) (12,236,497)
Share Capital 8,130,711
Reserves 8,541,776
Unappropriated profit 1,114,869
Non-controlling interest 29,441
Surplus on revaluation of assets 2,010,584
19,827,381

187
Annual Report of Askari Bank Limited for 2012
Maturities of Assets and Liabilities
2011
Over 1 Over 3 Over 6 Over 1 Over 2 Over 3 Over 5
Upto 1 to 3 to 6 Months to to 2 to 3 to 5 to 10 Above 10
Rupees in ‘000 Total Month Months Months 1 Year Years Years Years Years Years
Assets
Cash and balances with treasury banks 26,168,206 26,168,206 - - - - - - - -
Balances with other banks 6,236,116 6,236,116 - - - - - - - -
Lendings to financial institutions 1,613,584 377,317 22,000 314,810 899,457 - - - - -
Investments 133,655,387 30,431,285 2,460,202 6,973,872 60,224,077 7,510,812 7,520,461 11,485,639 5,963,440 1,085,599
Advances 150,712,556 54,991,880 21,581,917 21,458,166 17,986,024 11,249,983 5,350,800 4,784,773 8,418,520 4,890,493
Operating fixed assets 9,451,033 71,064 137,198 200,473 397,100 694,869 540,313 1,764,021 745,938 4,900,057
Other assets 16,028,838 3,751,300 - - - 2,500,867 2,500,867 2,425,268 2,425,268 2,425,268
343,865,720 122,027,168 24,201,317 28,947,321 79,506,658 21,956,531 15,912,441 20,459,701 17,553,166 13,301,417
Liabilities
Bills payable 2,756,032 907,059 - 167,143 1,681,830 - - - - -
Borrowings 17,274,979 14,214,032 170,852 2,759,187 12,958 35,503 35,503 35,503 11,441 -
Deposits and other accounts 291,499,395 59,849,127 27,687,812 14,137,287 11,614,754 37,746,930 38,185,948 52,632,913 24,844,597 24,800,027
Sub-ordinated loans 6,990,100 - 300 1,100 1,400 2,992,900 1,600 3,200 3,989,600 -
Liabilities against assets subject to
finance lease 2,893 104 209 313 626 1,251 390 - - -
Deferred tax liabilities 46,908 - (231,453) - - - - 278,361 - -
Other liabilities 7,413,555 3,934,456 - - - 1,739,549 869,775 434,887 217,444 217,444
325,983,862 78,904,778 27,627,720 17,065,030 13,311,568 42,516,133 39,093,216 53,384,864 29,063,082 25,017,471
Net assets 17,881,858 43,122,390 (3,426,403) 11,882,291 66,195,090 (20,559,602) (23,180,775) (32,925,163) (11,509,916) (11,716,054)
Share Capital 7,070,184
Reserves 8,135,795
Unappropriated profit 1,380,018
Non-controlling interest 28,377
Surplus on revaluation of assets 1,267,484
17,881,858
44.3.1.1 In compliance with the BSD circular letter No. 03 of 2011 dated February 22, 2011, all assets and liabilities with contractual maturities have been reported as per their remaining maturities, and where contractual maturities are not available, such assets and liabilities have been reported as per their expected maturities, determined on the basis of behaviour study of three years’ historic data under volatility methodology. These bases have also been approved by the ALCO of the Bank.
44.4 Operational risk
Operational risk is the risk of loss resulting from inadequate or failed internal processes, people, systems and external events. The Group strives to manage operational risk within acceptable levels through sound operational risk management practices. Board Risk Management Committee defines the operational risk appetite and tolerance limits.
Operational risk governance structure adopted by the Group is embedded within three lines of defense: strategic, macro
and micro. The Group has recently updated its operational risk management framework to align it with global / local best market practices. Moreover, the Group has also formulated Operational Risk Management Committee (ORMC) which serves as a management level committee to oversee, supervise and direct operational risk framework across the Group. Further, the committee is responsible for strengthening internal control environment through implementation of policies and procedure, enhancement in tools and reporting structures.
To ensure effectiveness, business continuity plan (BCP) and business continuity management (BCM) is adopted throughout
the organization in a proactive manner by making use of requisite tools and strategies.

188
Notes to the Consolidated Financial StatementsFor the year ended December 31, 2012
44.4.1 Operational risk disclosures Basel II
Basel II basic indicator approach is used for calculating the capital adequacy for operational risk.
45. GENERAL
45.1 Non-adjusting events after the balance sheet date
The Board of Directors in its meeting held on February 18, 2013 has proposed the following appropriation, which will be approved in the forthcoming annual general meeting. The consolidated financial statements for the year ended December 31, 2012 do not include the effect of the appropriation which will be accounted for in the consolidated financial statements for the year ending December 31, 2013 as follows:
Rupees in ‘000 2012 2011
Transfer from unappropriated profit to: General reserve 1,004,290 1,302,158
Transfer from general reserve to:
Reserve for issue of bonus shares - 1,060,528
45.2 Captions as prescribed by BSD Circular No. 4 dated February 17, 2006 issued by the SBP in respect of which there are no amounts have not been reproduced in these consolidated financial statements except for the consolidated statement of financial position and consolidated profit and loss account.
46. DATE OF AUTHORIZATION
These consolidated financial statements were authorised for issue on February 18, 2013 by the Board of Directors of the Bank.
M. R. Mehkari Dr. Bashir Ahmad Khan Lt. Gen. (R) Tahir Mahmood Lt. Gen. Javed Iqbal President & Chief Executive Director Director Chairman

189
Annual Report of Askari Bank Limited for 2012
Pattern of ShareholdingAs at December 31, 2012
Number of Shareholding Total shareholders From To shares held
2,114 1 100 86,268 3,204 101 500 879,869 2,583 501 1000 1,961,140 5,953 1001 5000 14,984,929 2,599 5001 10000 19,004,921 2,536 10001 110000 59,659,203 139 110001 325000 24,612,838 29 335001 525000 12,085,750 16 575001 900000 11,607,519 14 920001 1270000 14,635,314 34 1355001 7830000 94,933,938 10 11415001 386360000 558,619,395
19,231 813,071,084
Categories of shareholders Number of Particulars shareholders Shares held Percent
Individuals - Note 1 18,798 170,606,461 20.98 Investment / brokerage companies 128 46,501,781 5.72 Insurance companies 14 28,768,424 3.54 Joint stock companies 35 44,957,728 5.53 Financial institutions 37 34,422,996 4.23 Modaraba and Mutual Funds 35 16,549,487 2.04 Charitable and other trusts 23 453,957,969 55.83 Foreign investors 161 17,306,238 2.13
Total 19,231 813,071,084 100.00
Note 1: Individual include 9 directors holding 20,501 shares, detailed below, in their capacity as nominees of Army Welfare Trust (AWT). The ultimate ownership remains with AWT.
Held byParticulars Number of Shares Percentage shareholders held
Associated company Army Welfare Trust 1 411,140,169 50.57
NIT / ICP National Investment (Unit) Trust 1 40,356,909 4.96Investment Corporation of Pakistan 1 9,571 0.00
Directors Lt. Gen. Javed Iqbal 1 3,062 0.00Lt. Gen (R.) Tahir Mahmood 1 3,853 0.00Malik Riffat Mahmood 1 3,853 0.00Mr. Zafar Alam Khan Sumbal 1 3,853 0.00 Dr. Bashir Ahmad Khan 1 1,278 0.00Mr. Shahid Mahmud 1 948 0.00Mr. Muhammad Riyazul Haque 1 948 0.00Khawaja Jalaluddin Roomi 1 1,758 Mr. Ali Noor Mahomed Rattansey 1 948 0.00
9 20,501 0.00
Executives of the Bank 21 96,784 0.01
Banks, Development Financial Institutions, Non- Banking Financial Institutions, Insurance Companies, Modarabas and Mutual Funds (excluding NIT & ICP) 249 171,200,416 21.05
Individuals 18,923 176,257,911 21.69
Others 26 13,988,823 1.72
Total 19,231 813,071,084 100.00
Note 2: There have been no trades in the shares of the Bank, carried out by it’s Directors, Chief Executive, Chief Financial Officer, Company Secretary and their spouses and minor children.

190
Correspondent Network
1. ALGERIA Banque de l’ Agriculture et du Development Rural 2. AUSTRALIA Australia & Newzealand Banking Group Commonwealth Bank of Australia WestPac Banking Corporation 3. AUSTRIA Raiffeisen Zentralbank Osterreich (RZB) UniCredit Bank Austria AG
4. AzERBAIjAN The International Bank of Azerbaijan Republic
5. BAHRAIN Al Baraka Islamic Bank BSC BMI Bank BSC ©
6. BANGLADESH City Bank Ltd Export Import Bank of Bangladesh Prime Bank Ltd Rupali Bank Ltd Southeast Bank Ltd 7. BELGIUM Dexia Bank Belgium Fortis Bank, NV/S.A ING Belgium NV/SA KBC Bank NV
8. BRAzIL Banco Citibank SA 9. BULGARIA UniCredit Bulbank AD
10. CANADA Caisse Centrale Desjardins Canadian Imperial Bank of Commerce Habib Candain Bank Korea Exchange Bank of Canada Royal Bank of Canada Toronto-Dominion Bank
11. CHILE Banco de Credito
12. CHINA Agricultural Bank of China Bank of Beijing Bank of Changsha Bank of China Ltd Bank of Communications Bank of Jiangsu Co Ltd Bank of Jilin Co Ltd China Construction Bank Corporation China Everbright Bank China Merchants Bank China Minsheng Banking Corporation China Zheshang Bank Export Import Bank of China (EXIM Bank) Evergrowing Bank Guangdong Development Bank Hua Xia Bank Huishang Bank Corporation Ltd Industrial Bank Co Ltd Industrial and Commercial Bank of China Ltd Jiangsu Jianyin Rural Commercial Bank Jinan City Commercial Bank Laiwu City Commercial Bank Co Ltd Mizuho Corporate Bank (China) Ltd Nanjing City Commercial Bank Ningbo Cixi Rural Cooperative Bank Qingdao City Commercial Bank Shinhan Bank (China) Ltd Shengjing Bank Co Ltd WestLB AG (Portigon AG) Xiamen City Commercial Bank Yinzhou Bank
13. CROATIA Societe Generale-Splitska banka dd Zagrebacka Banka dd
14. CYPRUS Cyprus Popular Bank Public Company Ltd. Hellenic Bank Public Company Ltd.
15. CzECH REPUBLIC Ceskoslovenska Obchodni Banka as Raiffeisenbank as UniCredit Bank Czeck Republic
16. DENMARK Danske Bank Nordea Bank Denmark A/S 17. EGYPT Ahli United Bank Egypt Ltd Bank of Alexandria The United Bank
18. FINLAND Nordea Bank Finland plc Sampo Bank Plc
19. FRANCE BNP Paribas SA CALYON Credit Lyonnais Credit Agricole SA Credit Du Nord Societe Generale Union de Banques et de Francaises (UBAF)
20. GERMANY Bayerische Landesbank Commerzbank A.G DZ Bank AG Deutsche Zentral- Genoschaftsbank Sparkasse Aachen WGZ-Bank AG Westdeutsche Genossenschafts- Zentalbank
21. GREECE Alpha Bank AE Marfin Egnatia Bank S.A.
22. HONG KONG Bank of China (Hong Kong) Ltd China Construction Bank (Asia) Corp Ltd China Trust Commercial Bank Habib Finance International Limited UBAF (Hong Kong) Ltd
23. HUNGARY Budapest Credit & Development Bank Rt Raiffeisen Bank Zrt UniCredit Bank Hungary Zrt
24. INDIA Bank of Baroda HDFC Bank ICICI Bank Ltd Karur Vysya Bank Ltd., The Punjab National Bank State Bank of India Tamilnad Mercantile Bank Limited
25. INDONESIA Bank China Trust Indonesia PT Bank NISP PT Bank CIMB Niaga TBK PT Bank Danamon Indonesia, TBK PT Bank Lippo TbK PT Bank Mandiri (Persero) TbK PT Bank SBI
26. IRELAND Bank of Ireland National Irish Bank 27. ITALY Banca Antonveneta SpA Banca de Roma Banca Intesa SpA Banca UBAE SpA UniCredit SPA
28. jAPAN Bank of Tokyo - Mitsubishi UFJ Ltd (The) Mizuho Corporate Bank Ltd Resona Bank Limited Saitama Resona Bank Ltd Sumitomo Mitsui Banking Corp. Tama Chuo Shinkin Bank 29. jORDAN The Housing Bank for Trade & Finance
30. KAzAKHSTAN Alliance Bank Joint Stock Company 31. KENYA Dubai Bank Kenya Ltd Kenya Commercial Bank Middle East Bank Kenya Ltd Stanbic Bank Kenya Ltd
32. KOREA (SOUTH) Daegu Bank Ltd Hana Bank Industrial Bank of Korea Kookmin Bank Korea Development Bank Korea Exchange Bank National Federation of Fisheries Cooperatives Nonghyup Bank Pusan Bank (Busan Bank) Shinhan Bank Woori Bank
33. KUWAIT Al-Ahli Bank of Kuwait KSC Burgan Bank Commercial Bank of Kuwait Gulf Bank KSC National Bank of Kuwait
34. LEBANAN Byblos Bank SAL Fransabank SAL 35. LUxEMBURG Banque Geneale De Luxemburg
36. MALAYSIA CIMB Bank Berhad Hong Leong Bank Berhad MAY Bank (Malayan Banking Berhad) Public Bank Berhad RHB Bank Berhad
37. MALDIVES Bank of Maldives
38. MALTA FIM Bank
39. MAURITIUS Mauritius Post and Cooperative Bank The Mauritius Commercial Bank Ltd
40. MExICO Banco Santander (Mexico) S.A.
41. MONACO BNP Paribas Private Bank Monaco
42. MOROCCO Attijariwafa Bank Citibank Maghreb Credit Du Moroc
43. NEPAL Bank of Asia Nepal Limited Laxmi Bank Limited
44. NETHERLANDS Fortis Bank (Nederland) NV F Van Lanschot Bankiers NV Garanti Bank International N.V.
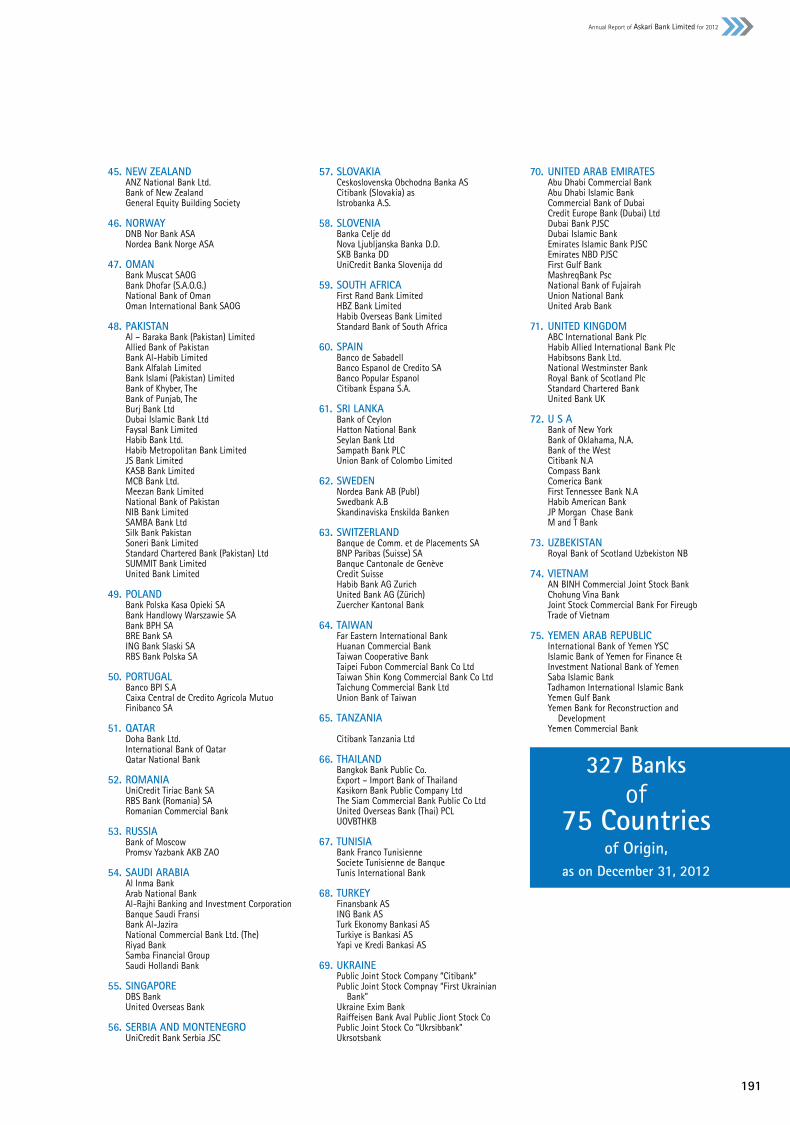
191
Annual Report of Askari Bank Limited for 2012
45. NEW zEALAND ANZ National Bank Ltd. Bank of New Zealand General Equity Building Society
46. NORWAY DNB Nor Bank ASA Nordea Bank Norge ASA 47. OMAN Bank Muscat SAOG Bank Dhofar (S.A.O.G.) National Bank of Oman Oman International Bank SAOG
48. PAKISTAN Al – Baraka Bank (Pakistan) Limited Allied Bank of Pakistan Bank Al-Habib Limited Bank Alfalah Limited Bank Islami (Pakistan) Limited Bank of Khyber, The Bank of Punjab, The Burj Bank Ltd Dubai Islamic Bank Ltd Faysal Bank Limited Habib Bank Ltd. Habib Metropolitan Bank Limited JS Bank Limited KASB Bank Limited MCB Bank Ltd. Meezan Bank Limited National Bank of Pakistan NIB Bank Limited SAMBA Bank Ltd Silk Bank Pakistan Soneri Bank Limited Standard Chartered Bank (Pakistan) Ltd SUMMIT Bank Limited United Bank Limited
49. POLAND Bank Polska Kasa Opieki SA Bank Handlowy Warszawie SA Bank BPH SA BRE Bank SA ING Bank Slaski SA RBS Bank Polska SA 50. PORTUGAL Banco BPI S.A Caixa Central de Credito Agricola Mutuo Finibanco SA 51. QATAR Doha Bank Ltd. International Bank of Qatar Qatar National Bank
52. ROMANIA UniCredit Tiriac Bank SA RBS Bank (Romania) SA Romanian Commercial Bank
53. RUSSIA Bank of Moscow Promsv Yazbank AKB ZAO
54. SAUDI ARABIA Al Inma Bank Arab National Bank Al-Rajhi Banking and Investment Corporation Banque Saudi Fransi Bank Al-Jazira National Commercial Bank Ltd. (The) Riyad Bank Samba Financial Group Saudi Hollandi Bank
55. SINGAPORE DBS Bank United Overseas Bank
56. SERBIA AND MONTENEGRO UniCredit Bank Serbia JSC
57. SLOVAKIA Ceskoslovenska Obchodna Banka AS Citibank (Slovakia) as Istrobanka A.S.
58. SLOVENIA Banka Celje dd Nova Ljubljanska Banka D.D. SKB Banka DD UniCredit Banka Slovenija dd
59. SOUTH AFRICA First Rand Bank Limited HBZ Bank Limited Habib Overseas Bank Limited Standard Bank of South Africa
60. SPAIN Banco de Sabadell Banco Espanol de Credito SA Banco Popular Espanol Citibank Espana S.A. 61. SRI LANKA Bank of Ceylon Hatton National Bank Seylan Bank Ltd Sampath Bank PLC Union Bank of Colombo Limited
62. SWEDEN Nordea Bank AB (Publ) Swedbank A.B Skandinaviska Enskilda Banken
63. SWITzERLAND Banque de Comm. et de Placements SA BNP Paribas (Suisse) SA Banque Cantonale de Genève Credit Suisse Habib Bank AG Zurich United Bank AG (Zürich) Zuercher Kantonal Bank
64. TAIWAN Far Eastern International Bank Huanan Commercial Bank Taiwan Cooperative Bank Taipei Fubon Commercial Bank Co Ltd Taiwan Shin Kong Commercial Bank Co Ltd Taichung Commercial Bank Ltd Union Bank of Taiwan
65. TANzANIA Citibank Tanzania Ltd 66. THAILAND Bangkok Bank Public Co. Export – Import Bank of Thailand Kasikorn Bank Public Company Ltd The Siam Commercial Bank Public Co Ltd United Overseas Bank (Thai) PCL UOVBTHKB 67. TUNISIA Bank Franco Tunisienne Societe Tunisienne de Banque Tunis International Bank 68. TURKEY Finansbank AS ING Bank AS Turk Ekonomy Bankasi AS Turkiye is Bankasi AS Yapi ve Kredi Bankasi AS
69. UKRAINE Public Joint Stock Company “Citibank” Public Joint Stock Compnay “First Ukrainian Bank” Ukraine Exim Bank Raiffeisen Bank Aval Public Jiont Stock Co Public Joint Stock Co “Ukrsibbank” Ukrsotsbank
70. UNITED ARAB EMIRATES Abu Dhabi Commercial Bank Abu Dhabi Islamic Bank Commercial Bank of Dubai Credit Europe Bank (Dubai) Ltd Dubai Bank PJSC Dubai Islamic Bank Emirates Islamic Bank PJSC Emirates NBD PJSC First Gulf Bank MashreqBank Psc National Bank of Fujairah Union National Bank United Arab Bank
71. UNITED KINGDOM ABC International Bank Plc Habib Allied International Bank Plc Habibsons Bank Ltd. National Westminster Bank Royal Bank of Scotland Plc Standard Chartered Bank United Bank UK
72. U S A Bank of New York Bank of Oklahama, N.A. Bank of the West Citibank N.A Compass Bank Comerica Bank First Tennessee Bank N.A Habib American Bank JP Morgan Chase Bank M and T Bank 73. UzBEKISTAN Royal Bank of Scotland Uzbekiston NB
74. VIETNAM AN BINH Commercial Joint Stock Bank Chohung Vina Bank Joint Stock Commercial Bank For Fireugb Trade of Vietnam
75. YEMEN ARAB REPUBLIC International Bank of Yemen YSC Islamic Bank of Yemen for Finance & Investment National Bank of Yemen Saba Islamic Bank Tadhamon International Islamic Bank Yemen Gulf Bank Yemen Bank for Reconstruction and Development Yemen Commercial Bank
327 Banksof
75 Countriesof Origin,
as on December 31, 2012

192
2012 2011 2012 2011
US $ in ‘000 Rupees in ‘000
Assets
251,523 290,933 Cash and balances with treasury banks 24,435,380 26,168,181 91,236 69,320 Balances with other banks 8,863,586 6,235,055 65,049 17,695 Lendings to financial institutions 6,319,474 1,591,584 1,496,434 1,487,083 Investments 145,378,148 133,756,712 1,479,438 1,675,574 Advances 143,726,962 150,710,709 91,005 103,938 Operating fixed assets 8,841,091 9,348,815 - - Deferred tax assets - - 159,455 177,276 Other assets 15,490,986 15,945,250
3,634,140 3,821,819 353,055,627 343,756,306 Liabilities
38,087 30,641 Bills payable 3,700,156 2,756,032 86,183 192,043 Borrowings 8,372,617 17,273,470 3,159,425 3,240,877 Deposits and other accounts 306,937,216 291,502,993 71,923 77,715 Sub-ordinated loans 6,987,300 6,990,100 - - Liabilities against assets subject to finance lease - - 1,218 923 Deferred tax liabilities 118,376 83,024 74,647 81,987 Other liabilities 7,251,956 7,374,421
3,431,483 3,624,186 333,367,621 325,980,040
202,657 197,633 Net assets 19,688,006 17,776,266
Represented by 83,693 78,605 Share capital 8,130,711 7,070,184 87,930 90,459 Reserves 8,542,421 8,136,440 10,338 14,477 Unappropriated profit 1,004,290 1,302,158
181,961 183,542 17,677,422 16,508,782 20,696 14,091 Surplus on revaluation of assets - net of tax 2,010,584 1,267,484
202,657 197,633 19,688,006 17,776,266
Note: The above is for information only and coversion have been made @ 1US$=Pak Rs. 97.1497 as at December 31, 2012. (1US$=Pak Rs. 89.9457 as at December 31, 2011)
Statement of Financial Position in US$As at December 31, 2012

193
Annual Report of Askari Bank Limited for 2012
Profit and Loss Account in US$For the year ended December 31, 2012
2012 2011 2012 2011
US $ in ‘000 Rupees in ‘000
333,528 364,290 Mark-up / return / interest earned 32,402,187 32,766,351 236,478 252,370 Mark-up / return / interest expensed 22,973,781 22,699,583
97,050 111,921 Net mark-up / interest income 9,428,406 10,066,768
24,112 18,123 Provision against non-performing loans and advances - net 2,342,473 1,630,123 1,473 1,361 Impairment loss on available for sale investments 143,079 122,421 2,072 485 Provision for diminution in the value of investments 201,265 43,596 - 386 Provision against repurchase agreement lendings - 34,702 11 - Bad debts written off directly 1,043 -
27,667 20,355 2,687,860 1,830,842
69,383 91,566 Net mark-up / interest income after provisions 6,740,546 8,235,926 Non mark–up / interest income
11,873 13,275 Fee, commission and brokerage income 1,153,496 1,193,986 10,667 3,218 Dividend income 1,036,249 289,470 9,107 8,588 Income from dealing in foreign currencies 884,724 772,495 7,017 3,416 Gain on sale of investments - net 681,685 307,212 - - Unrealised gain on revaluation of investments 3 - classified as held for trading - net 252 - 3,716 3,777 Other income 360,960 339,758
42,382 32,274 Total non-markup / interest income 4,117,366 2,902,921
111,765 123,840 10,857,912 11,138,847
Non mark–up / interest expenses
93,045 96,050 Administrative expenses 9,039,255 8,639,312 89 - Other provisions / write offs 8,633 - 827 965 Other charges 80,297 86,784
93,960 97,015 Total non-markup / interest expenses 9,128,185 8,726,096
17,805 26,825 1,729,727 2,412,751 - - Extra ordinary / unusual items - -
17,805 26,825 Profit before taxation 1,729,727 2,412,751
8,638 9,258 Taxation – current 839,144 832,723 - - – prior years’ - - (3,755) (530) – deferred (364,779) (47,670)
4,883 8,728 474,365 785,053
12,922 18,096 Profit after taxation 1,255,362 1,627,698
13,404 7,803 Unappropriated profit brought forward 1,302,158 701,819
26,326 25,899 Profit available for appropriation 2,557,520 2,329,517
0.02 0.02 Basic / diluted earnings per share - US $ 1.54 2.00
Note:The above is for information only and coversion have been made @ 1US$=Pak Rs. 97.1497 as at December 31, 2012. (1US$=Pak Rs. 89.9457 as at December 31, 2011)

194
ACCEPTANCESPromise to pay created when the drawee of a time draft stamps or writes the words “accepted” above his signature and a designated payment date.
ACCRUAL BASISRecognizing the effects of transactions and other events when they occur without waiting for receipt or payment of cash or its equivalent.
BILLS FOR COLLECTIONA bill of exchange drawn by the exporter usually at a term, on an importer overseas and brought by the exporter to this bank with a request to collect the proceeds.
BONUS ISSUE (SCRIP ISSUE)The issue of new shares to existing shareholders in proportion to their shareholdings. It is a process for converting a company’s reserves (in whole or part) into issued capital and hence does not involve an infusion of cash.
CAPITAL ADEQUACY RATIOThe relationship between capital and risk weighted assets as defined in the framework developed by the State Bank of Pakistan.
CASH EQUIVALENTSShort–term highly liquid investments that are readily convertible to known amounts of cash and which are subject to an insignificant risk of changes in value.
COMMITMENT TO ExTEND CREDITCredit facilities approved but not yet utilized by the client as at the Balance sheet date.
COMMITMENT TO ExTEND CREDITCommitments to extend credit are those commitments that are irrevocable because they cannot be withdrawn at the discretion of the bank without the risk of incurring significant penalty or expense.
CONTINGENCIESA condition or situation existing at Balance Sheet date where the outcome will be confirmed only by occurrence of one or more future events.
COST / INCOME RATIOOperating expenses as a percentage of total income.
CORPORATE GOVERNANCEThe process by which corporate entities are governed. It is concerned with the way in which power is exercised over the management and direction of entity, the supervision of executive actions and accountability to owners and others.
CAGRAn abbreviation for Compound Annual Growth Rate.
DEFERRED TAxATIONSum set aside for tax in the Financial Statements that will become payable in a financial year other than the current financial year.
DERIVATIVESDerivative is a financial instrument or other contract which has the following characteristics:
(a) its value changes in response to the change in a specified interest rate, financial instrument price, commodity price, foreign exchange rate, index of prices or rates, credit rating or credit index, or other variable, provided in the case of a non–financial variable that the variable is not specific to a party to the contract (sometimes called the ‘underlying’);
(b) it requires no initial net investment or an initial net investment that is smaller than would be required for other types of contracts that would be expected to have a similar response to changes in market factors; and
(c) it is settled at a future date.
EARNINGS PER SHAREProfit after taxation divided by the weighted average number of ordinary share in issue.
EFFECTIVE TAx RATEProvision for taxation excluding deferred tax divided by the profit before taxation.
EQUITY METHODA method of accounting whereby the investment is initially recorded at cost and adjusted thereafter for the post acquisition change in the investor’s share of net assets of the investee. The Income Statement reflects the investor’s share of the results of operations of the investee.
FINANCE LEASEA contract whereby a lessor conveys to the lessee the right to use an asset for rent over an agreed period of time which is sufficient to amortise the capital outlay of the lessor. The lessor retains ownership of the asset but transfers substantially all the risks and rewards of ownership to the lessee.
FORWARD ExCHANGE CONTRACTAgreement between two parties to exchange one currency for another at a future date at a rate agreed upon today.
GROSS DIVIDENDSThe portion of profits distributed to the shareholders including the tax withheld.
GUARANTEESAn agreement involving a promise by a person (the guarantor) to fulfill the obligations of another person owning debt if that person fails to perform.
HISTORICAL COST CONVENTIONRecording transactions at the actual value received or paid.
INTEREST IN SUSPENSEInterest suspended on non–performing loans and advances.
Glossary of Financial & Banking Terms
195
Annual Report of Askari Bank Limited for 2012
INTEREST SPREADRepresents the difference between the average interest rate earned and the average interest rate paid on funds.
LIQUID ASSETSAssets that are held in cash or in a form that can be converted to cash readily, such as deposits with other banks, bills of exchange, treasury bills.
LOAN LOSSES AND PROVISIONSAmount set aside against possible losses on loans, advances and other credit facilities as a result of their becoming party or wholly uncollectible.
MARKET CAPITALISATIONNumber of ordinary shares in issue multiplied by the market value of share as at the year end.
MATERIALITYThe relative significance of a transaction or an event the omission or misstatement of which could influence the economic decisions of users of financial statements.
NET ASSETS VALUE PER SHAREShareholders’ funds divided by the number of ordinary shares in issue.
NET DIVIDENDSDividend net of withholding tax.
NET INTEREST INCOMEThe difference between what a bank earns on assets such as loans and securities and what it pays on liabilities such as deposits, refinance funds and inter–bank borrowings.
NON PERFORMING LOANSA loan placed on cash basis (i.e Interest Income is only recognized when cash is received) because in the opinion of management, there is reasonable doubt regarding the collectability of principal or interest. Loans are automatically placed on cash basis when a payment is 3 months past due. All loans are classified as non–performing when a payment is 3 months in arrears.
OFF BALANCE SHEET TRANSACTIONSTransactions that are not recognized as assets or liabilities in the balance sheet but which give rise to contingencies and commitments.
PRICE EARNINGS RATIO (P/E RATIO)Market price of a share divided by earnings per share.
PRUDENCEInclusion of a degree of caution in the exercise of judgment needed in making the estimates required under conditions of uncertainty, such that assets or income are not overstated and liabilities or expenses are not understated.
RELATED PARTIESParties where one party has the ability to control the other party or exercise significant influence over the other party in making financial and operating decisions.
RETURN ON AVERAGE ASSETSProfit after tax divided by the average assets.
RISK WEIGHTED ASSETSOn Balance Sheet assets and the credit equivalent of off balance sheet assets multiplied by the relevant risk weighting factors.
REPURCHASE AGREEMENTContract to sell and subsequently repurchase securities at a specified date and price.
REVERSE REPURCHASE AGREEMENTTransaction involving the purchase of securities by a bank or dealer and resale back to the seller at a future date and specified price.
RETURN ON AVERAGE EQUITYNet profit for the year, less preference share dividends if any, expressed as a percentage of average ordinary shareholders’ equity.
REVENUE RESERVEReserves set aside for future distribution and investment.
SHAREHOLDERS’ FUNDSTotal of Issued and fully paid share capital and capital and revenue reserves.
STATUTORY RESERVE FUNDSA capital reserve created as per the provisions of the Banking Companies Ordinance, 1962.
SUBSIDIARY COMPANYA company is a subsidiary of another company if the parent company holds more than 50% of the nominal value of its equity capital or holds some share in it and controls the composition of its Board of Directors.

196
On March 28, 2013 at 10:00 am
Blue Lagoon Complex
Opposite Outward Gate of
Pearl Continental Hotel, Rawalpindi.
AGM
Notes

197
Annual Report of Askari Bank Limited for 2012
Form of ProxyAskari Bank Limited
I / We of
being member(s) of
Askari Bank Limited (“the Bank”), holding ordinary shares, do hereby
appoint of
or failing
him / her of
, who is also
member of the Bank, as my / our proxy to vote for me / us, and on my / our behalf at the Annual General Meeting of the Bank to be held on
Thursday, March 28, 2013 at 10:00 a.m at Blue Lagoon Complex opposite, near Pearl Continental Hotel Rawalpindi and at any adjournment
thereof.
As witness my / our hand this day of 2013.
Witnesses:
Name:
C.N.I.C. No./Passport No.:
Address:
NOTES:
A. General:
1. A member entitled to attend and vote at the meeting is entitled to appoint a proxy to attend and vote for him/her. No person shall act as a proxy, who is not a member of the Bank except that Government of Pakistan / State Bank of Pakistan / corporate entity may appoint a person who is not a member.
2. The instrument appointing a proxy should be signed by the member or his/her attorney duly authorized in writing. If the member is a corporate entity (other than Government of Pakistan and State Bank of Pakistan), its common seal should be affixed on the instrument.
3. The instrument appointing a proxy, together with Power of Attorney, if any, under which it is signed or a notarially certified copy thereof, should be deposited, with the Company Secretary, Askari Bank Limited, 1st Floor, AWT Plaza, The Mall, P.O.Box No. 1084, Rawalpindi not less than 48 hours before the time of holding the meeting.
4. If a member appoints more than one proxy, and more than one instrument of proxy is deposited by a member, all such instruments of proxy shall be rendered invalid.
B. For CDC Account Holders
1. The proxy form shall be witnessed by one person whose name, address and CNIC number shall be mentioned on the form.
2. Attested copies of the CNIC or passport of the beneficial owners and the proxy shall be furnished with the proxy form.
3. The proxy shall produce his / her original CNIC or original passport at the time of meeting.
4. In case of Government of Pakistan / State Bank of Pakistan / Corporate entity, the Board of Directors’ resolution / power of attorney with specimen signature shall be submitted along with proxy form to the Bank.
(Member’s signature onRs. 5/– Revenue Stamp

198
The Company Secretary:
ASKARI BANK LIMITEDAWT Plaza, The Mall, P.O. Box No. 1084,Rawalpindi – Pakistan.


askaribank.com.pk
Conc
ept,
Desi
gn &
Prin
ting
byw
ww
.van
tage
prin
ters
.com