ask the experts: rasch vs. factor analysis
TRANSCRIPT

Rasch Measurement Transactions 26:3 Winter 2012 1373
RASCH MEASUREMENT
Transactions of the Rasch Measurement SIG
American Educational Research Association
Vol. 26 No. 3 Winter 2012 ISSN 1051-0796
Ask the Experts: Rasch vs. Factor Analysis
The “Ask the Experts” series is a new feature in RMT in
which experts throughout the world weigh-in on a number
of controversial topics. For this issue, I have selected the
topic of Rasch versus factor analysis. I selected this topic
because numerous Rasch enthusiasts have mentioned
many journal reviewers and editors continue to confuse
the methodologies and sometimes require additional, and
unnecessary, data analyses. Thus, the purpose of this
piece is to provide readers with authoritative insights on
Rasch versus factor analysis and help Rasch advocates
overcome these common objections to Rasch analyses.
The expert panel for this piece includes Karl Bang
Christensen from the Department of Biostatistics at the
University of Copenhagen (Denmark), George Engelhard,
Jr. from the Department of Educational Studies at Emory
University (USA), and Thomas Salzberger from the
Department of Marketing at WU Wien (Austria).
“Rasch vs. FA” – Karl Bang Christensen
Rasch models have been confirmatory in nature since the
seminal work of Georg Rasch (Rasch 1960; 1961). Thus,
it is natural to consider when a Rasch analysis should be
combined with a confirmatory factor analysis.
Exploratory factor analysis is a method for an entirely
different situation, where no pre-specified hypothesis is
tested. Furthermore, for a data set in, say, SPSS the user
has to choose between seven options for ‘extraction
method’, six options for ‘rotation’, and between
covariance and correlation matrix. Even if a ‘true model’
exists there is little chance that choosing between these 84
different options yields a correct result.
Before deciding on Rasch analysis, confirmatory factor
analysis, or a combination of the two, we need to consider
the following: “what question do we want to answer?”
We may outline different situations:
(i) We feel confident that items function well with
regard to targeting, DIF and with nothing in the item
content to suggest local dependence and the only
unanswered question is dimensionality.
(ii) We feel less confident about the items, and want to
study dimensionality along with evidence of local
dependence, DIF and item fit.
(iii) In a given data set, we want to reduce a (possibly
large) set of items to a small number of summary scale
scores.
In situation (i) confirmatory factor analysis is adequate.
Factor analysis based on polychoric correlations is likely
to be at least as efficient as Rasch Analyses for disclosing
multidimensionality. Larger correlations makes it more
difficult to detect, but power of the tests increase with the
sample size.
Situation (ii) is an example where confirmatory factor
analysis alone is insufficient, mainly due to its inability to
address spurious evidence (Kreiner & Christensen,
2011b). The Rasch model is the appropriate choice,
possibly combined with confirmatory factor analysis.
Situation (iii) calls for Rasch analyses to be combined
with exploratory and confirmatory factor analyses.
Table of Contents
“Ask the Experts” – Rasch vs. Factor Analysis
(Christensen, Engelhard, & Salzberger)……. 1373
A New HR Metric Standard (Fisher)…………. 1378
Cronbach’s α with the Dimension Coefficient
to Jointly Assess a Scale’s Quality (Chien).... 1379
A Method for Estimating Item Parameter from
Time to Task (Hippisley)…………………… 1380
Is Aberrant Response Behavior Stable in Math
Tests? (Panayides & Tymms)………………. 1382
Goldstein’s Objectives to Rasch Measurement
(Linacre & Fisher)………………………...... 1383
The Web Index and Gender Bias Findings
(Annoni & Weziak-Bialowolska)…………... 1389
Rasch Measurement Transactions 26:3 Winter 2012 1374
Unidimensionality is important and should be seen as one
end of a continuum. Rather than asking ‘unidimensional
or not?’, we should ask ‘at what point on the continuum
does multidimensionality threaten the interpretation of
item and person estimates?’ (Smith, 2006, p. 206). The
Rasch literature is vague about this requirement and about
recommendations as to its assessment (Smith, 1996). It is
unreasonable to claim unidimensionality based solely on
item fit statistics. However, unidimensionality is often
assumed, rather than explicitly tested.
Infit and outfit test statistics summarizing squared
standardized response residuals are widely used to test fit
of data to the Rasch model, even though results
concerning their distribution are based on heuristic
arguments known to be wrong (Kreiner & Christensen,
2011a). When most items measure one dimension item fit
statistics flag remaining items as misfitting. Item fit
statistics are unlikely to have any power against
multidimensionality, for dimensions with equal numbers
of items, but patterns in residuals can indicate
multidimensionality (Smith, 2002).
Response residuals should be interpreted with caution
since their distribution is not known; however, indirect
evidence shows when fitting unidimensional Rasch
models to data where two underlying latent variables are
responsible for the correlations, typically they result as
negative correlation between residuals from items in
different dimensions. However, no formal test is obtained.
Importantly, evidence of local dependence should not
automatically be interpreted as evidence of multi-
dimensionality.
Formal tests can be obtained (e.g., the Martin-Löf test
which is a likelihood ratio test statistic). Using a chi-
square approximation will be useful only for disclosing
multidimensionality in large samples when the correlation
is modest (Christensen et al., 2002). Monte Carlo
approaches that yield more powerful, but also time-
consuming tests (Christensen & Kreiner, 2007) are also
implemented.
The ‘t-test approach’ tests equivalence of person
estimates from two subsets of items (Smith, 2002), after
converting the estimates to the same metric. The original
approach compared estimates generated on subsets of
items to estimates derived from the complete item set.
However, in this situation the estimates are not
independent (Tennant & Conaghan, 2007).
When the distribution of person location estimates is
approximately normal a high proportion of persons with
significantly different locations can be taken as evidence
against unidimensionality, but since estimates of person
locations for extreme scores are biased and non-normal, a
cautious approach is recommended for skewed score
distributions.
References
Christensen, KB, Bjorner JB, Kreiner S, & Petersen JH
(2002). Testing Unidimensionality in Polytomous Rasch
Models, Psychometrika, 67, 563-574.
Christensen, KB, & Kreiner, S (2007). A Monte Carlo
Approach to Unidimensionality Testing in Polytomous
Rasch Models, Applied Psychological Measurement, 3,
20-30.
Kreiner, S, & Christensen, KB (2011a). Exact Evaluation
of Bias in Rasch Model Residuals. In Baswell (ed.)
Advances in Mathematics Research, 12 (pp. 19-40).
Kreiner, S, & Christensen, KB (2011b). Item Screening in
Graphical Loglinear Rasch Models. Psychometrika, 76,
228-256.
Rasch, G. (1960). Probabilistic Models for Some
Intelligence and Attainment Tests. Copenhagen: Nielsen
& Lydiche.
Rasch, G. (1961). On General Laws and the Meaning of
Measurements in Psychology. Proceedings of the 4th
Berkley Symposium on Mathematical Statistics and
Probability, 4, 321-333. Reprinted in Bartholomew, D.J.
(ed.) (2006) Measurement Volume I, 319-334. Sage
Benchmarks in Social Research Methods, London: Sage
Publications.
Smith, RM (1996). A comparison of methods for
determining dimensionality in Rasch measurement,
Structural Equation Modeling, 3, 25-40.
Tennant, A, & Conaghan, PG. (2007). The Rasch
measurement model in rheumatology: What is it and why
use it? When should it be applied, and what should one
look for in a Rasch paper? Arthritis Care & Research, 57,
1358-1362.
Consider joining a Rasch Listserv
ACER
To join the ACER LISTSERV, send an e-mail with
text “subscribe rasch” to: mailserv\at/acer.edu.au
Matilda Bay Club (MBC)
The MBC maintains a multidisciplinary discussion list
dedicated to scientific measurement based on the
principles of Rasch Measurement. Please visit
http://www2.wu-wien.ac.at/marketing/mbc/ for more
information.

Rasch Measurement Transactions 26:3 Winter 2012 1375
“Rasch measurement theory and factor analysis” –
George Engelhard, Jr.
Social, behavioral and health scientists increasingly use
Rasch measurement theory (RMT) to develop measures
for the key constructs included in their theories of human
behavior (Engelhard, in press). As the number of
research publications based on RMT increases, journal
editors and peer reviewers who are unfamiliar with
modern measurement theory may ask questions about the
relationship between RMT and factor analysis (FA).
There are a variety of ways to view the relationships
among RMT and FA. My perspective is represented in
Figure 1. First of all, I view measurement through the
philosophical lens of invariant measurement (IM). IM
has been called "specific objectivity" by Rasch, and other
measurement theorists have used other labels (Engelhard,
2008). The five requirements of IM are as follows:
Person measurement:
1. The measurement of persons must be independent of
the particular items that happen to be used for the
measuring: Item-invariant measurement of persons.
2. A more able person must always have a better chance
of success on an item than a less able person: Non-
crossing person response functions.
Item calibration:
3. The calibration of the items must be independent of
the particular persons used for calibration: Person-
invariant calibration of test items.
4. Any person must have a better chance of success on
an easy item than on a more difficult item: Non-crossing
item response functions.
Variable map:
5. Items and person must be simultaneously located on a
single underlying latent variable: Variable map.
RMT can be viewed as a psychometric model that can
meet the requirements of IM when there is acceptable
model-data fit. In essence, RMT embodies ideal-type
models that meet the requirements of IM. However, it is
important to stress that with real data, IM reflects a set of
hypotheses that are examined with a variety of model-data
fit indices. As shown in Figure 1, I view the customary
RMT indices of model-data fit (e.g., Outfit/Infit statistics,
reliability of separation indices, and variable maps) as
support for the inference that a particular data set has
approximated the requirements of IM. Some of the
analytic tools from FA can also be used to provide
evidence regarding fit and unidimensionality, such as
scree plots and eigenvalue-based indices Reckase (1979).
Randall and Engelhard (2010) provide an illustration of
using confirmatory FA and RMT to examine
measurement invariance.
RMT and FA provide analytic tools for exploring model-
data fit to explore hypotheses regarding invariant
measurement. No single model-data fit index can detect
all of the possible sources of misfit. Model-data fit is
sample-dependent, and the key question in judging fit is:
How good is good enough? There is no definitive
statistical answer to this question, but various indices
(including FA) can provide evidence to support inferences
regarding invariance within a particular context.
Figure 1. Conceptual Framework
References
Engelhard, G. (in press). Invariant measurement: Using
Rasch models in the social, behavioral, and health
sciences. New York: Routledge.
Engelhard, G. (2008). Historical perspectives on
invariant measurement: Guttman, Rasch, and Mokken
[Focus article]. Measurement: Interdisciplinary Research
and Perspectives (6), 1-35.
Rasch, G. (1960/1980). Probabilistic models for some
intelligence and attainment tests. Copenhagen: Danish
Institute for Educational Research. (Expanded edition,
Chicago: University of Chicago Press, 1980).
Randall, J., & Engelhard, G. (2010). Using Confirmatory
Factor Analysis and Rasch Measurement Theory to
Assess Measurement Invariance in a High Stakes Reading
Assessment. Applied Measurement in Education, 23,
286-306.
Reckase, M.D. (1979). Unifactor latent trait models
applied to multifactor tests: Results and implications.
Journal of Educational Statistics, 4, 207-230.
Rasch Measurement Transactions 26:3 Winter 2012 1376
“The Rasch model and factor analysis: Complementary
or mutually exclusive?” – Thomas Salzberger
Striving for the same goal?
The Rasch model (RM) and factor analysis (FA) claim to
serve the same purpose: measurement. This raises several
questions. What is their relationship? Can we dispense
with factor analysis altogether? Should Rasch analysis
and factor analysis be carried out in a complementary
fashion or side by side? There are no unambiguous
answers to these questions; at least not if we take
sociology of science into account.
RM and FA can be compared at the rather technical
micro-level, which we will discuss later, or at the
“philosophical” macro-level. At the latter, invariance as
the defining property of the RM (Andrich 1988, 2010) is
crucial. If invariance is empirically supported across
samples from different subpopulations and occasions, in
other words, across space and time, then measures are
comparable and a uniform latent variable is a viable
assumption within the established frame of reference. By
contrast, if item parameter estimates fail to replicate
across different samples or occasions, no common frame
of reference can be established and the hypothesis of a
uniform latent variable is untenable.
Multi-group FA (MG-FA) extends the idea of invariance
to FA by imposing equality constraints mostly on factor
loadings, item intercepts, and error variances (Meredith,
1993). This procedure has shortcomings, though. FA
models do not separate respondent and item properties.
Thus, factor loadings and item intercepts are sample
dependent. It is therefore questionable whether truly
invariant items will necessarily show invariance in MG-
FA when respondent distributions and the targeting
markedly differ. Furthermore, FA is associated with a
series of highly problematic assumptions (see Wright
1996) with interval scale properties of item scores being
probably the most serious (and generally deemed very
unlikely) supposition. The point, though, is that if item
scores are linear measures then FA is justified and the
application of the RM is not. The reason for the latter is
that the non-linear transformation of the raw score would
be incorrect, since the raw score is already linear.
Conversely, if the item scores are non-linear, the
application of FA is unjustified (see Waugh and
Chapman, 2005), while the RM is appropriate. This
implies that the RM and FA are, strictly speaking,
incompatible, mutually exclusive models. While the RM,
by assessing fit, investigates whether observed person raw
scores can be converted into linear person measures and
observed item raw scores into linear item measures, FA
requires measures as the input.
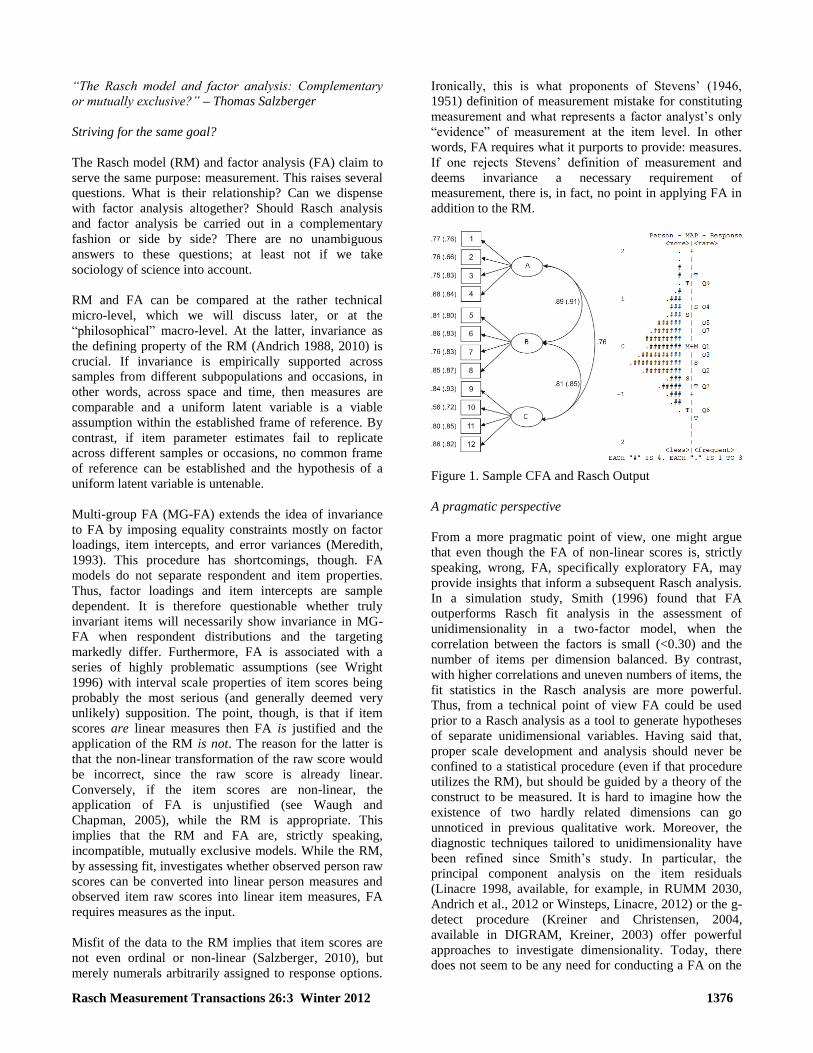
Misfit of the data to the RM implies that item scores are
not even ordinal or non-linear (Salzberger, 2010), but
merely numerals arbitrarily assigned to response options.
Ironically, this is what proponents of Stevens’ (1946,
1951) definition of measurement mistake for constituting
measurement and what represents a factor analyst’s only
“evidence” of measurement at the item level. In other
words, FA requires what it purports to provide: measures.
If one rejects Stevens’ definition of measurement and
deems invariance a necessary requirement of
measurement, there is, in fact, no point in applying FA in
addition to the RM.
Figure 1. Sample CFA and Rasch Output
A pragmatic perspective
From a more pragmatic point of view, one might argue
that even though the FA of non-linear scores is, strictly
speaking, wrong, FA, specifically exploratory FA, may
provide insights that inform a subsequent Rasch analysis.
In a simulation study, Smith (1996) found that FA
outperforms Rasch fit analysis in the assessment of
unidimensionality in a two-factor model, when the
correlation between the factors is small (<0.30) and the
number of items per dimension balanced. By contrast,
with higher correlations and uneven numbers of items, the
fit statistics in the Rasch analysis are more powerful.
Thus, from a technical point of view FA could be used
prior to a Rasch analysis as a tool to generate hypotheses
of separate unidimensional variables. Having said that,
proper scale development and analysis should never be
confined to a statistical procedure (even if that procedure
utilizes the RM), but should be guided by a theory of the
construct to be measured. It is hard to imagine how the
existence of two hardly related dimensions can go
unnoticed in previous qualitative work. Moreover, the
diagnostic techniques tailored to unidimensionality have
been refined since Smith’s study. In particular, the
principal component analysis on the item residuals
(Linacre 1998, available, for example, in RUMM 2030,
Andrich et al., 2012 or Winsteps, Linacre, 2012) or the g-
detect procedure (Kreiner and Christensen, 2004,
available in DIGRAM, Kreiner, 2003) offer powerful
approaches to investigate dimensionality. Today, there
does not seem to be any need for conducting a FA on the

Rasch Measurement Transactions 26:3 Winter 2012 1377
raw data prior to a Rasch analysis. In fact, researchers
might feel the need to run a confirmatory FA (CFA) after
the Rasch assessment of a scale in order to use measures
in a structural equation model (SEM). However, Rasch
measures can be integrated into SEM quite easily.
Instructions how to do this can be found in Salzberger
(2011).
The sociology of science perspective
From a Rasch perspective, there is no need to run a FA
prior to, simultaneously with, or after a Rasch analysis.
On the other hand, anyone who has ever tried to publish a
Rasch analysis of a scale will have very likely been
confronted with the problem of explaining the differences
between the RM and FA, felt the pressure to justify the
use of the RM, and probably also experienced resistance
and refusal. This is where the sociology of science comes
in. When one gets into a dispute between paradigms
(Andrich 2004), there are at least three different strategies
we could pursue, which we might want to call the pure
approach, the comparative approach, and the assimilation
strategy. First, following the pure approach, the researcher
compares the RM and FA at the theoretical macro-level
stressing the unique properties of the RM and its
relationship to the problem of measurement. The
empirical analysis is confined to the RM. Second, the
comparative approach aims at exposing empirically the
differences between the RM and FA. The RM and FA can
be compared at the macro-level, but also at the micro-
level. The latter describes, for example, which parameters
in the RM correspond most closely to parameters in FA
(see Wright, 1996; Ewing et al., 2005). Third, in the
assimilation strategy, the Rasch analysis and FA are
forced to converge, or at least presented in a way that
suggests comparable results based on the RM and FA.
Since this strategy downplays the theoretical differences
between the RM and FA, a comparison focuses on the
micro-level.
The pure approach is probably the most consistent and
meaningful path but also the most confrontational. The
comparative approach may provide interesting insights
but raises the problem of how to argue the superiority of
the RM over FA to an audience that does not
acknowledge the theoretical underpinnings of the RM.
There is a serious threat of falling into the trap of trying to
empirically decide whether the RM or FA is better. The
assimilation strategy can actually be detrimental to the
dissemination of the RM as it easily creates the
impression that the RM and FA lead eventually to the
same or very similar results. The assimilation strategy can
also be pursued unwittingly, particularly when existing
scales, originally developed based on FA, are reanalyzed
using the RM. Such scales often show a limited variation
in terms of item locations. Then the RM as well as FA
might exhibit acceptable fit. In addition, the correlation
between factor scores, or raw scores, and Rasch measures
are typically very high leading to the false impression that
the application of the RM generally makes no substantial
difference. Issues like invariance, the construct map, the
interpretation of measures with reference to items, or
targeting, to name just a few, are suppressed.
Conclusions
A Rasch analysis, in principle, hardly benefits from
additional input from FA. However, in the interest of
acceptance, researchers might feel pressed to incorporate
FA into a Rasch paper. Combining Rasch analysis with
FA increases the likelihood that non-Rasch researchers
(specifically reviewers and editors) become connected
with a Rasch paper and that Rasch measurement appears
less menacing. At the same time researchers should be
cognizant of the potential for misrepresenting the
differences between the RM and FA. In any case, it is
pivotal to outline the requirements of measurement and to
ensure that the Rasch philosophy and the theory of the
construct guide the scale development and formation.
Then the complementary presentation of results based on
FA makes no difference to substantive conclusions.
Contributions that aim at a methodological comparison of
Rasch measurement and FA are, of course, a different
issue.
References
Andrich, D. (1988). Rasch models for measurement.
Beverly Hills: Sage Publications.
Andrich, D. (2004). Controversy and the Rasch model: a
characteristic of incompatible paradigms? Medical Care,
42, 1–16.
Andrich, D. (2010). Sufficiency and conditional
estimation of person parameters in the polytomous Rasch
model, Psychometrika, 75(2), 292-308.
Andrich, D., Sheridan, B.S., & Luo, G. (2012). Rumm
2030: Rasch Unidimensional Measurement Models
(software). RUMM Laboratory Perth, Western Australia.
Ewing, M.; Salzberger, T., & Sinkovics, R. (2005). An
Alternate Approach to Assessing Cross-Cultural
Measurement Equivalence in Advertising Research.
Journal of Advertising, 34(1), 17-36.
Kreiner, S. (2003). Introduction to DIGRAM [computer
software], Department of Biostatistics, University of
Copenhagen (www.biostat.ku.dk).
Kreiner, S., & Christensen, K.B. (2004). Analysis of
Local Dependence and Multi-dimensionality in Graphical
Loglinear Rasch Models, Communications in Statistics -
Theory and Methods, 33, 1239–1276.
Rasch Measurement Transactions 26:3 Winter 2012 1378
Linacre, J.M. (1998). Structure in Rasch residuals: Why
principal components analysis (PCA)? Rasch
Measurement Transactions, 12(2), 636.
Linacre, J.M. (2012). Winsteps 3.75, [Rasch Model
Computer Program], Chicago, Il, 1991-2012.
Meredith, W. (1993). Measurement invariance, factor
analysis and factorial invariance, Psychometrika, 58 (4),
525-543.
Salzberger, T. (2010). Does the Rasch Model Convert an
Ordinal Scale into an Interval Scale? Rasch Measurement
Transactions, 24(2), 1273-75.
Salzberger, T. (2011). Specification of Rasch-based
Measures in Structural Equation Modelling (SEM).
Available from:
http://www2.wu.ac.at/marketing/mbc/download/Rasch_S
EM.pdf.
Smith, R, (1996). A Comparison of Methods for
Determining Dimensionality in Rasch Measurement.
Structural Equation Modeling – A Multidisciplinary
Journal, 3(1), 25-40.
Stevens, S.S. (1946). On the Theory of Scales of
Measurement, Science, 103, 667-680.
Stevens, S.S. (1951). Mathematics, Measurement, and
Psychophysics. In S.S. Stevens (ed), Handbook of
Experimental Psychology, New York, NY: Wiley, pp. 1-
49.
Waugh, R.F., & Chapman, E.S. (2005). An Analysis of
Dimensionality Using Factor Analysis (True-Score
Theory) and Rasch Measurement: What Is the
Difference? Which Methods is Better? Journal of Applied
Measurement, 6 (1), 80-99.
Wright, B. (1996). Comparing Rasch Measurement and
Factor Analysis. Structural Equation Modeling – A
Multidisciplinary Journal, 3(1), 3-24.
A New Human Resource Metric
Standard for Investor Guidance
A proposed ANSI-SHRM standard for investor human
resource metrics ("ANSI-SHRM 02001.201X Investor
Metrics 1stPR DRAFT Standard v1 (040912).pdf") and
comments on it are available in the "Metrics and
Measures Taskforce (T02)" group at
http://hrstandardsworkspace.shrm.org/apps/group_public/
document.php?document_id=6504&wg_abbrev=mamt02.
ANSI is the American National Standards Institute, and
SHRM is the Society for Human Resource Management.
The proposed standard is one of the first of its kind.
One summary proposal concerning the standard was
offered by William Fisher, who suggested that the group:
“In future revisions of the standard, employ scaling and
instrument calibration methods capable of defining
invariant units and of then supporting invariant
comparisons across different vendors' particular ways of
approaching the constructs to be measured.” The full
comment was several paragraphs, and published
references were provided as resources to be consulted.
Lee Webster, of the standards task force, responded to the
proposal on October 5, saying “We appreciate this insight,
and agree that more sophisticated measures will
(hopefully) be possible in future revisions (as more data
become available). Since regular review of standards is a
required part of the ANSI process, there will be an
opportunity to look at these ideas in depth in the future.”
Standards are widely recognized for their value in
simplifying communication and facilitating trade. New
standards like that being developed by ANSI and SHRM
will be increasingly of interest as intangible assets, such
as abilities, health, motivations, and trustworthiness,
become ever more central to economic productivity. For
background on the role measurement plays in bringing
human, social, and natural capital to life, see the
references listed below, among others.
William P. Fisher, Jr.
University of California - Berkeley
References
Fisher, W. P., Jr. (2011). Bringing human, social, and
natural capital to life: Practical consequences and
opportunities. In N. Brown, B. Duckor, K. Draney & M.
Wilson (Eds.), Advances in Rasch Measurement, Vol. 2
(pp. 1-27). Maple Grove, MN: JAM Press.
Fisher, W. P., Jr. (2012). Measure and manage: Intangible
assets metric standards for sustainability. In J. Marques,
S. Dhiman & S. Holt (Eds.), Business administration
education: Changes in management and leadership
strategies (pp. 43-63). New York: Palgrave Macmillan.
Fisher, W. P., Jr. (2012). What the world needs now: A
bold plan for new standards. Standards Engineering,
64(3), 1 & 3-5 [http://ssrn.com/abstract=2083975].
Fisher, W. P., Jr., & Stenner, A. J. (2011). Metrology for
the social, behavioral, and economic sciences (Social,
Behavioral, and Economic Sciences White Paper Series).
Retrieved 25 October 2011, from National Science
Foundation:
http://www.nsf.gov/sbe/sbe_2020/submission_detail.cfm?
upld_id=36.
Rasch Measurement Transactions 26:3 Winter 2012 1379
Cronbach’s with the Dimension Coefficient
to Jointly Assess a Scale’s Quality
Reliability is a necessary, but not sufficient, component of
validity (Downing, 2003; Feldt, Brennan, 1989). The
dimension coefficient (DC) is, therefore, necessarily
incorporated with Cronbach’s to completely and fully
describe a scale’s characteristics (van der et al., 2003),
because not all reliable scales are valid (Cook, Beckman,
2006).
We manipulated data sets containing two types of item
length (12 and 20). Each, with 5-point polytomous
responses, was uniformly distributed across a 2 logit
range. This was done for 6 kinds of normally distributed
sample sizes (n = 12, 30, 50, 100, 300, and 500) with trait
standard deviations (SDs) uniformly distributed from 0.5
to 9.5 logits across numbers of misfit items from 0 to 2,
all of which misfit items are related to the true score with
a zero correlation under Rasch model conditions. A total
of 720 (= 2 item lengths 6 sample sizes 20 SDs 3
numbers of misfit items) simulation datasets were
administered in this study. True-score reliability and
dimension coefficients were simultaneously calculated for
each simulation data set.
In this case, DCs were temporarily defined by 5
respective approaches, such as Cronbach α, EGA_ratio as
Eq.1 that applies the logic of scree plots to propose a ratio
by computing the first and second eigenvalues (R12 =
λ1/λ2) with that of the second and third ones (R23 = λ2/λ3)(
Lord, 1980; Divgi, 1980), EGA_angle_ratio as Eq.2 that
computes a ratio on angles at the second and third
eigenvalues, Rasch loading SD as Eq.3 and
Rasch_EGA_ratio as Eq.(4) derived from Rasch PCA on
standardized residuals.
DC = (R12/R23)/(1 + (R12/R23)) Eq. (1)
DC= (θ12/θ23)/( 1 + (θ12/θ23)) Eq. (2)
DC= 1- Item loading SD Eq. (3)
DC = (RR12/RR23)/(1 + (RR12/RR23)) Eq. (4)
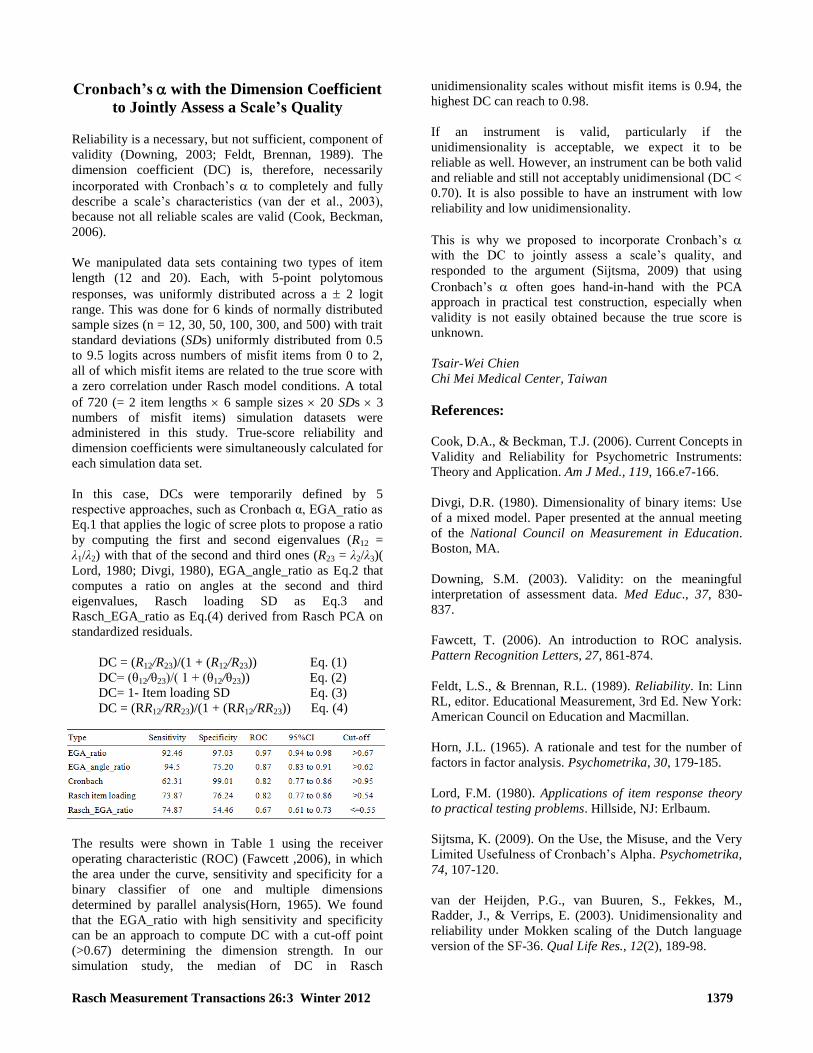
The results were shown in Table 1 using the receiver
operating characteristic (ROC) (Fawcett ,2006), in which
the area under the curve, sensitivity and specificity for a
binary classifier of one and multiple dimensions
determined by parallel analysis(Horn, 1965). We found
that the EGA_ratio with high sensitivity and specificity
can be an approach to compute DC with a cut-off point
(>0.67) determining the dimension strength. In our
simulation study, the median of DC in Rasch
unidimensionality scales without misfit items is 0.94, the
highest DC can reach to 0.98.
If an instrument is valid, particularly if the
unidimensionality is acceptable, we expect it to be
reliable as well. However, an instrument can be both valid
and reliable and still not acceptably unidimensional (DC <
0.70). It is also possible to have an instrument with low
reliability and low unidimensionality.
This is why we proposed to incorporate Cronbach’s
with the DC to jointly assess a scale’s quality, and
responded to the argument (Sijtsma, 2009) that using
Cronbach’s often goes hand-in-hand with the PCA
approach in practical test construction, especially when
validity is not easily obtained because the true score is
unknown.
Tsair-Wei Chien
Chi Mei Medical Center, Taiwan
References:
Cook, D.A., & Beckman, T.J. (2006). Current Concepts in
Validity and Reliability for Psychometric Instruments:
Theory and Application. Am J Med., 119, 166.e7-166.
Divgi, D.R. (1980). Dimensionality of binary items: Use
of a mixed model. Paper presented at the annual meeting
of the National Council on Measurement in Education.
Boston, MA.
Downing, S.M. (2003). Validity: on the meaningful
interpretation of assessment data. Med Educ., 37, 830-
837.
Fawcett, T. (2006). An introduction to ROC analysis.
Pattern Recognition Letters, 27, 861-874.
Feldt, L.S., & Brennan, R.L. (1989). Reliability. In: Linn
RL, editor. Educational Measurement, 3rd Ed. New York:
American Council on Education and Macmillan.
Horn, J.L. (1965). A rationale and test for the number of
factors in factor analysis. Psychometrika, 30, 179-185.
Lord, F.M. (1980). Applications of item response theory
to practical testing problems. Hillside, NJ: Erlbaum.
Sijtsma, K. (2009). On the Use, the Misuse, and the Very
Limited Usefulness of Cronbach’s Alpha. Psychometrika,
74, 107-120.
van der Heijden, P.G., van Buuren, S., Fekkes, M.,
Radder, J., & Verrips, E. (2003). Unidimensionality and
reliability under Mokken scaling of the Dutch language
version of the SF-36. Qual Life Res., 12(2), 189-98.

Rasch Measurement Transactions 26:3 Winter 2012 1380
A Method of Estimating the Item
Parameter from Time on Task
The purpose of this essay is to revisit Chapter 3 of
Probabilistic Models (Rasch, 1960) and to consider to
what extent the arguments from this chapter might be
applied to individual items in a computer based math test.
The intention is to look for inspiration from Rasch, but
not to follow his methodology exactly.
Hippisley (1999) showed that total completion times from
a computer based math test conformed to the (Rasch
1960) reading rate model. However, the assumption of
item homogeneity and uniform student speed, rather
limits the usefulness of that analysis. In reality, test items
are not homogenous, and students do not course through a
test at a uniform speed.
Theory
Rasch considered the “speededness” of students reading a
text in two ways. For those students who did not
complete the text within a prescribed time limit, he treated
the number of words read within the time as the stochastic
variable. For the students who did complete the test
(within the time limit), he treated the time actually taken
as the stochastic variable.
For the former group, if is mean or expected reading
rate, the probability of reading a words in time t is given
as:
P{a | t} = (( t)a/a!)e
- t (1)
The probability that no words are read in time t is a
special case, where N = 0. This reduces down to:
P{0 | t} = e- t
(2)
This expression may be applied to a student tackling a
single item in a math test. And while it derives from
Expression 1 for reading rates, and incorporates , (which
could be interpreted as an expected item completion rate),
the application will be from measuring the time during
which the item is not completed.
Rasch (1960) broke down into two factors. He argued
that the ratio of the reading rates between two pupils A
and B is interesting if it applies to a number of reading
texts. So if in a series of texts, 1, 2, .. i, pupil A reads
twice as fast as B:
A1 = 2B1
and
Ai = 2Bi
Dividing:
AiA1 = Bi/B1
Generalising:
1i11 = Ni/N1 (3)
So the ratio of the mean or expected reading rates of two
texts is independent of the pupils. That ratio tells is
something about the texts (relative ease of reading or
some other applicable descriptor) and it might be given
the parameter :
viv1 =
Rearranging:
vi = v1 (4)
Rasch (1960) described the term v1, the reading speed of
pupil v in a base text, as the person parameter v. He also
defined the reciprocal of as the difficulty of a text.
When applying this argument to an individual item in a
computer based math test, it should be born in mind that
the focus is on a single event. It is impossible to predict
exactly when the event will occur, and it is equally
impossible to estimate the value of from knowing when
the event occurred. To overcome this conundrum, a
method might be borrowed from natural science.
When physicists consider a sample of radioactive material
comprising many atoms, they apply the Law of Large
Numbers (Khoshnevisan, 2007), which essentially states
that if you run an experiment N times, where N is a very
large number, if p is the probability of an event, the
number of times the event actually occurs will
approximate to Np. From Expression 2 above, the
probability of a word not being read, or a math item not
being completed, or a radioactive atom not decaying, in
time t, is e-t
. Studying a sample originally comprising N0
atoms, is like running an experiment N0 times. After time
t, the approximate number N of atoms, which have not
decayed, will be given by:
N (t) = N0 e-t
(5)
The time th taken for N to become exactly half N0 is
known as the half-life of the material.
N0/2 = N0 e-th
2 = eth
ln2 = th
= ln2/ th (6)
So if you had a room full of clones all addressing the
same item at the same time, you could estimate from the
time it takes half of them to complete the item. Clones
are not easy to come by, but there is another formula from

Rasch Measurement Transactions 26:3 Winter 2012 1381
physics which deals with composite radioactive material
(L'Annunziata, 2012), and which could be applied to a
heterogeneous set of pupils.
In the case of two elements, if the decay rate of Element 1
with N1 atoms is 1 and that of Element 2 with N2 atoms
is 2, the combined decay rate c, or number of atoms
decaying per unit of time is:
-dN/dt = N11 + N22
In psychometrics, there is usually assumed to be just one
pupil of each type, so for two pupils, the combined item
completion rate becomes:
c = 1 + 2
Reverting to the Rasch notation of Expression 5, if these
pupils are addressing item i:
ci = 1i + 2i
ci = i (1 + 2)
If the same pupils address a second item j:
cj = j (1 + 2)
Dividing:
cicj = i (1 + 2) /j (1 + 2)
cicj = i /j (7)
So the ratio of the combined expected completion rates
becomes the ratio of the easiness of the two items, and is
independent of the person parameters of the two pupils. A
similar argument applies to three or more pupils.
Furthermore, the combined expected completion rate can
be estimated for each item from the median completion
time on each item using Expression 7.
Illustration
Figures 1 and 2 below show for 85 West Australian
primary school students, all of whom completed
(correctly) the items “4+4”, “3+5”, and “12+8” in a
computer based math test, the completion times on item
“3+5” against those on item “4+4”, and the completion
times on item “12+8” against those on item “4+4”. This
triple intersection set arose from a universal set of 14,480
student-item interactions. The settings were informal,
with class teachers using the computer based test as a
regular class activity, as opposed to a formal exam.
Table 1 shows the median completion times in
seconds and an estimate of c for each item. The
table also shows ratios of easiness and difficulty .
From the table, if item “4+4” is treated as the base
item, item “3+5” seems to be approximately two
thirds as easy or 1½ times as difficult, while “12+8”
seems to be approximately half as easy or twice as
difficult.
Completion times in secs for item 3+5 against 4+4
0
5
10
15
20
25
30
35
40
45
0 2 4 6 8 10
Figure 1.
Completion times in secs for item 12+8 against 4+4
0
10
20
30
40
50
60
70
0 2 4 6 8 10
Figure 2.
Item
Median Time
(s) ratio ratio
4+4 1.58 0.44
3+5 2.50 0.28 0.63 1.58
12+8 5.00 0.14 0.50 2.00
The purpose of this essay was to set out a method of
estimating the Rasch item parameter from time on task.
A method has been laid out, and an illustration has been
given. The illustration looked at just three items, all of
which had been addressed by the same pupils. Extending
the method to cover all of the possible items, which might

Rasch Measurement Transactions 26:3 Winter 2012 1382
come up in a simple math test, will either require a very
large sample of student-item interactions, or the
development of a system, which does not require exactly
the same pupils to address every item.
Jonathan Hippisley
Email: [email protected]
References
Hippisley J (1999) Looking at Data from an Interactive
Arithmetic Test from the Perspective of a Probabilistic
Model. Education Research & Perspectives, (25)2, 59-67.
Khoshnevisan D (2007) Probability Graduate Studies in
Mathematics, 80. American Mathematical Society.
L'Annunziata M (2012) Handbook of Radioactivity
Analysis. Academic Press.
Rasch G (1960) Probabilistic models for some
intelligence and attainment tests University of Chicago
Press, Chicago
Is Aberrant Response Behavior a
Stable Characteristic of Students in
Classroom Math Tests?
Various psychological and demographic characteristics of
individuals have been reported to have an association with
aberrant response behavior. If indeed they have (or at
least some of them do) then one would expect, as
suggested by Smith (1986) and Lamprianou (2005), that
an individual with an aberrant response pattern may
exhibit such behavior in other testing situations too. The
research reported here aimed to see if aberrant response
behavior is a stable characteristic of high-school students
in classroom math tests as expected. That is, whether
essentially the same students will misfit in administrations
of two different classroom math tests.
In the classroom setting math tests are more relevant, low-
stakes, administered by the students’ own comfortable-to-
be-with teacher and one would perhaps expect less
aberrance. This is a completely different context from the
high-stakes tests administered in a much stricter and
possibly a more stressful environment. At the same time,
one would expect some type of aberrance to occur due to
carelessness, sleepy behavior, copying, cheating, plodding
or guessing.
For the purposes of the study two classroom math tests
were used with a sample of 15-16 year old high school
students in three different schools in Cyprus. The first test
was administered to 635 students and the second to 445 of
them. The Rasch Partial Credit Model (PCM) was used
for the analyses of the data collected. Misfitting students
in both tests were identified with the use of the infit and
outfit mean square statistics for six different cut-off
values (1.3, 1.4, 1.5, 1.6, 1.8 and 2.0). The hypothesis of
no association between misfit in the one test and misfit in
the other was investigated with Chi square tests and it was
very clearly accepted with p-values much closer to 1.00
than to 0.05. Table 1 shows the observed frequencies and
row percentages in brackets for each cut-off value. The
last two columns show the chi-square statistics and p-
values without the continuity correction and with it in
brackets.
Table 1. Chi-square tests for association between misfit in
Test 1 and misfit in Test 2 Test 2
Cut-
off
Test 1
Fitting
Misfitting
Chi-
square
p-value
1.3
Fitting 196
(68.1%)
92
(31.9%)
0.514
(0.371)
0.474
(0.542) Misfitting 112
(71.3%)
45
(28.7%)
1.4
Fitting 233
(72.6%)
88
(27.4%)
0.000
(0.000)
0.999
(1.000) Misfitting 90
(72.6%)
34
(27.4%)
1.5
Fitting 261
(76.8%)
79
(23.2%)
0.104
(0.036)
0.747
(0.849) Misfitting 79
(75.2%)
26
(24.8%)
1.6
Fitting 276
(78.0%)
78
(22.0%)
0.000
(0.000)
0.991
(1.000) Misfitting 71
(78.0%)
20
(22.0%)
1.8
Fitting 323
(82.8%)
67
(17.2%)
0.034
(0.000)
0.854
(1.000) Misfitting 45
(81.8%)
10
(18.2%)
2.0
Fitting 345
(86.0%)
56
(14.0%)
0.573
(0.281)
0.449
(0.596) Misfitting 36
(81.8%)
8
(18.2%)
The findings of this study do not support Smith’s and
Lamprianou’s suggestion that aberrance is a stable
characteristic of individuals. It is concluded that misfit in
the one test is not associated with misfit in the other
among high school students taking classroom math tests.
A couple of cautions should be made about this study.
First, the test items used were mainly multistep
mathematical problems with partial credit awarding for
partial success instead of the usual dichotomous items
found in the majority of studies on student aberrance.
Perhaps it is easier to respond unexpectedly in
dichotomous items, especially for high ability students, as
reported by Petridou and Williams (2007). Where the
answer is marked either right or wrong if a high ability
student follows the correct method (as expected) but gives
the wrong answer (because of a careless mistake such as a
miscalculation, or a miscopy of the right answer) he or

Rasch Measurement Transactions 26:3 Winter 2012 1383
she scores 0 and that signals his or her response as
unexpected and probably the whole response string as
aberrant (especially if the test is short). This is much less
likely to happen with multistep problems. If such a
mistake occurs, on the last stages of the solution process,
the student will get most of the marks on that item and the
answer will not be considered unexpected. Second the
low stakes status of the tests linked to the administration
procedure, with the familiar classroom setting may make
the test takers feel more relaxed and perform more as
expected than in a stricter and less familiar environment.
The finding of this study, explored further in Panayides’
(2009), lead to the following intuitive conclusion: In
classroom math tests, although misfits do occur, they do
not predict misfits in other tests and are not dependent on
psychological or demographic characteristics of the test-
takers.
Panayiotis Panayides – Lyceum of Polemidia (Cyprus)
Peter Tymms – Durham University (UK)
References
Lamprianou, I. (2005). Aberrant response patterns: Issues
of internal consistency and concurrent validity. Paper
presented at the annual meeting of the American
Educational Research Association, April 11–15, in
Montreal, Canada.
Panayides, P. (2009). Exploring the reasons for aberrant
response patterns in classroom math tests. PhD thesis.
Durham University, UK.
Smith, R. M. (1986). Person Fit in the Rasch model.
Educational and Psychological Measurement 46, 359–
372.
Petridou, A. and J. Williams. (2007). Accounting for
Aberrant test Response Patterns using multilevel models.
Journal of Educational Measurement 44(3), 227–247.
*Note* Full article available at: Panayiotis, P., & Tymms,
P. (2012). Investigating whether aberrant response
behavior in classroom math tests is a stable characteristic
of students. Assessment in Education, Principles, Policy
& Practice, DOI:10.1080/0969594X.2012.723610
Harvey Goldstein’s Objections to
Rasch Measurement: A Response
from Linacre and Fisher
Let us start by considering Harvey Goldstein (HG, 2012,
p.153):
HG: “The specific literature on the ‘Rasch’ model, a
particularly simple item-response model, is ... insistent
that only a single dimension is needed in any given
application,”
JML comment: The number of dimensions needed, or
encountered, in a given application depend on the
application, but, whenever we talk about “more” or “less”
of something, we have declared the “something” to have
the properties of a dimension. The goal of the Rasch
model is to quantify that dimension in terms of additive
units of “more”-ness. The complexity of the Rasch model
matches this task.
WPF comment: Quantification is inherently linear along a
single dimension of more and less. If quantification is
desired, isolating those aspects of a construct that exhibit
consistent variation is essential.
HG: “The specific literature on the ‘Rasch’ model ....
displays a general unwillingness to explore further (see
Goldstein 1980 for an illustrative example).”
JML comment: Rasch analyses are unusual in that every
person, demographic group, item, item response option,
even each individual response, can be reported with fit
statistics, estimates and other indicators, as appropriate.
Routine exploration of any dataset includes searching for
secondary dimensions in the data, and determining their
impact on the empirical functioning of the intended
dimension. The depth and complexity of Rasch analysis
has advanced considerably since 1980. For instance, the
User Manual for BICAL, the leading Rasch software in
1980, was 95 pages of text. BICAL has about 2,000 lines
of computer code. An equivalent Rasch program in 2012,
Winsteps, has a User Manual with 615 pages of text and
has more than 70,000 lines of computer code.
WPF comment: The specific literature that refers to
Rasch’s work is wide ranging in the explorations of the
infinite ways in which constructs can interact, overlap, or
display anomalous features. Karabatsos (2003), for
instance, examines 36 different ways of evaluating
inconsistencies in person measures. In addition, a wide
range of Rasch models for item bundles or testlets,
multidimensional collections of constructs, multilevel
models of group-level effects, and multifaceted situations
of many kinds have emerged in the last 30 years.
Rasch Measurement Transactions
www.rasch.org/rmt
Editor: Kenneth Royal
Email Submissions to: Editor \at/ Rasch.org Copyright © 2012 Rasch Measurement SIG, AERA
Permission to copy is granted.
RMT Editor Emeritus: John M. Linacre
Rasch SIG Chair: Tim O’Neil
Secretary: Kirk Becker Program Chairs: Daeryong Seo & Kelly Bradley
Rasch SIG website: www.raschsig.org
Rasch Measurement Transactions 26:3 Winter 2012 1384
HG: “proponents of this model regard the model as
paramount and suggest that data should be constructed or
modified to satisfy the model’s assumptions.”
JML comment: Social Scientists, indeed scientists of all
types, construct or modify data to meet their intentions.
For instance, Census Bureaus construct the data they want
by writing appropriate questions. Analysis of Census data
often requires that the data be modified, because the
analytical question does not exactly match the question on
the Census form.
Currently “data mining” methodology is in vogue and
considered to be highly successful. Here are its stages
(Fayyad et al., 1996): (1) Data Selection, (2) Data Pre-
processing, (3) Data Transformation, (4) Data Mining, (5)
Interpretation/Evaluation. Rasch methodology uses the
same stages, but with (4) Rasch analysis. Stages (1) and
(2) correspond to data construction and modification. A
difference is that Rasch analysts tend to be more
methodical and overt about their data procedures.
WPF comment: HG’s objection is written in a
grammatically correct English sentence. This sentence
and manner of communication prioritizes a model of a
competent English reader able to understand written text.
HG, like most other proponents of this model, regard it as
paramount and assume that readers will be able to
construct or modify data to satisfy the model’s
assumptions. A measurement model is no different.
Instruments are texts that are written, read and interpreted
using the same cognitive operations employed in any act
of reading. HG would no more attempt written
communication in terms of a model that allows
ungrammatical constructions, mixed languages and
orthographies, or stray marks than measurement should be
attempted in terms of models that legitimate just any kind
of data. GIGO.
HG: “Thus, Andrich (2004) claims that this model
satisfies the conditions of ‘fundamental measurement’ and
as such attains the status of measurement in the physical
sciences”
JML comment: From a practical perspective, most
measurement in the physical sciences is based on
additivity, “one more unit is the same amount extra, no
matter how much there already is.” Additivity can be
demonstrated for Rasch parameter values (Rasch
measures) (Wright 1988), so Rasch measures have the
practical status of physical measures.
WPF comment: Measurement in physics is often
misconstrued as primarily a matter of accessing concrete
objects. On the contrary, the laws of science project
unrealistic and unobservable phenomena, like balls rolling
on frictionless planes, or objects left entirely to
themselves with no external influence, or a point-like
mass swinging on a weightless string. Rasch models are
exactly like models in physics in this respect of positing
unobservable ideals that serve as heuristic guides to
inference and decision making.
HG: “– a view about measurement in the social sciences
that in a slightly different context Gould (1981) has
labelled ‘physics envy’.”
JML comment: “Overcoming Physics Envy” (Clarke &
Primo, 2012) begins “How scientific are the social
sciences? Economists, political scientists and sociologists
have long suffered from an academic inferiority complex:
physics envy. They often feel that their disciplines should
be on a par with the ‘real’ sciences and self-consciously
model their work on them, using language (‘theory,’
‘experiment,’ ‘law’) evocative of physics and chemistry.”
Yes, Rasch analysts also share this feeling. But is it a bad
feeling? Haven’t “theory,” “experiment,” “law” generated
400 years of obvious progress in physics and chemistry?
Would social science be possible without theories and
hypotheses to guide our thoughts, experiments to verify
our conclusions, laws (observed regularities) to
encapsulate those conclusions into communicable and
useful forms? It is the same with measurement. “How
much?” is a basic question in both “real” science and
social science. Additive measures of well-defined
variables are the most straight-forward way for us to think
about, communicate and utilize “much”-ness.
“Overcoming Physics Envy” ends “Rather than attempt to
imitate the hard sciences, social scientists would be better
off doing what they do best: thinking deeply about what
prompts human beings to behave the way they do.”
But “thinking deeply” is exactly what Rasch facilitates.
The bulk of the raw data is segmented into well-behaved,
understandable dimensions on which carefully-thought-
out defensible inferences about human beings can be
based. The ill-behaved remnants of the raw data are
perplexing, perhaps inexplicable. We can think deeply
about these remnants and perhaps generate new insights
from them about human behavior, but these confusing
remnants do not impede us from making progress.
WPF comment: Many social scientists have long been
doing what they do best. Beginning from the emergence
of qualitative methods in the 1960s and 1970s, there has
been less and less concern with imitating any other field,
while more and more effort has been invested in creative
thinking. Recent studies of model-based reasoning in
science (for instance, Nersessian, 2006, 2008) show that
scientific thinking is not qualitatively different from any
other kind of thinking. The goal is not to imitate physics
or any one field, but to think productively in a manner
common to all fields. Rasch (1960) explicitly draws from
Maxwell’s method of analogy, which is exactly the
example Nersessian (2002) uses to illustrate model-based
reasoning (Fisher, 2010).

Rasch Measurement Transactions 26:3 Winter 2012 1385
Now let us consider Goldstein (2010), his response to
Panayides et al. (2010). Goldstein asserts that the Rasch
“model is inadequate, and that claims for its efficacy are
exaggerated and technically weak.” Here is the evidence
he presents in support of this generalization.
HG: Around 1980, in the United Kingdom, “the
advocates of using Rasch, notably Bruce Choppin, had a
weak case and essentially lost the argument. It was this
failure to make a convincing case that led to the dropping
of the use of this model for the [United Kingdom].”
JML comment: Around 1980, a convincing case could not
be made for any psychometric methodology, as my
employer at the time, Mediax Associates, discovered.
However, indications were more hopeful for Rasch than
for any of its competitors. Linacre (1995) demonstrates
that the deficiencies in the British educational system,
confirmed by Bruce Choppin’s application of Rasch
methodology, were crucial in its rejection.
HG: “the essence of the criticisms remains and centres
around the claim that the model provides a means of
providing comparability over time and contexts when
different test items are used.”
JML comment: In 1980, the empirical evidence for
comparability was weak, even though the theoretical basis
was strong. By 1997, the empirical evidence was also
strong (Masters, 1997). By 2012, so many testing
agencies have maintained comparability for many years
by using Rasch methodology that it is now routine.
WPF comment: Bond (2008) reports one such routinely
maintained basis for comparability. Re-analysis of data
from items used on tests over periods of 7 to 22 years at
one major testing agency showed that “correlations
between the original and new item difficulties were
extremely high (.967 in mathematics, .976 in reading).”
Bond continues, saying “the largest observed change in
student scores moving from the original calibrations to the
new calibrations was at the level of the minimal possible
difference detectable by the tests, with over 99% of
expected changes being less than the minimal detectable
difference.”
HG: “Misconceptions and inaccuracies. First, .... all
claims about item characteristics being group-independent
and abilities being test-independent, can be applied to
[Classical, IRT and Rasch] types of model.”
JML comment: Here is an experiment. Simulate a dataset
of 1000 persons and 200 items according to each of the
models. Split each dataset in two, the 500 higher-scoring
persons, and the 500 lower-scoring persons. Analyze each
pair of resulting datasets separately. To investigate group-
independence, cross-plot the pairs of item difficulty
estimates. Do they follow a statistically straight line? No,
except for Rasch models or models that approximate
Rasch models.
Now split the original datasets in two again, the 100
higher-scored items, and the 100 lower-scored items.
Analyze the pairs of resulting datasets separately. To
investigate test independence, cross-plot the two sets of
person ability estimates. Do they follow a statistically
straight line? No, except for Rasch models and estimation
procedures that impose the same person distribution on
both datasets. In summary, all claims cannot be applied to
all models. Only Rasch models support the claims.
HG: “Secondly, ... a 2-dimensional set of items
(representing different aspects of mathematics) could
actually appear to conform to a (unidimensional) Rasch
model, so that fitting the latter would be misleading.”
JML comment: Yes, a dataset that balances two distinct
dimensions can appear unidimensional on first inspection,
so current Rasch best-practice is to include an
investigation of the dimensionality of a dataset. All
empirical datasets are multidimensional to some extent. In
this example, the decision must be made as to whether the
different aspects of mathematics (say, arithmetic and
algebra) are different enough to be considered different
“dimensions” (say, for the purpose of identifying learning
difficulties) or are merely different strands of a
superordinate dimension (say, for the purpose of Grade
advancement).
Rasch-related Coming Events
Dec. 10-12, 2012, Mon.-Wed. In-person workshop:
Intermediate Rasch (A. Tennant, RUMM), Leeds,
UK, www.leeds.ac.uk/medicine/rehabmed/psychometric
Jan. 4-Feb. 1, 2013, Fri.-Fri. Online workshop:
Practical Rasch Measurement – Core Topics (E.
Smith, Winsteps), www.statistics.com,
March 25-27, 2013, Wed.-Fri.. In-person workshop:
Introductory Rasch (A. Tennant, RUMM), Leeds, UK,
Apr. 27 – May 1, 2013, Sat.-Wed. AERA Annual
Meeting, San Francisco, CA, www.aera.net,
May 15-17, 2013, Wed.-Fri. In-person workshop:
Introductory Rasch (A. Tennant, RUMM), Leeds,
UK,
May 20-22, 2013, Mon.-Wed. In-person workshop:
Intermediate Rasch (A. Tennant, RUMM), Leeds,
UK,
May 31-June 28, 2013, Fri.-Fri. Online workshop:
Practical Rasch Measurement – Core Topics (E.
Smith, Winsteps), www.statistics.com,
July 5-Aug. 2, 2013, Fri.-Fri. Online workshop:
Practical Rasch Measurement – Core Topics (E.
Smith, Winsteps), www.statistics.com.

Rasch Measurement Transactions 26:3 Winter 2012 1386
WPF comment: Yes, Smith (1996) illustrates the value of
a Principal Components Analysis of Rasch model
residuals, showing its value in detecting
multidimensionality when two or more constructs are
roughly equally represented in an item set. PCA’s
strength in this situation is complemented by the
sensitivity of the usual fit statistics when items primarily
represent a single construct and only a few are off-
construct or otherwise problematic.
HG: “Thirdly, the authors claim that there are no sample
distributional assumptions associated with the Rasch
model. This cannot be true, however, since all the
procedures used to estimate the model parameters....
necessarily make distributional assumptions.”
JML comment: Yes, different estimation methods make
different assumptions. For instance, many Rasch
maximum-likelihood estimation methods (including
CMLE, JMLE, PMLE) make no assumptions about the
distributions of the person abilities and item difficulties,
but do assume that the randomness in the data is normally
distributed. This assumption is routinely validated using
fit statistics.
WPF comment: The term “assumption” here is misused.
An assumption is something taken for granted, something
left unexamined on the basis of its status as something in
no need of attention. What HG refers to as assumptions
are in fact the very opposite. What distinguishes the art
and science of measurement from everyday assumptions
about what are matters of fact is that very close attention
is paid to the requirements that must be satisfied for
inference to proceed.
HG: “Fourthly, ... the authors.. claim that a ‘fundamental
requirement’ for measurement is that for every possible
individual the ‘difficulty’ order of all items is the same.
This is ... extremely restrictive. ... I also find it difficult to
see any theoretical justification for such invariance to be a
desirable property of a measuring instrument.”
JML comment: The difficulty hierarchy of the items
defines the latent variable. The easy items define what it
means to be low on the latent variable. The hard items
define what it means to be high on the latent variable. We
measure a person’s ability on a latent variable (for
instance, “arithmetic”) in order to make inferences about
that person’s arithmetic performance. If the definition of
the latent variable changes depending on the person’s
ability level, then we cannot make general statements
such as “division” is more difficult than “addition”
(Wright, 1992). We must add the impractical restrictive
phrase, “for people at such-and-such ability level”. The
inferential value of the latent variable is severely
diminished.
WPF comment: Being unable to see any theoretical
justification for invariance as a desirable property of a
measuring instrument belies fundamental misconceptions
of what instruments are and how they work. Invariance is
the defining property of instruments, no matter if they are
musical, surgical, or measuring. Without invariant
measures, orchestras and laboratories would be
impossible. “The scientist is usually looking for
invariance whether he knows it or not. ... The quest for
invariant relations is essentially the aspiration toward
generality, and in psychology, as in physics, the principles
that have wide applications are those we prize (Stevens
1951, p. 20). Perhaps HG terms invariance restrictive
because he misconceives it in some kind of absolute way,
as Guttman did. In actual practice, the uncertainty ranges
within which items fall vary across different kinds of
applications. Screening tolerates more uncertainty than
accountability, which tolerates more than diagnosis, and
which can in turn tolerate more than research
investigations of very small effect sizes.
HG: “Fifthly, the authors do not seem to appreciate the
problem of item dependency. .... There are all kinds of
subtle ways in which later responses can be influenced by
earlier ones.”
JML comment: An advantage of Rasch methodology is
that detailed analysis of Rasch residuals provides a means
whereby subtle inter-item dependencies can be
investigated. If inter-item dependencies are so strong that
they are noticeably biasing the measures, then Rasch
methodology supports various remedies. For instance, it
may be advantageous to combine the dependent items into
polytomous super-items (so effectively forming the items
into testlets).
WPF comment: One of the significant reasons for
requiring unidimensionality and invariance is, in fact, to
reveal anomalous local dependency. “To the extent that
measurement and quantitative technique play an
especially significant role in scientific discovery, they do
so precisely because, by displaying significant anomaly,
they tell scientists when and where to look for a new
qualitative phenomenon” (Kuhn, 1977, p. 205). As
another writer put it, expect the unexpected or you won’t
find it (van Oech, 2001). If you begin with the intention
of modeling dependencies, every data set and every
instrument will be different, and all of the differences
distinguishing them will be hidden in the modeled
interactions. The predominance of modeling of this kind
is precisely why the social sciences have made so little
progress. Real progress will be made only when we
implement uniform measurement standards capable of
supporting the kind of distributed cognition common in
language communities (Fisher, 2012), whether one
defines those communities in terms of English or
Mandarin, or in terms of Newton’s Second Law and the
Systeme Internationale des Unites.
HG: “Sixthly, ... This comes dangerously close to saying
that the data have to fit the preconceived model rather
Rasch Measurement Transactions 26:3 Winter 2012 1387
than finding a model that fits the data. It is quite opposed
to the usual statistical procedure whereby models (of
increasing complexity) are developed to describe data
structures. Indeed, the authors are quite clear that the idea
of ‘blaming the data rather than the model’ is an
important shift from standard statistical approaches. In
my view that is precisely the weakness of the authors’
approach.”
JML comment: What is here perceived to be “dangerous”
and “weakness”, most of Science perceives to be
necessary and strength. In general throughout Science, a
theory is constructed that usefully explains and predicts
important aspects of the data. This theory then becomes
the screen through which future data are validated. Only if
some future data cannot be coerced to conform to this
theory, and those data are shown to be valid, is this theory
bypassed in favor of some other theory and perhaps only
for those data. Rasch theory is useful in that it constructs
additive unidimensional measures from ordinal data. CTT
and non-Rasch IRT may provide better statistical
descriptions of specific datasets, but the non-linearity of
their estimates and their sample-distribution-dependent
properties render them less useful for inference.
WPF comment: Again, by writing in English and on a
technical subject, HG must require readers who fit his
preconceived model of the particular kind of person able
to understand his text. When he takes the measure of the
situation and puts it in words, he makes no effort
whatsoever to find a model for his text that will fit any
person at all who happens to approach it. He very
restrictively requires readers capable of reading English
and of comprehending somewhat technical terms. He
gladly sets aside the vast majority of the world population
who are unable to comprehend, or who are merely
uninterested in, his text. In positing the Pythagorean
theorem or Newton’s laws, we do exactly the same kind
of thing, focusing our attention on the salient aspects of a
situation and ignoring the 99.999% of the phenomena that
do not correspond. Our failure to do this more routinely in
the social sciences says more about the way we
misunderstand language, cognition, and our own
instruments than it does about any kind of supposed
shortcoming in Rasch theory.
HG: “Finally, ... The old Rasch formulation is just one,
oversimple, special case. All of these models are in fact
special kinds of factor analysis, or structural equation,
models which have binary or ordered responses rather
than continuous ones. As such they can be elaborated to
describe complex data structures, including the study of
individual covariates that may be related to the responses,
multiple factors or dimensions, and can be embedded
within multilevel structures.”
JML comment: Rasch models construct additive measures
(with known precision) from binary or ordered responses.
Additive measures are ideal for further statistical analysis.
Far from being obsolete, Rasch models are seen to be
useful building-blocks on which to build elaborate
statistical structures.
WPF comment: HG’s observation assumes that
measurement is primarily achieved by means of data
analysis. But once an instrument is calibrated, and the
item estimates persist in their invariant pattern across
samples and over time, does not further data analysis
become exceedingly redundant? Only the most counter-
productive and obstructionist kind of person would resist
the prospect of capitalizing on the opportunity to make
great efficiency gains by fixing the unit at a standard
value. Yes, Rasch mixture, multilevel, multifaceted, item
bundle, etc. models are highly useful, but an important
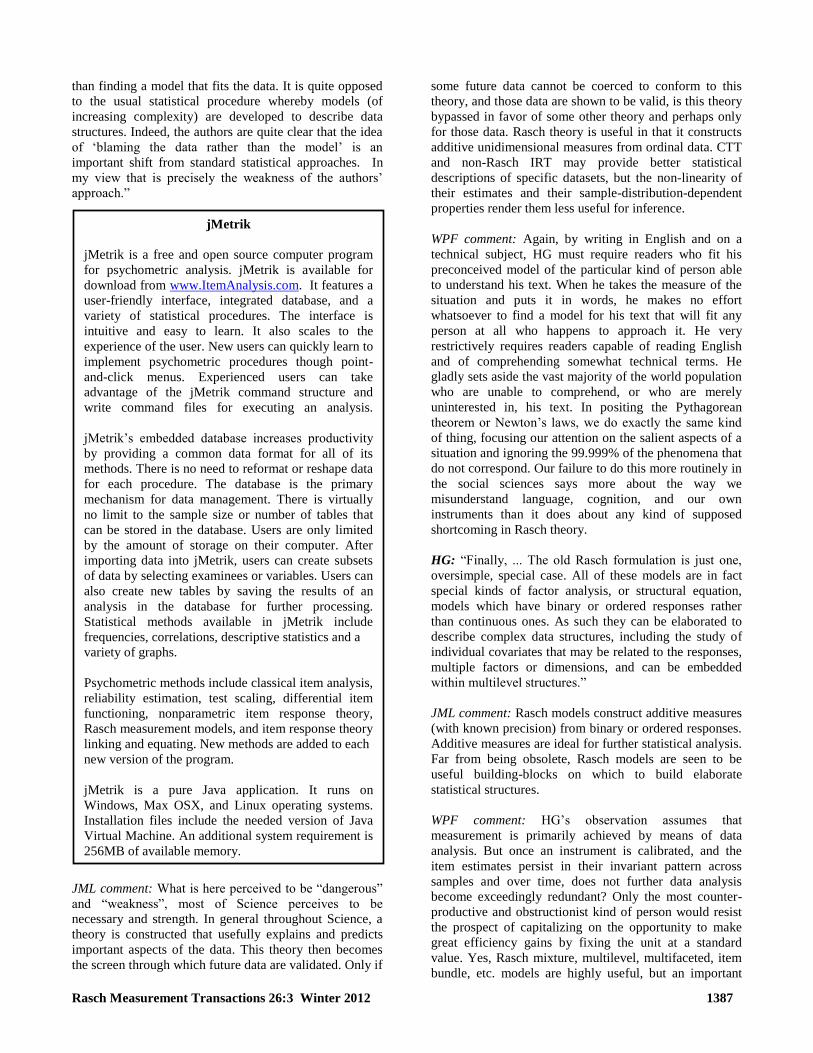
jMetrik
jMetrik is a free and open source computer program
for psychometric analysis. jMetrik is available for
download from www.ItemAnalysis.com. It features a
user-friendly interface, integrated database, and a
variety of statistical procedures. The interface is
intuitive and easy to learn. It also scales to the
experience of the user. New users can quickly learn to
implement psychometric procedures though point-
and-click menus. Experienced users can take
advantage of the jMetrik command structure and
write command files for executing an analysis.
jMetrik’s embedded database increases productivity
by providing a common data format for all of its
methods. There is no need to reformat or reshape data
for each procedure. The database is the primary
mechanism for data management. There is virtually
no limit to the sample size or number of tables that
can be stored in the database. Users are only limited
by the amount of storage on their computer. After
importing data into jMetrik, users can create subsets
of data by selecting examinees or variables. Users can
also create new tables by saving the results of an
analysis in the database for further processing.
Statistical methods available in jMetrik include
frequencies, correlations, descriptive statistics and a
variety of graphs.
Psychometric methods include classical item analysis,
reliability estimation, test scaling, differential item
functioning, nonparametric item response theory,
Rasch measurement models, and item response theory
linking and equating. New methods are added to each
new version of the program.
jMetrik is a pure Java application. It runs on
Windows, Max OSX, and Linux operating systems.
Installation files include the needed version of Java
Virtual Machine. An additional system requirement is
256MB of available memory.
Rasch Measurement Transactions 26:3 Winter 2012 1388
goal is to create a new metrological culture in the social
sciences. Qualitative and quantitative data and methods
need to be blended in the context of instruments tuned to
the same scales. Only then will we find paths to new ways
of harmonizing relationships.
HG: “Attempting to resurrect the Rasch model
contributes nothing new.”
JML comment: Only in the UK has the Rasch model
needed resurrection. However, “attempting to resurrect
the Rasch model” forces us to reconsider the philosophy
underlying Social Science. Is Social Science to become
exclusively qualitative with an endless accumulation of
suggestive case studies but no counts of anything? Is
Social Science to become exclusively quantitative with its
focus solely on summary statistics and arcane descriptive
models? Or is Social Science to become a synergistic
blend of qualitative and quantitative? This is the ideal
toward which Rasch methodology strives as it attempts to
construct meaningful, sometimes new, qualitatively-
defined unidimensional variables out of counts of
inevitably messy ordered observations.
WPF comment: The point is to be able to persist in
questioning, to continue the conversation. Statistical
models can sometimes describe data to death, meaning
that they become so over-parameterized that nothing of
value can be generalized from that particular situation to
any other. All models are wrong, as Rasch (1960, pp. 37-
38; 1973/2010) stressed. But even though there are no
Pythagorean triangles in the real world, they still prove
immensely useful as heuristic guides to inference in tasks
as concrete as real estate development, titling, and
defending property rights. If we can resist the pressures
exerted by HG and others bent on prematurely closing off
questioning about potential general invariances, we may
eventually succeed in creating real value in social science.
But if we instead focus only on ephemeral local specifics
inapplicable beyond their immediate contexts, we will
continue to be subject to aspects of our existence that we
do not understand.
John Michael Linacre (JML)
William P. Fisher, Jr. (WPF)
References
Andrich, D. (2004) Controversy and the Rasch model: a
characteristic of incompatible paradigms? Medical Care
42, Suppl. 1: 1–7.
Bond, T. (2008). Invariance and item stability. Rasch
Measurement Transactions, 22(1), 1159
www.rasch.org/rmt/rmt221h.htm
Clarke K. A. & Primo D.M. (2012) Overcoming ‘Physics
Envy’. New York Times, April 1, 2012, New York
Edition, p. SR9.
www.nytimes.com/2012/04/01/opinion/sunday/the-social-
sciences-physics-envy.html
Fayyad, U., Piatetsky-Shapiro, G., Smyth, P. (1996).
"From Data Mining to Knowledge Discovery in
Databases". AI Magazine 17(3), 37-54.
www.kdnuggets.com/gpspubs/aimag-kdd-overview-1996-
Fayyad.pdf
Fisher, W. P., Jr. (2010). The standard model in the
history of the natural sciences, econometrics, and the
social sciences. Journal of Physics: Conference Series,
238(1), iopscience.iop.org/1742-
6596/238/1/012016/pdf/1742-6596_238_1_012016.pdf.
Fisher, W. P., Jr. (2012, May/June). What the world needs
now: A bold plan for new standards. Standards
Engineering, 64(3), 1 & 3-5. ssrn.com/abstract=2083975
Goldstein, H. (1980) Dimensionality, bias, independence
and measurement scale problems in latent trait test score
models. British Journal of Mathematical and Statistical
Psychology, 33, 2: 234–46.
Goldstein H. (2010) Rasch measurement: a response to
Payanides [sic], Robinson and Tymms.
www.bristol.ac.uk/cmm/team/hg/response-to-
payanides.pdf
Goldstein, H. (2012) Francis Galton, measurement,
psychometrics and social progress. Assessment in
Education: Principles, Policy & Practice, 19(2), May
2012, 147–158. www.bristol.ac.uk/cmm/team/hg/full-
publications/2012/Galton.pdf
Gould, S.J. (1981) The Mismeasure of Man. New York:
W.W. Norton.
Karabatsos, G. (2003). A comparison of 36 person-fit
statistics of Item Response Theory. Applied Measurement
in Education, 16, 277-298.
Kuhn, T. S. (1977). The essential tension: Selected studies
in scientific tradition and change. Chicago, Illinois:
University of Chicago Press.
Linacre J.M. (1995) Bruce Choppin, visionary. Rasch
Measurement Transactions, 8(4), p. 394.
www.rasch.org/rmt/rmt84e.htm
Masters G.N. (1997) Where has Rasch Measurement
Proved Effective? Rasch Measurement Transactions,
11(2), 568. www.rasch.org/rmt/rmt112j.htm
Nersessian, N. J. (2002). Maxwell and "the method of
physical analogy": Model-based reasoning, generic
abstraction, and conceptual change. In D. Malament
(Ed.), Essays in the history and philosophy of science and
mathematics (pp. 129-166). Lasalle, Illinois: Open Court.
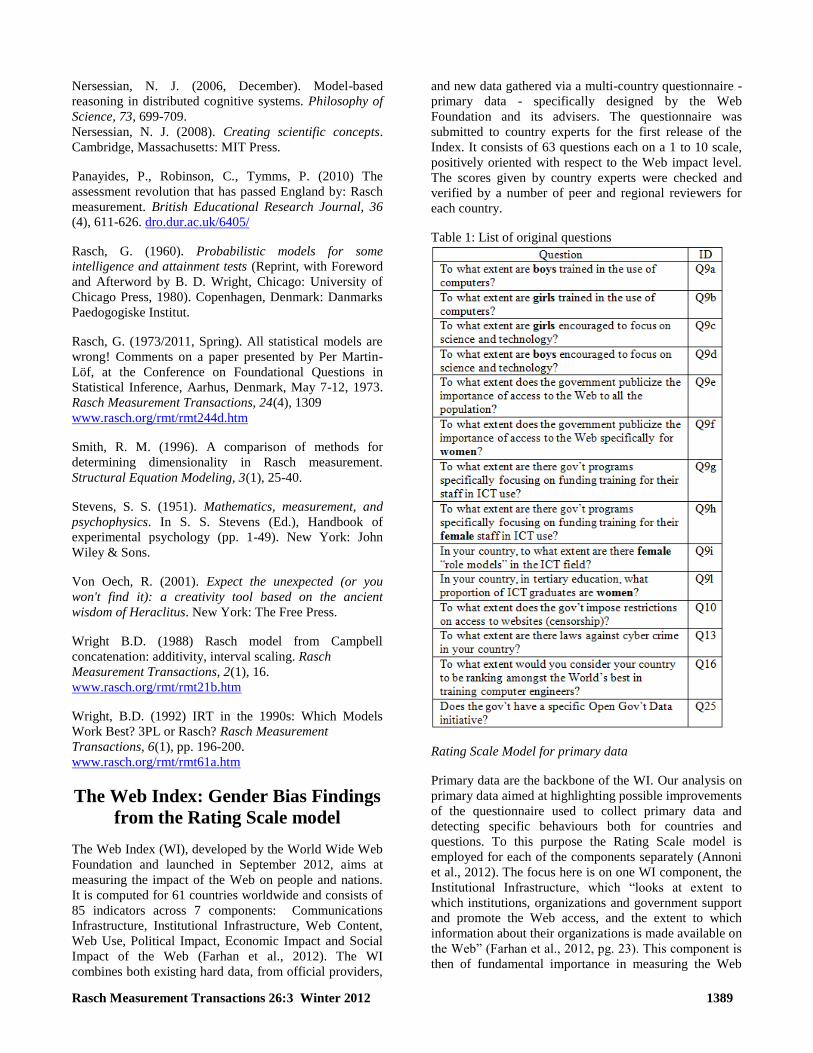
Rasch Measurement Transactions 26:3 Winter 2012 1389
Nersessian, N. J. (2006, December). Model-based
reasoning in distributed cognitive systems. Philosophy of
Science, 73, 699-709.
Nersessian, N. J. (2008). Creating scientific concepts.
Cambridge, Massachusetts: MIT Press.
Panayides, P., Robinson, C., Tymms, P. (2010) The
assessment revolution that has passed England by: Rasch
measurement. British Educational Research Journal, 36
(4), 611-626. dro.dur.ac.uk/6405/
Rasch, G. (1960). Probabilistic models for some
intelligence and attainment tests (Reprint, with Foreword
and Afterword by B. D. Wright, Chicago: University of
Chicago Press, 1980). Copenhagen, Denmark: Danmarks
Paedogogiske Institut.
Rasch, G. (1973/2011, Spring). All statistical models are
wrong! Comments on a paper presented by Per Martin-
Löf, at the Conference on Foundational Questions in
Statistical Inference, Aarhus, Denmark, May 7-12, 1973.
Rasch Measurement Transactions, 24(4), 1309
www.rasch.org/rmt/rmt244d.htm
Smith, R. M. (1996). A comparison of methods for
determining dimensionality in Rasch measurement.
Structural Equation Modeling, 3(1), 25-40.
Stevens, S. S. (1951). Mathematics, measurement, and
psychophysics. In S. S. Stevens (Ed.), Handbook of
experimental psychology (pp. 1-49). New York: John
Wiley & Sons.
Von Oech, R. (2001). Expect the unexpected (or you
won't find it): a creativity tool based on the ancient
wisdom of Heraclitus. New York: The Free Press.
Wright B.D. (1988) Rasch model from Campbell
concatenation: additivity, interval scaling. Rasch
Measurement Transactions, 2(1), 16.
www.rasch.org/rmt/rmt21b.htm
Wright, B.D. (1992) IRT in the 1990s: Which Models
Work Best? 3PL or Rasch? Rasch Measurement
Transactions, 6(1), pp. 196-200.
www.rasch.org/rmt/rmt61a.htm
The Web Index: Gender Bias Findings
from the Rating Scale model
The Web Index (WI), developed by the World Wide Web
Foundation and launched in September 2012, aims at
measuring the impact of the Web on people and nations.
It is computed for 61 countries worldwide and consists of
85 indicators across 7 components: Communications
Infrastructure, Institutional Infrastructure, Web Content,
Web Use, Political Impact, Economic Impact and Social
Impact of the Web (Farhan et al., 2012). The WI
combines both existing hard data, from official providers,
and new data gathered via a multi-country questionnaire -
primary data - specifically designed by the Web
Foundation and its advisers. The questionnaire was
submitted to country experts for the first release of the
Index. It consists of 63 questions each on a 1 to 10 scale,
positively oriented with respect to the Web impact level.
The scores given by country experts were checked and
verified by a number of peer and regional reviewers for
each country.
Table 1: List of original questions
Rating Scale Model for primary data
Primary data are the backbone of the WI. Our analysis on
primary data aimed at highlighting possible improvements
of the questionnaire used to collect primary data and
detecting specific behaviours both for countries and
questions. To this purpose the Rating Scale model is
employed for each of the components separately (Annoni
et al., 2012). The focus here is on one WI component, the
Institutional Infrastructure, which “looks at extent to
which institutions, organizations and government support
and promote the Web access, and the extent to which
information about their organizations is made available on
the Web” (Farhan et al., 2012, pg. 23). This component is
then of fundamental importance in measuring the Web
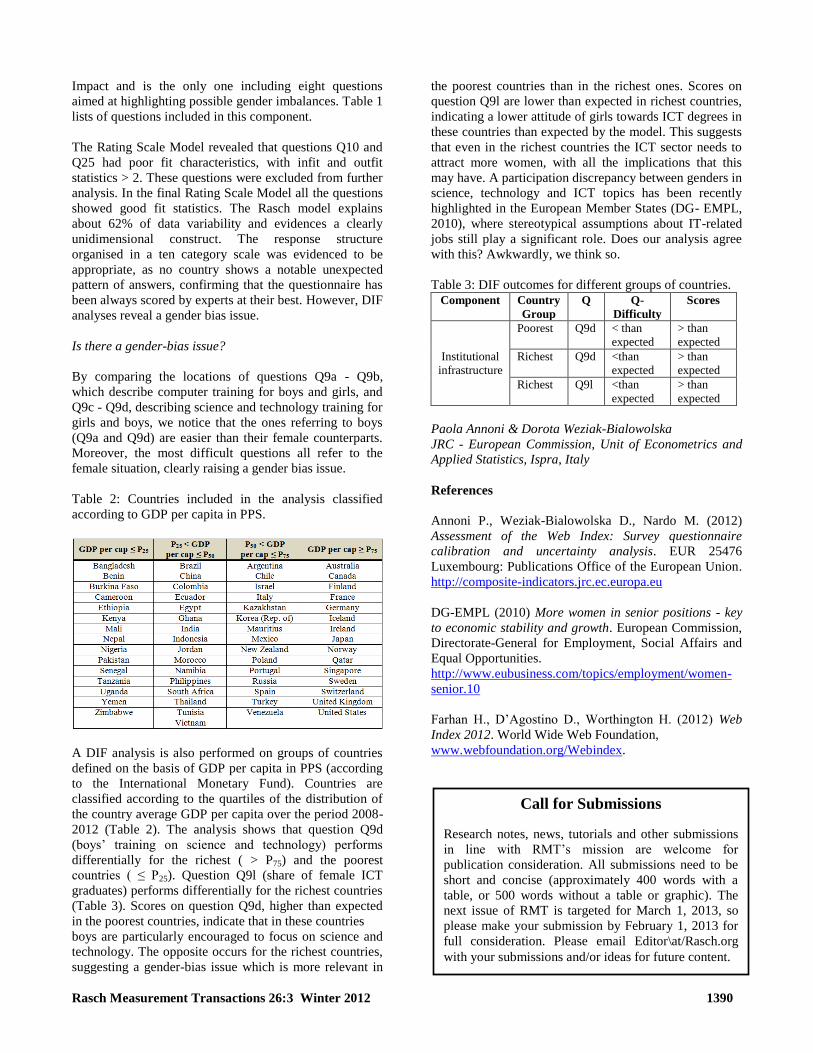
Rasch Measurement Transactions 26:3 Winter 2012 1390
Impact and is the only one including eight questions
aimed at highlighting possible gender imbalances. Table 1
lists of questions included in this component.
The Rating Scale Model revealed that questions Q10 and
Q25 had poor fit characteristics, with infit and outfit
statistics > 2. These questions were excluded from further
analysis. In the final Rating Scale Model all the questions
showed good fit statistics. The Rasch model explains
about 62% of data variability and evidences a clearly
unidimensional construct. The response structure
organised in a ten category scale was evidenced to be
appropriate, as no country shows a notable unexpected
pattern of answers, confirming that the questionnaire has
been always scored by experts at their best. However, DIF
analyses reveal a gender bias issue.
Is there a gender-bias issue?
By comparing the locations of questions Q9a - Q9b,
which describe computer training for boys and girls, and
Q9c - Q9d, describing science and technology training for
girls and boys, we notice that the ones referring to boys
(Q9a and Q9d) are easier than their female counterparts.
Moreover, the most difficult questions all refer to the
female situation, clearly raising a gender bias issue.
Table 2: Countries included in the analysis classified
according to GDP per capita in PPS.
A DIF analysis is also performed on groups of countries
defined on the basis of GDP per capita in PPS (according
to the International Monetary Fund). Countries are
classified according to the quartiles of the distribution of
the country average GDP per capita over the period 2008-
2012 (Table 2). The analysis shows that question Q9d
(boys’ training on science and technology) performs
differentially for the richest ( > P75) and the poorest
countries ( ≤ P25). Question Q9l (share of female ICT
graduates) performs differentially for the richest countries
(Table 3). Scores on question Q9d, higher than expected
in the poorest countries, indicate that in these countries
boys are particularly encouraged to focus on science and
technology. The opposite occurs for the richest countries,
suggesting a gender-bias issue which is more relevant in
the poorest countries than in the richest ones. Scores on
question Q9l are lower than expected in richest countries,
indicating a lower attitude of girls towards ICT degrees in
these countries than expected by the model. This suggests
that even in the richest countries the ICT sector needs to
attract more women, with all the implications that this
may have. A participation discrepancy between genders in
science, technology and ICT topics has been recently
highlighted in the European Member States (DG- EMPL,
2010), where stereotypical assumptions about IT-related
jobs still play a significant role. Does our analysis agree
with this? Awkwardly, we think so.
Table 3: DIF outcomes for different groups of countries.
Component Country
Group
Q Q-
Difficulty
Scores
Institutional
infrastructure
Poorest Q9d < than
expected
> than
expected
Richest Q9d <than
expected
> than
expected
Richest Q9l <than
expected
> than
expected
Paola Annoni & Dorota Weziak-Bialowolska
JRC - European Commission, Unit of Econometrics and
Applied Statistics, Ispra, Italy
References
Annoni P., Weziak-Bialowolska D., Nardo M. (2012)
Assessment of the Web Index: Survey questionnaire
calibration and uncertainty analysis. EUR 25476
Luxembourg: Publications Office of the European Union.
http://composite-indicators.jrc.ec.europa.eu
DG-EMPL (2010) More women in senior positions - key
to economic stability and growth. European Commission,
Directorate-General for Employment, Social Affairs and
Equal Opportunities.
http://www.eubusiness.com/topics/employment/women-
senior.10
Farhan H., D’Agostino D., Worthington H. (2012) Web
Index 2012. World Wide Web Foundation,
www.webfoundation.org/Webindex.
Call for Submissions
Research notes, news, tutorials and other submissions
in line with RMT’s mission are welcome for
publication consideration. All submissions need to be
short and concise (approximately 400 words with a
table, or 500 words without a table or graphic). The
next issue of RMT is targeted for March 1, 2013, so
please make your submission by February 1, 2013 for
full consideration. Please email Editor\at/Rasch.org
with your submissions and/or ideas for future content.