diabetes – ask the experts!
TRANSCRIPT

Diabetes – Ask the Experts!
Debra Margulies, MD – EndocrinologistMargaret Eckler, RD, Certified Diabetes Educator
Summit Medical GroupBerkeley Heights, NJ
November 18, 2014

What is Diabetes Mellitus?• Blood sugar (glucose) is a main nutrient that
all cells in the body use for fuel• Insulin is required for cells to get glucose from
the blood• If there is not enough insulin or the insulin
does not work as well, glucose stays in the blood resulting in high blood glucose levels
NIDDK, National Diabetes Statistics fact sheet. HHS, NIH, 2014.

Diagnosis of Diabetes

Types of Diabetes• Type 1 Diabetes (no insulin produced)
• Previously termed juvenile/childhood-onset, insulin dependent
• 5% to 10%
• Type 2 Diabetes (insulin produced doesn’t work well)• Previously termed adult-onset, non-insulin dependent• 90% to 95%
NIDDK, National Diabetes Statistics fact sheet. HHS, NIH, 2005.
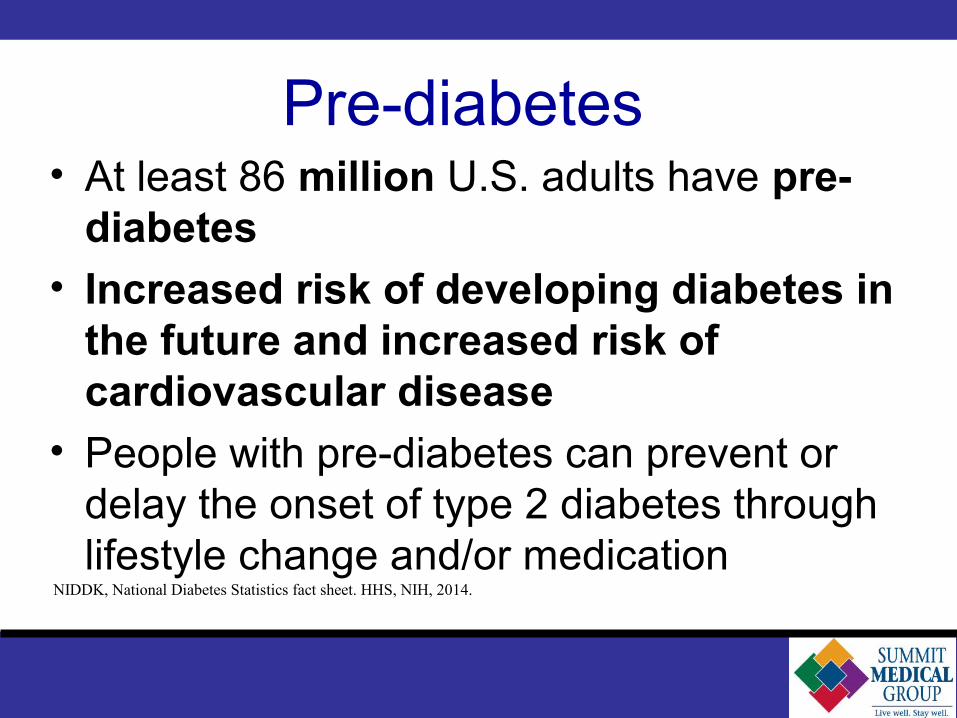
Pre-diabetes• At least 86 million U.S. adults have pre-
diabetes
• Increased risk of developing diabetes in the future and increased risk of cardiovascular disease
• People with pre-diabetes can prevent or delay the onset of type 2 diabetes through lifestyle change and/or medication
NIDDK, National Diabetes Statistics fact sheet. HHS, NIH, 2014.

Risk factors for Diabetes- Prediabetes
- Over age 45
- Family history of diabetes
- Overweight
- Do not exercise regularly
- Low HDL cholesterol or high triglycerides, high blood pressure
- Certain racial and ethnic groups
- Women who had gestational diabetes, or who have had a baby weighing 9 pounds or more at birth
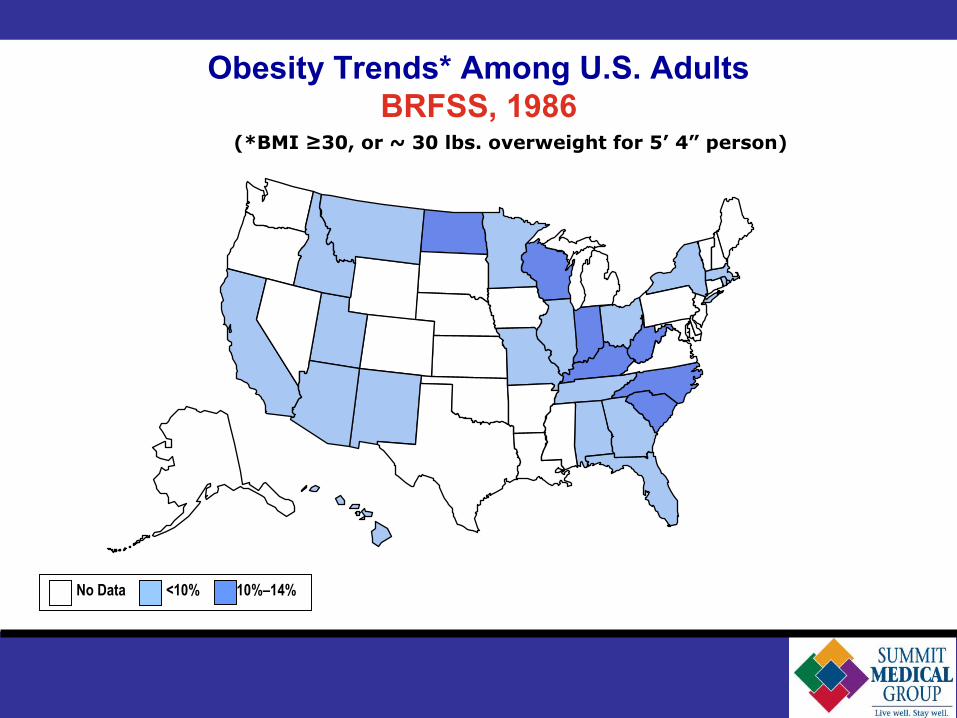
Obesity Trends* Among U.S. AdultsBRFSS, 1986
(*BMI ≥30, or ~ 30 lbs. overweight for 5’ 4” person)
No Data <10% 10%–14%
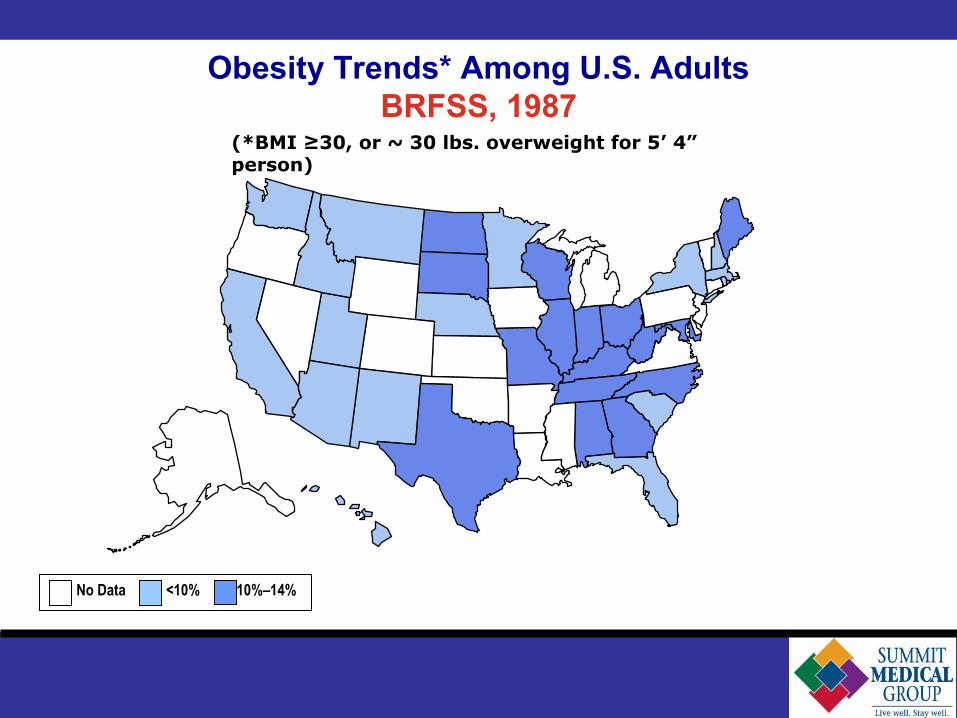
Obesity Trends* Among U.S. AdultsBRFSS, 1987
(*BMI ≥30, or ~ 30 lbs. overweight for 5’ 4” person)
No Data <10% 10%–14%
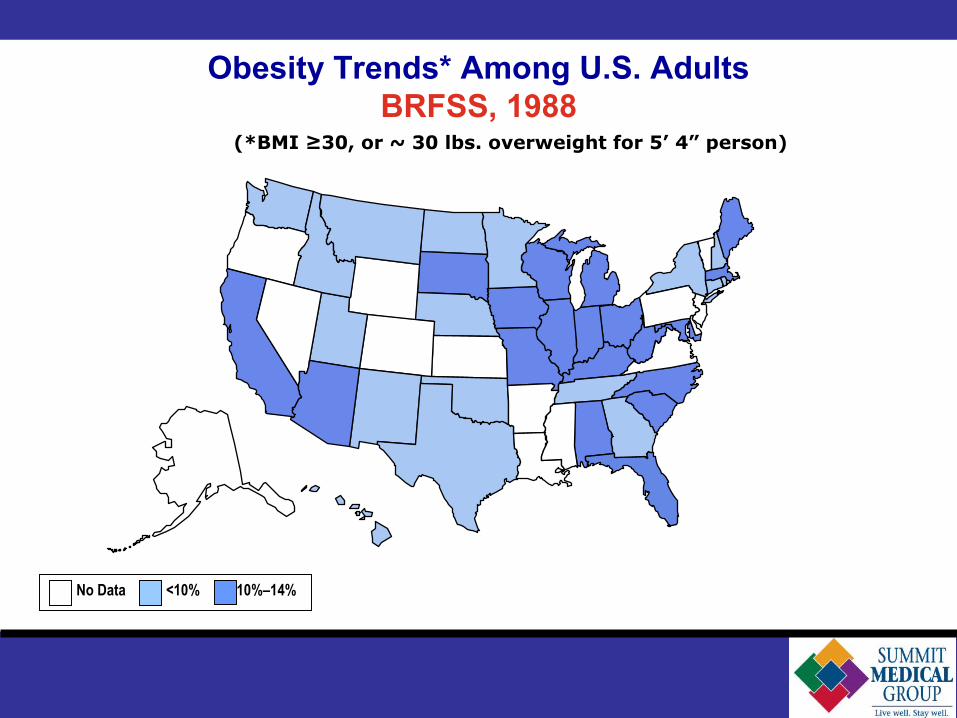
Obesity Trends* Among U.S. AdultsBRFSS, 1988
(*BMI ≥30, or ~ 30 lbs. overweight for 5’ 4” person)
No Data <10% 10%–14%
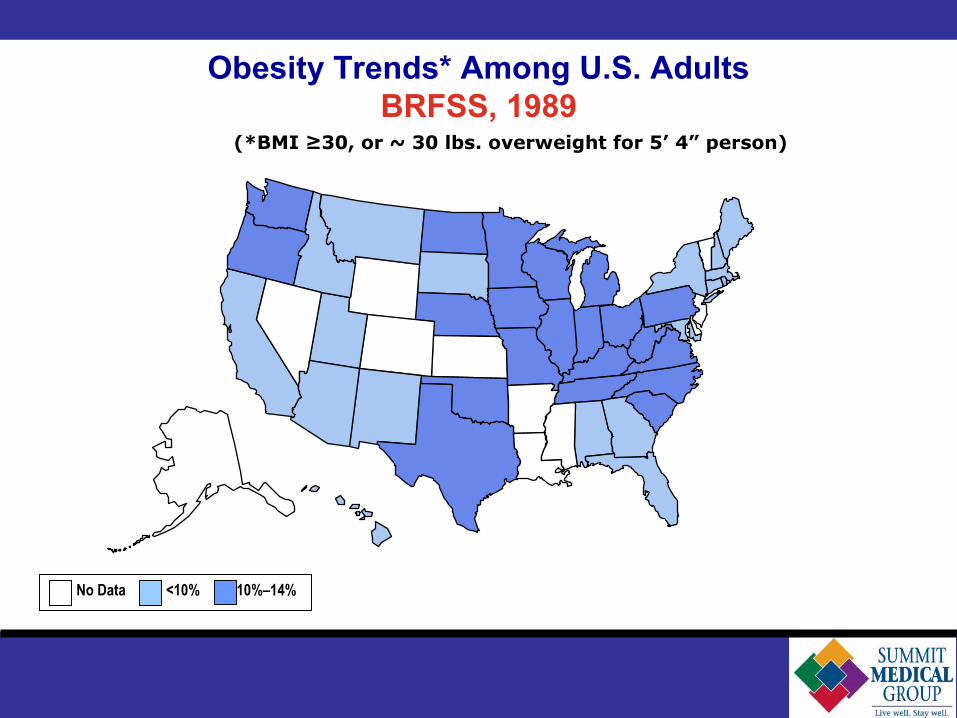
Obesity Trends* Among U.S. AdultsBRFSS, 1989
(*BMI ≥30, or ~ 30 lbs. overweight for 5’ 4” person)
No Data <10% 10%–14%
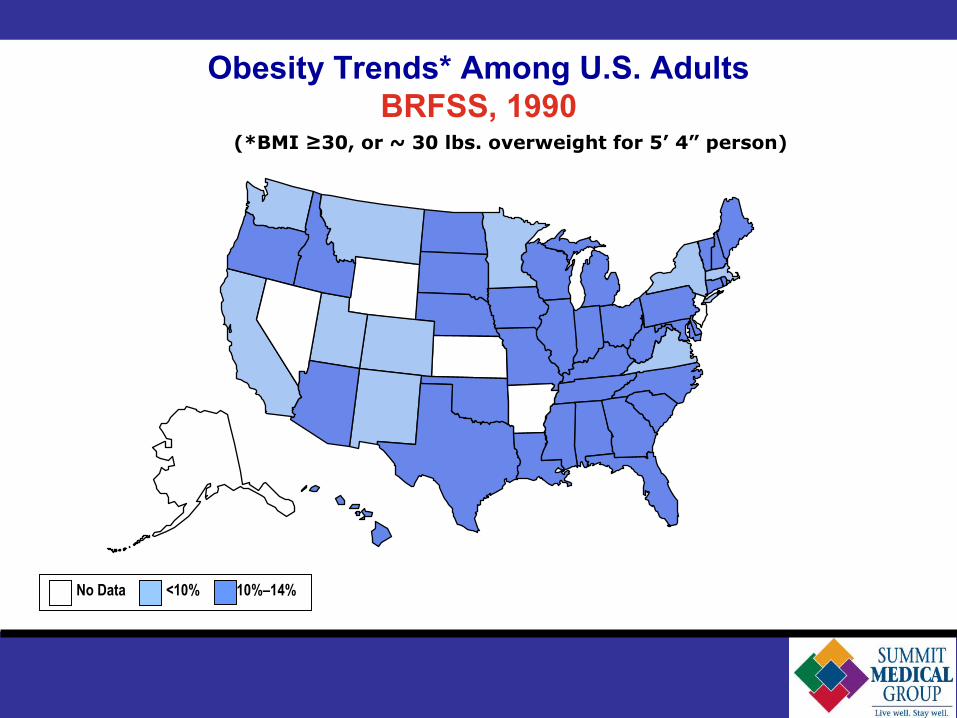
Obesity Trends* Among U.S. AdultsBRFSS, 1990
(*BMI ≥30, or ~ 30 lbs. overweight for 5’ 4” person)
No Data <10% 10%–14%
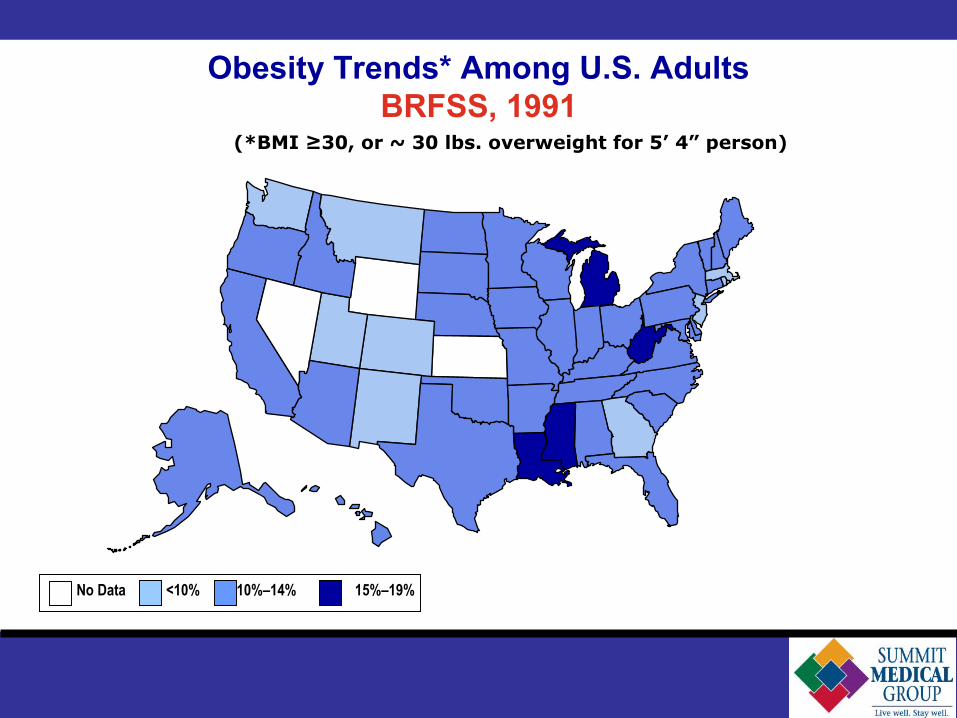
Obesity Trends* Among U.S. AdultsBRFSS, 1991
(*BMI ≥30, or ~ 30 lbs. overweight for 5’ 4” person)
No Data <10% 10%–14% 15%–19%
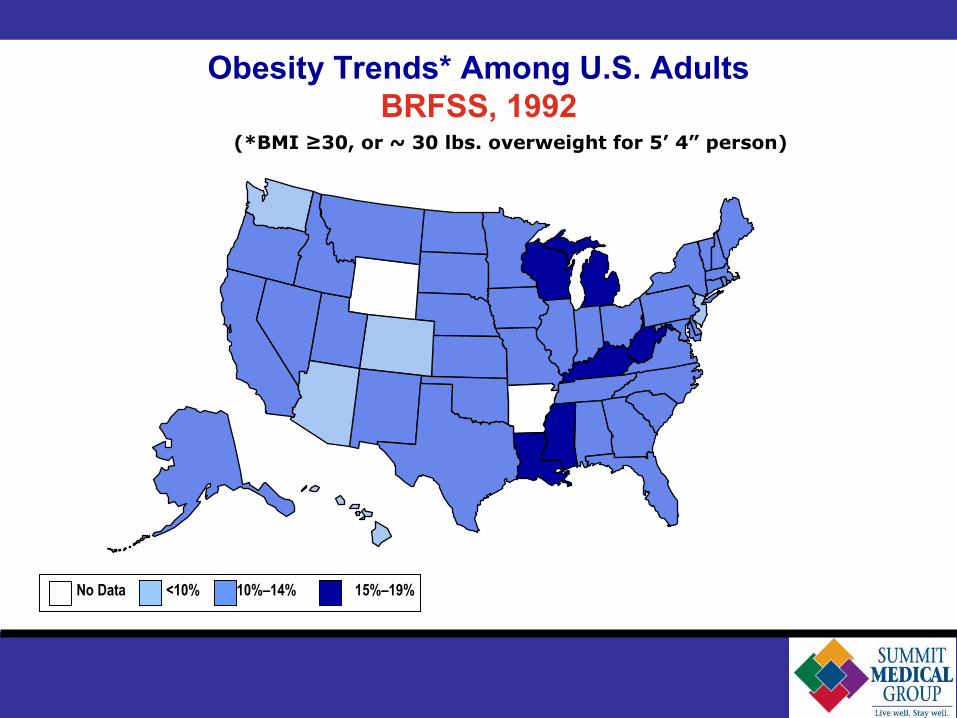
Obesity Trends* Among U.S. AdultsBRFSS, 1992
(*BMI ≥30, or ~ 30 lbs. overweight for 5’ 4” person)
No Data <10% 10%–14% 15%–19%

Obesity Trends* Among U.S. AdultsBRFSS, 1993
(*BMI ≥30, or ~ 30 lbs. overweight for 5’ 4” person)
No Data <10% 10%–14% 15%–19%

Obesity Trends* Among U.S. AdultsBRFSS, 1994
(*BMI ≥30, or ~ 30 lbs. overweight for 5’ 4” person)
No Data <10% 10%–14% 15%–19%
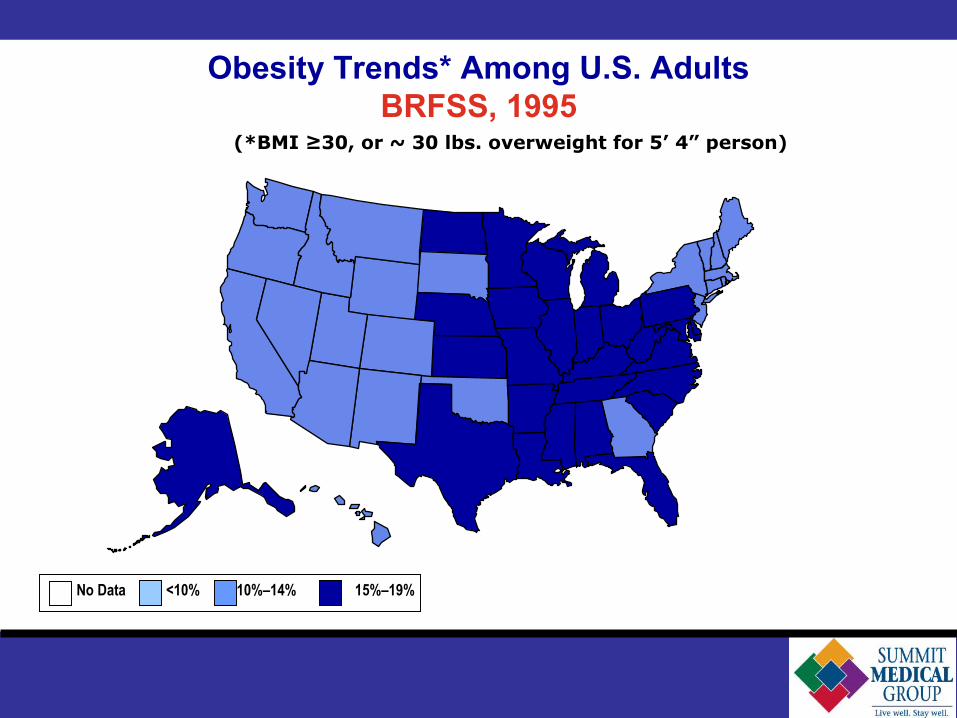
Obesity Trends* Among U.S. AdultsBRFSS, 1995
(*BMI ≥30, or ~ 30 lbs. overweight for 5’ 4” person)
No Data <10% 10%–14% 15%–19%
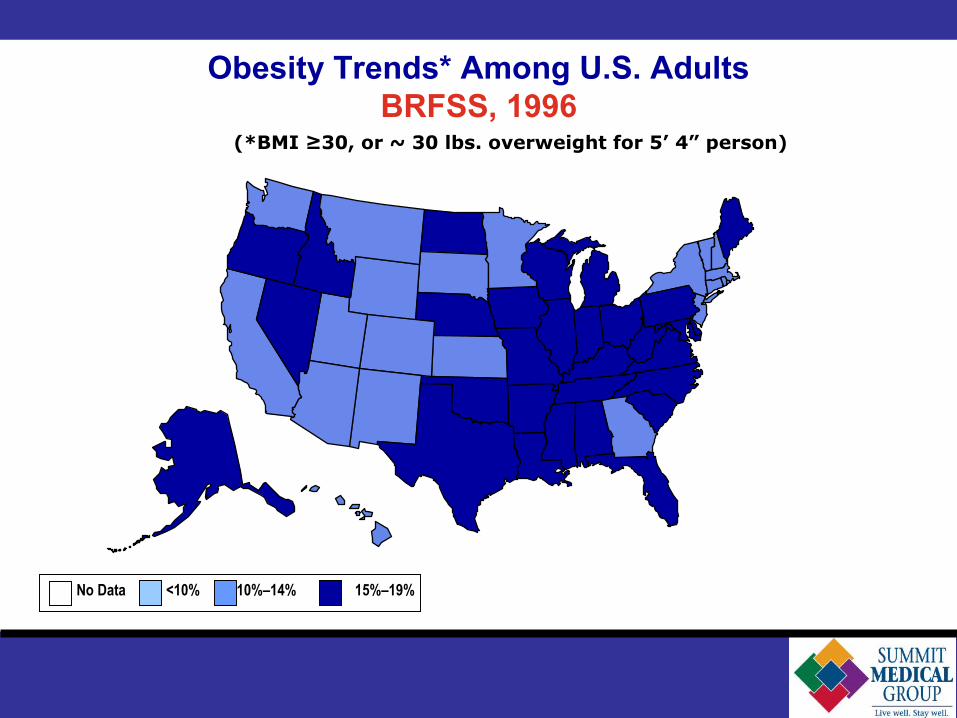
Obesity Trends* Among U.S. AdultsBRFSS, 1996
(*BMI ≥30, or ~ 30 lbs. overweight for 5’ 4” person)
No Data <10% 10%–14% 15%–19%

Obesity Trends* Among U.S. AdultsBRFSS, 1997
(*BMI ≥30, or ~ 30 lbs. overweight for 5’ 4” person)
No Data <10% 10%–14% 15%–19% ≥20%

Obesity Trends* Among U.S. AdultsBRFSS, 1998
(*BMI ≥30, or ~ 30 lbs. overweight for 5’ 4” person)
No Data <10% 10%–14% 15%–19% ≥20%
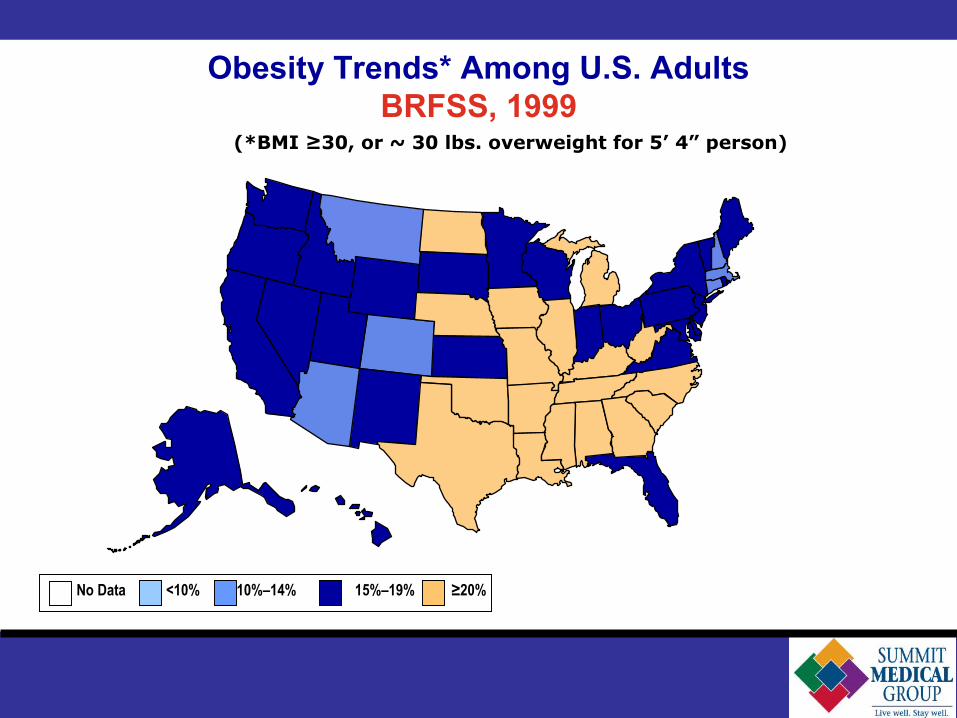
Obesity Trends* Among U.S. AdultsBRFSS, 1999
(*BMI ≥30, or ~ 30 lbs. overweight for 5’ 4” person)
No Data <10% 10%–14% 15%–19% ≥20%

Obesity Trends* Among U.S. AdultsBRFSS, 2000
(*BMI ≥30, or ~ 30 lbs. overweight for 5’ 4” person)
No Data <10% 10%–14% 15%–19% ≥20%

Obesity Trends* Among U.S. AdultsBRFSS, 2001
(*BMI ≥30, or ~ 30 lbs. overweight for 5’ 4” person)
No Data <10% 10%–14% 15%–19% 20%–24% ≥25%
(*BMI ≥30, or ~ 30 lbs. overweight for 5’ 4” person)
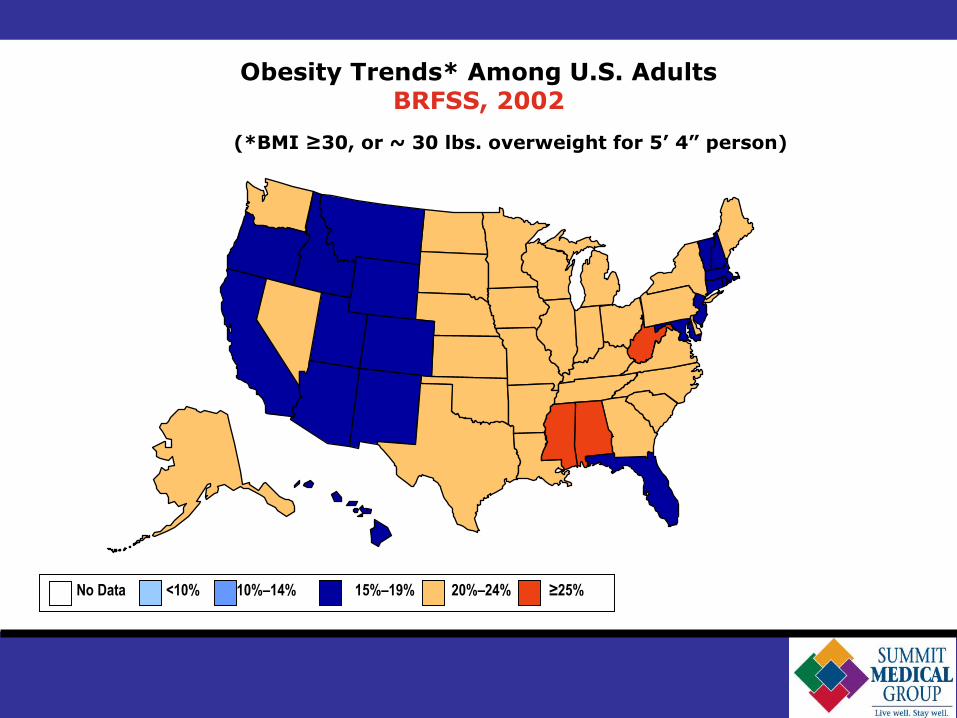
Obesity Trends* Among U.S. AdultsBRFSS, 2002
No Data <10% 10%–14% 15%–19% 20%–24% ≥25%

Obesity Trends* Among U.S. AdultsBRFSS, 2003
(*BMI ≥30, or ~ 30 lbs. overweight for 5’ 4” person)
No Data <10% 10%–14% 15%–19% 20%–24% ≥25%
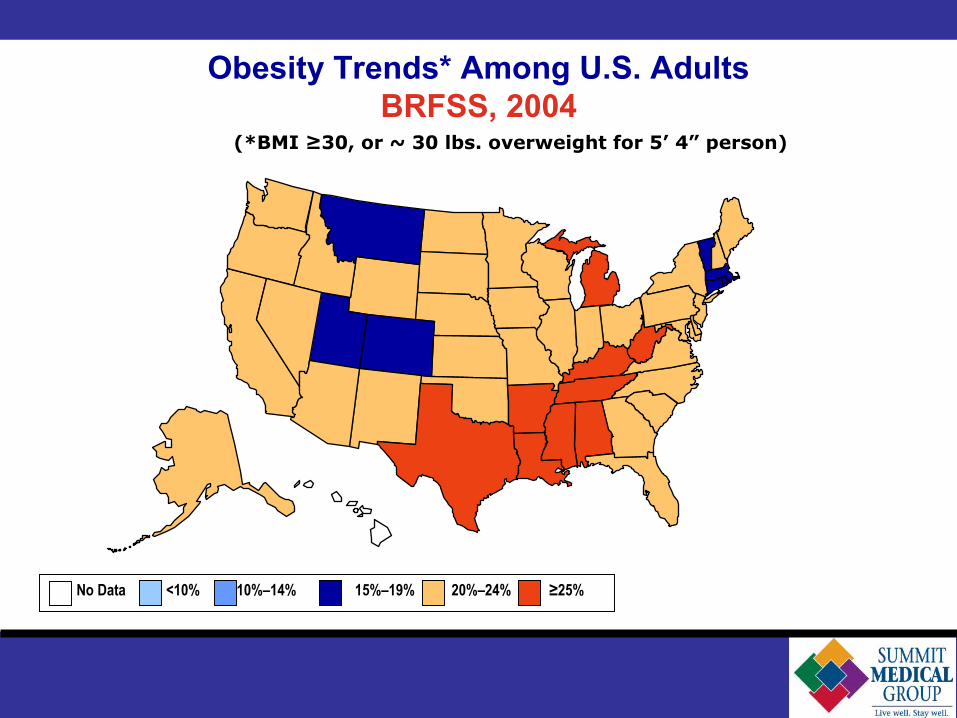
Obesity Trends* Among U.S. AdultsBRFSS, 2004
(*BMI ≥30, or ~ 30 lbs. overweight for 5’ 4” person)
No Data <10% 10%–14% 15%–19% 20%–24% ≥25%
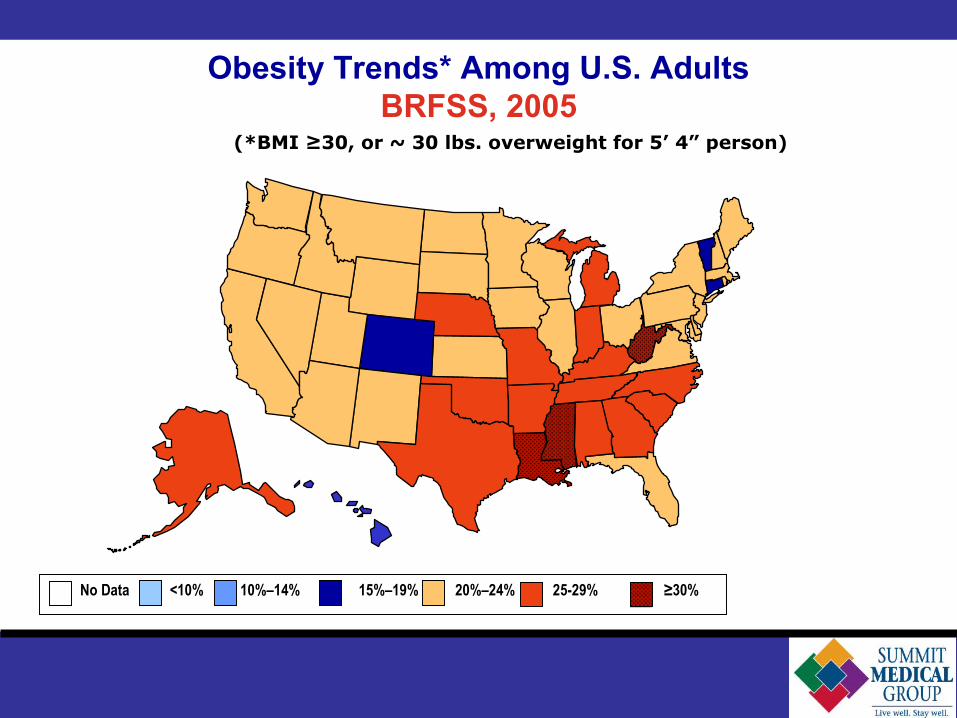
Obesity Trends* Among U.S. AdultsBRFSS, 2005
(*BMI ≥30, or ~ 30 lbs. overweight for 5’ 4” person)
No Data <10% 10%–14% 15%–19% 20%–24% 25-29% ≥30%
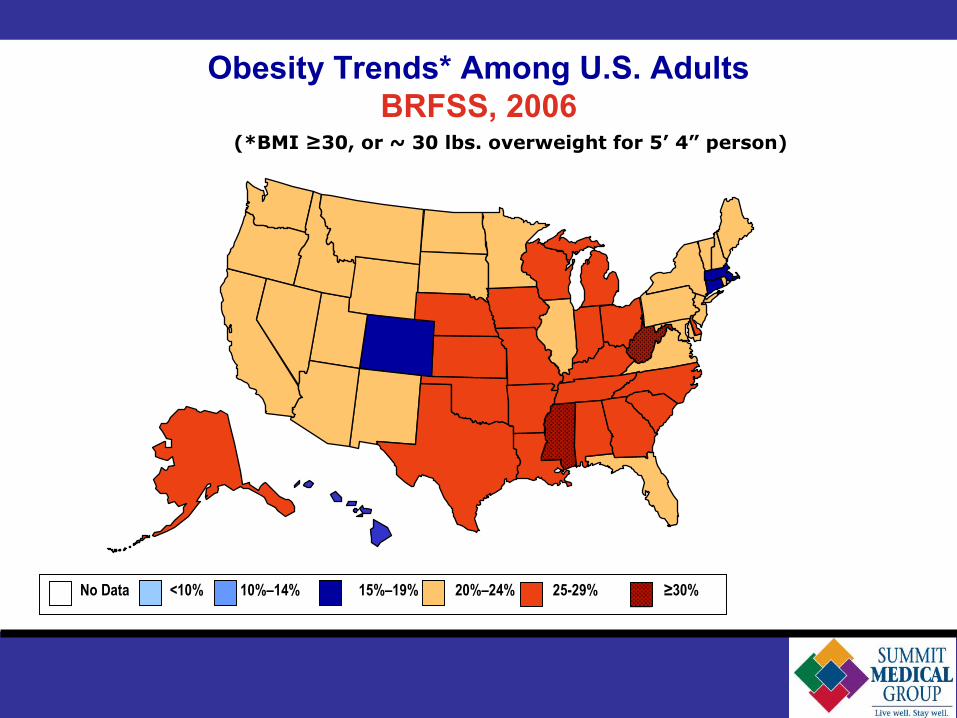
Obesity Trends* Among U.S. AdultsBRFSS, 2006
(*BMI ≥30, or ~ 30 lbs. overweight for 5’ 4” person)
No Data <10% 10%–14% 15%–19% 20%–24% 25-29% ≥30%
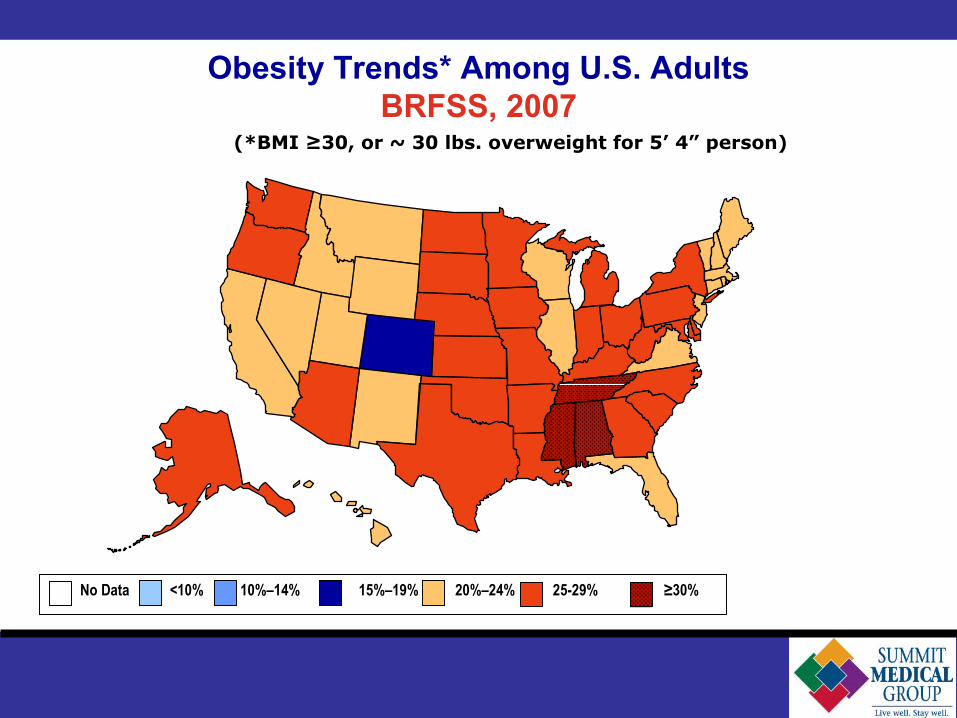
Obesity Trends* Among U.S. AdultsBRFSS, 2007
(*BMI ≥30, or ~ 30 lbs. overweight for 5’ 4” person)
No Data <10% 10%–14% 15%–19% 20%–24% 25-29% ≥30%
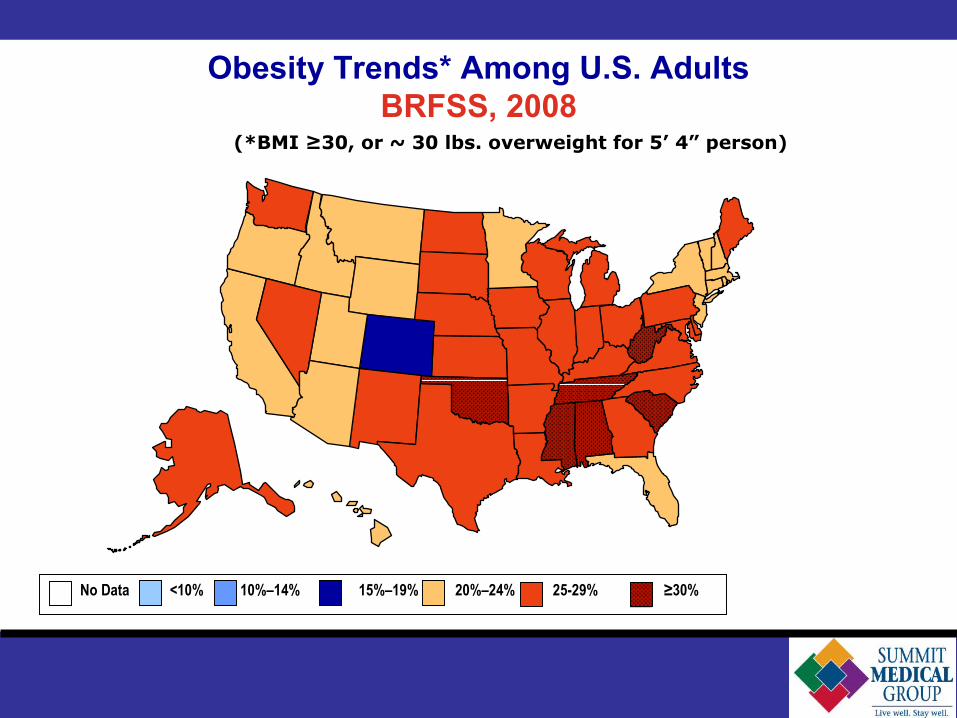
Obesity Trends* Among U.S. AdultsBRFSS, 2008
(*BMI ≥30, or ~ 30 lbs. overweight for 5’ 4” person)
No Data <10% 10%–14% 15%–19% 20%–24% 25-29% ≥30%

Obesity Trends* Among U.S. AdultsBRFSS, 2009
(*BMI ≥30, or ~ 30 lbs. overweight for 5’ 4” person)
No Data <10% 10%–14% 15%–19% 20%–24% 25-29% ≥30%
1999
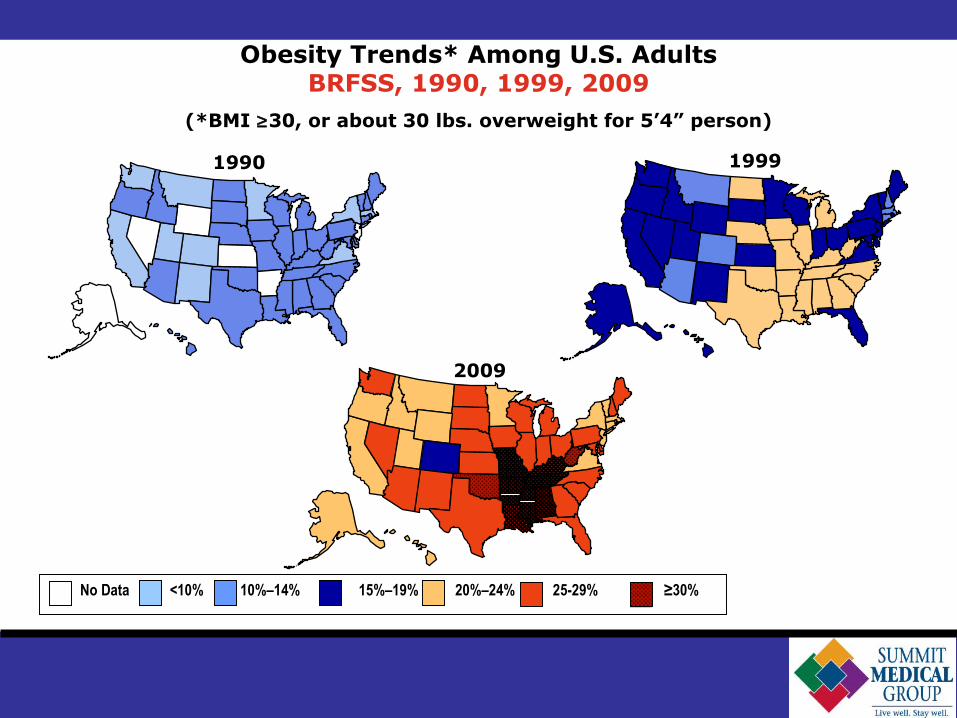
Obesity Trends* Among U.S. AdultsBRFSS, 1990, 1999, 2009
(*BMI ≥30, or about 30 lbs. overweight for 5’4” person)
2009
1990
No Data <10% 10%–14% 15%–19% 20%–24% 25-29% ≥30%
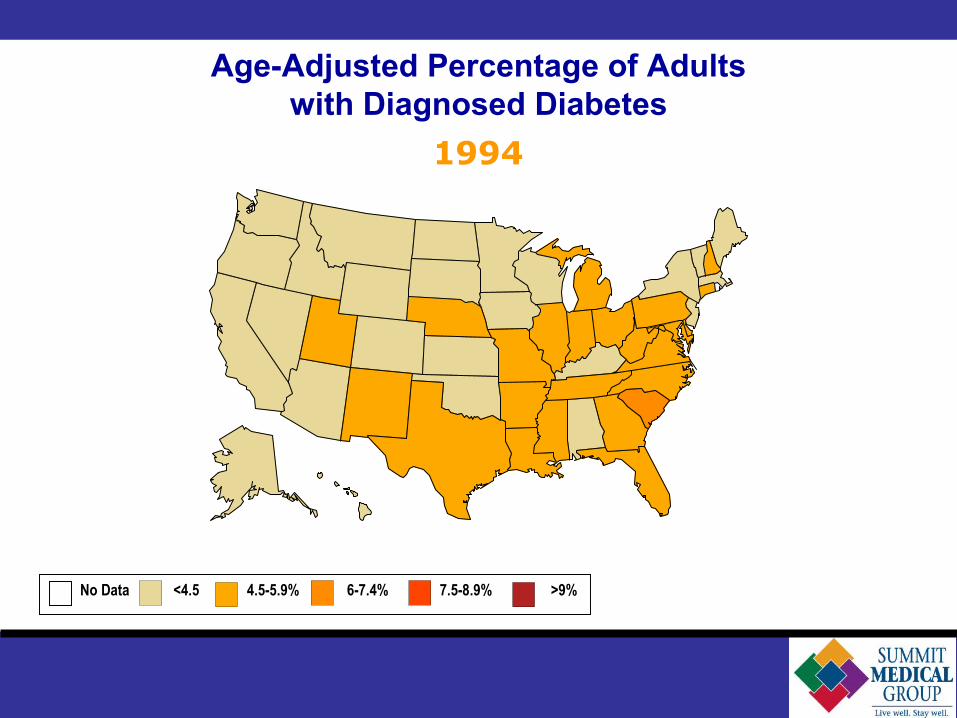
1994
Age-Adjusted Percentage of Adultswith Diagnosed Diabetes
No Data <4.5 4.5-5.9% 6-7.4% 7.5-8.9% >9%

1995
Age-Adjusted Percentage of Adultswith Diagnosed Diabetes
No Data <4.5 4.5-5.9% 6-7.4% 7.5-8.9% >9%

1996
Age-Adjusted Percentage of Adultswith Diagnosed Diabetes
No Data <4.5 4.5-5.9% 6-7.4% 7.5-8.9% >9%

1997
Age-Adjusted Percentage of Adultswith Diagnosed Diabetes
No Data <4.5 4.5-5.9% 6-7.4% 7.5-8.9% >9%

1998
Age-Adjusted Percentage of Adultswith Diagnosed Diabetes
No Data <4.5 4.5-5.9% 6-7.4% 7.5-8.9% >9%
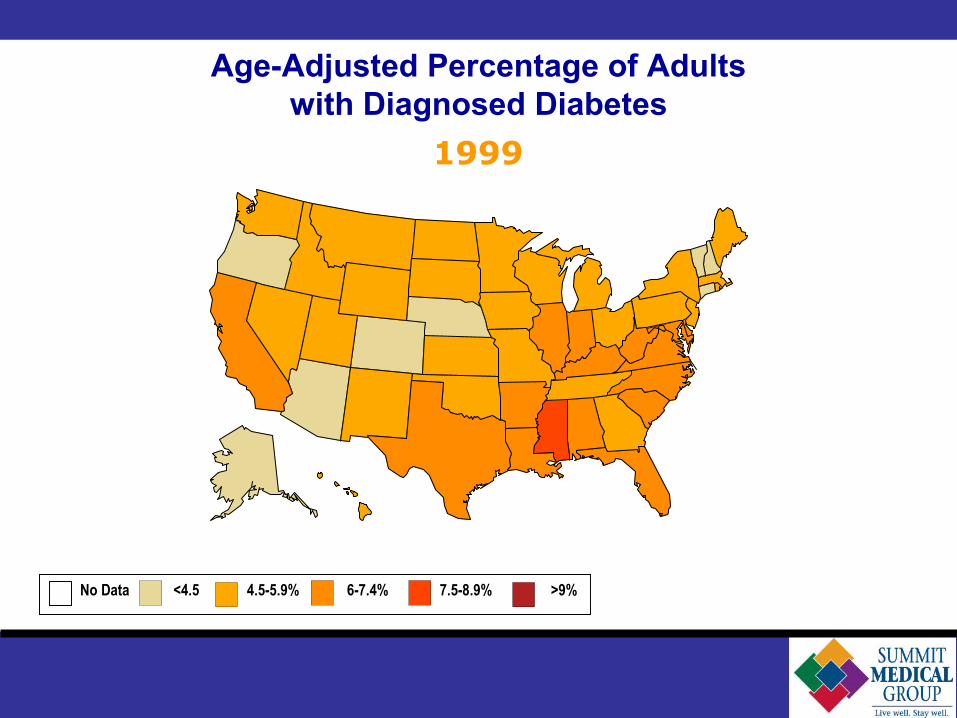
1999
Age-Adjusted Percentage of Adultswith Diagnosed Diabetes
No Data <4.5 4.5-5.9% 6-7.4% 7.5-8.9% >9%
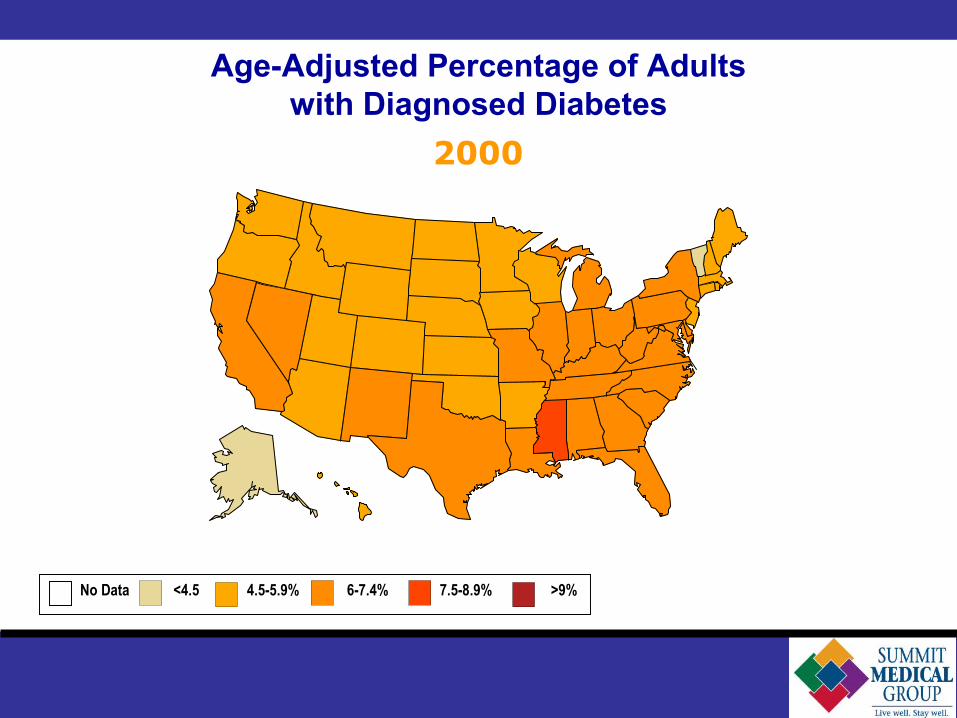
2000
Age-Adjusted Percentage of Adultswith Diagnosed Diabetes
No Data <4.5 4.5-5.9% 6-7.4% 7.5-8.9% >9%

2001
Age-Adjusted Percentage of Adultswith Diagnosed Diabetes
No Data <4.5 4.5-5.9% 6-7.4% 7.5-8.9% >9%
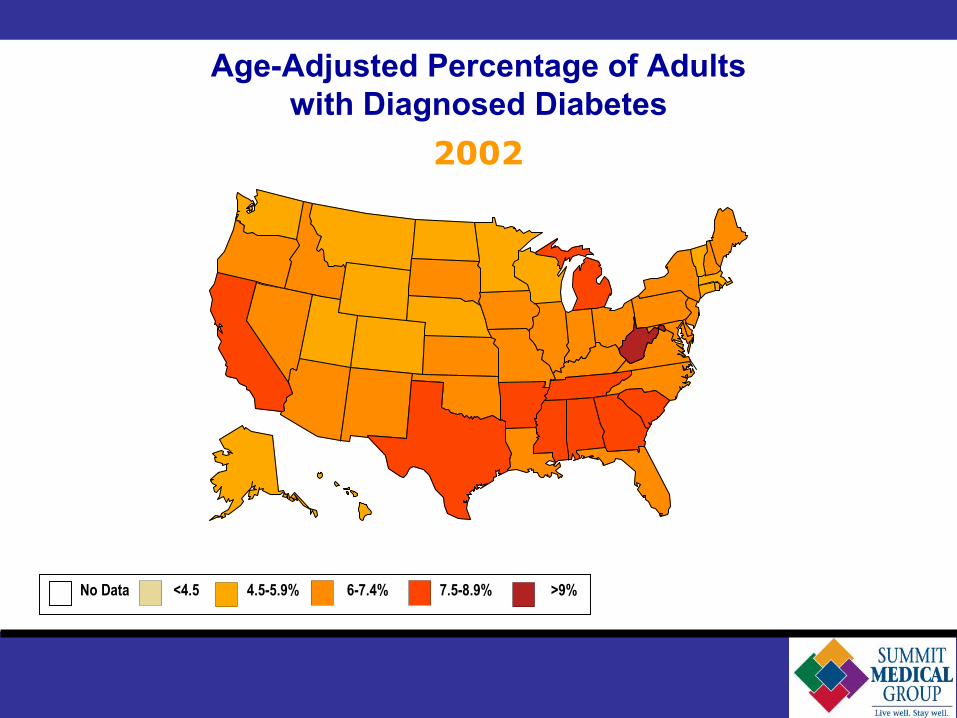
2002
Age-Adjusted Percentage of Adultswith Diagnosed Diabetes
No Data <4.5 4.5-5.9% 6-7.4% 7.5-8.9% >9%

2003
Age-Adjusted Percentage of Adultswith Diagnosed Diabetes
No Data <4.5 4.5-5.9% 6-7.4% 7.5-8.9% >9%
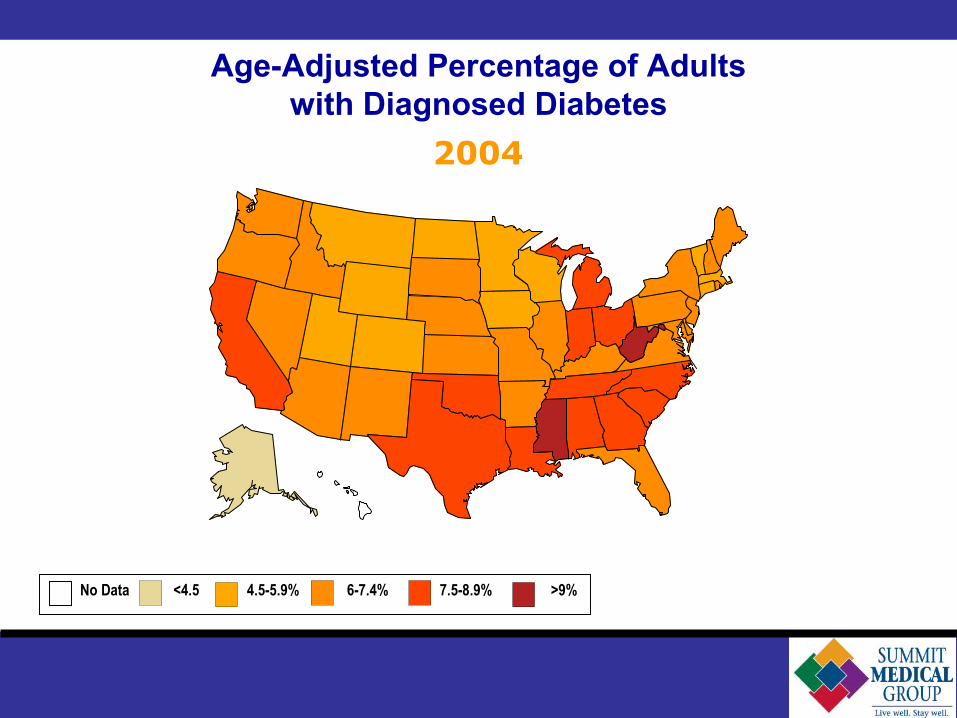
2004
Age-Adjusted Percentage of Adultswith Diagnosed Diabetes
No Data <4.5 4.5-5.9% 6-7.4% 7.5-8.9% >9%

2005
Age-Adjusted Percentage of Adultswith Diagnosed Diabetes
No Data <4.5 4.5-5.9% 6-7.4% 7.5-8.9% >9%

2006
Age-Adjusted Percentage of Adultswith Diagnosed Diabetes
No Data <4.5 4.5-5.9% 6-7.4% 7.5-8.9% >9%
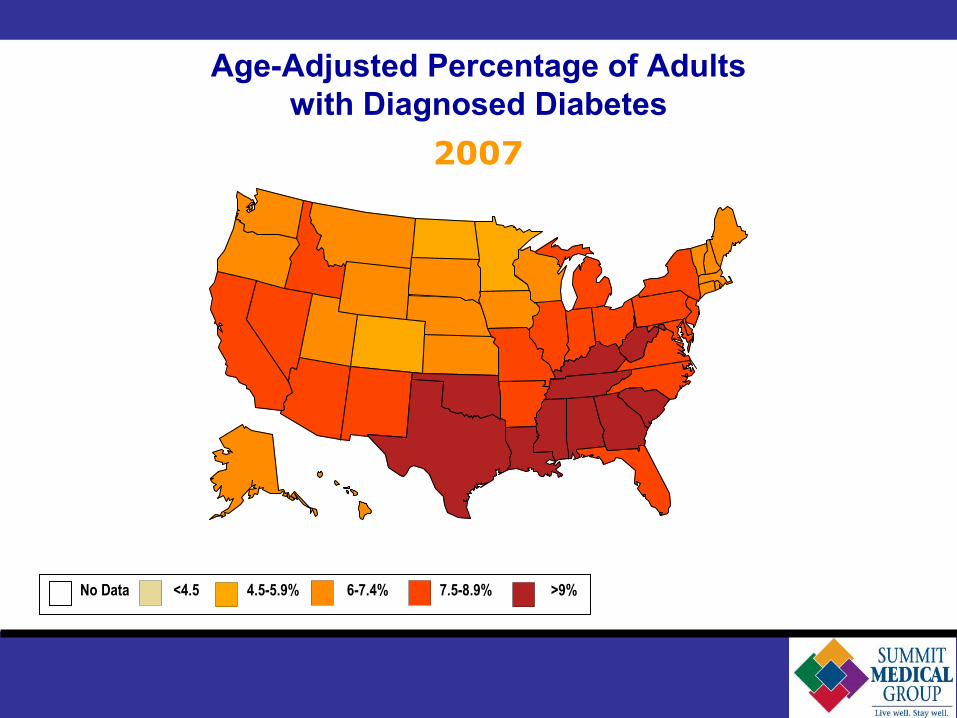
2007
Age-Adjusted Percentage of Adultswith Diagnosed Diabetes
No Data <4.5 4.5-5.9% 6-7.4% 7.5-8.9% >9%
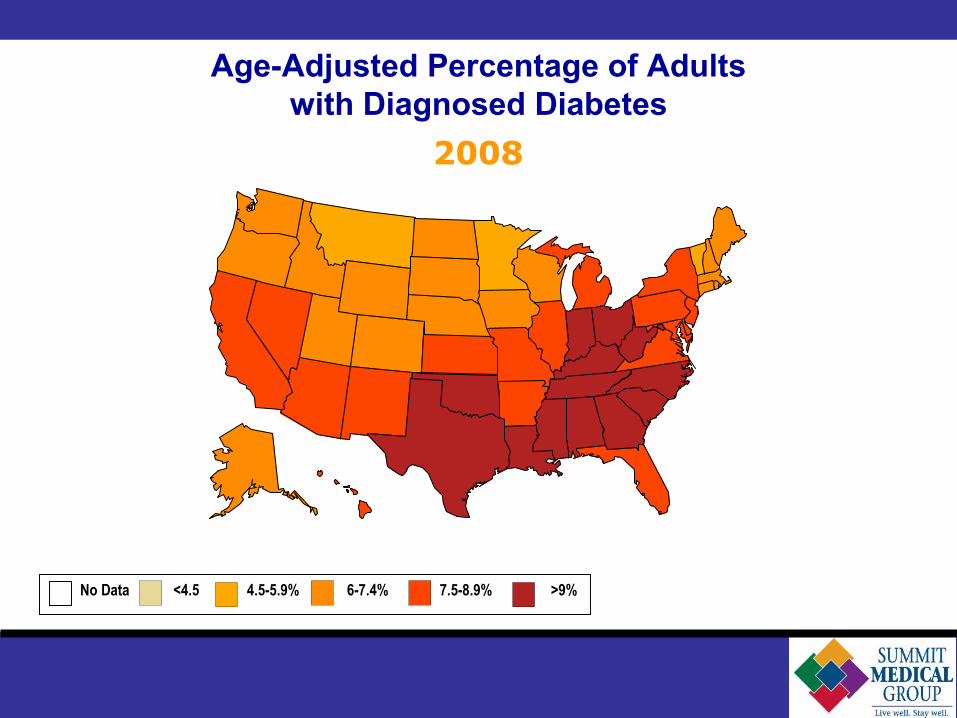
2008
Age-Adjusted Percentage of Adultswith Diagnosed Diabetes
No Data <4.5 4.5-5.9% 6-7.4% 7.5-8.9% >9%
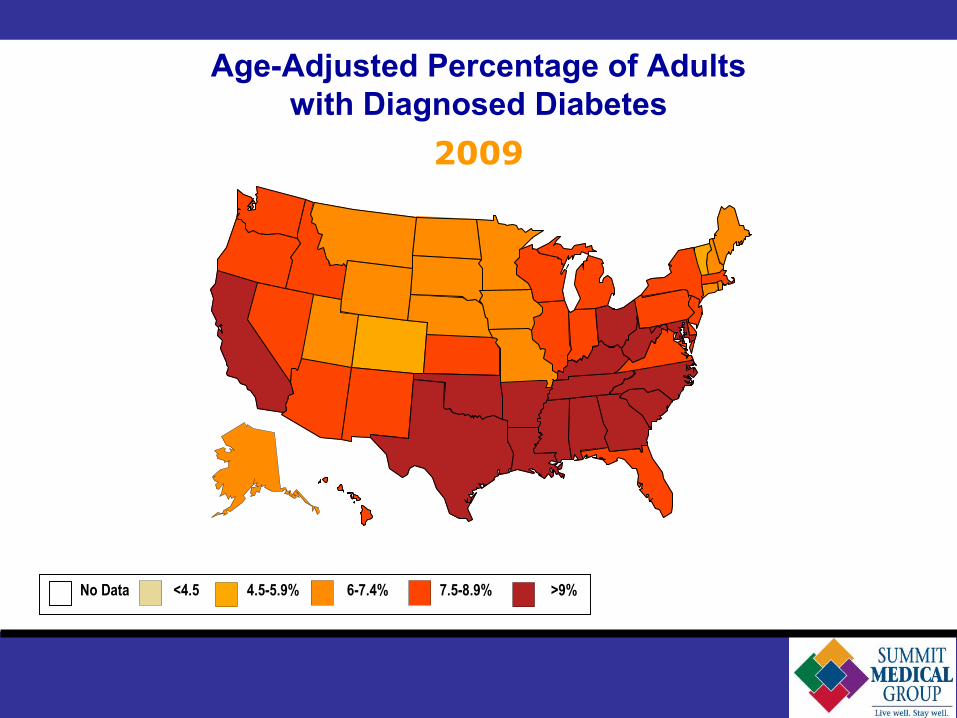
2009
Age-Adjusted Percentage of Adultswith Diagnosed Diabetes
No Data <4.5 4.5-5.9% 6-7.4% 7.5-8.9% >9%
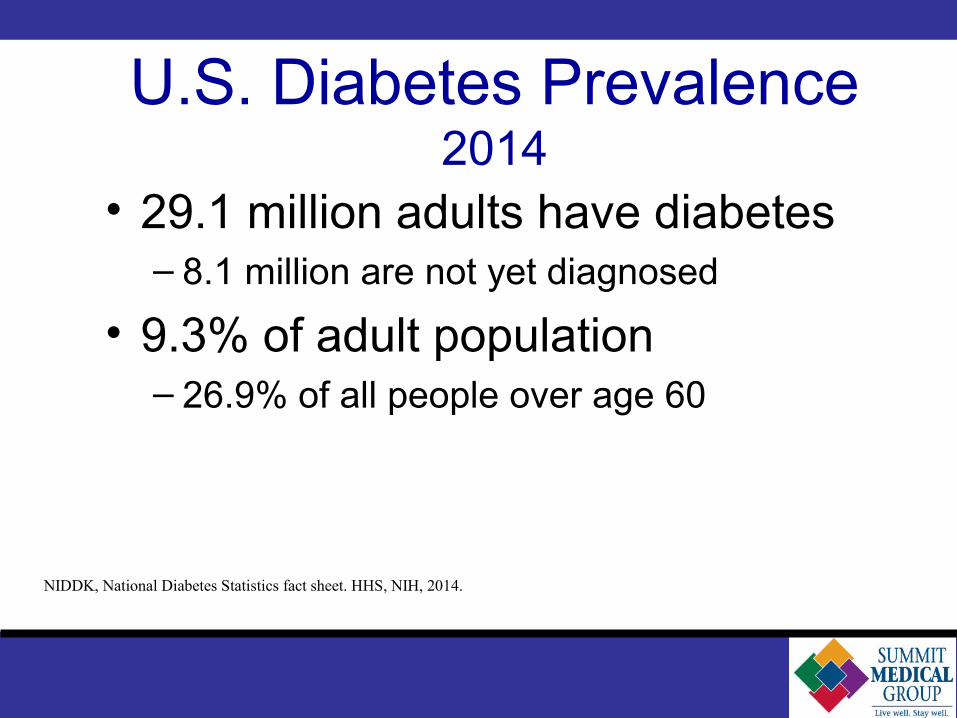
U.S. Diabetes Prevalence2014
• 29.1 million adults have diabetes– 8.1 million are not yet diagnosed
• 9.3% of adult population– 26.9% of all people over age 60
NIDDK, National Diabetes Statistics fact sheet. HHS, NIH, 2014.
Diabetes Complications• Microvascular – Small blood vessels in:
– Eyes (retinopathy)
– Kidneys (nephropathy)
– Nerves (neuropathy)
• Macrovascular – Large blood vessels in:
– Brain (stroke)
– Heart (heart attack)
– Legs (peripheral artery disease)

Diabetes Complications• 2 in 3 people with diabetes die of heart
disease or stroke
• Diabetes is the #1 cause of adult blindness
• Diabetes is the #1 cause of kidney failure
• Diabetes causes more than 60% of non-traumatic leg/foot amputations each year
NIDDK, National Diabetes Statistics fact sheet. HHS, NIH, 2007.
Treatment of DiabetesPrevention!
Prediabetes: 7% weight loss reduces risk of progressing to diabetes by ~60% (70% if >60 years old)
14 pounds if you weigh 200 pounds
Lifestyle change– Decreases need for medications (many patients can
control blood sugar with diet/exercise changes alone)
– Reduces risk for related illnesses, such as heart attack, stroke, arthritis, etc…
– Improves sense of well-being and overall quality of life
Strive to become morephysically active.
• Start off slowly.– Add more until you reach at least 30 minutes of moderate intensity
physical activity five days a week.
• Build physical activity into your day.– Take a brisk walk during lunchtime. – Take the stairs instead of the elevator.– Park farther away from the stores or your office.
• Keep at it.– The longer you keep at it, the better you’ll feel.– Celebrate small successes.


Nutrition Recommendations• Carbohydrates
– Whole grains, fruits, and vegetables should be included in a healthy diet
– Total amount of carbohydrate – more important than source
– Sugars are acceptable, but should be substituted for other types of carbohydrate
– Fiber (a carbohydrate) is encouraged

Nutrition (cont’d)• Protein
– No evidence to support greater or lesser intake than for non-diabetics
• Fat– Less than 7-10% of calories from saturated
fat, and less than 300 mg cholesterol– Minimize intake of trans fats (hydrogenated
vegetable oils)
Nutrition (cont’d)
• Calories– Should be appropriate to achieve weight loss
if needed– Individualized– Exercise, behavior modification, and ongoing
support are usually necessary for permanent weight control.
• Vitamins, minerals, supplements– No clear evidence of any benefit for diabetes unless a
deficiency is present– Basic multivitamin/mineral preparation recommended
• Alcohol – Limit to 1-2 drinks/day consumed with food (caution
if high triglycerides)
• Sodium / Salt– Less than 2400 mg/day for those with hypertension
Nutrition (cont’d)

Diabetes Management Goals“ABCs of Diabetes”
• A1c (Blood Sugar) <7% (<6.5% if appropriate)
– Pre-meals 90-130mg/dl– 2 hours after meals <180
• Blood Pressure <130/80– With ACE-inhibitor or ARB
• Cholesterol– Important impact on reducing cardiovascular risk (ie, heart
attack, stroke)– All patients above age 40 should be considered for ‘statin’
therapy regardless of starting cholesterol
• Aspirin therapy
Diabetes Management – (cont’d)• Diabetes/Nutrition education – as needed• Dilated eye exam – at least yearly• Kidney blood and urine testing – at least yearly• Podiatrist (foot doctor) – as needed• Routine dental care• Influenza (flu) vaccine – annually• Pneumonia vaccine – every 5-10 years (once if
over age 65) • Smoking cessation
The most important team member is YOU!
Summary• There has been a dramatic rise in the number of people
with diabetes over the past few decades– parallels the rise in obesity
• Healthy lifestyle choices may delay or prevent diabetes in those at risk
• If diabetes develops, lifestyle changes can help achieve management goals
• If diabetes is not controlled by diet/exercise, there are many treatment options now available
• A team approach is the most effective way to achieve all the goals of diabetes management