asian development bank institute...hometown investment trust funds in developing green energy...
TRANSCRIPT
ADBI Working Paper Series
ALTERNATIVES TO BANK FINANCE: ROLE OF CARBON TAX AND HOMETOWN INVESTMENT TRUST FUNDS IN DEVELOPING GREEN ENERGY PROJECTS IN ASIA
Naoyuki Yoshino and Farhad Taghizadeh–Hesary
No. 761 July 2017
Asian Development Bank Institute
The Working Paper series is a continuation of the formerly named Discussion Paper series; the numbering of the papers continued without interruption or change. ADBI’s working papers reflect initial ideas on a topic and are posted online for discussion. ADBI encourages readers to post their comments on the main page for each working paper (given in the citation below). Some working papers may develop into other forms of publication.
Suggested citation:
Yoshino, N. and F. Taghizadeh–Hesary. 2017. Alternatives to Bank Finance: Role of Carbon Tax and Hometown Investment Trust Funds in Developing Green Energy Projects in Asia. ADBI Working Paper 761. Tokyo: Asian Development Bank Institute. Available: https://www.adb.org/publications/alternatives-bank-finance-role-carbon-tax-and-hometown-investment-trust-funds Please contact the authors for information about this paper.
Email: [email protected] [email protected]
Naoyuki Yoshino is the dean of the Asian Development Bank Institute. Farhad Taghizadeh-Hesary is an assistant professor of economics at Keio University, and a visiting professor at the Graduate School of Economics, University of Tokyo, Japan. The views expressed in this paper are the views of the author and do not necessarily reflect the views or policies of ADBI, ADB, its Board of Directors, or the governments they represent. ADBI does not guarantee the accuracy of the data included in this paper and accepts no responsibility for any consequences of their use. Terminology used may not necessarily be consistent with ADB official terms. Working papers are subject to formal revision and correction before they are finalized and considered published.
Asian Development Bank Institute Kasumigaseki Building, 8th Floor 3-2-5 Kasumigaseki, Chiyoda-ku Tokyo 100-6008, Japan Tel: +81-3-3593-5500 Fax: +81-3-3593-5571 URL: www.adbi.org E-mail: [email protected] © 2017 Asian Development Bank Institute

ADBI Working Paper 761 Yoshino and Taghizadeh–Hesary
Abstract The main obstacle to developing green energy projects is lack of access to finance. For larger energy projects (e.g., large hydropower projects), insurance and pensions are sustainable financing alternatives. Large energy projects are long-term investment projects; banks are not able to provide long-term loans because their resources (deposits) are short- to medium-term. Pension funds and insurance companies hold long-term savings, so these institutions could be a proper alternative for financing mega-size energy projects. On the other hand, because electricity tariffs are often regulated by the government, to increase the investment incentives the spillover effects originally created by energy supplies need to be used, and tax revenues refunded to the investors in energy projects. For smaller-size green projects, the paper provides a theoretical model for combining utilisation of carbon tax and a new way of financing risky capital, i.e., Hometown Investment Trust Funds (HITs). Because of the Basel capital requirement, and because most green energy projects from the point of view of financers are considered to be risky projects, many financers are reluctant to lend to them or they lend at high interest rates. The paper theoretically shows that by taxing carbon dioxide (CO2), sulphur dioxide (SO2), and nitrogen oxides (NOx) and allocating those tax revenues to HITs, green projects will become more feasible and more interesting for hometown investors; hence the supply of investment money to these funds will increase. Keywords: carbon tax, green energy, renewable energy, hometown investment trust funds, HITs JEL Classification: Q21, E62, G21
ADBI Working Paper 761 Yoshino and Taghizadeh–Hesary
Contents
1. INTRODUCTION ......................................................................................................... 1
2. AN OVERVIEW OF ENERGY DEMAND IN ASIA ....................................................... 2
2.1 Fossil Fuel ....................................................................................................... 3 2.2 Renewable Energy Resources ........................................................................ 4
3. USING SPILLOVER EFFECTS OF GREEN ENERGY PROJECTS (THE CASE OF LARGER ENERGY PROJECTS) ...................................................... 6
4. UTILIZING HOMETOWN INVESTMENT TRUST FUNDS IN DEVELOPMENT OF SMALLER-SCALE GREEN ENERGY PROJECTS (I.E., SOLAR AND WIND) .... 8
4.1 Theoretical Model for Implementation of HITs................................................. 9 4.2 Utilizing HITs and Carbon Tax in Development of Green Energy Projects .. 11 4.3 Stable Supply of Risk Capital to Renewable Energy Sector ......................... 13 4.4 Fostering Sound Hometown Investment Trust Funds ................................... 14
5. CONCLUDING REMARKS........................................................................................ 14
REFERENCES ..................................................................................................................... 16

ADBI Working Paper 761 Yoshino and Taghizadeh–Hesary
1. INTRODUCTION Asia has driven the increasing trend in world energy consumption in the last 2 decades. In 2011, the growth rate for the Asia and the Pacific region was about 5.4%, compared with 3.1% worldwide (Aguilera, Inchauspe, and Ripple 2014). However, fossil fuels, especially coal, are the main sources of fuel for the Asian economies; their greater reliance on fossil fuels has made climate issues and global warming a serious matter. Most climate scientists agree that the main cause of the current global warming trend is human aggravation of the "greenhouse effect" from fossil fuel warming that is a consequence of the atmosphere trapping heat radiating from Earth toward space. Hence, renewable energy projects would be a sustainable solution for mitigating the climate issues from the current serious level. Another reason for development of renewable projects is raising energy self-sufficiency 1 and energy security by diversification of energy resources. Too much reliance on limited resources of energy (coal, oil, or gas) will reduce the resiliency of the economy and make it more prone to energy price fluctuations. Several studies (see, inter alia, Hamilton 1983; Barsky and Killian 2004; Taghizadeh–Hesary et al. 2013, 2016; Taghizadeh-Hesary and Yoshino 2016;) have evaluated the impacts of oil price fluctuations on various macroeconomic indicators and generally found that oil shocks are disruptive to economic growth and create inflation for most oil-importing countries. In a more recent study Taghizadeh–Hesary, Yoshino, and Rasoulinezhad (2017) showed that after the Fukushima nuclear disaster in March 2011, which resulted in the shutting down of nuclear plants and the substitution of nuclear power with fossil fuels, energy security in Japan suffered. The authors applied a cointegration analysis and performed a vector error correction (VEC) variance decomposition by using quarterly data from Q1 1981 to Q4 2010 and from Q1 2011 to Q4 2015. Their findings reveal that the absolute value of elasticities of oil consumption in some economic sectors decreased after the disaster because of an increased dependency on oil consumption, which endangered the country’s energy security. They suggested that to raise energy self-dependency and energy security, Japan needs to diversify its energy supplies. As a result of eliminating nuclear power generation and substituting it with fossil fuels, energy self-sufficiency fell from 19.6% in fiscal year 2000 to 8.6% in fiscal year 2013 (MIAC 2015). Before the 2011 earthquake, Japan was the third largest consumer of nuclear power in the world, after the United States and France. In 2010, nuclear power accounted for about 13% of Japan’s total energy supply (Taghizadeh–Hesary et al. 2016). In 2012, the nuclear energy share fell to 1% of total energy supply (and contributed at a similar level to primary energy consumption in 2013 as only two reactors were operating for a little more than half of the year). In 2014 Japan did not produce any nuclear power (Taghizadeh–Hesary and Yoshino 2015). Hence, increasing the share of renewable energy resources in the energy basket is required. One of the obstacles to development of renewable energy projects is lack of access to cheap finance. Easing finance for investment in green energy projects is a key challenge for climate change mitigation (Dangerman and Schellnhuber 2013; Grubb 2014; Stern 2015).
1 Domestic production of primary energy (including nuclear)/domestic supply of primary energy x 100 (Yoshino, Taghizadeh–Hesary, and Tawk 2017).
1
ADBI Working Paper 761 Yoshino and Taghizadeh–Hesary
In recent years, several new methods for financing green energy projects have been developed, including green bonds, green banks, and village funds. Green banks and green bonds have some potential to help clean energy financing. The advantages of green banks include improved credit conditions for clean energy projects, aggregation of small projects to reach a commercially attractive scale, creation of innovative financial products, and market expansion through dissemination of information about the benefits of clean energy. Supporters of green bonds believe that it can provide long-term and reasonably priced capital to refinance a project once it has passed through the construction phase and is operating successfully (NRDC 2016). Although the aforementioned methods were somehow helpful for development of green projects the data suggest they are inadequate. Fossil fuel investments continue to be much larger than investments in renewable energy. In 2013, renewable energy received investments of only about US$260 billion, which is only 16% of the US$1.6 trillion in total energy sector investments (IEA 2014). Meanwhile, investment in fossil fuels in the power sector, where they compete directly with electricity from renewable energy, rose by 7% from 2013 to 2014 (UNEP and BNEF 2015). Clearly, fossil fuels still dominate energy investment. A major concern in the transition to low-carbon energy provision, therefore, is how to obtain sufficient finance to steer investments toward renewable energy (Mazzucatoa and Semieniukb 2017). Due to the limitations of the Basel capital requirements on lending by financial institutions, and because banks consider most renewable energy projects to be risky, banks are reluctant to finance them. Hence, relying on banking finance is not a solution for financing green energy projects and we need to look for new channels of financing this sector to fill the financing gap for such projects. Bank lending has to be allocated to safer sectors and businesses. This paper provides two types of financing solutions for energy projects based on the project scale: i) larger renewable energy projects (e.g., large hydropower projects), and ii) smaller-scale renewable energy projects. For the first group the paper provides practical solutions and then focuses more on the theoretical and practical aspects of financial solutions for smaller renewable energy projects, e.g., solar energy projects or wind power projects. The paper highlights that the proposed method is the joint utilization of fiscal policy (carbon tax) and the Hometown Investment Trust (HIT) Funds (HITs), which can increase the supply of fund to these projects (see Yoshino and Kaji 2013; Yoshino and Taghizadeh–Hesary 2014a). The paper is structured as follows. In section 2 we first provide an overview of energy demand in Asia for both fossil fuels and renewable energy projects. Section 3 provides a solution for financing larger green energy projects. Section 4 focuses on the theoretical model for financing smaller renewable energy projects (i.e., solar and wind). The last section provides concluding remarks.
2. AN OVERVIEW OF ENERGY DEMAND IN ASIA Worldwide demand for energy has reached unprecedented levels, changing the energy landscape. Nowhere is the growth of energy demand higher than in Asia, and the region is set to surpass the rest of the world in terms of energy consumption before 2035. Much of this demand is met through conventional fossil fuel sources, which increase Asia’s greenhouse gas emissions and contribute to climate change. Alongside this, Asia is home to the largest number of people without access to modern energy, with 600 million without access to electricity and 1.8 billion without access to modern fuels. Generally, Asia draws its energy from conventional fossil fuels (i.e., oil, coal, and
2

ADBI Working Paper 761 Yoshino and Taghizadeh–Hesary
natural gas) and naturally renewable sources (e.g., hydro and geothermal power) (ADB 2015). The Asia and the Pacific region accounts for around 60% of world energy demand.2 In a business-as-usual scenario, the region’s total primary energy demand will increase steadily, from 4,985.2 Mtoe in 2010 to 8,358.3 Mtoe in 2035 (i.e., by 2.1% per year), which is the fastest rate of growth in demand worldwide. Asia has driven the increasing trend in world energy consumption over the last 2 decades. In 2011, the growth rate for the Asia and the Pacific region was about 5.4%, compared with 3.1% worldwide (Aguilera, Inchauspe, and Ripple 2014). Below we highlight energy demand in the Asia and the Pacific region for each energy carrier among fossil fuels and renewable energy categories.
2.1 Fossil Fuel
Coal In 1994, 40.5% of the Asia and the Pacific region’s energy needs were fuelled by coal; by 2009 this had risen to 48.7% (ADB 2013a). Since the beginning of the 21st century, coal has been the fastest-growing energy source worldwide. Asia is the biggest market for coal worldwide, and currently accounts for 67% of global coal consumption. Asia has one-fourth of the world’s coal reserves. In 2013, coal production totalled 7,822.8 million tons worldwide, a 0.4% increase over 2012 with five of the top 10 coal-producing countries located in Asia (Table 1).
Table 1: Top 10 Coal Producers (Mt), 2013e People’s Republic of China 3,561 United States 904 India 613 Indonesia 489 Australia 459 Russian Federation 347 South Africa 256 Germany 191 Poland 143 Kazakhstan 120
e = estimated; Mt = million ton. Source: World Coal Association (https://www.worldcoal.org/resources).
Because coal is a finite source of energy, sustainability is a key issue in its production. Current reserves total 892 billion tons (i.e., 113 years of coal output). Coal consumption causes serious environmental issues such as greenhouse gas (GHG) emissions, which contribute to global warming, acid rain, and localized air pollution, along with social impacts such as increased respiratory ailments and mine safety issues.
2 Asia–Pacific Economic Cooperation. Energy. http://www.apec.org/Groups/SOM-Steering-Committee-on -Economic-and-Technical-Cooperation/Working-Groups/Energy.aspx (accessed 22 December 2014).
3
ADBI Working Paper 761 Yoshino and Taghizadeh–Hesary
Oil Oil accounted for 33.9% of the region’s energy supply in 1994, but this share fell to 26.2% in 2009 (ADB 2013a). Oil for energy comprises crude oil, condensates, natural gas liquids, refinery feedstock and additives, and other hydrocarbons (e.g., emulsified, synthetic crude, and mineral oils). Lacking significant oil resources of its own, Asia depends on imports from other regions, particularly the Middle East. Asia’s share in total global oil production was only 2.5% at the end of 2013, or about 42.1 billion barrels. Like coal, oil is a finite resource. As of December 2013, proven world oil reserves totalled 1,687.9 billion barrels, enough to meet 52.9 years of global production needs (ADB 2015).
Nuclear Energy In 2004, about 4.1% of the region’s energy supply came from nuclear energy. By 2009, this had decreased to 3.2%, although the number of nuclear power plants in Asia has slowly increased over the years. Among 40 nuclear plants connected to energy grids worldwide in 1995–2004, 28 were in the People’s Republic of China (PRC), Japan, Republic of Korea, the Russian Federation, India, and Pakistan (APERC 2004). In October 2013, East and South Asia had 119 operable nuclear power reactors, 49 under construction, 100 firmly planned, and many more proposed. The greatest growth in nuclear power is expected in the PRC, Republic of Korea, and India (ADB 2015).
Natural Gas In 1994, natural gas supplied about 10.3% of Asia’s energy needs, increasing at an average 5.5% per year to 12.0% in 2009. Projections suggest that demand for natural gas will increase at an average 3.9% per year, reaching 1,463.2 million tons of oil equivalent (Mtoe) in 2035, 2.6 times the 2010 level of 566.7 Mtoe. An estimated 51.7% of the entire growth in natural gas demand between 2010 and 2035 in Asia and the Pacific will be from the PRC, followed by India (13.0%), Indonesia (6.0%), and Japan (4.8%). Natural gas forms when layers of buried plants and animals are exposed to intense heat and pressure over thousands of years. It is non-renewable because it cannot be replenished at a rate that matches current and projected consumption levels. In late 2013, proven global reserves totalled 185.7 trillion cubic meters, sufficient to meet 55.1 years of production needs. In Asia and the Pacific, proven natural gas reserves can meet 31.2 years of production needs (ADB 2015).
2.2 Renewable Energy Resources
In recent years, international attention has shifted to renewable energy as a result of increased awareness of the effects of climate change and concerns about energy supply and energy security. Renewable energy (e.g., solar, wind, hydropower, geothermal, and bioenergy) is harnessed from natural resources that are virtually inexhaustible or are replenished.
Hydropower Hydropower is the world’s largest clean energy source, providing 16% of all electricity. In 2011, Asia and the Pacific generated 1,098 terawatt-hours (TWh) (almost 32%) of hydropower, compared with 886 TWh (25%) in Europe. Currently installed or under- construction hydropower in Asia totals 542 gigawatts (GW), which potentially could quadruple to 2,204 GW by 2035 (ADB 2013b). However, large hydropower
4
ADBI Working Paper 761 Yoshino and Taghizadeh–Hesary
plants can have negative environmental and social impacts (e.g., changes in river ecosystems, disruptions to wildlife, and social displacement). In recent years, small-scale hydro installations have been expanding and contributing to increased energy access. Small hydropower plants with a capacity of 10 megawatts (MW) now exist in 148 countries, which could potentially grow to about 173 GW by 2035 (UNIDO and ICSHP 2013).
Geothermal Energy The Asia and the Pacific region is home to some of the world’s top producers of geothermal energy. Drawing on the heat of the earth’s crust, geothermal energy is used to generate electricity and supply direct thermal energy requirements. Six of the 24 countries producing electricity from geothermal energy are in Asia—the PRC, Indonesia, Japan, Papua New Guinea, the Philippines, and Thailand. These countries produced about 30% of the world’s geothermal electricity in 2009 (IEA 2011).
Solar Energy Solar thermal and photovoltaic technologies can convert sunlight into usable heat and electricity. Although solar energy provides a small contribution to the energy supply in Asia and the Pacific, it is now the region’s fastest-growing energy source, albeit from a low base. Solar energy is enjoying rapid uptake worldwide, and by 2050 it is projected to account for as much as a quarter of all electricity generation (ADB 2015)
Wind Energy Wind turbines harness energy from the wind and convert kinetic energy into electricity. Wind resources are widely available worldwide and its deployment for power more than doubled from 2008 to 2014, approaching 300 GW of cumulative installed capacities, accounting for about 2.5% of global electricity demand. Projections suggest that wind energy could provide up to 10% of all electricity by 2020. In Asia, the estimated potential of wind energy could generate millions of megawatts of electricity. However, the wind energy subsector in Asia generally produces very little electricity, except in the PRC and India.3
Bioenergy Biological sources or biomass, such as wood and animal dung, are sources of fuel (through burning or other chemical reactions) and electricity, as well as biofuels (e.g., feedstock). Biofuels are solid (e.g., wood, charcoal, and wood pellets) or liquid (e.g., bioethanol and biodiesel). Biomass is used predominantly in developing countries, mostly in the form of wood and agricultural residues. It is the most common fuel for cooking and heating (Gumartini 2009). In Asia, where most areas are still agricultural, biomass accounted for 8.8% of the total energy supply in 1994, and this decreased to 7.4% in 2009. As oil gained greater prominence in the total energy supply mix, consumption of biomass decreased. Figure 1 shows the total energy supply mix in Asia and the Pacific in 1994 and 2009. It also illustrates the region’s dependency on each energy source and provides insights into the energy challenges of the region.
3 ADB. Wind Energy. http://www.adb.org/sectors/energy/programs/clean-energy-program/wind-energy (accessed 22 December 2014).
5

ADBI Working Paper 761 Yoshino and Taghizadeh–Hesary
Figure 1: Primary Energy Supply by Source in Asia, 1994 and 2009 (%)
ktoe = thousand tons of oil equivalent. Source: ADB (2015).
3. USING SPILLOVER EFFECTS OF GREEN ENERGY PROJECTS (THE CASE OF LARGER ENERGY PROJECTS)
Asian economies are usually characterized as bank-oriented economies. Banks account for the major share of the financial system in almost all Asian countries. Western economies are more capital market-oriented. When looking at the financial assets of households in Asian countries, bank deposits and cash in most of them account for the largest share, with the second largest share accounted for by insurance companies and pension funds. In Japan in 2013, 55% of the total financial assets of households were in the form of cash and deposits at banks, 28% in the form of insurance and pensions, 12% in the form of securities and stock, and 5% in other forms. For American households these ratios were, 15% (cash and deposits), 28% (insurance and pension funds), 53% (securities and stock), and 4% (others), respectively (Yoshino and Taghizadeh–Hesary 2014b). Even in Japan, which has a developed capital market, the share of cash and deposits is much larger than that of securities and stock. In other Asian economies the situation is similar to that in Japan, i.e., banks dominate the financial system, pension funds and insurance companies provide a second level, and the share of the capital market is small. This means that banks, insurance companies, and pension funds will be the main source of finance for projects and businesses.
6
ADBI Working Paper 761 Yoshino and Taghizadeh–Hesary
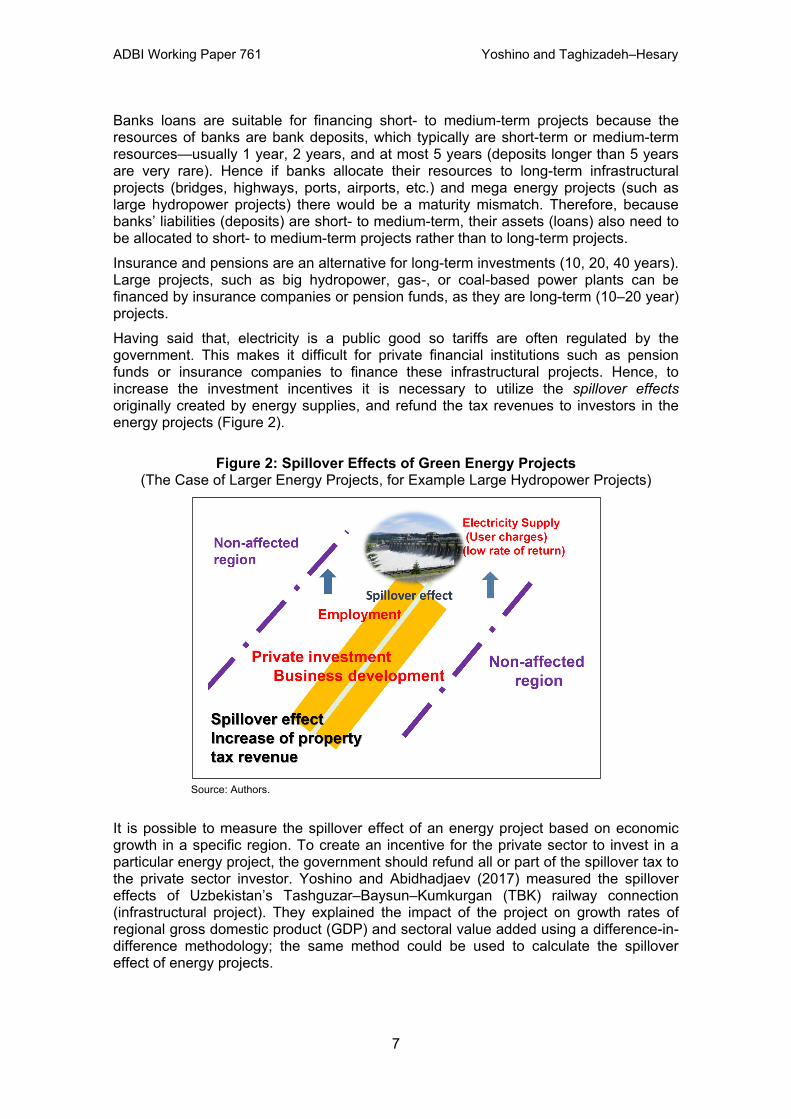
Banks loans are suitable for financing short- to medium-term projects because the resources of banks are bank deposits, which typically are short-term or medium-term resources—usually 1 year, 2 years, and at most 5 years (deposits longer than 5 years are very rare). Hence if banks allocate their resources to long-term infrastructural projects (bridges, highways, ports, airports, etc.) and mega energy projects (such as large hydropower projects) there would be a maturity mismatch. Therefore, because banks’ liabilities (deposits) are short- to medium-term, their assets (loans) also need to be allocated to short- to medium-term projects rather than to long-term projects. Insurance and pensions are an alternative for long-term investments (10, 20, 40 years). Large projects, such as big hydropower, gas-, or coal-based power plants can be financed by insurance companies or pension funds, as they are long-term (10–20 year) projects. Having said that, electricity is a public good so tariffs are often regulated by the government. This makes it difficult for private financial institutions such as pension funds or insurance companies to finance these infrastructural projects. Hence, to increase the investment incentives it is necessary to utilize the spillover effects originally created by energy supplies, and refund the tax revenues to investors in the energy projects (Figure 2).
Figure 2: Spillover Effects of Green Energy Projects (The Case of Larger Energy Projects, for Example Large Hydropower Projects)
Source: Authors.
It is possible to measure the spillover effect of an energy project based on economic growth in a specific region. To create an incentive for the private sector to invest in a particular energy project, the government should refund all or part of the spillover tax to the private sector investor. Yoshino and Abidhadjaev (2017) measured the spillover effects of Uzbekistan’s Tashguzar–Baysun–Kumkurgan (TBK) railway connection (infrastructural project). They explained the impact of the project on growth rates of regional gross domestic product (GDP) and sectoral value added using a difference-in-difference methodology; the same method could be used to calculate the spillover effect of energy projects.
7
ADBI Working Paper 761 Yoshino and Taghizadeh–Hesary
4. UTILIZING HOMETOWN INVESTMENT TRUST FUNDS IN DEVELOPMENT OF SMALLER-SCALE GREEN ENERGY PROJECTS (I.E., SOLAR AND WIND)
In Japan, the Hometown Investment Trust (HIT) Funds is a new source of financing created to support solar and wind power. The basic objective of the HIT funds is to connect local investors with projects in their own locality, where they have personal knowledge and interests. Individual investors choose their preferred projects and make investments via the internet (Yoshino and Kaji 2013). One of the major applications of HITs in Japan relates to wind power and solar power projects, which has raised money from individuals (about US$100 to US$5,000 per investor) interested in promoting green energy. Through these funds, many Japanese people invest small amounts of money in the construction of wind power and solar power. The advertisement of each wind power and solar power project on the internet plays an important role in pushing people to invest in these projects. Internet marketing companies are the companies that provide the platform for investment in these projects and are able to market these projects. Local banks have started to make use of the information provided by HIT funds. If these projects are done properly and are received well by individual investors, banks can then start to grant loans for those projects. In this way, renewable projects (wind and solar), most of which are considered risky, can be supported by HIT funds until they are able to borrow from banks. The use of alternative financing vehicles, such as HIT funds, has therefore assisted the growth of solar and wind projects in Japan, where the finance sector is still dominated by banks (Yoshino and Kaji 2013; Yoshino and Taghizadeh–Hesary 2014a). HIT funds have expanded from Japan to Cambodia, Viet Nam, Peru, and Mongolia. They are also attracting attention from the Government of Thailand and Malaysia’s central bank. Asia’s finance sectors are still dominated by banks and the venture capital market is generally not well developed. However, internet sales are gradually expanding and the use of alternative financing vehicles such as HIT funds will help risky sectors in Asia to growth. The Hokkaido Green Fund, established in 2000 to finance wind power projects in northern Japan, was generated by donations. As it was very difficult to raise money from banks, only 20% of total investment is financed by banks and the other 80% was obtained from individual investors and through donations (Hokkaido Green Fund). The community wind power corporation runs wind power and sells electricity to the power company that supplies power to the region. In many cases, the price of the power produced by wind is 5% higher than that of other forms of electricity, but users are willing to pay 5% extra to save the environment. More than 19 wind power projects were constructed in northern Japan using a similar method. There are also examples of solar power projects in Japan where local governments put money (seed money) in the community fund as an incentive for private investors.
8
ADBI Working Paper 761 Yoshino and Taghizadeh–Hesary
Another example is the revitalization of an old hydropower plant in Nara prefecture in Japan. It was constructed in 1914 but decades later was abandoned and abolished. The local community and individual investors raised money (one unit of investment was US$300) and 274 individuals invested in the revitalization through HIT funds. The total cost amounted to US$500,000 and 184 households received electricity from the revitalized dam and money from the surplus electricity sold to the power supply company in the region. Although HITs are a form of crowdfunding, there are significant differences between HITs and conventional types of crowdfunds—i) there is a “warm feeling” behind the HIT funds, as investors are sympathetic to the company/project owners, who are not solely in it for profit, and their efforts; ii) investors are ready to receive product or services generated by the project (e.g., the electricity generated by a wind power generator) instead of a share of the profits. This is unlike crowdfunding or venture capital, where profit is the only purpose of investment.
4.1 Theoretical Model for Implementation of HITs
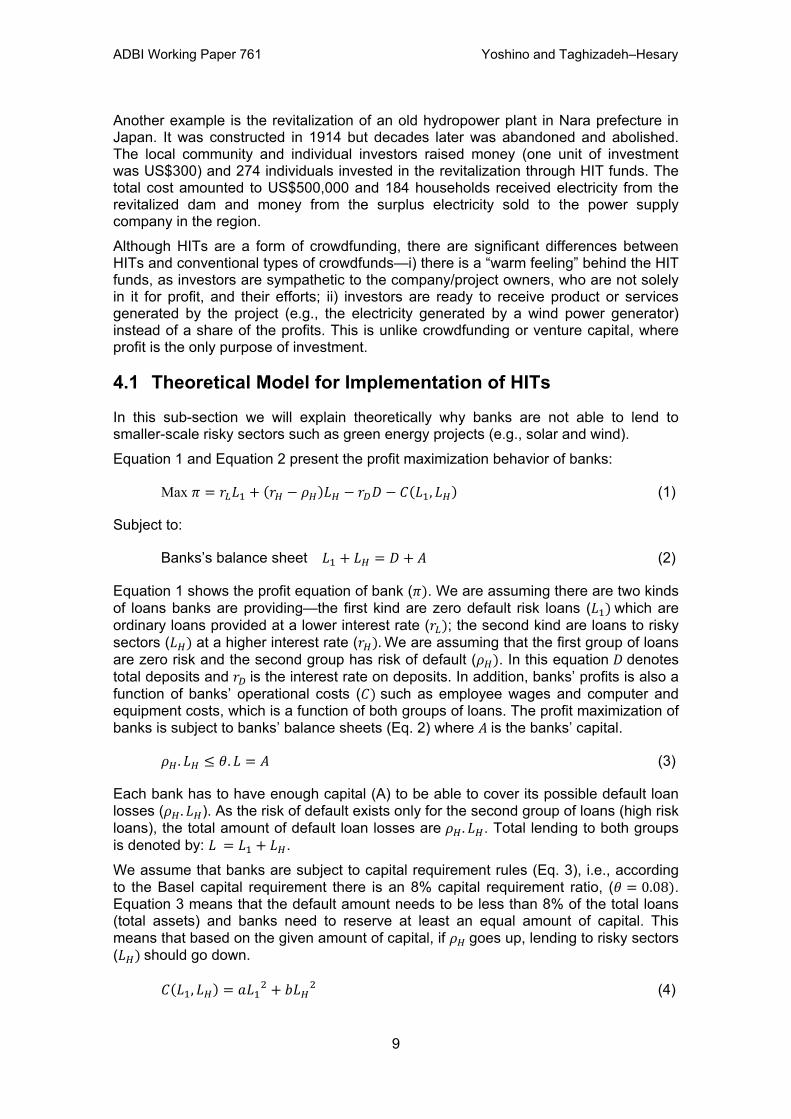
In this sub-section we will explain theoretically why banks are not able to lend to smaller-scale risky sectors such as green energy projects (e.g., solar and wind). Equation 1 and Equation 2 present the profit maximization behavior of banks:
Max 𝜋 = 𝑟𝐿𝐿1 + (𝑟𝐻 − 𝜌𝐻)𝐿𝐻 − 𝑟𝐷𝐷 − 𝐶(𝐿1, 𝐿𝐻) (1)
Subject to:
Banks’s balance sheet 𝐿1 + 𝐿𝐻 = 𝐷 + 𝐴 (2)
Equation 1 shows the profit equation of bank (𝜋). We are assuming there are two kinds of loans banks are providing—the first kind are zero default risk loans (𝐿1) which are ordinary loans provided at a lower interest rate (𝑟𝐿); the second kind are loans to risky sectors (𝐿𝐻) at a higher interest rate (𝑟𝐻). We are assuming that the first group of loans are zero risk and the second group has risk of default (𝜌𝐻). In this equation 𝐷 denotes total deposits and 𝑟𝐷 is the interest rate on deposits. In addition, banks’ profits is also a function of banks’ operational costs (𝐶) such as employee wages and computer and equipment costs, which is a function of both groups of loans. The profit maximization of banks is subject to banks’ balance sheets (Eq. 2) where 𝐴 is the banks’ capital.
𝜌𝐻 . 𝐿𝐻 ≤ 𝜃. 𝐿 = 𝐴 (3)
Each bank has to have enough capital (A) to be able to cover its possible default loan losses (𝜌𝐻 . 𝐿𝐻). As the risk of default exists only for the second group of loans (high risk loans), the total amount of default loan losses are 𝜌𝐻 . 𝐿𝐻. Total lending to both groups is denoted by: 𝐿 = 𝐿1 + 𝐿𝐻. We assume that banks are subject to capital requirement rules (Eq. 3), i.e., according to the Basel capital requirement there is an 8% capital requirement ratio, (𝜃 = 0.08). Equation 3 means that the default amount needs to be less than 8% of the total loans (total assets) and banks need to reserve at least an equal amount of capital. This means that based on the given amount of capital, if 𝜌𝐻 goes up, lending to risky sectors (𝐿𝐻) should go down.
𝐶(𝐿1, 𝐿𝐻) = 𝑎𝐿1 2 + 𝑏𝐿𝐻
2 (4)
9
ADBI Working Paper 761 Yoshino and Taghizadeh–Hesary
Equation 4 shows the cost function, which we assume to be a simple quadratic type; it is a function of both groups of lending (𝐿1, 𝐿𝐻) and applying first order conditions give us two loan supply equations:
𝜕𝜋𝜕𝐿1
= 𝑟𝐿 − 𝑟𝐷 − 2𝑎𝐿1 = 0 (5)
𝐿1𝑆 = 12𝑎
(𝑟𝐿 − 𝑟𝐷) (6)
Equation 6 shows the loan supply equation for the first group of loans, which are risk-free loans.
𝜕𝜋𝜕𝐿𝐻
= 𝑟𝐻 − 𝜌�́� − 𝑟𝐷 − 2𝑏𝐿𝐻 = 0 (7)
𝐿𝐻𝑆 = 12𝑏
(𝑟 − 𝜌�́� − 𝑟𝐷) (8)
Equation 8 shows the loan supply equation for the second group of loans, i.e. the risky loans. For this group, as the default risk is high, if 𝜌�́� increases the loan supply falls.
𝐿𝐻 ≤ 𝜃𝜌𝐿
= 𝐴𝜌 (9)
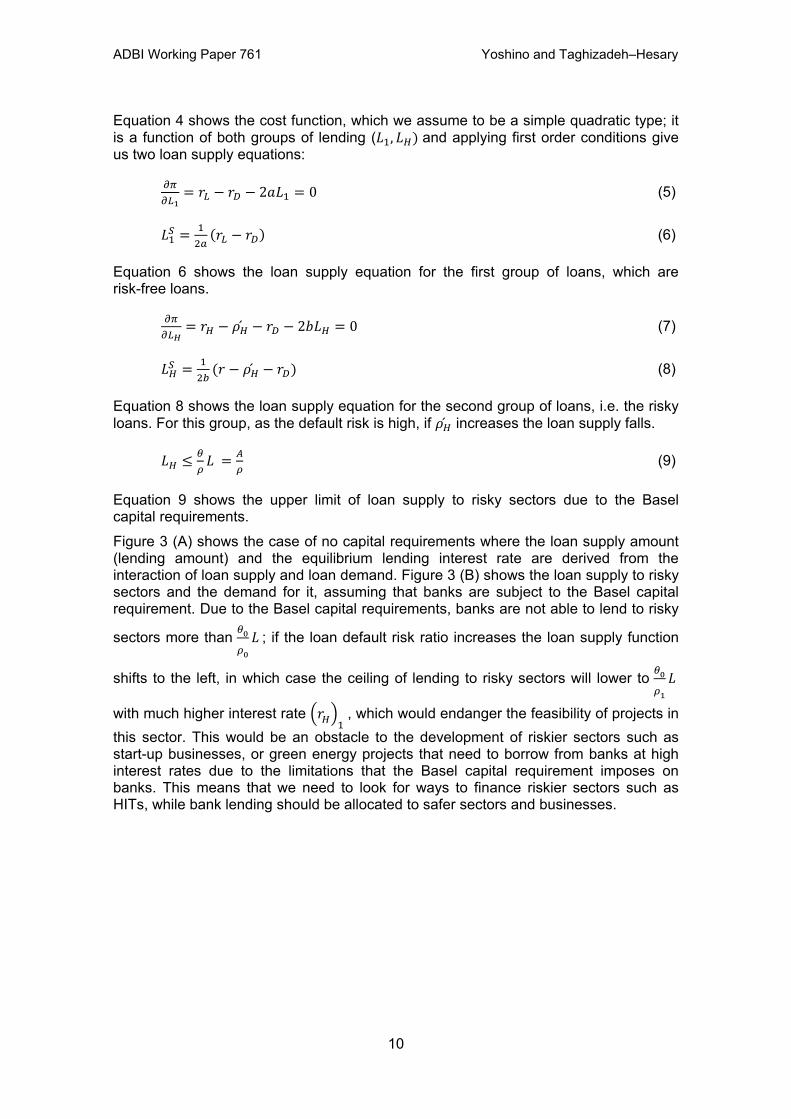
Equation 9 shows the upper limit of loan supply to risky sectors due to the Basel capital requirements. Figure 3 (A) shows the case of no capital requirements where the loan supply amount (lending amount) and the equilibrium lending interest rate are derived from the interaction of loan supply and loan demand. Figure 3 (B) shows the loan supply to risky sectors and the demand for it, assuming that banks are subject to the Basel capital requirement. Due to the Basel capital requirements, banks are not able to lend to risky
sectors more than 𝜃0
𝜌0 𝐿
; if the loan default risk ratio increases the loan supply function
shifts to the left, in which case the ceiling of lending to risky sectors will lower to 𝜃0
𝜌1 𝐿
with much higher interest rate �𝑟𝐻 �1
, which would endanger the feasibility of projects in this sector. This would be an obstacle to the development of riskier sectors such as start-up businesses, or green energy projects that need to borrow from banks at high interest rates due to the limitations that the Basel capital requirement imposes on banks. This means that we need to look for ways to finance riskier sectors such as HITs, while bank lending should be allocated to safer sectors and businesses.
10
ADBI Working Paper 761 Yoshino and Taghizadeh–Hesary
Figure 3: Lending to Riskier Sectors and Lower Upper Lending Limit for Banks
Source: Authors.
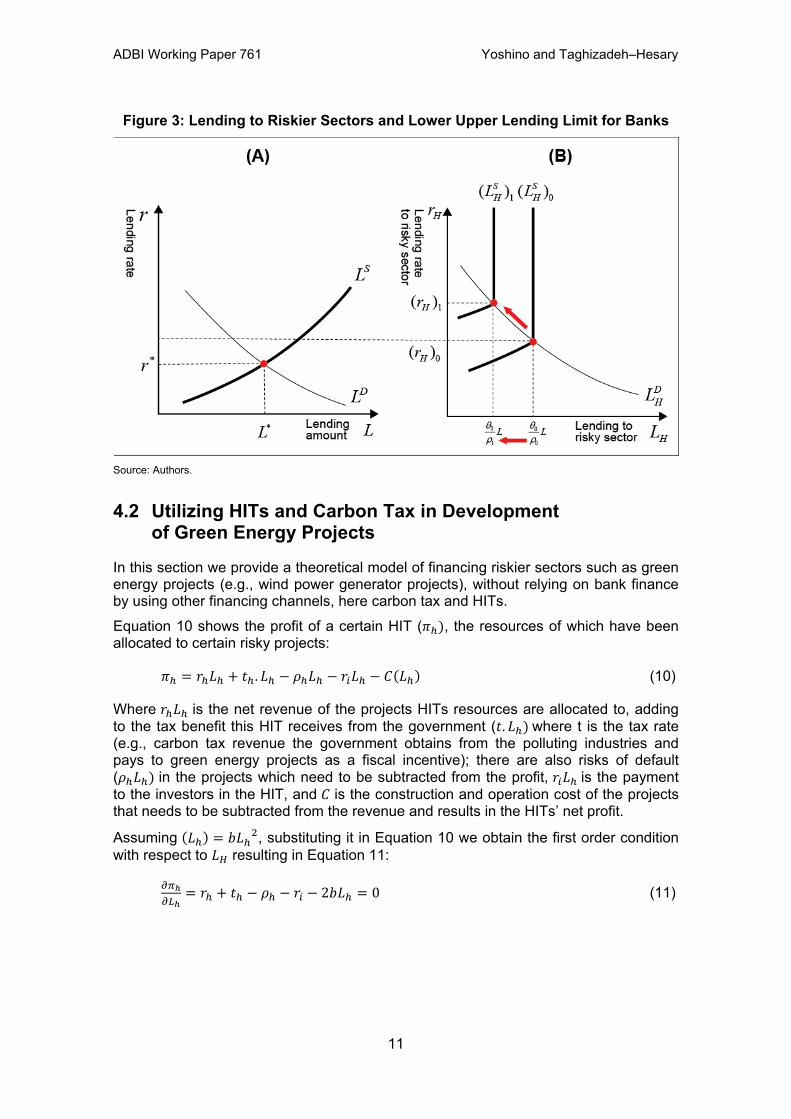
4.2 Utilizing HITs and Carbon Tax in Development of Green Energy Projects
In this section we provide a theoretical model of financing riskier sectors such as green energy projects (e.g., wind power generator projects), without relying on bank finance by using other financing channels, here carbon tax and HITs.
Equation 10 shows the profit of a certain HIT (𝜋ℎ), the resources of which have been allocated to certain risky projects:
𝜋ℎ = 𝑟ℎ𝐿ℎ + 𝑡ℎ . 𝐿ℎ − 𝜌ℎ𝐿ℎ − 𝑟𝑖𝐿ℎ − 𝐶(𝐿ℎ) (10)
Where 𝑟ℎ𝐿ℎ is the net revenue of the projects HITs resources are allocated to, adding to the tax benefit this HIT receives from the government (𝑡. 𝐿ℎ) where t is the tax rate (e.g., carbon tax revenue the government obtains from the polluting industries and pays to green energy projects as a fiscal incentive); there are also risks of default (𝜌ℎ𝐿ℎ) in the projects which need to be subtracted from the profit, 𝑟𝑖𝐿ℎ is the payment to the investors in the HIT, and 𝐶 is the construction and operation cost of the projects that needs to be subtracted from the revenue and results in the HITs’ net profit.
Assuming (𝐿ℎ) = 𝑏𝐿ℎ 2, substituting it in Equation 10 we obtain the first order condition
with respect to 𝐿𝐻 resulting in Equation 11:
𝜕𝜋ℎ𝜕𝐿ℎ
= 𝑟ℎ + 𝑡ℎ − 𝜌ℎ − 𝑟𝑖 − 2𝑏𝐿ℎ = 0 (11)
11
ADBI Working Paper 761 Yoshino and Taghizadeh–Hesary
Writing Equation 11 for 𝐿𝐻 results in Equation 12:
𝐿ℎ = 12𝑏
(𝑟ℎ + 𝑡ℎ − 𝜌ℎ − 𝑟𝑖) (12)
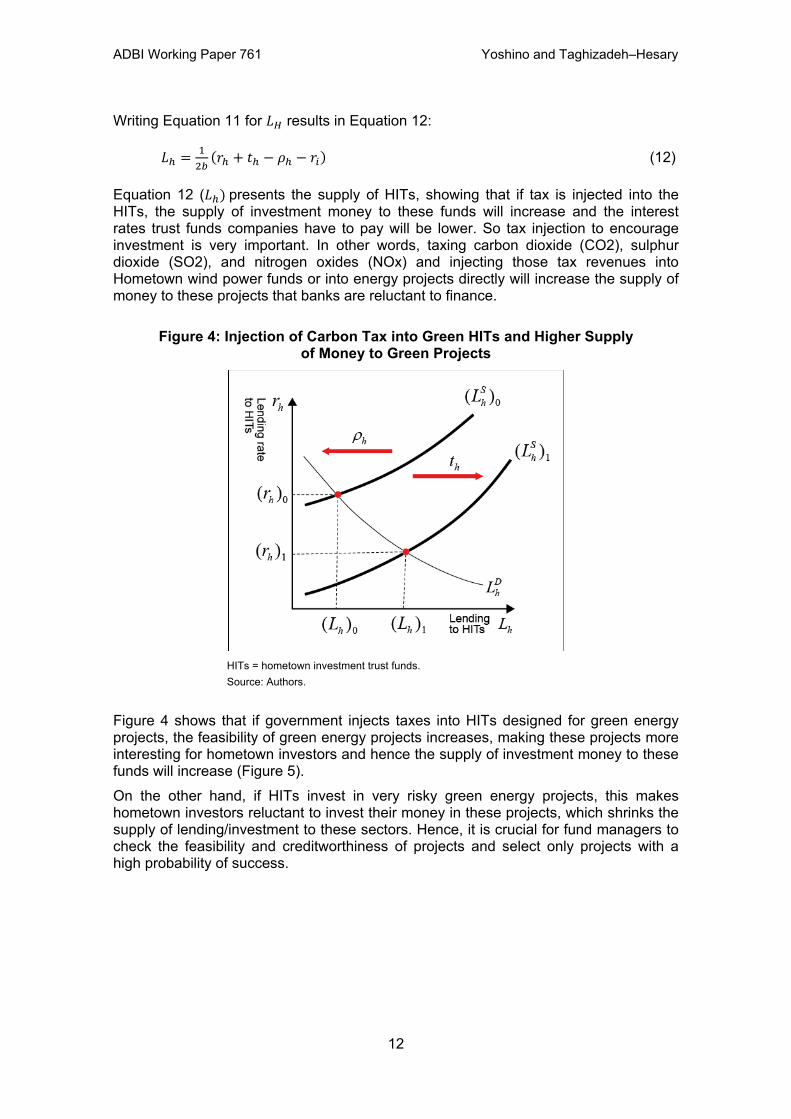
Equation 12 (𝐿ℎ) presents the supply of HITs, showing that if tax is injected into the HITs, the supply of investment money to these funds will increase and the interest rates trust funds companies have to pay will be lower. So tax injection to encourage investment is very important. In other words, taxing carbon dioxide (CO2), sulphur dioxide (SO2), and nitrogen oxides (NOx) and injecting those tax revenues into Hometown wind power funds or into energy projects directly will increase the supply of money to these projects that banks are reluctant to finance.
Figure 4: Injection of Carbon Tax into Green HITs and Higher Supply of Money to Green Projects
HITs = hometown investment trust funds. Source: Authors.
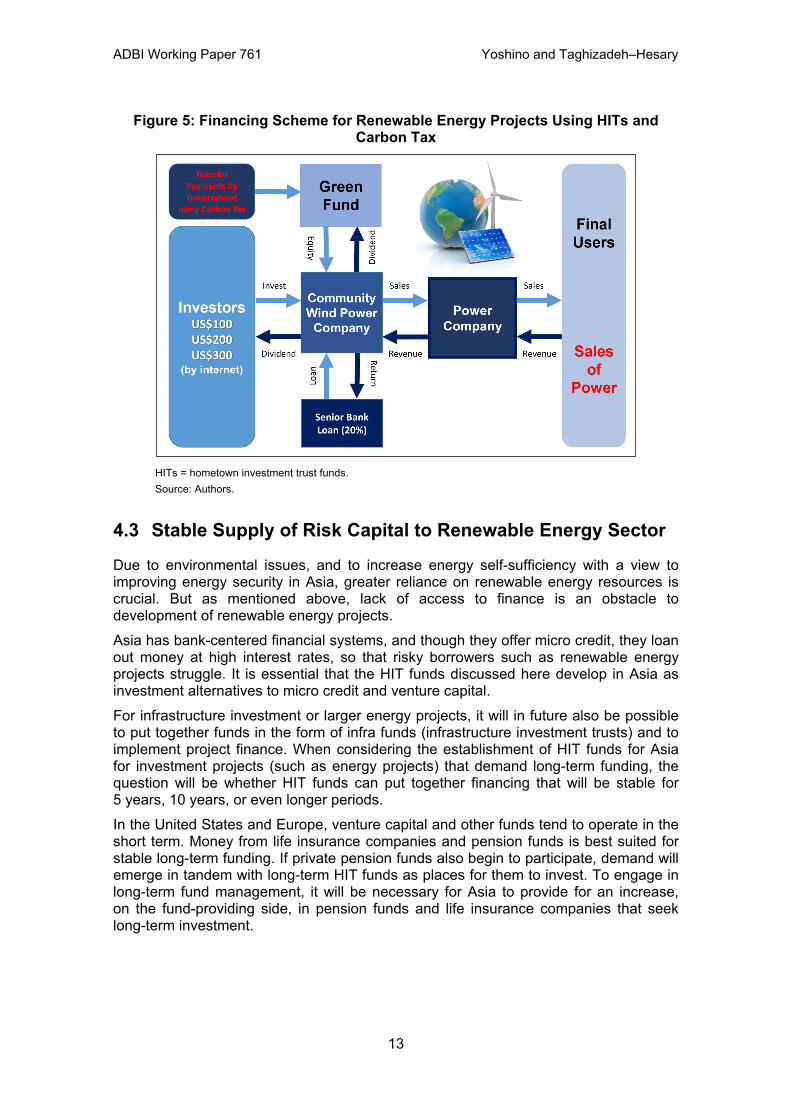
Figure 4 shows that if government injects taxes into HITs designed for green energy projects, the feasibility of green energy projects increases, making these projects more interesting for hometown investors and hence the supply of investment money to these funds will increase (Figure 5). On the other hand, if HITs invest in very risky green energy projects, this makes hometown investors reluctant to invest their money in these projects, which shrinks the supply of lending/investment to these sectors. Hence, it is crucial for fund managers to check the feasibility and creditworthiness of projects and select only projects with a high probability of success.
12
ADBI Working Paper 761 Yoshino and Taghizadeh–Hesary
Figure 5: Financing Scheme for Renewable Energy Projects Using HITs and Carbon Tax
HITs = hometown investment trust funds. Source: Authors.
4.3 Stable Supply of Risk Capital to Renewable Energy Sector
Due to environmental issues, and to increase energy self-sufficiency with a view to improving energy security in Asia, greater reliance on renewable energy resources is crucial. But as mentioned above, lack of access to finance is an obstacle to development of renewable energy projects. Asia has bank-centered financial systems, and though they offer micro credit, they loan out money at high interest rates, so that risky borrowers such as renewable energy projects struggle. It is essential that the HIT funds discussed here develop in Asia as investment alternatives to micro credit and venture capital. For infrastructure investment or larger energy projects, it will in future also be possible to put together funds in the form of infra funds (infrastructure investment trusts) and to implement project finance. When considering the establishment of HIT funds for Asia for investment projects (such as energy projects) that demand long-term funding, the question will be whether HIT funds can put together financing that will be stable for 5 years, 10 years, or even longer periods. In the United States and Europe, venture capital and other funds tend to operate in the short term. Money from life insurance companies and pension funds is best suited for stable long-term funding. If private pension funds also begin to participate, demand will emerge in tandem with long-term HIT funds as places for them to invest. To engage in long-term fund management, it will be necessary for Asia to provide for an increase, on the fund-providing side, in pension funds and life insurance companies that seek long-term investment.
13

ADBI Working Paper 761 Yoshino and Taghizadeh–Hesary
4.4 Fostering Sound Hometown Investment Trust Funds
HIT funds, forest investment funds for environmental protection, infrastructure funds, and other such investments are also expected to appear in areas removed from the main urban centers. When they do, it will be necessary to prevent the rise of unscrupulous investment fund companies that offer inferior projects for investment and have no commitment to the projects of the companies invested in, and lead investors into loss. When HIT funds are on a small scale, it is to be expected that many individual investors will consider the investment as support for the local region (i.e., solar power or wind power in a village). They can be expected to consider the investment trust to operate as a combination of contribution and investment. A variety of different regional assistance funds have come into being, including HIT funds for the purpose of development of solar power and wind power in Japan, after the Great East Japan Earthquake that resulted in a nuclear disaster and people becoming more interested in non-nuclear clean energy resources (i.e., solar and wind) and starting to develop HITs for development of their projects. HITs are expanding in Thailand, the Philippines, and Mongolia, and not only in Asia but also in many other countries outside the region, for example in Peru. The fund operators will have to set up a self-regulating organization that checks the activity of each other’s fund and cultivates excellent operators who will not betray the confidence of investors. This is necessary, otherwise the HIT funds that have finally managed to grow will lose credibility, people will not want to invest again, and HIT funds will not expand. It will be necessary to monitor the self-regulating organization as it supports excellent operators and eliminates unscrupulous operators. It will also be desirable to create a system whereby the Financial Services Agency or other government authority monitors investment funds as they do Type II Financial Instruments Business Operators and eliminates unscrupulous operators.
5. CONCLUDING REMARKS Fossil fuels, especially coal, are the main sources of fuel for Asian economies. Excessive reliance on fossil fuels, especially coal, is a major cause of GHG emissions in Asia. Renewable energy projects are sustainable solutions for mitigating the climate warming issues from the current critical level. Another necessity for development of renewable projects is raising energy self-sufficiency and energy security through diversification of energy resources. Too much reliance on limited resources of energy (coal, oil, or gas) will reduce the resiliency of the economy and make it more prone to energy price fluctuations. One of the main obstacles to development of green energy projects is lack of access to finance. Most Asian economies are bank dominant and the share of the capital market in their financial systems is very small. Hence, banks are the major source of financing projects, but they do not have long-term assets because most of their liabilities are short term and medium term (short-term and medium-term deposits of up to 5 years). After banks, in most of Asian economies insurance companies and pensions have the second largest share of the financial market. Savings at insurance companies are predominanty long-term (10 years, 20 years, or 40 years), which means insurance companies and pension funds can allocate their resources to long-term projects such as infrastructural projects or mega energy projects (large hydropower projects, gas-based power generation projects, etc.). On the other hand, electricity tariffs are
14
ADBI Working Paper 761 Yoshino and Taghizadeh–Hesary
regulated by the government and kept at low rates. Hence, to increase the investment incentives spillover effects originally created by energy supplies need to be utilized and tax revenues refunded to investors in energy projects. For smaller-sized projects, the paper theoretically and empirically introduced a combined model of carbon tax and a new way of financing risky capital, i.e., HITs. HITs are a form of crowdfunding, although there are significant differences between HITs and conventional types of crowdfunds—i) A “warm feeling” is behind the HITs, because investors sympathize with the company/project owners and they are not merely seeking to make a profit; ii) investors are prepared to accept products or services generated by the project (i.e., the electricity generated from a wind power generator in a small village) rather than insist on a share of the profit. In crowdfunding or venture capital, by contrast, profit is the only purpose of investment. Because of the Basel capital requirements and because most green energy projects from the point of view of financers are considered to be risky projects, many financers are reluctant to lend to them. Hence project owners for developing these projects usually need to borrow from the market at very high interest rates. The paper theoretically shows that by taxing carbon dioxide (CO2), sulphur dioxide (SO2), and nitrogen oxides (NOx) and allocating those tax revenues to HITs, green projects will become more feasible and more interesting for hometown investors, hence the supply of investment money to these funds will increase. This will help green energy projects to address their problem of lack of access to finance. Having said that, if HITs invest in very risky green energy projects, hometown investors will be reluctant to invest in such projects, which will reduce the supply of lending/investments to these sectors. It is crucial, therefore, that fund managers carefully assess the feasibility and credit worthiness of projects and only select those with a high probability of success.
15
ADBI Working Paper 761 Yoshino and Taghizadeh–Hesary
REFERENCES ADB. 2013a. Primer Energy Statistics in Asia and the Pacific (1990–2009) and Energy
Outlook for Asia and the Pacific. Manila: Asian Development Bank. ———. 2013b. Asian Development Outlook 2013: Asia’s Energy Challenge. Manila:
Asian Development Bank. ———. 2015. Knowledge and Power: Lessors from ADB Energy Projects. Manila:
Asian Development Bank. ———. Wind Energy. http://www.adb.org/sectors/energy/programs/clean-energy-
program/wind-energy (accessed 11 June 2017). Aguilera, R.F., J. Inchauspe, and R. D. Ripple. 2014. The Asia Pacific Natural Gas
Market: Large Enough for All? Energy Policy 65: 1–6. APERC. 2004. Nuclear Power Generation in the APEC Region. Tokyo: Asia Pacific
Energy Research Centre. http://aperc.ieej.or.jp/file/2010/9/26/ Nuclear_Power_Generation_2004.pdf (accessed 15 June 2017).
Barsky, R. B., and L. Kilian. 2004. Oil and the Macroeconomy since the 1970s. Journal of Economic Perspectives 18(4): 115–134.
Dangerman, A.T.C.J., and H. J. Schellnhuber. 2013. Energy Systems Transformation. Proc. Natl. Acad. Sci. 110(7): E549–E558. http://dx.doi.org/10.1073/ pnas.1219791110.
Grubb, M. 2014. Planetary Economics. Oxford, United Kingdom and New York, NY: Routledge.
Gumartini, T. 2009. Biomass Energy In the Asia–Pacific region: Current Status, Trends and Future Setting. Working Paper No. APFSOS II/WP/2009/26. Bangkok: Food And Agriculture Organization of the United Nations Regional Office for Asia and the Pacific.
Hamilton, J. D. 1983. Oil and the Macroeconomy since World War II. Journal of Political Economy 91(2): 228–248.
IEA. 2011. Solar Energy Perspectives. Paris: International Energy Agency. ———. 2014. World Energy Investment Outlook 2014 Special Report. Paris:
International Energy Agency. Mazzucatoa, M., and G. Semieniukb. 2017. Financing Renewable Energy: Who is
Financing What and Why it Matters. Technological Forecasting & Social Change. dx.doi.org/10.1016/j.techfore.2017.05.021
Ministry of Internal Affairs and Communication (MIAC). 2015. Statistical Handbook of Japan 2015. Tokyo: Statistics Bureau, Ministry of Internal Affairs and Communication.
NRDC (2016). Clean Energy Finance Outlook: Opportunities for Green Banks and Green Bonds in Chile. New York, NY: Natural Resources Defence Council.
Stern, N. 2015. Why Are We Waiting?: The Logic, Urgency, and Promise of Tackling Climate Change. Cambridge, MA: MIT Press.
16
ADBI Working Paper 761 Yoshino and Taghizadeh–Hesary
Taghizadeh–Hesary, F., and N. Yoshino. 2015. Macroeconomic Effects of Oil Price Fluctuations on Emerging and Developed Economies in a Model Incorporating Monetary Variables. Economics and Policy of Energy and the Environment 2: 51–75.
———. 2016. Monetary Policy, Oil Prices and the Real Macroeconomic Variables: An Empirical Survey on China, Japan and the United States. China: An International Journal 14(4): 46–69.
Taghizadeh–Hesary, F., N. Yoshino, and E. Rasoulinezhad. 2017. Impact of the Fukushima Nuclear Disaster on the Oil-Consuming Sectors of Japan. Journal of Comparative Asian Development 16(2): 113–134. DOI: 10.1080/ 15339114.2017.1298457
Taghizadeh–Hesary, F., N. Yoshino, G. Abdoli, and A. Farzinvash. 2013. An Estimation of the Impact of Oil Shocks on Crude Oil Exporting Economies and their Trade Partners. Frontiers of Economics in China 8: 571–591.
Taghizadeh–Hesary, F., Yoshino, N., Mohammadi Hossein Abadi, M., and Farboudmanesh, R. (2016). Response of macro variables of emerging and developed oil importers to oil price movements. Journal of the Asia Pacific Economy, 21(1), 91–102. doi:10.1080/13547860.2015.1057955
UNEP and BNEF. 2015. Global Trends in Renewable Energy Investment 2015. Frankfurt, Germany: Frankfurt School of Finance & Management.
UNIDO and ICSHP. 2013. World Small Hydropower Report 2013. Vienna: United Nations Industrial Development Organization and International Center on Small Hydro Power. http://www.smallhydroworld.org/fileadmin/user_upload/pdf/ WSHPDR_2013_Final_Report-updated_version.pdf (accessed 20 June 2017)
World Coal Association (https://www.worldcoal.org/resources) Yoshino, N., and F. Taghizadeh–Hesary. 2014a. Hometown Investment Trust Funds:
An Analysis of Credit Risk. ADBI Working Paper 505. Tokyo: Asian Development Bank Institute.
———. 2014b. An Analysis of Challenges Faced by Japan’s Economy and Abenomics. The Japanese Political Economy 40:3–4, 37–62.
Yoshino, N., and S. Kaji (eds.). 2013. Hometown Investment Trust Funds. Tokyo: Springer.
Yoshino, N., and U. Abidhadjaev. 2017. An Impact Evaluation of Investment in Infrastructure: The Case of a Railway Connection in Uzbekistan. Journal of Asian Economics 49: 1–11.
Yoshino, N., F. Taghizadeh–Hesary, and N. Tawk. 2017. Decline of Oil Prices and the Negative Interest Rate Policy in Japan. Economic and Political Studies 5(2): 233–250. DOI: 10.1080/20954816.2017.1310798
17