asgrid: autonomic management of hybrid sensor grid systems and
TRANSCRIPT
ASGrid: AutonomicManagement of Hybrid SensorGrid Systems and Applications∗
Xiaolin Li*, Xinxin Liu, Han Zhao, Huanyu ZhaoScalable Software Systems LaboratoryComputer Science DepartmentOklahoma State UniversityStillwater, OK 74078, USA{xiaolin, xinxin, haz, huanyu}@cs.okstate.edu
Nanyan Jiang, Manish ParasharThe Applied Software Systems LaboratoryElectrical & Computer Engineering DepartmentRutgers UniversityPiscataway, NJ 08854, USA{nanyanj, parashar}@caip.rutgers.edu
Abstract:In this paper, we propose an autonomic management framework (ASGrid) to address the re-
quirements of emerging large-scale applications in hybrid grid and sensor network systems. Tothe best of our knowledge, we are the first who proposed the notion of autonomic sensor gridsystems in a holistic manner, aiming at non-trivial large applications. To bridge the gap betweenthe physical world and the digital world and facilitate information analysis and decision making,ASGrid is designed to smooth the integration of sensor networks and grid systems and effi-ciently use both on demand. Under the blueprint of ASGrid, we present several building blocksthat fulfill the following major features: (1) Self-configuration through content-based aggrega-tion and associative rendezvous mechanisms; (2) Self-optimization through utility-based sensorselection, model-driven hierarchical sensing task scheduling, and auction-based game-theoreticapproach for grid scheduling; (3) Self-protection through ActiveKey dynamic key managementand S3Trust trust management mechanisms. Experimental and simulation results on these aspectsare presented.
Keywords: Wireless Sensor Networks, Grid Computing, Autonomic Computing, Hybrid Dis-tributed Systems, Network Security, Data Aggregation, Task Scheduling, Key Management,Trust Management, Peer-to-Peer Computing
Biographical notes: Xiaolin Li is currently an Assistant Professor and the director of ScalableSoftware Systems Laboratory in Computer Science Department at Oklahoma State University.He received the PhD in Computer Engineering from Rutgers University. His research interestsinclude distributed systems, sensor networks, and network security. More information about hisresearch can be found at http://s3lab.cs.okstate.edu/. He is in the executive committee of IEEETechnical Committee of Scalable Computing (TCSC) and the coordinator of Sensor Networks.He has been a TPC chair for several conferences and workshops and an associate editor forseveral journals. He is a member of IEEE and ACM.
1 Introduction
Scientific applications, such as waste management [Parasharet al., 2006], volcano monitoring [Werner-Allen et al., 2005],city-wide structural monitoring [Kottapalli et al., 2003], habitat
∗The research presented in this paper is supported in part by NationalScience Foundation (grant numbers CNS-0709329, CNS-0723594, and IIP-0758566).
and environmental monitoring [Mainwaring et al., 2002], andend-to-end soil monitoring system [Szlavecz et al., 2006] is nowexperiencing a revolution in instrumentation, which will changethe character and scope of its experiments and measurements.Advances in instrumentation at many scales are turning scien-tific observation system into a data rich field and allowing new
Copyright c© 200x Inderscience Enterprises Ltd.
1
quantitative synthesis and hypothesis testing in near real time,as data streams in from distributed instruments. To enable thischange it is essential that distributed networks of sensors func-tion, not only as passive measurement devices, but as intelligentdata processing instruments, capable of data quality assurance,statistical synthesis and hypotheses testing, over streams of datafrom the physical environment.
Example scientific applications with such end-to-end cyber-systems include land surface hydrology process system whichneed to predict the temporal and spatial hydrologic system vari-ations. Traditionally, the prediction of such variations are oftenpoor with sole simulation model, due to model initialization,parameter and forcing errors, and inadequate model physicsand/or resolution. That is, the real-time phenomenon predictiondepends too much on (inaccurate) modeling based on histori-cal data. As a result, the lack of (near) real-time measurementsmakes it impossible to catch the real world temporal and spa-tial variations. With the advance of the sensor technology, it be-comes possible to feed in data from deployed sensor networks atmuch more desired resolutions, such as with changed samplingrate and varied resolutions. Therefore, such end-to-end cyber-infrastructure with sensor sub-system interconnected with clus-ters/grids and remote accessible end user systems makes it pos-sible to monitor, control and optimize real time applications.
These emerging applications and systems render new appli-cation requirements and systems requirements largely differentfrom traditional stand-alone systems in either grids or sensornetworks.
1.1 Application Requirements
Future extensive usage of sensor networks for scientific comput-ing uncovered new requirements for characterizing previouslyunknown phenomenon.
Varied spatial and temporal phenomenon. Due to the vari-ation of temporal and spatial phenomenon, multi-scale multi-resolution of measurement collections and processions shouldbe supported. The geographic information embedded in thedata is the data source for scientific data assimilation, wheredata with different spatial intervals are interpolated to fuse withsimulation models. In order to support different level of on-lineanalysis, the requirement for spatial data samplings can be dif-ferent. Furthermore, due to the dynamics of the applications,the model may require the different resolution of sensor datafrom different part of the field. Traditionally, spatial interpola-tions are used. With the availability of large scale sensor net-work, multi-resolution sensor data can be directly used basedon application needs.
Data quality and uncertainty estimation. Scientific investi-gations require varied data qualities, such as adaptive accuracy,spatial and temporal resolutions. Fidelity, accuracy, precisionand uncertainty estimations are important aspects for scientificdata assimilations. For example, scientific applications shoulddrive desired accuracy. Such accuracy should be able to be man-aged within sensor networks.
Predictable temporal response to varying applicationcharacteristics. Scientific application require a reasonable(sometimes low) and predictable latency to implement robust
sense-evaluate-actuate cycles. It is desired to acquire informa-tion (not only raw data) to enable (near) real-time monitoringand analysis. The timescales different from application to ap-plication, and possibly for different stages and tasks of a givenapplication. For example, applications involving aerodynamicstabilization and neural control may require millisecond levelresponse while oil reservoir management may require responsesin seconds, hours, days or weeks depending on the nature of thecontrol task.
1.2 System requirements
Performance and resource sharing. It is especially importantfor sensor network to optimize resource usage and at the sametime to satisfy the QoS of applications. As a result, it is im-portant to investigate the cost tradeoff (e.g. network lifetime,sampling rate, quality of measurements with bandwidth, energyusages), such as costs between in-network data assimilation andraw data collection from sensor network.
Load balancing. Sensor network may consume their re-sources unevenly which may result in early dying of part of thenetwork. As a result, it is necessary to balance loads, such asin-network computation, communication more evenly.
Power-Aware Self-Managing. Energy consumption is oneof the primary constraints in sensor networks. It is essential toprovide fundamental system supports to enable energy-efficientself-managing capabilities beyond merely speeding up the per-formance.
Simple and Extensible Programming Models and Inter-faces. To enable current applications and potential future appli-cations, extensible and user-friendly programming models andinterfaces design shall be further investigated. The capabilitiesof a system can only be exploited following an efficient andextensible programming utilities, such as basic programmingmodels, interfaces, libraries etc.
The rest of the paper is organized as follows. Sec-tion 2 presents the system architecture of the ASGrid frame-work. Section 3 presents the self-configuration mechanismthrough content-based aggregation. Section 4 presents the self-optimization through resource management and task schedul-ing. Section 5 presents two security schemes: ActiveKey andS3Trust. Section 6 presents the experimental results. Section 7presents the related work. Section 8 concludes the paper.
2 System Architecture
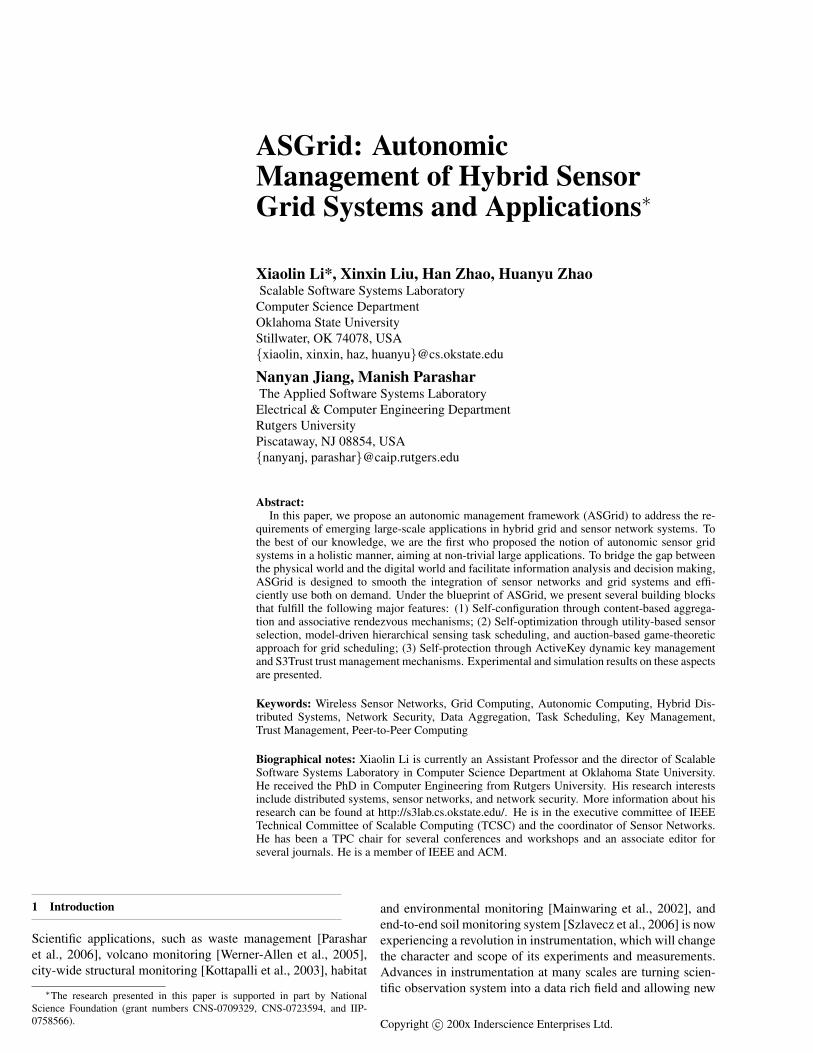
The ASGrid framework is intended to provide an inte-grated service bridging the sensor networks and grid comput-ing/storage systems. The conceptual architecture is shown inFig. 1. The ASGrid framework integrates grid and sensor sys-tems through pervasive data services across both systems, con-sisting of the following layered modules from the bottom up.
• Self-Organizing Overlay. The overlay network is basedon the Content Addressable Network (CAN) protocol withsmart spatial and temporal load balancing and adaptivereplica.
2
text
Associative Rendezvous Messaging
Content-Based Routing
Master Autonomic Manager
Scheduling Engine
TinyAuto
Mote MoteGrid Resources (Computing, Storage, Communication)
Mote n
Mote i
SensornetGrid Gateway
Data-Driven Simulation Engine
Pre-Processing Programming Model
Web Portal/GUI (S3PAS Powered)
User Developer
Output Utilities
Development Kit and API
Results and
Visualization(queries,
commands,
injecting agents)
Interacting
Software Modules
TinyAuto
Self-Organized OverlaySelf
-Org
an
izin
g, S
elf
-Op
tim
izin
g,
an
d S
ecu
red
Access
Self
-Co
nfi
gu
rin
g, S
elf
-
Pro
tecti
ng
, an
d P
ow
er-
Aw
are
Data Fusion Active Key
( )( )
( )( )
( )( )
Figure 1: Conceptual Architecture of ASGrid
• Content-based Routing. Content-based routing and aggre-gation are realized through associative rendezvous messag-ing and semantic aggregation.
• Autonomic Managers. Autonomic managers include mas-ter autonomic managers (MAM) and TinyAuto. MAMis in charge of diverse functions of self-managing andprovides managing and adapting policies. TinyAuto isa lightweight component designed particularly for sensornetworks considering energy-efficiency and other resourceconstraints.
• Scheduling Engine. High-level task decomposition,scheduling, and resource management will be supportedthrough the scheduling engine. A low-level sensing taskscheduling strategy has been proposed in sensor networkfields for sensing and data fusion. An auction-based game-theoretic approach has been proposed in grid systems.
• Upper Layers: Preprocessing, Programming Models, UserInterface, and Programming Interface. Queries and taskssubmitted by users are first preprocessed, decomposed, andscheduled to appropriate resources. Programming modelsare used for developers and other interactive software totap the information and resources in ASGrid systems.
• Self-Protecting Modules. The low-level dynamic key man-agement scheme ActiveKey and high-level trust manage-ment scheme S3Trust can be used in both sensor networksand grid systems.
3 Self-Configuration: Content-based Aggregation Service
The content-based aggregation service provides a uniformquery interface where aggregation queries are specified usingcontent descriptors from a semantic space in the form of key-words, partial keywords, wildcards and ranges, and the typeof aggregation desired. Spatial attributes of a data item, e.g.,
the location of the sensor producing the data can be specifiedalong with the other attributes in a query. The service extendsthe Associative Rendezvous (AR) [Jiang et al., 2004] abstrac-tion for content-based information discovery and decoupled in-teractions. In this section, we first introduce the associativerendezvous model and then describe the semantics of the ag-gregation service. To meet the needs of queries, sensor net-works are self-configured to provide content-based aggregationservice similar to the construction of semantic routing tree inTinyDB [Madden et al., 2003].
3.1 Associative Rendezvous Messaging
The AR interaction model [Jiang et al., 2004] consists of threeelements: Messages, Associative Selection, and Reactive Be-haviors.
AR Messages An AR message is defined as the triplet:(header, action, data). The data field may be empty or maycontain the message payload. The header includes a semanticprofile in addition to the credentials of the sender, a messagecontext and the TTL (time-to-live) of the message. The profileis a set of attributes and/or attribute-value pairs, and defines therecipients of the message. The attribute field must be a keywordfrom a defined information space while the value field may bea keyword, partial keyword, wildcard, or range from the samespace. At the Rendezvous Point 1 (RP), a profile is classified asa data profile or an interest profile depending on the action fieldof the message. The action field of the AR message defines thereactive behavior at the RP as described below.
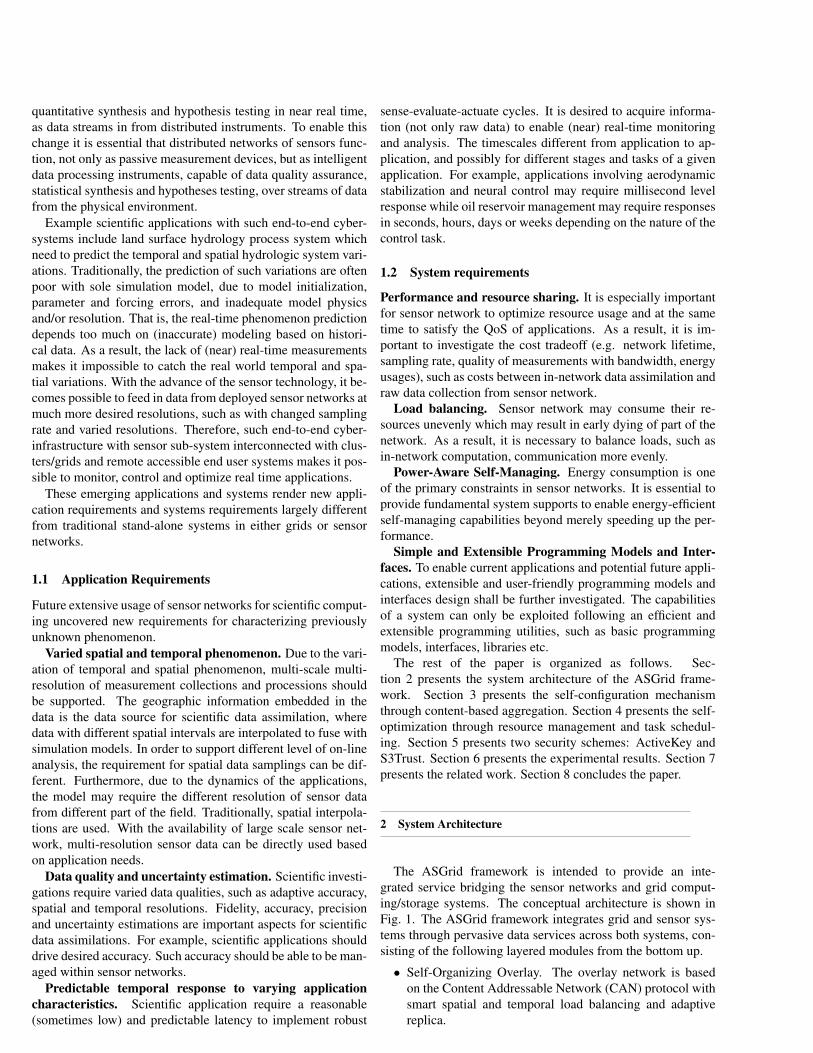
Associative Selection Profiles in AR are represented using ahierarchical schema that can be efficiently stored and evaluatedby the selection engine at runtime. For example, the profilein Figure 2 (a) is associatively selected by the profile in Fig-ure 2 (b), since (1) the location [120, 23] of the data is withinthe region of interest defined by the ranges [100-130, 20-50], (2)the attribute temperature matches and its value 100 > 80, which
1A Rendezvous Point is a peer node in the P2P system.
3
( location = [120, 23] ) ( temperature = 110 ) ( unit = Fahrenheit ) ( error <= 0.01 ) ( alarm )
( location [100-130, 20-50] ) ( temperature > 80) ( unit = Fa* ) ( error <= 0.1 ) ( alarm )
(a) (b)
Figure 2: Sample message profiles: (a) a data profile; (b) aninterest profile.
satisfies the binary relation, (3) the attribute unit matches, andits value Fahrenheit matches wildcard Fa∗, (4) error<0.01 sat-isfies the request error<0.1, and (5) the attribute alarm matches.A key characteristic of the selection process is that it does notdifferentiate between interest and data profiles. This allows allmessages to be symmetric where data profiles can trigger thereactive behaviors of interest messages and vice versa. Thematching system combines selective information disseminationwith reactive behaviors. Further, both data and interest messageare persistent, with their persistence defined by the TTL field.
Reactive Behaviors The action field of the message definesthe reactive behavior at the RP. Basic reactive behaviors cur-rently defined include store, retrieve, notify, and delete. Thenotify and delete actions are explicitly invoked on a data or aninterest profile. The store action stores data and data profiles atthe RP. It also causes the message profile to be matched againstexisting interest profiles and associated actions to be executedin case of a positive match. The retrieve action retrieves datacorresponding to each matching data profile. The notify ac-tion matches the message profile against existing interest/dataprofiles, and notifies the sender if there is at least one positivematch. Finally, the delete action deletes matching interest/dataprofiles. Note that the actions will only be executed if the mes-sage header contains an appropriate credential. Also note thateach message is stored at the RP for a period corresponding tothe TTL defined in its header. In case of multiple matches, theprofiles are processed in random order.
3.2 Information Aggregation using Associative Ren-dezvous
The aggregation service extends the retrieve reactive behaviorto specify aggregation operators, i.e., the AR message for aninterest profile includes the aggregation operation as follows:(< {attr} >, retrieve(A)), where attr is the set of contentattributes of the interest profile within the AR message header,and retrieve(A) specifies aggregation using the aggregationoperator A. Note that aggregations can be constrained to data-elements within a specific spatial region. The location attributesof a data element for an aggregation query are specified as partof the semantic profile of the message header, similar to othercontent attributes, i.e., location descriptors form (typically lead-ing) dimensions of the semantic information space, based onwhich data and interest profiles are defined. The data profilebecomes (< L, {attr} >, store, data) and the correspond-ing interest profile becomes (< L, {attr} >, retrieve(A)),where L specifies the location of the data producer in the data
profile and the region of interest in the interest profile. L mayuse latitude/longitude or any other specification of location. Forexample, in Figure 2, the data profile includes the location ofthe sensors, while the interest profile includes ranges specify-ing the region of interest. Aggregation queries may also berecurrent in time. In such a query, an additional parameter isrequired to specify the frequency of evaluation of the persistentquery; (< L, {attr}, TTL >, retrieve(A, Ta)), where Ta isthe time interval between repeated aggregates.
3.3 Semantics of Aggregation
The semantics of the aggregation query are as follows. Whenan aggregation query is posted, the query is routed to all ren-dezvous peers with data profiles that match the query’s interestprofile. All data items at all peers that match the interest profilespecification are aggregated according to the specified aggrega-tion operator and are returned. In case of recurrent aggregationqueries, the interest profile is registered at each rendezvous peerfor the duration of its TTL, and is repeatedly evaluated at thespecified frequency. The aggregation operation is repeated eachtime the query is evaluated and the aggregate is returned. Notethat each aggregation operation is independent.
To illustrate the operation of the aggregation service, con-sider a traffic monitoring system with deployed vehicle speedsensors. An example of an aggregate query for such a sys-tem is find the average speed in the stretch of road specifiedby region L every 5 minutes for the next 1 hour. An aggrega-tion query would be realized using the aggregation service de-scribed above as follows: the client connects to any rendezvouspeer in the system and posts an aggregate query with profile< L, p1 >, and retrieves information using the aggregatorAVG defined over region L, with an aggregation frequency of 5minutes and a TTL of 1 hour. Such an aggregate query can bewritten as post(< L, p1, 3600 >, retrieve(AV G, 300)), wherethe time is measured in seconds. This query is routed to, andregistered at every peer that stores data elements matching thisquery. In response, every matching data-elements in the systemare aggregated and returned to the client.
4 Self-Optimization: Resource Management and Scheduling
Resource management in sensor networks plays an importantrole due to resource scarcity. While most research work hasbeen focused on low-level efficient routing, systematic resourcemanagement that is adaptive to application runtime states andcontexts has received little attention. We address resource man-agement issues in an integrated and systematic manner: (1)Two tier data and control flow management; (2) Auction-basedgrid task scheduling schemes; (3) Utility-based and potential-driven node selection schemes, node-level and system-levelutility functions are defined considering all aspects of energyresidual, communication cost, and data or information quality;(4) Model-driven data fusion task scheduling schemes.
4
Basestation
Wirele
ss s
ensor netw
ork
sG
rid c
om
puting s
yste
m
Data fusion nodes
Source nodes
Data-Driven Simulation
Engine
Sensed Data
Fused Data
Collective DataAdjust Parameters
Adjust Sensing Tasks
Inter-Cluster Scheduling
Intra-Cluster Scheduling
Self-manage Policies
Knowledge Base
Computing nodes
Clusters
Front-End
User Task, Data
Internal Tasks
Decomposed
Tasks Local Results
Required Results
Distributed Autonomic Managers
Results/Visualization
Data Flow Control Flow Self-Managing
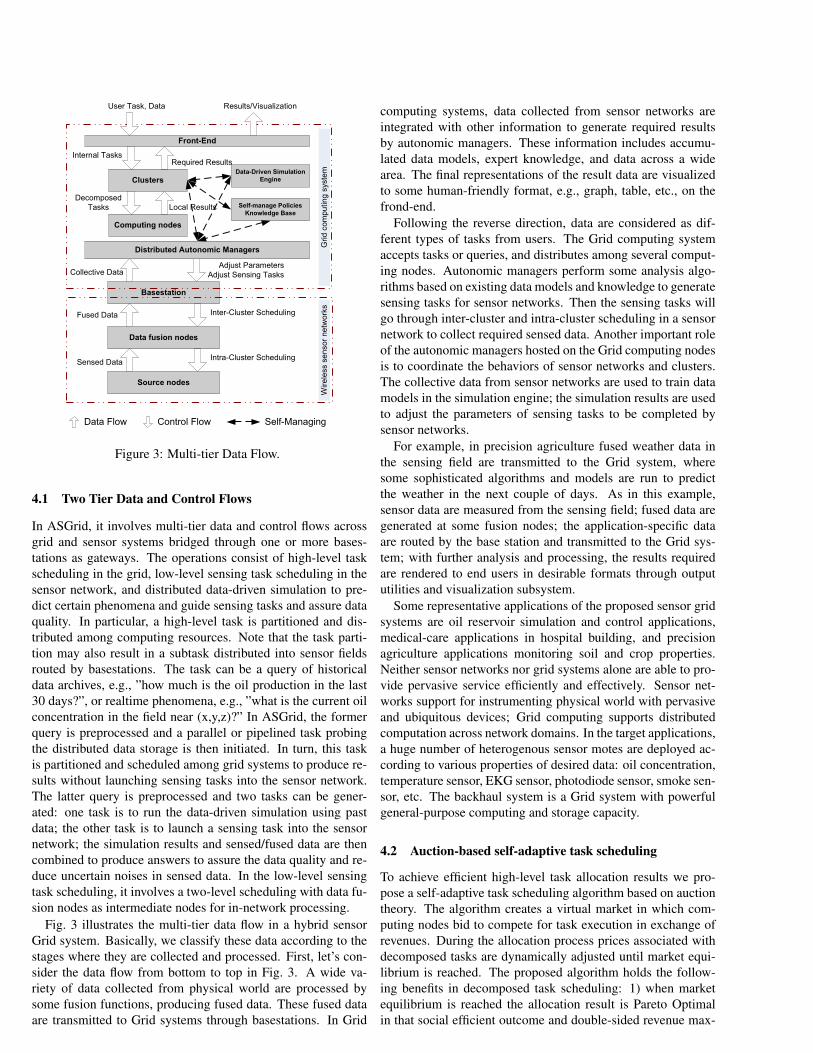
Figure 3: Multi-tier Data Flow.
4.1 Two Tier Data and Control Flows
In ASGrid, it involves multi-tier data and control flows acrossgrid and sensor systems bridged through one or more bases-tations as gateways. The operations consist of high-level taskscheduling in the grid, low-level sensing task scheduling in thesensor network, and distributed data-driven simulation to pre-dict certain phenomena and guide sensing tasks and assure dataquality. In particular, a high-level task is partitioned and dis-tributed among computing resources. Note that the task parti-tion may also result in a subtask distributed into sensor fieldsrouted by basestations. The task can be a query of historicaldata archives, e.g., ”how much is the oil production in the last30 days?”, or realtime phenomena, e.g., ”what is the current oilconcentration in the field near (x,y,z)?” In ASGrid, the formerquery is preprocessed and a parallel or pipelined task probingthe distributed data storage is then initiated. In turn, this taskis partitioned and scheduled among grid systems to produce re-sults without launching sensing tasks into the sensor network.The latter query is preprocessed and two tasks can be gener-ated: one task is to run the data-driven simulation using pastdata; the other task is to launch a sensing task into the sensornetwork; the simulation results and sensed/fused data are thencombined to produce answers to assure the data quality and re-duce uncertain noises in sensed data. In the low-level sensingtask scheduling, it involves a two-level scheduling with data fu-sion nodes as intermediate nodes for in-network processing.
Fig. 3 illustrates the multi-tier data flow in a hybrid sensorGrid system. Basically, we classify these data according to thestages where they are collected and processed. First, let’s con-sider the data flow from bottom to top in Fig. 3. A wide va-riety of data collected from physical world are processed bysome fusion functions, producing fused data. These fused dataare transmitted to Grid systems through basestations. In Grid
computing systems, data collected from sensor networks areintegrated with other information to generate required resultsby autonomic managers. These information includes accumu-lated data models, expert knowledge, and data across a widearea. The final representations of the result data are visualizedto some human-friendly format, e.g., graph, table, etc., on thefrond-end.
Following the reverse direction, data are considered as dif-ferent types of tasks from users. The Grid computing systemaccepts tasks or queries, and distributes among several comput-ing nodes. Autonomic managers perform some analysis algo-rithms based on existing data models and knowledge to generatesensing tasks for sensor networks. Then the sensing tasks willgo through inter-cluster and intra-cluster scheduling in a sensornetwork to collect required sensed data. Another important roleof the autonomic managers hosted on the Grid computing nodesis to coordinate the behaviors of sensor networks and clusters.The collective data from sensor networks are used to train datamodels in the simulation engine; the simulation results are usedto adjust the parameters of sensing tasks to be completed bysensor networks.
For example, in precision agriculture fused weather data inthe sensing field are transmitted to the Grid system, wheresome sophisticated algorithms and models are run to predictthe weather in the next couple of days. As in this example,sensor data are measured from the sensing field; fused data aregenerated at some fusion nodes; the application-specific dataare routed by the base station and transmitted to the Grid sys-tem; with further analysis and processing, the results requiredare rendered to end users in desirable formats through outpututilities and visualization subsystem.
Some representative applications of the proposed sensor gridsystems are oil reservoir simulation and control applications,medical-care applications in hospital building, and precisionagriculture applications monitoring soil and crop properties.Neither sensor networks nor grid systems alone are able to pro-vide pervasive service efficiently and effectively. Sensor net-works support for instrumenting physical world with pervasiveand ubiquitous devices; Grid computing supports distributedcomputation across network domains. In the target applications,a huge number of heterogenous sensor motes are deployed ac-cording to various properties of desired data: oil concentration,temperature sensor, EKG sensor, photodiode sensor, smoke sen-sor, etc. The backhaul system is a Grid system with powerfulgeneral-purpose computing and storage capacity.
4.2 Auction-based self-adaptive task scheduling
To achieve efficient high-level task allocation results we pro-pose a self-adaptive task scheduling algorithm based on auctiontheory. The algorithm creates a virtual market in which com-puting nodes bid to compete for task execution in exchange ofrevenues. During the allocation process prices associated withdecomposed tasks are dynamically adjusted until market equi-librium is reached. The proposed algorithm holds the follow-ing benefits in decomposed task scheduling: 1) when marketequilibrium is reached the allocation result is Pareto Optimalin that social efficient outcome and double-sided revenue max-
5
User
FIFO Job
Queue
Job
Registration
Global
Scheduler
Job Route Task Route
Results Collection Execution Feedback
Job Bidding
Task Bidding
Local
Cluster
FIFO Job
Queue
FIFO
Task
Queue
Intra-Cluster
Network
�ode
�ode
�ode
�ode
Local
Cluster
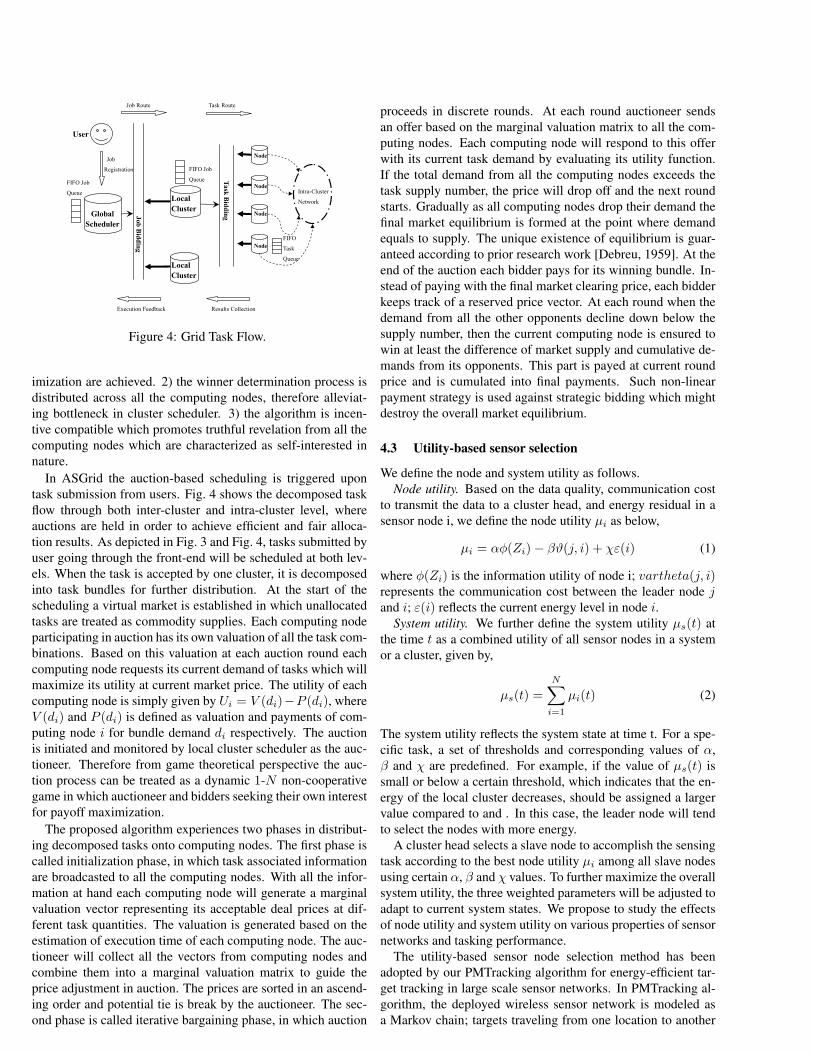
Figure 4: Grid Task Flow.
imization are achieved. 2) the winner determination process isdistributed across all the computing nodes, therefore alleviat-ing bottleneck in cluster scheduler. 3) the algorithm is incen-tive compatible which promotes truthful revelation from all thecomputing nodes which are characterized as self-interested innature.
In ASGrid the auction-based scheduling is triggered upontask submission from users. Fig. 4 shows the decomposed taskflow through both inter-cluster and intra-cluster level, whereauctions are held in order to achieve efficient and fair alloca-tion results. As depicted in Fig. 3 and Fig. 4, tasks submitted byuser going through the front-end will be scheduled at both lev-els. When the task is accepted by one cluster, it is decomposedinto task bundles for further distribution. At the start of thescheduling a virtual market is established in which unallocatedtasks are treated as commodity supplies. Each computing nodeparticipating in auction has its own valuation of all the task com-binations. Based on this valuation at each auction round eachcomputing node requests its current demand of tasks which willmaximize its utility at current market price. The utility of eachcomputing node is simply given by Ui = V (di)−P (di), whereV (di) and P (di) is defined as valuation and payments of com-puting node i for bundle demand di respectively. The auctionis initiated and monitored by local cluster scheduler as the auc-tioneer. Therefore from game theoretical perspective the auc-tion process can be treated as a dynamic 1-N non-cooperativegame in which auctioneer and bidders seeking their own interestfor payoff maximization.
The proposed algorithm experiences two phases in distribut-ing decomposed tasks onto computing nodes. The first phase iscalled initialization phase, in which task associated informationare broadcasted to all the computing nodes. With all the infor-mation at hand each computing node will generate a marginalvaluation vector representing its acceptable deal prices at dif-ferent task quantities. The valuation is generated based on theestimation of execution time of each computing node. The auc-tioneer will collect all the vectors from computing nodes andcombine them into a marginal valuation matrix to guide theprice adjustment in auction. The prices are sorted in an ascend-ing order and potential tie is break by the auctioneer. The sec-ond phase is called iterative bargaining phase, in which auction
proceeds in discrete rounds. At each round auctioneer sendsan offer based on the marginal valuation matrix to all the com-puting nodes. Each computing node will respond to this offerwith its current task demand by evaluating its utility function.If the total demand from all the computing nodes exceeds thetask supply number, the price will drop off and the next roundstarts. Gradually as all computing nodes drop their demand thefinal market equilibrium is formed at the point where demandequals to supply. The unique existence of equilibrium is guar-anteed according to prior research work [Debreu, 1959]. At theend of the auction each bidder pays for its winning bundle. In-stead of paying with the final market clearing price, each bidderkeeps track of a reserved price vector. At each round when thedemand from all the other opponents decline down below thesupply number, then the current computing node is ensured towin at least the difference of market supply and cumulative de-mands from its opponents. This part is payed at current roundprice and is cumulated into final payments. Such non-linearpayment strategy is used against strategic bidding which mightdestroy the overall market equilibrium.
4.3 Utility-based sensor selection
We define the node and system utility as follows.Node utility. Based on the data quality, communication cost
to transmit the data to a cluster head, and energy residual in asensor node i, we define the node utility µi as below,
µi = αφ(Zi)− βϑ(j, i) + χε(i) (1)
where φ(Zi) is the information utility of node i; vartheta(j, i)represents the communication cost between the leader node jand i; ε(i) reflects the current energy level in node i.
System utility. We further define the system utility µs(t) atthe time t as a combined utility of all sensor nodes in a systemor a cluster, given by,
µs(t) =N∑
i=1
µi(t) (2)
The system utility reflects the system state at time t. For a spe-cific task, a set of thresholds and corresponding values of α,β and χ are predefined. For example, if the value of µs(t) issmall or below a certain threshold, which indicates that the en-ergy of the local cluster decreases, should be assigned a largervalue compared to and . In this case, the leader node will tendto select the nodes with more energy.
A cluster head selects a slave node to accomplish the sensingtask according to the best node utility µi among all slave nodesusing certain α, β and χ values. To further maximize the overallsystem utility, the three weighted parameters will be adjusted toadapt to current system states. We propose to study the effectsof node utility and system utility on various properties of sensornetworks and tasking performance.
The utility-based sensor node selection method has beenadopted by our PMTracking algorithm for energy-efficient tar-get tracking in large scale sensor networks. In PMTracking al-gorithm, the deployed wireless sensor network is modeled asa Markov chain; targets traveling from one location to another
6
is considered as state transition in this Markov chain model. Tocapture the moving trajectory and predict the next possible loca-tion of a randomly moving target, a n× n transition matrix P isused. Each element in P represents a state in this Markov chain,that is a sensor in the network. Its value indicates the possibilitywith which the target will enter this state in the next time inter-val. To increase tracking accuracy, signal strength gain (SSG)is defined for each sensor to measure that whether a target is ap-proaching this sensor or not. Based on the information definedabove, the node quality is then calculated, which correspond toφ(Zi) in 1. Combined with energy residual of a sensor nodeand communication cost, the node utility is then evaluated.
In PMTracking, we assume a powerful sink in the system,which can calculate node utilities each time based on the in-formation updated by sensors in the network. When a target isdetected, the sink node will select three sensors with the highestnode utilities as tracking node, activate them, and estimated thetarget location based on their reported data.
The system utility is considered in dynamic PMTrackingscheme to adjust system behavior based on its current status.When the energy level of the whole system drops below a cer-tain threshold,the value of β used in 1 increases, thus the PM-Tracking algorithm will become more conservative in energyusage.
In implementation, LQI (link quality indicator) can be usedas a measurement of communication cost between sensors. LQIis implemented by IEEE 802.15.4, and used in ChipCon2420transceiver. Most recent sensor modules, including Tmotesky/Telos, micaz, and Intel Mote, have adopted this indicator.
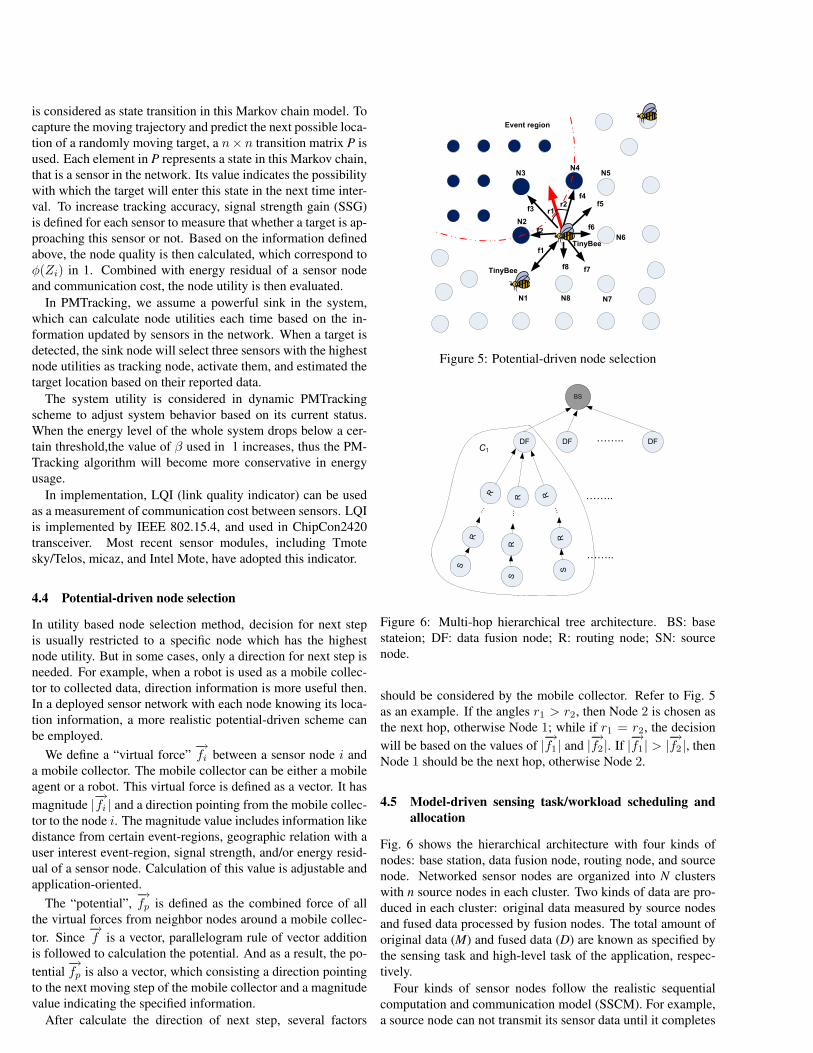
4.4 Potential-driven node selection
In utility based node selection method, decision for next stepis usually restricted to a specific node which has the highestnode utility. But in some cases, only a direction for next step isneeded. For example, when a robot is used as a mobile collec-tor to collected data, direction information is more useful then.In a deployed sensor network with each node knowing its loca-tion information, a more realistic potential-driven scheme canbe employed.
We define a “virtual force”−→fi between a sensor node i and
a mobile collector. The mobile collector can be either a mobileagent or a robot. This virtual force is defined as a vector. It hasmagnitude |−→fi | and a direction pointing from the mobile collec-tor to the node i. The magnitude value includes information likedistance from certain event-regions, geographic relation with auser interest event-region, signal strength, and/or energy resid-ual of a sensor node. Calculation of this value is adjustable andapplication-oriented.
The “potential”,−→fp is defined as the combined force of all
the virtual forces from neighbor nodes around a mobile collec-tor. Since
−→f is a vector, parallelogram rule of vector addition
is followed to calculation the potential. And as a result, the po-tential
−→fp is also a vector, which consisting a direction pointing
to the next moving step of the mobile collector and a magnitudevalue indicating the specified information.
After calculate the direction of next step, several factors
TinyBee
Event region
N2
N3N4
N5
N6
N7N8N1
f3
f2
f1
f8 f7
f6
f5f4
r1r2
TinyBee
Figure 5: Potential-driven node selection
BS
DF DF DF……..
……..
S
R
R
...
SR
R
...
SR
R...
……..
C1
Figure 6: Multi-hop hierarchical tree architecture. BS: basestateion; DF: data fusion node; R: routing node; SN: sourcenode.
should be considered by the mobile collector. Refer to Fig. 5as an example. If the angles r1 > r2, then Node 2 is chosen asthe next hop, otherwise Node 1; while if r1 = r2, the decisionwill be based on the values of |−→f1| and |−→f2|. If |−→f1| > |−→f2|, thenNode 1 should be the next hop, otherwise Node 2.
4.5 Model-driven sensing task/workload scheduling andallocation
Fig. 6 shows the hierarchical architecture with four kinds ofnodes: base station, data fusion node, routing node, and sourcenode. Networked sensor nodes are organized into N clusterswith n source nodes in each cluster. Two kinds of data are pro-duced in each cluster: original data measured by source nodesand fused data processed by fusion nodes. The total amount oforiginal data (M) and fused data (D) are known as specified bythe sensing task and high-level task of the application, respec-tively.
Four kinds of sensor nodes follow the realistic sequentialcomputation and communication model (SSCM). For example,a source node can not transmit its sensor data until it completes
7
the measuring task; a fusion node must perform processing dataafter all source nodes have reported their data. SSCM alsomeans that at one time the data fusion node (base station node)receives data from one source node (one data fusion node). Toformulate the scheduling models, we assume that measuring,communication, and processing time are compound measures,including all possible packet loss, synchronization overheads,and other uncertain factors.
Due to space limit, we only describe the basic schedul-ing strategies in multi-hop hierarchical sensor networks. Formore details, please refer to our previous work [Li and Cao,2008]. The hierarchical scheduling strategy includes intra-cluster scheduling and inter-cluster scheduling.
One data fusion node and a set of routing nodes and sourcenodes constitute a working cluster, where each source nodeis able to communicate with the fusion node through routingnodes in a multi-hop manner. To complete certain amount ofsensor readings in minimum finish time, the workload shouldbe allocated to source nodes and scheduled to avoid transmis-sion conflicts and idle time on the fusion node. All source nodesstart to measure data at the same time; once the previous sourcefinishes transmitting data, the other one completes its measur-ing task and starts to transmit its data. Data transmission andthroughput are independent to each branch until they arrive atthe last routing node which is connected to the fusion node. Atthis time, communication should be coordinated to avoid col-lisions. Thus, we define the time from the source node start-ing to sense data until data arrive at the node next to the fusionnode as buffer time. During report time the last routing nodeat each branch sends data to the fusion node. As a result, theproposed timing diagram minimizes the finish time by schedul-ing the measuring time and report time of each source node.Moreover, since the intra-cluster scheduling tries to avoid thetransmission conflicts at the fusion node, energy spent on re-transmission are conserved.
Data fusion nodes perform some aggregation function on thedata collected from in-cluster source nodes. The inter-clusterscheduler decides the amount of workloads to be assigned toeach cluster, using the execution times of aggregation functions,transmission between fusion nodes and the base station, and in-cluster data collection derived in the previous section.
When aggregating data on the fusion node, original data arereduced to a smaller set of values, which aims to fulfill the high-level task of an application. From the perspective view of thewhole sensor network, data fusion nodes can be viewed as in-termediate nodes, which apply some aggregation functions onthe original data.
5 Self-Protection: Key and Trust Management
5.1 ActiveKey: Dynamic Key Management
Key management schemes can be classified into static and dy-namic schemes according to whether keys are pre-distributed
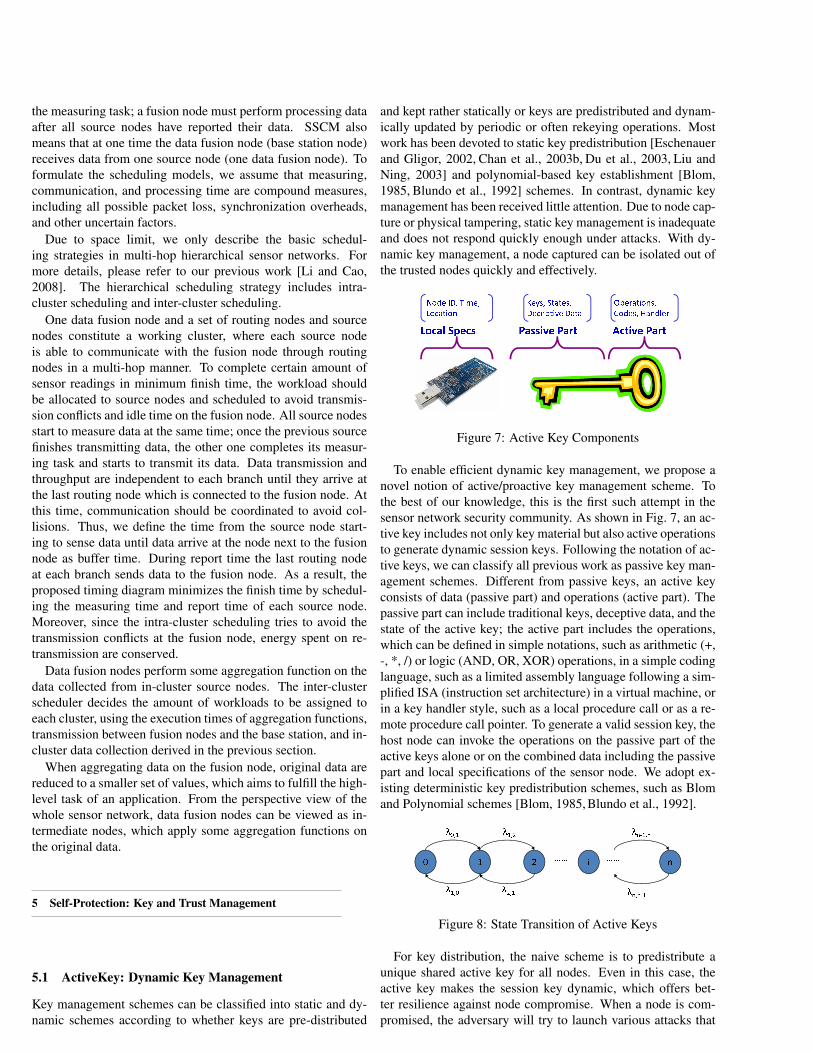
and kept rather statically or keys are predistributed and dynam-ically updated by periodic or often rekeying operations. Mostwork has been devoted to static key predistribution [Eschenauerand Gligor, 2002, Chan et al., 2003b, Du et al., 2003, Liu andNing, 2003] and polynomial-based key establishment [Blom,1985, Blundo et al., 1992] schemes. In contrast, dynamic keymanagement has been received little attention. Due to node cap-ture or physical tampering, static key management is inadequateand does not respond quickly enough under attacks. With dy-namic key management, a node captured can be isolated out ofthe trusted nodes quickly and effectively. ������ ��������� �������� ������� ��� ������������� ��� � !���� �����"��#� ���� $"�%����� �&��� � '���(�%
Figure 7: Active Key Components
To enable efficient dynamic key management, we propose anovel notion of active/proactive key management scheme. Tothe best of our knowledge, this is the first such attempt in thesensor network security community. As shown in Fig. 7, an ac-tive key includes not only key material but also active operationsto generate dynamic session keys. Following the notation of ac-tive keys, we can classify all previous work as passive key man-agement schemes. Different from passive keys, an active keyconsists of data (passive part) and operations (active part). Thepassive part can include traditional keys, deceptive data, and thestate of the active key; the active part includes the operations,which can be defined in simple notations, such as arithmetic (+,-, *, /) or logic (AND, OR, XOR) operations, in a simple codinglanguage, such as a limited assembly language following a sim-plified ISA (instruction set architecture) in a virtual machine, orin a key handler style, such as a local procedure call or as a re-mote procedure call pointer. To generate a valid session key, thehost node can invoke the operations on the passive part of theactive keys alone or on the combined data including the passivepart and local specifications of the sensor node. We adopt ex-isting deterministic key predistribution schemes, such as Blomand Polynomial schemes [Blom, 1985, Blundo et al., 1992].� � � � ��������� ������ ���������� ��
Figure 8: State Transition of Active Keys
For key distribution, the naive scheme is to predistribute aunique shared active key for all nodes. Even in this case, theactive key makes the session key dynamic, which offers bet-ter resilience against node compromise. When a node is com-promised, the adversary will try to launch various attacks that
8
will result in large amount of state transitions in active keys,which can potentially reveal the fact that this node has beencompromised. A better scheme is to adopt existing determinedkey predistribution schemes, such as Blom and Polynomialschemes [Blom, 1985, Blundo et al., 1992]. In this case, dif-ferent from passive keys, active key pool is constructed and asubset of active keys is preloaded in each node. To further en-hance it, we can choose to adapt the random key predistribu-tion schemes for our active key management [Eschenauer andGligor, 2002, Chan et al., 2003b, Du et al., 2003, Liu and Ning,2003].
For key revocation and dynamic update, two options areavailable: centralized schemes [Eschenauer and Gligor, 2002],where the base station makes decisions on which nodes havebeen compromised according to information collected from allnodes and announces a revocation message and new activekeys to correct nodes; and distributed schemes [Chan et al.,2003b, Chan et al., 2003a], where the revocation decisions aremade collaboratively in a local cluster or neighborhood of sus-pected nodes by distributed voting and states inspection of ac-tive keys.
5.2 S3Trust: Robust and Scalable Reputation Manage-ment System
To further protect the sensor grid systems, we propose a repu-tation management system S3Trust. It addresses the dilemmabetween the completeness in reputation calculation and the net-work overload. S3Trust features a H-Trust aggregation schemewhich is inspired by the h-index algorithm [Hirsch, 2005].Leveraging the robustness of the algorithm under incompleteand uncertain circumstances, S3Trust offers a robust reputationevaluation mechanism for both individual and group trusts withminimal communication and computation overheads. S3Trustfurther considers spatial and temporal information to update andadapt trust scores for an individual and groups. S3Trust consistsof the following components: local trust manager, group trustmanager, and distributed trust database. Local trust manager isresponsible for local trust score calculation and trust evaluation.A trust seeker is used for querying, locating of trust data overthe network and also makes the trust inference among peers. Weuse group trust manager to aggregate group reputation. Prelim-inary results are demonstrated in the next section.
6 Experimental Evaluation
The objective of the experiments presented in this section isto evaluate and demonstrate system performance and scalability,and its ability to support wide-area networked sensor networkdeployments of scientific applications. In addition, the perfor-mance and robustness of S3Trust scheme is also demonstrated.
The objective of the experiments presented in this section isto evaluate and demonstrate system performance and scalability,and its ability to support wide-area networked sensor networkdeployments of scientific applications. In addition, the perfor-mance and robustness of S3Trust scheme is also demonstrated.
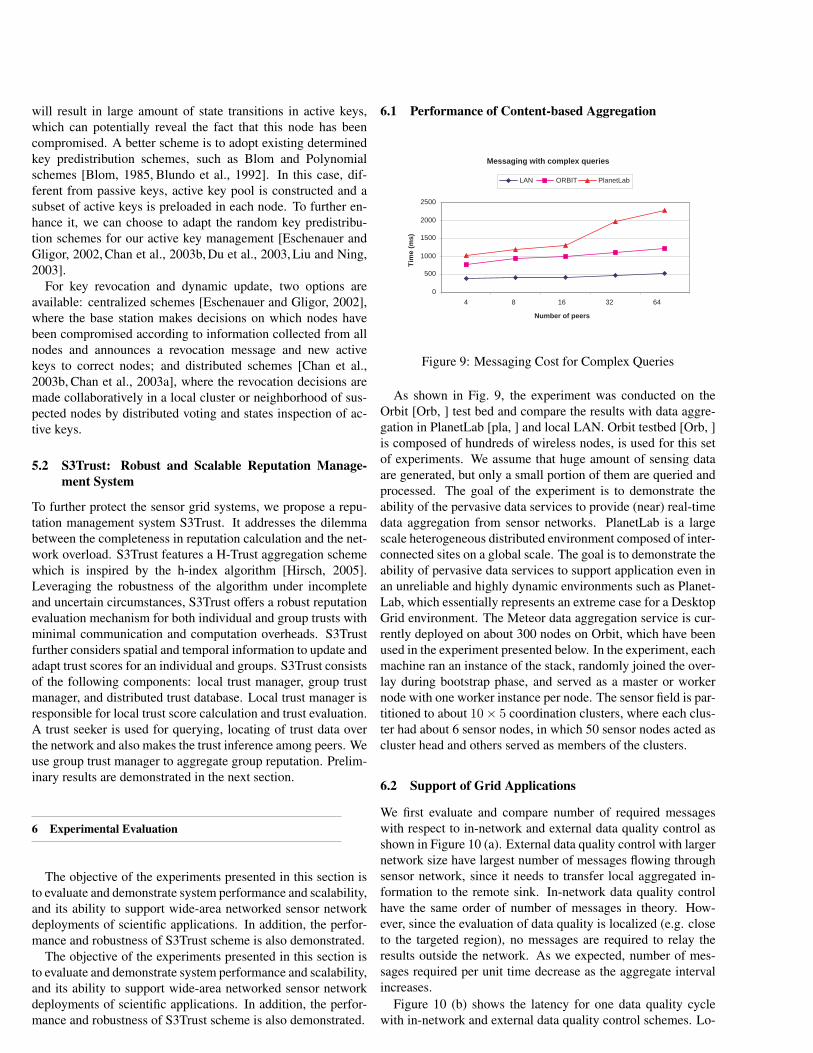
6.1 Performance of Content-based Aggregation
Messaging with complex queries
0
500
1000
1500
2000
2500
4 8 16 32 64
Number of peers
Tim
e (m
s)
LAN ORBIT PlanetLab
Figure 9: Messaging Cost for Complex Queries
As shown in Fig. 9, the experiment was conducted on theOrbit [Orb, ] test bed and compare the results with data aggre-gation in PlanetLab [pla, ] and local LAN. Orbit testbed [Orb, ]is composed of hundreds of wireless nodes, is used for this setof experiments. We assume that huge amount of sensing dataare generated, but only a small portion of them are queried andprocessed. The goal of the experiment is to demonstrate theability of the pervasive data services to provide (near) real-timedata aggregation from sensor networks. PlanetLab is a largescale heterogeneous distributed environment composed of inter-connected sites on a global scale. The goal is to demonstrate theability of pervasive data services to support application even inan unreliable and highly dynamic environments such as Planet-Lab, which essentially represents an extreme case for a DesktopGrid environment. The Meteor data aggregation service is cur-rently deployed on about 300 nodes on Orbit, which have beenused in the experiment presented below. In the experiment, eachmachine ran an instance of the stack, randomly joined the over-lay during bootstrap phase, and served as a master or workernode with one worker instance per node. The sensor field is par-titioned to about 10× 5 coordination clusters, where each clus-ter had about 6 sensor nodes, in which 50 sensor nodes acted ascluster head and others served as members of the clusters.
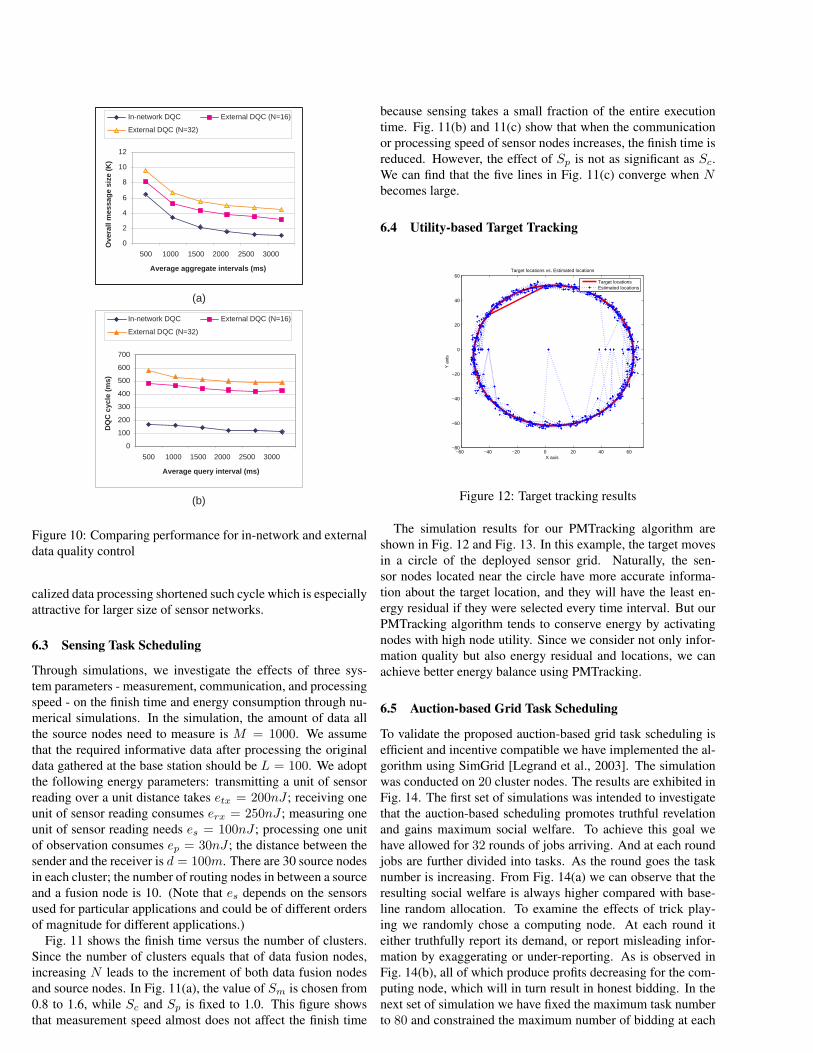
6.2 Support of Grid Applications
We first evaluate and compare number of required messageswith respect to in-network and external data quality control asshown in Figure 10 (a). External data quality control with largernetwork size have largest number of messages flowing throughsensor network, since it needs to transfer local aggregated in-formation to the remote sink. In-network data quality controlhave the same order of number of messages in theory. How-ever, since the evaluation of data quality is localized (e.g. closeto the targeted region), no messages are required to relay theresults outside the network. As we expected, number of mes-sages required per unit time decrease as the aggregate intervalincreases.
Figure 10 (b) shows the latency for one data quality cyclewith in-network and external data quality control schemes. Lo-
9
0
2
4
6
8
10
12
500 1000 1500 2000 2500 3000
Average aggregate intervals (ms)
Ove
rall
mes
sag
e si
ze (
K)
In-network DQC External DQC (N=16)
External DQC (N=32)
(a)
0
100
200
300
400
500
600
700
500 1000 1500 2000 2500 3000
Average query interval (ms)
DQ
C c
ycle
(m
s)
In-network DQC External DQC (N=16)
External DQC (N=32)
(b)
Figure 10: Comparing performance for in-network and externaldata quality control
calized data processing shortened such cycle which is especiallyattractive for larger size of sensor networks.
6.3 Sensing Task Scheduling
Through simulations, we investigate the effects of three sys-tem parameters - measurement, communication, and processingspeed - on the finish time and energy consumption through nu-merical simulations. In the simulation, the amount of data allthe source nodes need to measure is M = 1000. We assumethat the required informative data after processing the originaldata gathered at the base station should be L = 100. We adoptthe following energy parameters: transmitting a unit of sensorreading over a unit distance takes etx = 200nJ ; receiving oneunit of sensor reading consumes erx = 250nJ ; measuring oneunit of sensor reading needs es = 100nJ ; processing one unitof observation consumes ep = 30nJ ; the distance between thesender and the receiver is d = 100m. There are 30 source nodesin each cluster; the number of routing nodes in between a sourceand a fusion node is 10. (Note that es depends on the sensorsused for particular applications and could be of different ordersof magnitude for different applications.)
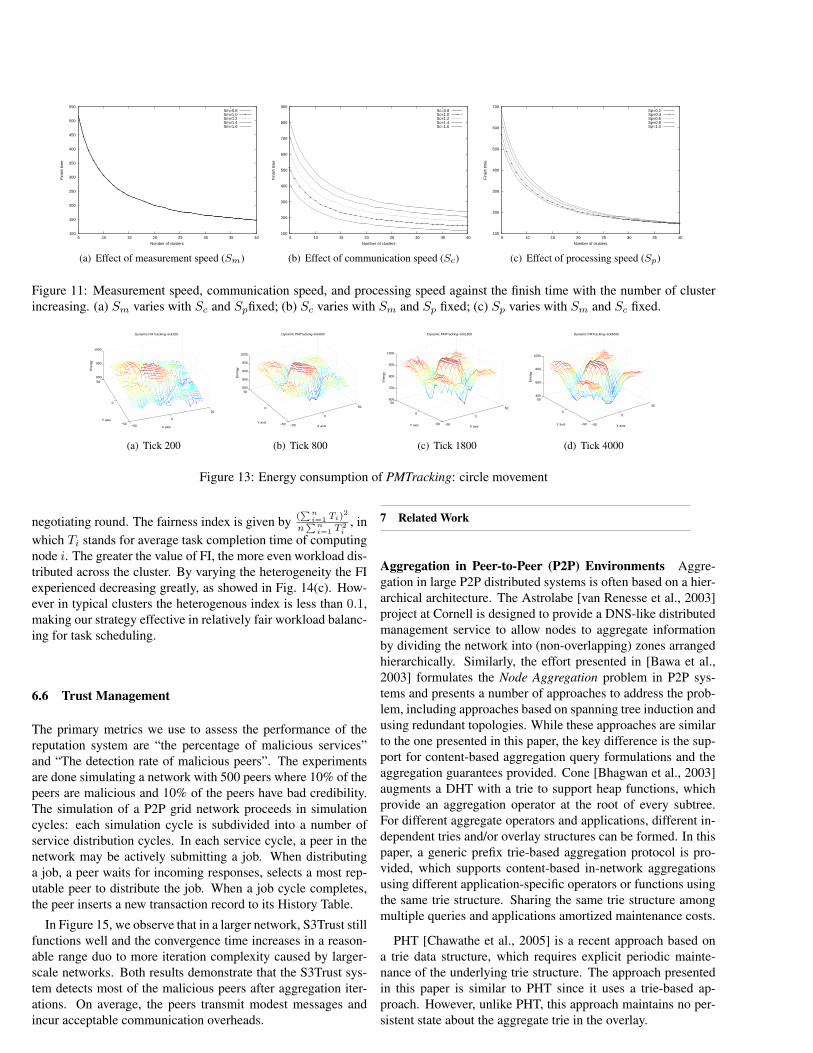
Fig. 11 shows the finish time versus the number of clusters.Since the number of clusters equals that of data fusion nodes,increasing N leads to the increment of both data fusion nodesand source nodes. In Fig. 11(a), the value of Sm is chosen from0.8 to 1.6, while Sc and Sp is fixed to 1.0. This figure showsthat measurement speed almost does not affect the finish time
because sensing takes a small fraction of the entire executiontime. Fig. 11(b) and 11(c) show that when the communicationor processing speed of sensor nodes increases, the finish time isreduced. However, the effect of Sp is not as significant as Sc.We can find that the five lines in Fig. 11(c) converge when Nbecomes large.
6.4 Utility-based Target Tracking
−60 −40 −20 0 20 40 60−80
−60
−40
−20
0
20
40
60
X axis
Y a
xis
Target locations vs. Estimated locations
Target locationsEstimated locations
Figure 12: Target tracking results
The simulation results for our PMTracking algorithm areshown in Fig. 12 and Fig. 13. In this example, the target movesin a circle of the deployed sensor grid. Naturally, the sen-sor nodes located near the circle have more accurate informa-tion about the target location, and they will have the least en-ergy residual if they were selected every time interval. But ourPMTracking algorithm tends to conserve energy by activatingnodes with high node utility. Since we consider not only infor-mation quality but also energy residual and locations, we canachieve better energy balance using PMTracking.
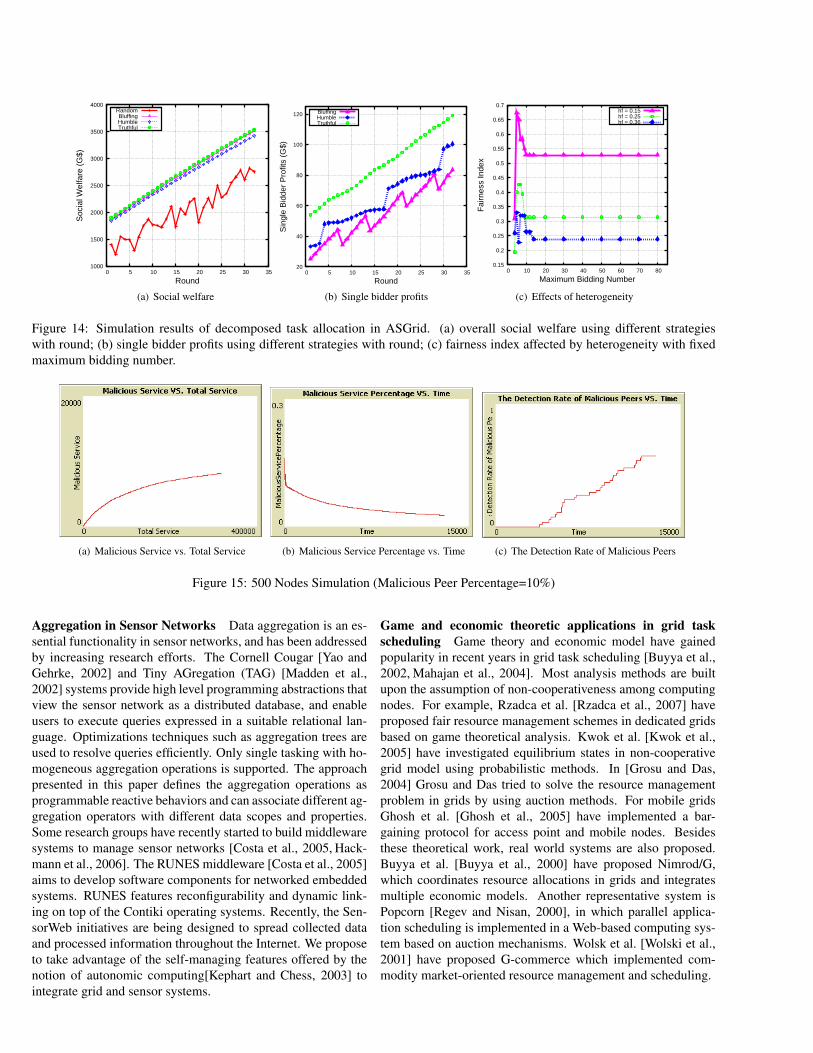
6.5 Auction-based Grid Task Scheduling
To validate the proposed auction-based grid task scheduling isefficient and incentive compatible we have implemented the al-gorithm using SimGrid [Legrand et al., 2003]. The simulationwas conducted on 20 cluster nodes. The results are exhibited inFig. 14. The first set of simulations was intended to investigatethat the auction-based scheduling promotes truthful revelationand gains maximum social welfare. To achieve this goal wehave allowed for 32 rounds of jobs arriving. And at each roundjobs are further divided into tasks. As the round goes the tasknumber is increasing. From Fig. 14(a) we can observe that theresulting social welfare is always higher compared with base-line random allocation. To examine the effects of trick play-ing we randomly chose a computing node. At each round iteither truthfully report its demand, or report misleading infor-mation by exaggerating or under-reporting. As is observed inFig. 14(b), all of which produce profits decreasing for the com-puting node, which will in turn result in honest bidding. In thenext set of simulation we have fixed the maximum task numberto 80 and constrained the maximum number of bidding at each
10
100
150
200
250
300
350
400
450
500
550
5 10 15 20 25 30 35 40
Fin
ish
time
Number of clusters
Sm=0.8Sm=1.0Sm=1.2Sm=1.4Sm=1.6
(a) Effect of measurement speed (Sm)
100
200
300
400
500
600
700
800
900
5 10 15 20 25 30 35 40
Fin
ish
time
Number of clusters
Sc=0.8Sc=1.0Sc=1.2Sc=1.4Sc=1.6
(b) Effect of communication speed (Sc)
100
200
300
400
500
600
700
5 10 15 20 25 30 35 40
Fin
ish
time
Number of clusters
Sp=0.2Sp=0.4Sp=0.6Sp=0.8Sp=1.0
(c) Effect of processing speed (Sp)
Figure 11: Measurement speed, communication speed, and processing speed against the finish time with the number of clusterincreasing. (a) Sm varies with Sc and Spfixed; (b) Sc varies with Sm and Sp fixed; (c) Sp varies with Sm and Sc fixed.
−50
0
50
−50
0
50
900
950
1000
X axis
Dynamic PMTracking−tick200
Y axis
Ene
rgy
(a) Tick 200
−50
0
50
−50
0
50800
850
900
950
1000
X axis
Dynamic PMTracking−tick800
Y axis
Ene
rgy
(b) Tick 800
−50
0
50
−50
0
50600
700
800
900
1000
X axis
Dynamic PMTracking−tick1800
Y axis
Ene
rgy
(c) Tick 1800
−50
0
50
−50
0
50400
600
800
1000
X axis
Dynamic PMTracking−tick4000
Y axis
Ene
rgy
(d) Tick 4000
Figure 13: Energy consumption of PMTracking: circle movement
negotiating round. The fairness index is given by (∑n
i=1 Ti)2
n∑n
i=1 T 2i
, inwhich Ti stands for average task completion time of computingnode i. The greater the value of FI, the more even workload dis-tributed across the cluster. By varying the heterogeneity the FIexperienced decreasing greatly, as showed in Fig. 14(c). How-ever in typical clusters the heterogenous index is less than 0.1,making our strategy effective in relatively fair workload balanc-ing for task scheduling.
6.6 Trust Management
The primary metrics we use to assess the performance of thereputation system are “the percentage of malicious services”and “The detection rate of malicious peers”. The experimentsare done simulating a network with 500 peers where 10% of thepeers are malicious and 10% of the peers have bad credibility.The simulation of a P2P grid network proceeds in simulationcycles: each simulation cycle is subdivided into a number ofservice distribution cycles. In each service cycle, a peer in thenetwork may be actively submitting a job. When distributinga job, a peer waits for incoming responses, selects a most rep-utable peer to distribute the job. When a job cycle completes,the peer inserts a new transaction record to its History Table.
In Figure 15, we observe that in a larger network, S3Trust stillfunctions well and the convergence time increases in a reason-able range duo to more iteration complexity caused by larger-scale networks. Both results demonstrate that the S3Trust sys-tem detects most of the malicious peers after aggregation iter-ations. On average, the peers transmit modest messages andincur acceptable communication overheads.
7 Related Work
Aggregation in Peer-to-Peer (P2P) Environments Aggre-gation in large P2P distributed systems is often based on a hier-archical architecture. The Astrolabe [van Renesse et al., 2003]project at Cornell is designed to provide a DNS-like distributedmanagement service to allow nodes to aggregate informationby dividing the network into (non-overlapping) zones arrangedhierarchically. Similarly, the effort presented in [Bawa et al.,2003] formulates the Node Aggregation problem in P2P sys-tems and presents a number of approaches to address the prob-lem, including approaches based on spanning tree induction andusing redundant topologies. While these approaches are similarto the one presented in this paper, the key difference is the sup-port for content-based aggregation query formulations and theaggregation guarantees provided. Cone [Bhagwan et al., 2003]augments a DHT with a trie to support heap functions, whichprovide an aggregation operator at the root of every subtree.For different aggregate operators and applications, different in-dependent tries and/or overlay structures can be formed. In thispaper, a generic prefix trie-based aggregation protocol is pro-vided, which supports content-based in-network aggregationsusing different application-specific operators or functions usingthe same trie structure. Sharing the same trie structure amongmultiple queries and applications amortized maintenance costs.
PHT [Chawathe et al., 2005] is a recent approach based ona trie data structure, which requires explicit periodic mainte-nance of the underlying trie structure. The approach presentedin this paper is similar to PHT since it uses a trie-based ap-proach. However, unlike PHT, this approach maintains no per-sistent state about the aggregate trie in the overlay.
11
1000
1500
2000
2500
3000
3500
4000
0 5 10 15 20 25 30 35
Soc
ial W
elfa
re (
G$)
Round
RandomBluffingHumbleTruthful
(a) Social welfare
20
40
60
80
100
120
0 5 10 15 20 25 30 35
Sin
gle
Bid
der
Pro
fits
(G$)
Round
BluffingHumbleTruthful
(b) Single bidder profits
0.15
0.2
0.25
0.3
0.35
0.4
0.45
0.5
0.55
0.6
0.65
0.7
0 10 20 30 40 50 60 70 80
Fai
rnes
s In
dex
Maximum Bidding Number
hf = 0.15hf = 0.25hf = 0.36
(c) Effects of heterogeneity
Figure 14: Simulation results of decomposed task allocation in ASGrid. (a) overall social welfare using different strategieswith round; (b) single bidder profits using different strategies with round; (c) fairness index affected by heterogeneity with fixedmaximum bidding number.
(a) Malicious Service vs. Total Service (b) Malicious Service Percentage vs. Time (c) The Detection Rate of Malicious Peers
Figure 15: 500 Nodes Simulation (Malicious Peer Percentage=10%)
Aggregation in Sensor Networks Data aggregation is an es-sential functionality in sensor networks, and has been addressedby increasing research efforts. The Cornell Cougar [Yao andGehrke, 2002] and Tiny AGregation (TAG) [Madden et al.,2002] systems provide high level programming abstractions thatview the sensor network as a distributed database, and enableusers to execute queries expressed in a suitable relational lan-guage. Optimizations techniques such as aggregation trees areused to resolve queries efficiently. Only single tasking with ho-mogeneous aggregation operations is supported. The approachpresented in this paper defines the aggregation operations asprogrammable reactive behaviors and can associate different ag-gregation operators with different data scopes and properties.Some research groups have recently started to build middlewaresystems to manage sensor networks [Costa et al., 2005, Hack-mann et al., 2006]. The RUNES middleware [Costa et al., 2005]aims to develop software components for networked embeddedsystems. RUNES features reconfigurability and dynamic link-ing on top of the Contiki operating systems. Recently, the Sen-sorWeb initiatives are being designed to spread collected dataand processed information throughout the Internet. We proposeto take advantage of the self-managing features offered by thenotion of autonomic computing[Kephart and Chess, 2003] tointegrate grid and sensor systems.
Game and economic theoretic applications in grid taskscheduling Game theory and economic model have gainedpopularity in recent years in grid task scheduling [Buyya et al.,2002, Mahajan et al., 2004]. Most analysis methods are builtupon the assumption of non-cooperativeness among computingnodes. For example, Rzadca et al. [Rzadca et al., 2007] haveproposed fair resource management schemes in dedicated gridsbased on game theoretical analysis. Kwok et al. [Kwok et al.,2005] have investigated equilibrium states in non-cooperativegrid model using probabilistic methods. In [Grosu and Das,2004] Grosu and Das tried to solve the resource managementproblem in grids by using auction methods. For mobile gridsGhosh et al. [Ghosh et al., 2005] have implemented a bar-gaining protocol for access point and mobile nodes. Besidesthese theoretical work, real world systems are also proposed.Buyya et al. [Buyya et al., 2000] have proposed Nimrod/G,which coordinates resource allocations in grids and integratesmultiple economic models. Another representative system isPopcorn [Regev and Nisan, 2000], in which parallel applica-tion scheduling is implemented in a Web-based computing sys-tem based on auction mechanisms. Wolsk et al. [Wolski et al.,2001] have proposed G-commerce which implemented com-modity market-oriented resource management and scheduling.
12
8 Conclusion
We presented a comprehensive autonomic managing frame-work ASGrid for managing hybrid sensor grid systems and ap-plications. The ASGrid framework ushers in a novel conceptof autonomic sensor grid systems. In particularly, we describedself-configuration, self-optimization, and self-protection mech-anisms under the framework. Self-configuration was realizedthrough content-based aggregation. Self-optimization was ful-filled through systematic utility-based resource management,data fusion task scheduling, and auction-based game-theoreticapproach. We then presented security mechanisms: low-leveldynamic key management and high-level trust and reputationmanagement schemes. Experiments and simulations were pre-sented to demonstrate part of the functionalities and perfor-mance of the ASGrid. We will continue our research to realizefull-fledged self-managing hybrid sensor grid systems.
REFERENCES
[Orb, ] Orbit project. http://www.orbit-lab.org/.
[pla, ] Planetlab project. http://www.planet-lab.org/.
[Bawa et al., 2003] Bawa, M., Garcia-Molina, H., Gionis, A.,and Motwani, R. (2003). Estimating aggregates on a peer-to-peer network. Technical Report, Computer Science De-partment, Stanford University.
[Bhagwan et al., 2003] Bhagwan, R., Varghese, G., andVoelker, G. M. (2003). Cone: Augmenting dhts to supportdistributed resource discovery. Technical Report, UCSD,CS2003-0755.
[Blom, 1985] Blom, R. (1985). An optimal class of symmetrickey generation systems. In EUROCRYPT ’84.
[Blundo et al., 1992] Blundo, C., Santis, A. D., Herzberg, A.,Kutten, S., Vaccaro, U., and Yung, M. (1992). Perfectly-secure key distribution for dynamic conferences. In CRYPTO92.
[Buyya et al., 2000] Buyya, R., Abramson, D., and Giddy, J.(2000). Nimrod/G: An architecture of a resource man-agement and scheduling system in a global computationalgrid. In Proceedings of the 4th International Conferenceon High Performance Computing in the Asia-Pacific Region,volume 1, pages 283–289.
[Buyya et al., 2002] Buyya, R., Giddy, J., and Stockinger, H.(2002). Economic models for resource management andscheduling. In The Journal of Concurrency and Computa-tion: Practice and Experience (CCPE), pages 1507–1542.Wiley Press.
[Chan et al., 2003a] Chan, H., Gligor, V. D., Perrig, A., andMuralidharan, G. (2003a). On the distribution and revoca-tion of cryptographic keys in sensor networks. IEEE Trans-actions on Dependable and Secure Computing, 2(3).
[Chan et al., 2003b] Chan, H., Perrig, A., and Song, D.(2003b). Random key predistribution schemes for sensornetworks. In IEEE Security and Privacy Symposim.
[Chawathe et al., 2005] Chawathe, Y., Ramabhadran, S., Rat-nasamy, S., LaMarca, A., Shenker, S., and Hellerstein, J.(2005). A case study in building layered dht applications.Sigcomm 2005.
[Costa et al., 2005] Costa, P., Coulson, G., Mascolo, C., Picco,G., and Zachariadis, S. (2005). The runes middleware: A re-configurable componentbased approach to network embed-ded systems. In PIMRC’05. IEEE.
[Debreu, 1959] Debreu, G. (1959). Theory of Value: an Ax-iomatic Analysis of Economic Equilibrium. John Wiley andSons, New York.
[Du et al., 2003] Du, W., Deng, J., Han, Y., and Varshney, P.(2003). A pairwise key pre-distribution scheme for wirelesssensor networks. In ACM CCS’03.
[Eschenauer and Gligor, 2002] Eschenauer, L. and Gligor, V.(2002). A key management scheme for distributed sensornetworks. In ACM CCS’02.
[Ghosh et al., 2005] Ghosh, P., Roy, N., Das, S. K., and Basu,K. (2005). A pricing strategy for job allocation in mo-bile grids using a non-cooperative bargaining theory frame-work. Journal of Parallel and Distributed Computing,65(11):1366–1383.
[Grosu and Das, 2004] Grosu, D. and Das, A. (2004). Auction-based resource allocation protocols in grids. In Proceedingsof the 16th International Conference on Parallel and Dis-tributed Computing and Systems.
[Hackmann et al., 2006] Hackmann, G., Fok, C.-L., Roman,G.-C., and Lu, C. (2006). Agimone: Middleware support forseamless integration of sensor and ip networks. DCOSS’06.
[Hirsch, 2005] Hirsch, J. E. (2005). An index to quantify anindividual’s scientific research output. Proceedings of theNational Academy of Sciences.
[Jiang et al., 2004] Jiang, N., Schmidt, C., Matossian, V., andParashar, M. (2004). Content-based middleware for decou-pled interactions in pervasive environments. Technical Re-port Number 252, Wireless Information Network Laboratory(WINLAB), Rutgers University.
[Kephart and Chess, 2003] Kephart, J. O. and Chess, D. M.(2003). The vision of autonomic computing. IEEE Com-puter, 36:41–50.
13
[Kottapalli et al., 2003] Kottapalli, V. A., Kiremidjiana, A. S.,Lyncha, J. P., Carryerb, E., Kennyb, T. W., and amd Ying Lei,K. H. L. (2003). Two-tiered wireless sensor network archi-tecture for structural health monitoring. SPIE’s 10th AnnualInternational Symposium on Smart Structures and Materi-als,.
[Kwok et al., 2005] Kwok, Y.-K., Song, S., and Hwang, K.(2005). Selfish grid computing: game-theoretic modelingand NAS performance results. In CCGRID, pages 1143–1150.
[Legrand et al., 2003] Legrand, A., Marchal, L., and Casanova,H. (May, 2003). Scheduling distributed applications: Thesimgrid simulation framework. In the 3rd IEEE/ACM In-ternational Symposium on Cluster Computing and the Grid(CCGrid2003), Tokyo, Japan. IEEE Computer Society Press.
[Li and Cao, 2008] Li, X. and Cao, J. (2008). Coordinatedworkload scheduling in hierarchical sensor networks for datafusion applications. Journal of Computer Science and Tech-nology, Springer, 23(3).
[Liu and Ning, 2003] Liu, D. and Ning, P. (2003). Establish-ing pairwise keys in distributed sensor networks. In ACMCCS’03.
[Madden et al., 2002] Madden, S., Franklin, M. J., Hellerstein,J. M., and Hong, W. (2002). Tag: a tiny aggregation servicefor ad-hoc sensor networks. in Proceedins of the USENIXSymposium on Operating Systems Design and Implementa-tion.
[Madden et al., 2003] Madden, S., Hellerstein, J., and Hong,W. (2003). TinyDB: In-network query processing in tinyOS,version 0.4. madden,[email protected], [email protected].
[Mahajan et al., 2004] Mahajan, R., Rodrig, M., Wetherall, D.,and Zahorjan, J. (2004). Experiences applying game theoryto system design. In PINS ’04: Proceedings of the ACMSIGCOMM workshop on Practice and theory of incentivesin networked systems, pages 183–190.
[Mainwaring et al., 2002] Mainwaring, A., Polastre, J.,Szewczyk, R., Culler, D., and Anderson, J. (2002). Wirelesssensor networks for habitat monitoring. WSNA’02, Atlanta,Georgia, September 2002.
[Parashar et al., 2006] Parashar, M., Matossian, V., Klie, H.,Thomas, S. G., Wheeler, M. F., Kurc, T., Saltz, J., and Ver-steeg, R. (2006). Towards dynamic data-driven managementof the ruby golch waste repository. ICCS 2006.
[Regev and Nisan, 2000] Regev, O. and Nisan, N. (2000). ThePOPCORN market. online markets for computational re-sources. Decision Support Systems, 28(1-2):177–189.
[Rzadca et al., 2007] Rzadca, K., Trystram, D., andWierzbicki, A. (2007). Fair game-theoretic resourcemanagement in dedicated grids. In CCGRID, pages343–350.
[Szlavecz et al., 2006] Szlavecz, K., Terzis, A., Musaloiu-E.,R., Cogan, J., Small, S., Ozer, S., Burns, R., Gray, J., andSzalay, A. S. (2006). Life under your feet: An end-to-endsoil ecology sensor network, database, web server, and anal-ysis service. MSR-TR-2006-90.
[van Renesse et al., 2003] van Renesse, R., Birman, K. P., andVogels, W. (2003). Astrolabe: A robust and scalable tech-nology for distributed system monitoring, management, anddata mining. ACM Transactions on Computer Systems,21(2).
[Werner-Allen et al., 2005] Werner-Allen, G., Lorincz, K.,Ruiz, M., Marcillo, O., Johnson, J., Lees, J., and Welsh, M.(2005). Monitoring volcanic eruptions with a wireless sen-sor network. Second European Workshop on Wireless SensorNetworks.
[Wolski et al., 2001] Wolski, R., Plank, J. S., Brevik, J., andBryan, T. (2001). G-commerce: Market formulations con-trolling resource allocation on the computational grid. InProceedings of the 15th International Parallel & DistributedProcessing Symposium (IPDPS), pages 46–53.
[Yao and Gehrke, 2002] Yao, Y. and Gehrke, J. E. (2002). Thecougar approach to in-network query processing in sensornetworks. Sigmod Record, 31(3).
14