modelling and optimization of an off-grid hybrid power
TRANSCRIPT

Modelling and Optimization of an Off-Grid Hybrid Power System for
Supplying Unmanned Offshore Installations in Eastern Malaysia
by
Moustafa Ahmed Moustafa Mansour
15816
Dissertation submitted in partial fulfillment of
the requirements for the
Bachelor of Engineering (Hons)
(Electrical and Electronics)
JANUARY 2015
Universiti Teknologi PETRONAS
Bandar Seri Iskandar
32610 Tronoh
Perak Darul Ridzuan

i
CERTIFICATION OF APPROVAL
Modelling and Optimization of an Off-grid Hybrid Power System for Supplying
Unmanned Offshore Installations in Eastern Malaysia
by
Moustafa Ahmed Moustafa Mansour
15816
A project dissertation submitted to the
Electrical & Electronics Engineering Programme
Universiti Teknologi PETRONAS
in partial fulfilment of the requirement for the
BACHELOR OF ENGINEERING (Hons)
(ELECTRICAL AND ELETRONICS)
Approved by,
_____________________
(Ir Mohd Faris bin Abdullah)
UNIVERSITI TEKNOLOGI PETRONAS
TRONOH, PERAK
January 2015

ii
CERTIFICATION OF ORIGINALITY
This is to certify that I am responsible for the work submitted in this project, that the
original work is my own except as specified in the references and acknowledgements,
and that the original work contained herein have not been undertaken or done by
unspecified sources or persons.
_____________________________
Moustafa Ahmed Moustafa Mansour

iii
ABSTRACT
In this project, investigation about the potential utilization of hybrid power system in
the Malaysian offshore environment is examined. An unmanned offshore installation
was selected for the study. The solar and wind energy potentials in Malaysia were
investigated and the feasibility study of the project was proved by using meteorological
data from the project location at Southeast China Sea. In addition to that, the
installation power demand was estimated based on the load profile from Cutter
Platform, World first unmanned offshore platform to be operated totally by renewable
energy in the North Sea. Moreover, a hybrid power system topology was proposed to
supply the loads on-board the offshore installation. Likewise, modelling and
simulation of the hybrid power system was achieved using Matlab/Simulink
environment. Finally, the optimization study was implemented to achieve the optimum
design for the hybrid power system taking the cost reduction as the main objective
function for the study. The results showed a great potential towards utilizing hybrid
power systems in the Malaysian environment considering the highly solar irradiation
levels in Malaysia. Also, the optimization study concluded that fuel consumption and
fuel price are the most crucial parts in determining the cost effectiveness of a hybrid
power system.

iv
ACKNOWLEDGEMENT
With all the unexplored challenges waiting for me prior to the completion of my final
year project, I am forever thankful to my beloved parents, who have given me the
never-ending support to ensure that I have the courage and perseverance to go through
difficulties and obstacles. I would like to dedicate this bachelor thesis to my much-
loved parents my father and my mother who have been the source of motivation,
passion, and greatness in my life.
My upmost gratitude is also addressed to those people who have helped me during the
project. These include, generally, the staff of Electrical and Electronics Engineering
department at Petronas University of Technology (UTP) for their kindness support and
guidance during the project.
I would like to express a million thanks to my dearest Supervisor, Ir. Mohd Faris bin
Abdullah for dedicating his time and effort towards the success of my final year
project. His guidance, specifically, includes the completion of this project report.
Without all of the names I have stated above, final year project (FYP) report would
not be completed with full satisfaction and on time.

v
TABLE OF CONTENTS
CERTIFICATION OF APPROVAL ............................................................................ i
CERTIFICATION OF ORIGINALITY ...................................................................... ii
ABSTRACT ................................................................................................................ iii
ACKNOWLEDGEMENT .......................................................................................... iv
TABLE OF CONTENTS ............................................................................................. v
LIST OF FIGURES ................................................................................................... vii
LIST OF TABLES ...................................................................................................... ix
CHAPTER 1 : INTRODUCTION ............................................................................... 1
1.1 Project Background .................................................................................................. 1
1.2 Problem Statement ................................................................................................... 2
1.3 Objectives ................................................................................................................ 2
1.4 Scope of Study ......................................................................................................... 3
CHAPTER 2 : LITERATURE REVIEW .................................................................... 4
2.1 Oil and Gas Development in Malaysia .................................................................... 4
2.2 Hybrid Power Systems ............................................................................................. 5
2.2.1 Solar Photovoltaic Cell .................................................................................... 6
2.2.2 Wind Turbines.................................................................................................. 8
2.2.3 Diesel Generator ............................................................................................ 11
2.2.4 Energy Storage System (Battery System) ...................................................... 13
2.3 Solar and wind energy potentials in Malaysia ....................................................... 13
2.3.1 Solar Energy Potential Analysis in Malaysia ................................................. 13
2.3.2 Wind Energy Potential Analysis in Malaysia ................................................ 15
CHAPTER 3 : RESEARCH METHODOLOGY ...................................................... 18
3.1 Unmanned Installation Power Demand ................................................................. 18
3.2 Solar Photovoltaic Module..................................................................................... 19
3.2.1 DC-DC Buck Convertor ................................................................................. 21
3.2.2 Maximum Power Point Tracking (MPPT) Algorithm ................................... 22
3.2.3 Proportional Integral (PI) Controller .............................................................. 23
3.2.4 Solar Photovoltaic Simulation Modules ......................................................... 24
3.3 Wind Turbine Module ............................................................................................ 26
3.3.1 Wind Turbine Rotor Blades ........................................................................... 26

vi
3.3.2 Mechanical Drivetrain .................................................................................... 27
3.3.3 Permanent Magnet Synchronous Generator ................................................... 29
3.4 Diesel Generator .................................................................................................... 30
3.4.1 Diesel Engine and Prime Mover .................................................................... 31
3.4.2 Synchronous Generator .................................................................................. 32
3.4.3 Excitation System and Automatic Voltage Regulator.................................... 34
3.5 Energy Storage and Control Strategy ..................................................................... 35
3.5.1 Power Management System ........................................................................... 35
3.5.2 Controller Input and Output data ................................................................... 35
3.6 Optimization Study ................................................................................................ 36
3.6.1 The proposed optimization technique ............................................................ 37
3.6.2 Cost objective function .................................................................................. 37
3.7 Key Milestone ........................................................................................................ 41
3.8 Gantt Chart ............................................................................................................. 42
CHAPTER 4 : RESULTS AND DISCUSSION ........................................................ 43
4.1 Hybrid System Feasibility Study ........................................................................... 43
4.2 Solar Photovoltaic Models ..................................................................................... 45
4.2.1 The First Model .............................................................................................. 45
4.2.2 The Second Model ......................................................................................... 47
4.2.3 The Third Model-Buck Convertor and MPPT Controller .............................. 48
4.3 Wind Turbine Model .............................................................................................. 51
4.3.1 Wind Turbine Rotor Blades Aeronautics Block ............................................ 52
4.3.2 Two-mass Mechanical Drivetrain Block ....................................................... 53
4.3.3 Permanent Magnet Synchronous Generator Block ........................................ 53
4.3.4 Universal Bridge (Rectifier Circuit) Block .................................................... 54
4.3.5 Voltage Regulator Circuit Block .................................................................... 55
4.4 Diesel Generator .................................................................................................... 56
4.5 Optimization Study ................................................................................................ 60
CHAPTER 5 : CONCLUSION AND RECOMMENDATIONS .............................. 68
REFERENCES ........................................................................................................... 69

vii
LIST OF FIGURES
Figure 1 P-N junction operation in a solar cell [6]....................................................... 7
Figure 2 General I-V characteristics graph for a solar cell [9] .................................... 8
Figure 3 Vertical axis and horizontal axis wind turbines [15] ..................................... 9
Figure 4 Internal structure of a horizontal axis wind turbines [16] ........................... 10
Figure 5 Diesel generator topology and interconnections.......................................... 12
Figure 6 World daily solar radiation map [27]........................................................... 14
Figure 7 Annual average daily global solar irradiation in Malaysia [28] .................. 14
Figure 8 Selected locations for potential wind energy ............................................... 17
Figure 9 Research methodology ................................................................................ 18
Figure 10 Solar cell electrical model [9] .................................................................... 19
Figure 11 DC-DC buck convertor .............................................................................. 21
Figure 12 Fractional open-circuit voltage MPPT algorithm flowchart ...................... 23
Figure 13 Wind turbine mechanical drivetrain model [35] ........................................ 27
Figure 14 Permanent magnet synchronous generator model ..................................... 29
Figure 15 Prime mover Simulink model .................................................................... 31
Figure 16 Synchronous generator electrical model .................................................... 33
Figure 17 Synchronous generator d-q equations ........................................................ 33
Figure 18 Diesel generator AVR and excitation system model ................................. 35
Figure 19 the general flowchart of the optimization model ....................................... 36
Figure 20 Hybrid power system model in HOMER software.................................... 37
Figure 21 Project location map (Southeast China sea) .............................................. 43
Figure 22 Temperature profile at Southeast China sea .............................................. 44
Figure 23 Hours of daylight-solar irradiation at Southeast China sea ....................... 44
Figure 24 Solar irradiation and wind speed profiles at Southeast China sea ............. 45
Figure 25 The First solar photovoltaic model ............................................................ 46
Figure 26 I-V curve with fixed operating temperature and different irradiation ....... 46
Figure 27 I-V curve with fixed irradiation and different operating temperatures...... 47
Figure 28 The second model for a single solar photovolrtaic module ....................... 47
Figure 29 Power, current, and voltage output values for the second model .............. 48
Figure 30 The third model with buck convertor and controller ................................. 48
Figure 31 Solar photovoltaic system schematics ....................................................... 49
Figure 32 Fractional open-circuit voltage MPPT algorithm ...................................... 49

viii
Figure 33 Buck convertor Simulation blocks............................................................. 50
Figure 35 Input-output values for the buck convertor ............................................... 51
Figure 36 Wind turbine model ................................................................................... 52
Figure 37 Internal structure of the wind turbine model ............................................. 52
Figure 38 Wind turbine power characteristics (pitch angle = 0) ................................ 53
Figure 39 Two-mass mechanical drivetrain model .................................................... 53
Figure 40 Permanent magnet synchronous generator output values .......................... 54
Figure 41 The Rectified values of synchrnous generator output values .................... 54
Figure 42 Wind turbine voltage regulator block ........................................................ 55
Figure 43 Regulated values of the wind turbine model ............................................. 56
Figure 44 Diesel generator Simulink model .............................................................. 57
Figure 45 Mechanical vs electrical output power of the diesel generator .................. 57
Figure 46 Reference voltage (Vref) vs field voltage (Vf) for the synchronous generator
.................................................................................................................................... 58
Figure 47 Reference speed (Wref) vs adjusted speed (Wm)...................................... 58
Figure 48 Synchronous Generator Output Voltage .................................................... 59
Figure 49 Optimization model results ........................................................................ 62
Figure 50 Optimal hybrid power system components ............................................... 63
Figure 51 Hybrid system electrical performance ....................................................... 64
Figure 52 Solar photovoltaic module performance .................................................... 64
Figure 53 Diesel generator electrical performance .................................................... 65
Figure 54 Battery electrical performance ................................................................... 65
Figure 55 Renewable fraction vs Diesel generator production .................................. 66
Figure 56 Total capital cost of the system vs total electrical production ................... 67
Figure 57 Annual operation and maintenance cost vs total production ..................... 67

ix
LIST OF TABLES
Table 1 Calculated parameters for the first PV model ............................................... 25
Table 2 Prime mover controller and actuator parameters .......................................... 32
Table 3 Stator parameters in (Pu) representation ....................................................... 33
Table 4 Rotor parameters in (Pu) representation ....................................................... 34
Table 5 Synchronous generator parameters ............................................................... 34
Table 6 Buck convertor parameters ........................................................................... 50
Table 7 Solar PV optimization parameters ................................................................ 60
Table 8 Wind turbine optimization parameters .......................................................... 61
Table 9 Diesel generator optimization parameters..................................................... 61
Table 10 Battery and convertor optimization parameters .......................................... 62
Table 11 Project cash flow summary ......................................................................... 63

1
CHAPTER 1 : INTRODUCTION
1.1 Project Background
In Malaysia, oil and gas industry has proven to be one of the most successful and
emerging industries and the main pillar for Malaysia economic growth during the last
twenty five years. The exploration and drilling operations have extended not only on
the onshore scope but also on the offshore scope as well. The higher demand for energy
to serve the uprising economy in Malaysia as well as other Southeast Asian countries
has opened numerous opportunities for investments in the oil and gas industry.
The offshore explorations in Malaysia resulted in a promising future for the oil and
gas reserves in Malaysia especially in the eastern part of Malaysia where all the major
offshore operations take place. Initially, the offshore operation depended mainly on
human workforce to operate, maintain, and monitor the process flow. Therefore, the
cost for offshore operation increased rapidly due to the total dependence on manned
installations.
Unmanned offshore installations have been implemented in the early 1980 in the
offshore environment to reduce the operation and maintenance costs. In addition to
that, unmanned installations were designed to operate effectively and precisely without
the human interference which only exist to monitor and check the operation statistics.
Supplying the unmanned installations with a reliable power source represented a huge
challenge for the industry. Non-conventional power sources such as diesel generators
and gas turbines are mainly used for supplying different loads and instrumentation
devices.
However, during the unfavorable climatic conditions such as storms, monsoon, the
generators and gas turbines showed a poor performance and have caused a regular
power shortage on the electrical systems in the unmanned installations. Moreover, the
climatic conditions in the offshore environment during the monsoon and stormy times
usually obstruct the maintenance teams from fixing the occurred faults in the required
time. Hence, the process could shut down for days till the process flow is restored
completely.
Hybrid systems were introduced in the new era as an effective solution to provide off-
grid and remote areas with clean and cheap power supply. A hybrid system is usually
composed of two or three different conventional power sources such as solar energy
2
and wind energy. The development of technology has resulted in better performance
and efficiency for the hybrid systems especially after introducing power converters,
advanced (PV) systems and micro-wind turbines. Hybrid systems are being
implemented nowadays to serve remote residential villages, off-grid small industrial
areas and off-grid offshore installations which do not require an excessive generation
capability.
1.2 Problem Statement
The unmanned installations represent a promising and cost effective future for the oil
and gas offshore operations not only in Malaysia but also all over the world. Remote
monitoring is the main key issue in the operation of unmanned offshore installations.
Constant and persistent monitoring requires that the power system should be efficient,
well-designed, commissioned according to the international standards and capable of
operating in an immense and different range of conditions. Supplying unmanned
installations with a reliable and well-founded power system will improve the process
flow. Moreover, an efficient power system will reduce and minimize the faults and
malfunctions occur as a result of the main dependence of the non-conventional power
sources. Besides, implementing a power system which have conventional and non-
conventional sources will maximize the reliability and performance of the system
regardless of the poor maintenance or the unpredictable climatic conditions.
1.3 Objectives
To conduct a theoretical and literature study about micro-grid hybrid power
system in the offshore environment.
To propose a design of an offshore micro-grid power system based on the
theoretical studies.
To model and simulate the power system components in order to obtain input
data to the optimization model.
To optimize the components of the power system based on the objective
function of minimizing the cost of the power system components through the
lifespan of the system.

3
1.4 Scope of Study
The project scope of study is to conduct a literature study about unmanned offshore
installations. Then, the project feasibility will be examined using the meteorological
data of the project location. After that, hybrid power systems will be analyzed and
studied. Also, previous and ongoing research studies about implementing hybrid
systems with conventional and non-conventional power sources will be reviewed.
Then, analysis, modelling, simulation and optimization of the project will be carried
out in order to achieve the study objectives. Finally, the optimization study will be
implemented to achieve the optimum design for the hybrid system by using a cost
effectiveness approach.

4
CHAPTER 2 : LITERATURE REVIEW
2.1 Oil and Gas Development in Malaysia
Malaysia is in the middle of a rapid economic growth started on 1980 and is expected
to reach its peak on 2020 when Malaysia become a fully industrialized country. Oil
and gas industry in Malaysia plays an important role in the country economy. The
country has enormous energy resources with sufficient amounts such as the
recoverable hydrocarbons reserves which estimated at 4.5 billion barrels of oil and 68
TCF of natural gas. Throughout the past century, the country mainly relied on four
main energy sources (oil, natural gas, hydropower and coal), with an increasing
dependence on oil and natural gas reserves [1].
The first commercial oil and gas development in Malaysia dated back to 1910 when
the Sarawak Shell company (formed by Anglo-Saxon Petroleum Company) developed
the Miri oil field in Sarawak. Starting with an 83 barrels per day 83 years ago, the oil
and gas industry in Malaysia has emerged toward endless possibilities and
opportunities and has grown to be a multi-billion dollar industry. The industry
underwent a dramatic expansion with rapid intensification in exploration and
development [2].
The majority of Malaysia recoverable hydrocarbon resources are located in the
offshore part of Malaysia. Offshore oil field development requires special
consideration during the exploration, appraisal, field development, and project
implementation and field production phases. The scope of work and capital
expenditure is generally greater for an offshore field development [2].
The development cost for offshore oil fields using all manned installations require a
capital investment of millions of dollars. Moreover, the operation and maintenance
costs will be much higher due to the existence of human factor. By comparison, the
use of unmanned offshore installations would save a lot of resources, capital
investments, and will reduce the operation and maintenance costs [3].
Based on a previous research study carried out by ESSO Malaysia for one of the
company offshore fields Guntong A, the field development with all manned
installation would have required a capital investment of US$440 million, an annual
operating costs of US$27 million, and a total number of 224 personnel for operation
and maintenance purposes. By comparison with the utilization of unmanned

5
installations, the capital investment cost for the development of the offshore field while
using unmanned installations would have been about US$300 million, US$20 million
for the annual operating costs, and a crew of 124 personnel for operation and
maintenance purposes [3].
Unmanned offshore installations can provide economic benefits and savings for the
development of offshore oil and gas fields. The use of the unmanned installations has
resulted in significant reduction in capital investments and in annual operation and
maintenance costs. The early generations of unmanned offshore installations provided
operating experience and paved the way towards development and improvement in the
new designs for unmanned installations. The performance of the newer generations
have been highly accurate, precise and satisfactory. In addition to that, the older
generations are being regularly upgraded through improvement programs [3].
To provide a sufficient power supply to the unmanned platforms, the older generations
of unmanned platforms mainly used conventional power sources. The conventional
power sources such as diesel and natural gas turbines used to supply the
instrumentation and electrical devices with continuous power supply. However, the
regular maintenance conventional power systems resulted in increasing the operating
costs over the long term. In addition to that, during the monsoon time and the heavy
rain season, the conventional systems failed to meet the requirements due to the sudden
breakdown of the power sources [4].
The hybrid power system was introduced to overcome the unreliability and shortage
capability for conventional power sources. The hybrid system is mainly implemented
to supply the instrumentation loads which usually use a DC power source. The mixed
hybrid system uses renewable sources of energy in line with the conventional power
source. With a battery storage mechanism and intelligent controlling and monitoring
of the conventional power source fuel, the system could effectively overcome the old
system issues [4].
2.2 Hybrid Power Systems
Throughout the last two decades, the global awareness towards environmental issues
has grown rapidly. Using fossil fuels as the main energy resource in power generation
did not only caused a destructive environmental effects but also an increasing
consumption of the world non-conventional energy sources. Proposing conventional

6
power sources such as solar energy (photovoltaic power generation) and wind energy
(micro wind turbine power generation) as a solution for the power demand initiated a
global movement towards the renewable energy [5].
Moreover, stand-alone hybrid power system represents the most common system used
nowadays for supplying small villages, offshore installations, and off-grid industrial
areas with electricity. The hybrid power system usually mixes two or three different
power source to ensure reliability and continuous supply to the loads. For instance, the
hybrid power system can have a conventional and non-conventional power sources
that can work simultaneously or rotationally to supply the loads with the required
demand without any disturbances or power shortages. Many researches, field
experiments, and applications have been conducted towards the hybrid system
approach as a result of the higher reliability and capability the system shown
comparing with conventional systems [5].
A better understanding of the hybrid system characteristics will lead to an accurate
implementation, evaluation and optimization of the system. Several researches have
been introduced to discuss about hybrid systems. The main focus of these researches
are about the potential of the hybrid system energy sources, the integration between
two or more different sources and the performance analysis of the system.
This chapter presents a literature review on the hybrid system from different
approaches: solar energy potential analysis, wind energy potential analysis, battery
performance and storage system and the optimum sizing and designing methods for
building a hybrid solar-wind-diesel system which combines three different energy
sources.
2.2.1 Solar Photovoltaic Cell
Operating Principle of a Photovoltaic Cell
The power of the sun has been utilized into daily applications throughout the history.
From heating, fire, and lighting, the power of the sun shaped the human history and
contributed in the advancement and comfortability of human beings. The availability
to generate electricity from the sun which also known as the photoelectric effect has
been discovered in the eighteenth century. Solar cells have been utilized to convert the
radiation of solar energy to direct current (DC) of electrical power [6].

7
Modern solar panels are mainly made of semiconductor materials such as silicon which
considered the most dominant element in producing solar panels. The connection of
solar panel arrays can be in series to generate higher voltage or in parallel to result in
higher current. A solar PV module consists of series connected solar panels which can
further be connected to parallel modules of panels to form a PV array of parallel and
series solar panels [6].
Figure 1 P-N junction operation in a solar cell [6]
The principle of operation for a solar panel is illustrated in Figure 1. The photoelectric
effect depends on the P-N junction and the diffusion current resulted from the effect
of solar radiation on P-N junction in semiconductors. Basically, in no-light mode, solar
panels operate in the reverse direction and hence a drift current will be initiated
between the P-N junctions. When solar panels are exposed to light, cell photons with
energy greater than the P-N junction gap energy are absorbed and hence electron hole
pairs are formed. These carriers are separated under the influence of electric fields
within the junction, creating a current that is proportional to the incidence of solar
irradiation [7].
Solar Cell Characteristics
Solar cells usually shows a nonlinear characteristics between generated power and cell
voltage P-V curve and also between generated current and cell voltage I-V curve. The
general I-V curve is shown in Figure 2. Basically, a solar cell has fundamental
parameters which form the solar cell characteristics and behavior upon exposing to
light or radiation. Theses parameters are short circuit current (𝐼𝑠𝑐), open circuit voltage
(𝑉𝑜𝑐), maximum power point tracking algorithm (MPPT), and efficiency of the solar
cell (𝜂) [8].

8
Figure 2 General I-V characteristics graph for a solar cell [9]
1. 𝐼𝑠𝑐 = 𝐼𝑝ℎ : Short circuit current value is the highest value of current produced
by a solar photovoltaic cell when the cell is in open circuit condition (V=0)
2. 𝑉𝑜𝑐 : Open circuit voltage is the highest voltage drop across the P-N junction
of the solar cell (I_cell = 0). Mostly the Voc voltage will be presented during
night time when there is no radiation level to create the photoelectric current.
3. MPPT: Maximum power point tracking is the operating point in the I-V curve
where the maximum output power is generated from the photovoltaic cell.
Also, it represents the point which have maximum voltage and maximum
current as well.
2.2.2 Wind Turbines
Wind turbines were utilized by humans since the beginning of the modern industrial
era. In the eighteenth century, wind turbines have been used mainly in agriculture
environment for simple applications such as grinding or water pumping. In the
nineteenth century, wind turbines were used to generate electricity for small houses
and industrial areas by utilizing the wind speed to rotate the generator shafts. However,
the discovery of fossil fuels and the new industrialization era resulted in significant
decline in using wind turbine for energy generation. The fluctuating low output power
provided by the classical wind turbines were substituted with the high efficient fossil
fuels turbines that supplied a much higher output of consistent power [10].
In 1972, and followed by the first oil price shock in the twentieth century, renewable
energy industry was emerged to find solutions sustainable power sources other than
fossil fuels. Fossil fuels are burnt to generate mechanical energy that rotates the
generator blades and hence supplying electricity. The disastrous environmental effects
of using fossil fuels as the main power supply for electricity are devastating. Also, the
global warming has achieved hazardous levels that can damage the environment due

9
to the excessive usage of fossil fuels. Wind turbines industry was initialized as a major
potential source in providing renewable energy. Recently, the research and
development in utilizing the wind power has witnessed a significant increase due to
the environmental as well as the economic advantages over fossil fuels [11].
The wind power is clean, consistent, achievable, and the continuous development in
creating efficient wind turbines has led to cheap and affordable systems [12]. The
statics claim that there is a 90 % decrease in the cost of wind power generation since
1980 [13]. Wind turbines are considered one of the main renewable energy source
nowadays and has been accepted to be an achievable alternative for fossil fuels [14].
Definition of a Wind Turbine
A wind turbine is a machine that converts the kinetics energy of the air into mechanical
energy by utilizing the rotation of the wind turbine blades to generate a mechanical
torque on the turbine shaft. If the turbine torque is used directly in pumping water or
in agriculture purposed, the machine is called wind mill. However, if the turbine used
as a prime mover for an electric generator to generate electricity, the machine is called
wind turbine [15].
Figure 3 Vertical axis and horizontal axis wind turbines [15]
Horizontal-Axis and Vertical-Axis Wind Turbines
Wind turbines are classified into vertical axis wind turbines and horizontal axis wind
turbines. Vertical axis wind turbines do not require any towers and the generator, gear
boxes, and turbine control system can be installed on the ground. But, a vertical axis
wind turbine will require an excitation system as it is not a self-starting machine.
Moreover, controlling the amplitude and the frequency of a vertical axis wind turbine

10
will be difficult and hence the power efficiency will be affected significantly.
Currently, horizontal axis wind turbines are the most affordable type of wind turbines
available in the market. Figure 3 illustrates the different configuration between a
horizontal-axis and a vertical axis turbine. A horizontal axis wind turbine mainly
consists of [16]:
Rotor blades that extract the kinetic energy in the wind and transform it to
mechanical torque.
The nacelle which is attached to the rotor blades and consists of the wind
turbine rotor shaft, gear box system to regulate the wind speed, mechanical
drivetrain system to drive the wind speed and accelerate the shaft to generate
electricity, and finally an electric generator to transform the mechanical torque
into electrical power supply.
The turbine tower that support both the rotor blades and the nacelle.
The internal structure of a horizontal axis wind turbine is shown in Figure 4.
Figure 4 Internal structure of a horizontal axis wind turbines [16]
Rotor blades differ in shape, size and number per turbine. A wind turbine can have
three blades, two blades, or sometime a single rotor blade. Usually, for generating
electricity, a typical wind turbine will be equipped with two or three rotor blades. Also,
a wind turbine with a two rotor blades will cost less than another turbine with three
rotor blades. However, a two blades wind turbine will require a higher rotational speed
to achieve the same output power for a three rotor blades turbine. On the current days,
three rotor blades wind turbines are the most common type in wind turbine industry.

11
Variable-Speed and Constant-Speed Wind Turbines
Prior to the rising in the wind energy industry in the 1970s, Wind turbines were
operated by fixed speeds. The rotor blades of the turbine were adjusted to a nominal
value of wind speed and hence the generator was driven by the mechanical torque
resulted from this speed. However, there were several disadvantages for fixes speed
wind turbines such as lower efficiency, lower generated power, and wasting the
potential of using high wind speed to generate more power form the turbine. In the
other hand, there was a significant development in the field of power electronics,
power converters, and rectifiers. This advancement paved the way for variable speed
wind turbines to take over the wind energy industry later in the 1990s and after [15].
Variable speed wind turbine are the most dominant type of wind turbines nowadays.
A power electronics convertor is mainly used to regulate the turbine output voltage
according to the input wind speed to the turbine blades. In addition to that, the power
convertor will help in controlling the fluctuating frequency of the system which will
enable wind turbines to connect with the utility grid system. Despite the cost of power
electronics system, a variable speed wind turbine can be operated in the maximum
aerodynamic efficiency unlike the fixed speed wind turbines [17].
2.2.3 Diesel Generator
In the recent days, and with expansion of using renewable sources in generating green
energy, diesel generators is believed to be one of the most essential components in a
hybrid power system. According to Quebec government, the wind-diesel energy
system has been officially adopted to be running through small and remote areas for
supplying electrical energy and provide communication in northern areas of Quebec
[18]. A diesel generating system is widely known to be one of the best energy
generation systems. It has been used to supply electricity for remote areas, offshore
constructions, and off-grid societies. The system has always showed robust and
consistent performance [19]. However, due to the new policies of green energy
production, diesel generators is believed to have a bright future as a main element in
hybrid systems. A detailed study and efficient modelling of a diesel generation set can
contribute to the analysis of the generator performance and reliability in order to design
a more suitable generators for hybrid system applications [20].
The selected model of generation’s sets for the project are diesel generators. The
generator is a low speed 4-pole synchronous generator with diesel as a main fuel

12
system for the prime mover engine. Diesel generator are selected based on the
availability, efficiency, robust design of the machines, and the ability of the generators
to work in hazardous areas with harsh environments such as the offshore environment.
Also, diesel fuel are prefers due to the fact that it can be stored for extended period of
time. The generation set proposed in the project consists of a diesel engine with a low
speed synchronous generator rotating in the same shaft. The engine is used to produce
mechanical energy which is transferred to the rotor of the synchronous machine via
the rotating shaft between the two sets. Finally, the generator converts the mechanical
energy to electrical energy [21].
Figure 5 Diesel generator topology and interconnections A synchronous generator has been implemented in the project due to the low cost for
maintenance and operation, smooth operation, and availability. Moreover, alternators
have been used extensively in hybrid systems for wind generations, hydropower
generation, and emergency considerations [22]. Also, synchronous generators
represent a higher efficiency in standalone systems due to the stabilized frequency and
voltage the generators can achieve comparing to induction generators which require a
much more complicated control system for stabilizing the frequency and voltage. In
addition to that, synchronous generators can be used efficiently with prime movers that
utilized biogas, diesel, natural gas or any source of mechanical rotation [23]. The diesel
generator topology and interconnections is shown in Figure 5.
13
2.2.4 Energy Storage System (Battery System)
The modelling and simulation of an autonomous off-grid hybrid power system requires
an energy storage and dumping system in order to usefully manage the generation
units, AC and DC loads, and the excessive or shortage of power in the system during
different operation durations and conditions. A battery system needs to be
implemented in the hybrid power system along with the renewable energy units as well
as the emergency diesel generator. Hence, various battery models have been
investigated and examined to be used in the project such as the Peukert model, Doyle
electrochemical battery model, the KiBaM model, and finally the generic battery
model developed by Matlab/Simulink software application [24]. The previous models
are distinguished by the lifetime of the battery, the accuracy, the battery material, and
the accuracy of the charging process. Consequently, in this project, the generic battery
model developed by Matlab/Simulink is being implemented. The generic battery
model is designed and modelled to allow different battery models with characteristics
that can be easily obtained from the manufacturer’s datasheets. Moreover, the model
validity has been verified [25].
2.3 Solar and wind energy potentials in Malaysia
Meteorological data such as solar radiation, wind speed, and temperature profiles
differs from location to another. In order to effectively analyze the potential of solar
and wind energy for the project location, the meteorological data for the location
should be investigated to determine the energy profile of this area.
2.3.1 Solar Energy Potential Analysis in Malaysia
In recent years, the Malaysia government, universities, and researchers have paid
increasing attention to solar and wind energy applications in Malaysia. Solar energy
is a non-conventional power source that uses the solar irradiation to generate
electricity. The phenomena is usually known as the photoelectric effect and it
generates electrical currents based on the irradiance effect of the sun. During the last
50 years, the ability to use solar power has greatly increased and developed. This gave
a promising future towards implementing the solar power in residential areas,
factories, and off-grid communities. Also, the development in the semiconductor
industry will change the old perception about the economic effect of using renewable
energy over the conventional power sources [26].

14
In Malaysia, the research, development, and implementation of renewable energy
sources has started only in the last 25 years. According to the world solar radiation
distribution, the solar radiation levels in Malaysia are considered amongst the lowest
radiation levels in the world. Figure 6 and Figure 7 showed that Malaysia has a mean
solar radiation of 4.0 – 4.9 kWh/m2/day while the mean solar radiation level for the
most countries in the world is around 6.0 – 6.9 kWh/m2/day [27].
Figure 6 World daily solar radiation map [27]
Figure 7 Annual average daily global solar irradiation in Malaysia [28]
In the recent era, solar energy is considered as the main and the most dominant source
of renewable energy. The reason behind this consideration is that solar energy is
predictable and constant for all the locations in the world. There are two main

15
technologies which are used to capture the solar effect and generate electricity. The
first one is the photovoltaic solar panels which convert the irradiance of the sun into a
DC electrical current. The continuous development in the field of power electronics
has resulted in significant generation capability of the PV panels which can convert
5-15 % of the sun irradiance into DC currents [29].
The second method used for generating electricity is solar thermal effect which uses
the sun to heat water. The DC current generated by the photovoltaic solar panels can
be stored into a storage system such as batteries or can be converted to AC current by
using power converters. For a standard irradiance level of 800 W/m2 and during the
standard operating conditions, a PV panel of 1 m2 can generate maximum 100 watt of
power [29].
The efficiency and reliability of solar energy are affected by the ambient environment.
The generation can be disturbed by the ambient temperature, the solar radiation levels,
the climatic conditions, and the arrangement of the photovoltaic system. The efficiency
reduction due to high air temperature in Malaysia is estimated to be 8 % while the
efficiency reduction due to the dust and other environmental disturbances is estimated
to be about 2 % of the total rated generation capacity of the photovoltaic system. The
standard life span of a photovoltaic panel is 25 years. On the other hand, The life time
for the electronic power converters, batteries, and charge controllers is estimated to be
from 5 to 10 years [29].
2.3.2 Wind Energy Potential Analysis in Malaysia
Wind energy term is used to describe the process of obtaining electricity from the wind
movement. The conversion and generation of electricity occurs by using wind turbines
or micro-wind turbines for smaller power capacity. Wind turbines is used to convert
the kinetic energy of the wind flowing through the wind turbine blade into mechanical
power used to rotate the wind turbines blades and consequently generates electricity
[26].
The wind energy has grown to be a promising and reliable power source. The wind
power is clean, achievable and maintainable. According to previous studies, the
amount of wind power installation around the globe is estimated to be 58.982 MW.
This is almost 2 % of the total production capacity worldwide [30].

16
In the offshore environment, wind power is considered to be much more powerful than
onshore environment. Wind farms are installed for generating electricity to off-grid
offshore installations. A wind turbines farm will benefit from the wind speed available
in the offshore environment and this will help to generate more electricity comparing
to onshore wind farms [31].
Researches have been conducted to maximize the wind energy output in Malaysia. The
studies show that only few places are sufficient for the establishment of wind farms.
The current wind farms installation are mainly located in Sabah and Sarawak. In order
to ensure the reliability and high performance of a wind turbine, there are many design
aspects needs to be taken into consideration such as the ambient environment and the
wind speed analysis [31].
The analysis of a potential site for a wind turbine is essential in investigating about the
feasibility of project. Wind speed, wind flow dynamics, and climatic conditions are
among the most crucial factors designers rely on during the pre-feasibility study of the
project. The meteorological data needed for the study can be obtained and sourced
from the national meteorological center in Malaysia [32, 33].
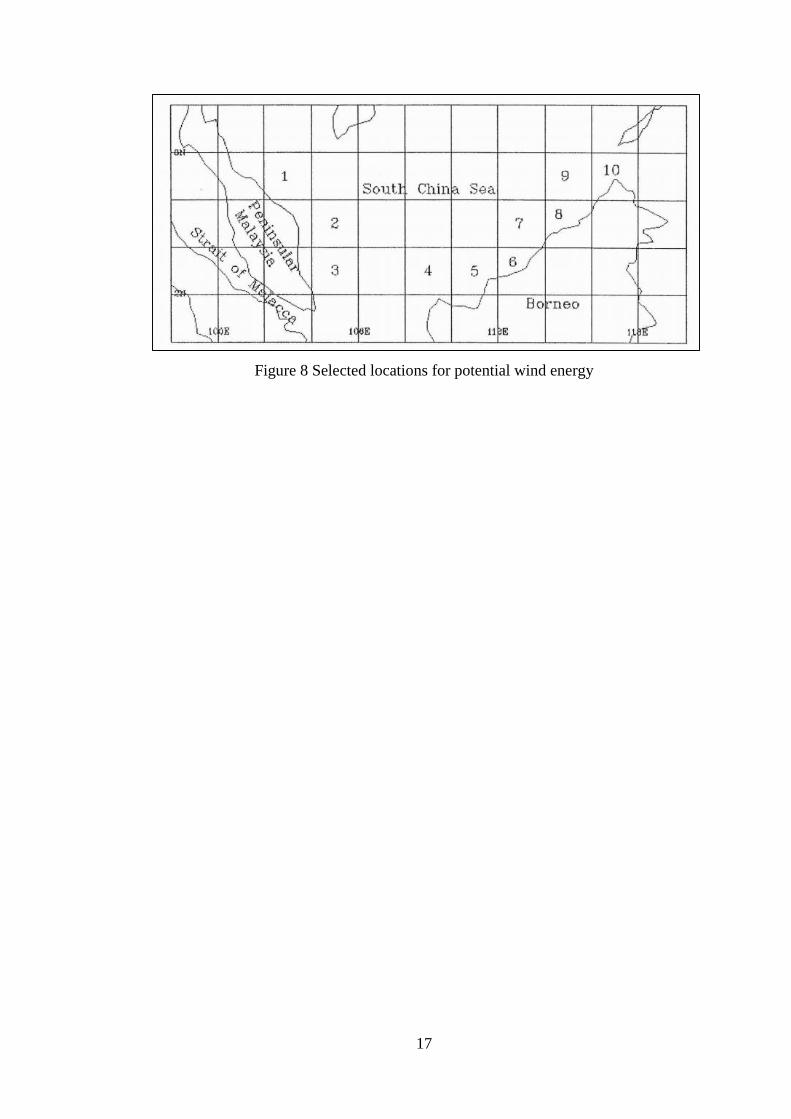
Figure 8 indicates the most promising locations for wind energy in Malaysia. The
selected locations were numbered where location 1-7 represent the possible location
on eastern peninsular Malaysia seashore. The numbers from 8-10 represents the
possible locations onshore and offshore the coastline of Sabah and Sarawak state [34].
According to the studies, sites 1, 2, 3 and 8 were found to be more feasible for the
project. The main criteria for the selection is that during the annual northeast monsoon
season, the wind speed in these areas will excess 5 m/s. although this is a significant
achievement in wind speed needed for the project, but the sites experienced lower wind
[34].
17
Figure 8 Selected locations for potential wind energy

18
CHAPTER 3 : RESEARCH METHODOLOGY
In this chapter the project research methodology is explained in detail. The
methodology was developed based on the literature review and the pre-feasibility
study of the project. Figure 9 illustrates the general steps of the project methodology.
Figure 9 Research methodology
3.1 Unmanned Installation Power Demand
In designing an unmanned offshore platform, the load profile represents one of the
most crucial elements in the design process. Sizing the power system must ensure that
the load profile is covered under all the situations and circumstances. Moreover, by
implementing a renewable power system to fully supply the platform loads, the load
data needs to be analysed. Based on the existing North Sea unmanned platform Cutter,
the DC load data will vary between 250 W to 400 W and the probability of higher load
is considered rare and unlikely to occur. The average daily demand of current on-board
Optimization Study for the Hybrid Power System
Developing a Complete Hybrid Power System Model
Developing Energy Storage and Control Strategies
Modelling and Simulation of a Diesel Generator Set
Modeling and Simulation of a Micro-Wind Turbine
Modelling and Simulation of Solar Photovoltaic Panels
Investigation on Unmaned Installations Power Demand
Hybrid Power System Feasibility Study

19
the platform for the instrumentation devices is 13.85 A for a DC voltage value of
24 V as specified by SHELL, the owner company of the platform [35]. Consequently,
the total average load for the platform are calculated from the following equations.
𝑃𝑤𝑎𝑡𝑡 = 𝐼𝑎𝑣𝑔 ∗ 𝑉𝑎𝑣𝑔 (3.1)
𝐸𝑘𝑤ℎ =𝑃𝑤𝑎𝑡𝑡∗𝑡ℎ
1000 (3.2)
Where: The energy (E) in kilowatt-hours (kWh) is equal to the power (P) in watts,
times the time period (t) in hours (hr.) divided by 1000. Based on the equations, the
total average load will be 332.4 W and this will result in a total energy consumption
of 7.978 kWh/day.
3.2 Solar Photovoltaic Module
A simplest equivalent circuit of a solar cell is a current source in parallel with a diode.
The output of the current source is directly proportional to the solar energy (photons)
that hits on the solar cell photocurrent (Iph). During darkness, the solar cell is not an
active device; it works as a diode, i.e. a p-n junction. It produces neither a current nor
a voltage. However, if it is allowed to connect to an external source (large voltage) it
generates a current (Id), called diode (D) current or dark current. The diode determines
the IV characteristics of the cell.
Figure 10 Solar cell electrical model [9]
The circuit diagram of a PV cell is shown in Figure 10. Accurate simulation is obtained
after considering the following parameters:
Temperature dependence of the diode reserved saturation current (Is).
Temperature dependence of the photo current (Iph).
Series resistance (Rs), (internal losses due to the current flow) which gives a
more accurate shape between the maximum power point and the open circuit
voltage.

20
Shunt resistance (Rsh), in parallel with the diode, this corresponds to the
leakage current to the ground.
Equations which define the model of a PV cell are given below:
𝑉𝑇 = 𝐾∗𝑇𝑂𝑃
𝑞 (3.3)
𝑉𝑂𝐶 = 𝑉𝑇 ln𝐼𝑃ℎ
𝐼𝑆 (3.4)
𝐼𝑑 = [𝑒ln(
𝑉+𝐼∗𝑅𝑆𝑛∗𝑉𝑡∗𝐶∗𝑁𝑆
)− 1] ∗ 𝐼𝑆 ∗ 𝑁𝑃 (3.5)
𝐼𝑆 = 𝐼𝑟𝑠 ∗ (𝑇𝑜𝑝
𝑇𝑟𝑒𝑓)
3
∗ 𝑒[𝑞∗𝐸𝑔
𝑛∗𝑘(
1
𝑇𝑜𝑝−
1
𝑇𝑟𝑒𝑓)]
(3.6)
𝐼𝑟𝑠 = 𝐼𝑠𝑐
[𝑒[
𝑞∗𝑉𝑜𝑐𝑛∗𝑘∗𝐶∗𝑇𝑜𝑝
]−1]
(3.7)
𝐼𝑠ℎ = 𝑉+𝐼∗𝑅𝑠
𝑅𝑃 (3.8)
𝐼𝑝ℎ = 𝐺𝑘[𝐼𝑠𝑐 + 𝐾1(𝑇𝑂𝑃 − 𝑇𝑟𝑒𝑓] (3.9)
𝐼 = 𝐼𝑝ℎ ∗ 𝑁𝑃 − 𝐼𝑑 − 𝐼𝑠ℎ (3.10)
Where:
STC: Standard Test Condition, G=1kw/m2, 𝑇𝑂𝑃 = 25°C
𝐺𝑘 : Solar irradiance ratio
𝑉𝑇 : Thermal Voltage, V
𝐾 : Boltzmann’s constant, 1.38e-23
𝑇𝑂𝑃 : Cell operating temperature in ºC
𝑇𝑟𝑒𝑓: Cell temperature at 25ºC
𝑞 : Electron Charge constant, 1.6e-19 C
𝐼𝑆 : Diode reversed saturation current, A
𝐼𝑟𝑠 : Diode reversed saturation current at 𝑇𝑂𝑃
𝐼: Output current from the PV panel, A
𝐼𝑠ℎ: Shunt current, A
𝑉: Output voltage from the PV panel, V
𝑛: Diode ideality factor,1.36
𝐶: No of cells in a PV panel, 36

21
𝑁𝑆, 𝑁𝑃: No of PV panel in series & parallel
𝐸𝑔: Band-gap energy of the cell, 1.12eV
3.2.1 DC-DC Buck Convertor
In order to control the solar panels array output voltage, a DC-DC buck convertor is
used to step down the output voltage, hence enable a more efficient and accurate
method of controlling the output power of the array. The DC-DC buck convertor
consists of input voltage source (Vs), switching device to control the output voltage
(S), diode (D), high value inductor (L), filter capacitor (C) and output load resistance
(RL). The basic structure of the DC-DC buck convertor is shown in Figure 11.
Figure 11 DC-DC buck convertor
The buck convertor is assumed to be working in continuous conduction mode CCM.
Consequently, the inductor current (𝐼𝑙) is always positive during the on state of the
buck convertor. In the on state of the controlled switch S, the diode D is reverse biased.
When the controlled switch S is on the off state, the diode D will be forwarded biased
and the will supply the load resistance with uninterrupted current through the inductor.
The input-output voltage relationship can be defined by using inductor voltage (𝑉𝑑)
which, according to Faraday’s law, has a value of zero over steady state analysis
(constant time).the following equations are used to define the duty cycle ratio used in
the operation of the buck convertor:
(𝑉𝑠 − 𝑉𝑜)𝐷𝑇 = −𝑉𝑜(1 − 𝐷)𝑇 (3.11)
Hence,
𝑉𝑜
𝑉𝑠= 𝐷 (3.12)
Where:
Vo: Output Voltage
Vs: Input Voltage
D: Ratio of output voltage to input voltage

22
T: Duty cycle
The following equations will be used to determine the parameter of the buck convertor:
𝐿𝑐𝑟𝑖𝑡 = 1−𝐷
2∗ 𝑇𝑅 (3.13)
𝐿 = 100 ∗ 𝐿𝑐𝑟𝑖𝑡 (3.14)
𝐶𝑚𝑖𝑛 = (1−𝐷)∗𝑉𝑜
8∗𝐿∗𝑓2∗𝑉𝑠 (3.15)
Where:
Cmin: The minimum value used for filter capacitance (uF).
Lcrit: The minimum value to ensure that the buck convertor is working on
CCM (H).
L: the typical value sued for the inductance in the buck convertor circuit (H).
T: switching period (sec).
R: Output load resistance (ohm).
F: Switching frequency (kHz).
Simulink average based model is used to replace the controlled switch S in the design.
Moreover, a smoothing capacitor (Cin) will be used to filter the input voltage. To
ensure the highest output power from the solar panels array, the switching frequency
needs to be adjusted according to the irradiation level as well as the load resistance. In
case of using fixed frequency, fixed duty cycle, to switch the convertor, the output
power will be varied according to the load value and the irradiation level. Hence, a
MPPT algorithm will be presented to overcome this issue and sustain the maximum
output value of the solar panels array system.
3.2.2 Maximum Power Point Tracking (MPPT) Algorithm
MPPT are various techniques and algorithms used to sustain the highest obtainable
value of the output power from a solar photovoltaic cell, panels or array. There are
various techniques used to regulate the output voltage and current to preserve the
maximum output power under varied loads or irradiation levels.
In this paper, a MPPT algorithm utilizing fractional open circuit voltage technique will
be used. Basically, the technique define the relationship between the solar photovoltaic
cell open circuit voltage Voc and maximum obtainable voltage Vmpp under standards
operating conditions. For every irradiation level and operation temperature, there are
a specific value of Vmpp that can be achieved to produce the maximum output power

23
Pmpp. This value represented a fractional value of the open circuit voltage of the solar
photovoltaic cell. Consequently;
𝑉𝑚𝑝𝑝
𝑉𝑜𝑐= 𝐾, 0 < 𝐾 < 1 (3.17)
Where; K is the fixed fractional value to be used for sustaining the maximum output
value of power generated by the solar photovoltaic system Pmpp. The fractional value
K is estimated to be 0.82 for Solarex-MSX60 60Wp Solar Module used in this paper.
The following flow chart represents the basic operating principle of the open circuit
voltage MPPT algorithm. The project MPPT algorithm is shown in Figure 12.
Figure 12 Fractional open-circuit voltage MPPT algorithm flowchart
Despite being efficient and uncomplicated in implementation, the fractional value K
is difficult to adjust and hence a PI controller will be added to the design to
dynamically achieve the maximum output voltage Vmpp.
3.2.3 Proportional Integral (PI) Controller
The fractional open circuit voltage algorithm will be used as a reference input to the
PI controller implemented in the design. The PI controller will tune the error resulted
from the difference between the ideal Vmpp value for the Solar array used and the
measured value from the system. Then, the controller output will be scaled and used
as a switching frequency for controlled switch used in the buck convertor circuit.

24
The proportional integral controller (PI) controller is used to tune and eliminate the
error exist by varying the load as well as the irradiation levels on the solar photovoltaic
array system. Moreover, the solar photovoltaic system will trigger the controlled
switch S in the buck convertor to dynamically compensate the switching frequency
and preserve the maximum output power Pmpp at the load resistance. The state space
representation of the buck convertor was used to obtain the transfer functions of the
buck convertor, hence calculating the integral gain (Ki) and the proportional gain (Kp)
needed for the PI controller tuning algorithm. The transfer functions used in the paper
are illustrated below with reference to the S-domain.
𝐼𝑙 (𝑆) = 1
𝐿∗𝑆[𝐷 ∗ 𝑉𝑆(𝑆) − 𝑉𝑜(𝑆)] (3.18)
𝑉𝑆(𝑆) = 1
𝐶1∗𝑆[𝐼𝑃𝑉(𝑆) − 𝐷 ∗ 𝐼𝑙 (𝑆)] (3.19)
𝑉𝑜(𝑆) = 1
𝐶2∗𝑆[𝐼𝑙 (𝑆) −
𝑉𝑜(𝑆)
𝑅𝑙] (3.20)
Where:
L: inductor value
C1 : Input capacitor
C2: Output capacitor
RL: output load resistance
The transfer function H(S) used for the PI compensation is obtained by dividing the
output voltage (Vo) to the input voltage (Vs) as illustrated below.
𝐻(𝑠) = 𝑉𝑜 (𝑠)
𝑉𝑆(𝑠)=
𝑅𝐷 (𝐾𝑝∗𝑆+𝐾𝑖)
𝑅∗𝐿∗𝐶2∗𝑆3+𝐿∗𝑆2+𝑅∗𝑆+𝑅𝐷 (𝐾𝑝∗𝑆+𝐾𝑖) (3.21)
Where, Ki : Integral gain, Kp: Proportional gain.
3.2.4 Solar Photovoltaic Simulation Modules
The simulation of the model was carried out in three main stages in accordance with
the advancement of the model design. Matlab/Simulink environment was used to
simulate the behavior and characteristics of the solar modules in the paper. PI
controller Simulink block was used to tune the error and maintain the maximum output
power Pmpp in the output terminals of the buck convertor.

25
The first model was developed to prove the operating characteristics of the Solarex-
MSX60 60Wp Solar Module. The model contained input data from the solar module
datasheet and presented the behavior of the solar panel under standard test conditions
and with no load attached to that solar module. The output results from the first module
were used to study the effect of variable resistance to the operation of the solar cell in
the second model. Table 1 includes all the parameter obtained from the first model
simulation. The parameters are calculated based on the equations in section (3.2).
Table 1 Calculated parameters for the first PV model
Parameter Calculated Value
Iph 3.965 (A)
Vt 0.0322 (v)
Is 1.139 ∗ 10−5(A)
Irs 5.812 ∗ 10−6(A)
Voc 21.1 (v)
The second model was built to simulate the effect of variable resistance on the solar
module. A single solar module was used in the second model. Furthermore, the results
obtained from the first model was inserted in the second model and the behavior of the
variable load was obtained by using Simulink Scope block. A ramp function was used
to vary the resistance according to the slope identified in the Simulink ramp function
block.
Finally, the third and final model was developed using the input data from the first and
second models. Unlike the first and the second models, which consisted only of one
solar module, the third model represents a photovoltaic system of two parallel arrays
with ten solar modules in each array connected in series. The photovoltaic system
presented in the third model will be controlled by buck convertor to enable MPPT
algorithm as illustrated previously. To ease the calculations in the third model, a
similar mathematical model derived from the original model was developed to
represent a single solar module. The equation used in the third model solar modules
is:
𝐼 = 𝐼𝑝ℎ ∗ 𝑁𝑝 − 𝐼𝑠 ∗ 𝑁𝑝 (𝑒𝑉+𝐼∗𝑅𝑠
𝑛∗𝑉𝑡∗𝐶∗𝑁𝑠 − 1) − (𝑉+𝐼∗𝑅𝑠
𝑅𝑝) (3.22)

26
Where:
I: Solar module output current (Amps).
Iph: Diode current (Amps).
Np: Number of arrays in parallel.
Ns: Number of series solar modules in the array.
N: Fill factor
C: Number of solar photovoltaic cells in each modules.
Vt: Thermal voltage (Volt).
Rs: Solar photovoltaic cell parallel resistance (Ohm)
Rp: Solar photovoltaic cell series resistance (Ohm)
V: Output Voltage (Volt)
3.3 Wind Turbine Module
Modern wind turbine generator systems are constructed mainly as horizontal axis of
rotation, a wind wheel consisting of three blades, a high speed asynchronous generator
(also known as induction generator) and a gear box. The wind turbine under study falls
in this category and is also equipped with a blade pitch angle control system, which
enables the power generated by the wind turbine to be controlled.
3.3.1 Wind Turbine Rotor Blades
The following equations are used to model the blades mechanism and to identify the
mathematical relationship between the wind speed and the generated mechanical
power.
𝐸 = 0.5 ∗ 𝑚 ∗ 𝑣2 (3.23)
𝑃𝑊 =𝑑𝐸
𝑑𝑡= 0.5 ∗ 𝑚 ∗ 𝑣2 (3.24)
𝑃𝑊 = 0.5 ∗ 𝜌 ∗ 𝐴 ∗ 𝑣3 (3.25)
𝜌 = 𝜌0 − 1.194 ∗ 10−14 ∗ 𝐻 (3.26)
𝜌0 = 1.225𝑘𝑔
𝑚3 𝑎𝑡 𝑇 = 298𝐾 (3.27)
𝑃𝐵𝑙𝑎𝑑𝑒 = 𝐶𝑃(𝜆,𝛽) ∗ 𝑃𝑊 = 𝐶𝑃(𝜆,𝛽) ∗ 0.5 ∗ 𝑚 ∗ 𝑣3 (3.28)
𝜆 = 𝜔𝑚∗𝑅
𝑣 (3.29)
𝑇𝑤 = 𝑃𝐵𝑙𝑎𝑑𝑒
𝜔𝑚= 𝐶𝑃(𝜆,𝛽) ∗ 0.5 ∗ 𝜌 ∗ 𝐴 ∗ 𝑣3 (3.30)

27
Where:
𝐸: The Kinetic energy in air
𝑚: Mass flow rate (Kg/Sec)
𝑣: Wind speed (m/𝑠2)
𝑃𝑊: The Power in the moving air (Watt)
𝜌: The Air density (kg/m3)
𝜌0: Air density at sea level at temperature T=298K, 𝜌0 = 1.225 kg/m3.
𝐻: Height above Sea level (m)
𝑃𝐵𝑙𝑎𝑑𝑒: The power extracted from the wind (Watt)
𝜆: The tip speed ratio (Unitless)
𝜔𝑚: Angular velocity of the rotor (Rad/Sec)
𝑅: Rotor radius (blade length) in meter
𝑇𝑤: The Rotor torque to the generator (N.m)
3.3.2 Mechanical Drivetrain
The mechanical drivetrain will be accomplished using two-mass model which will
transform the mechanical torque of the wind turbine into the electromechanical torque
of the synchronous generator used in the model. The mechanical torque of the wind
turbine and the electromechanical torque of the generator act against each other which
will result in positive sign for the wind turbine torque and negative sign for the
electromechanical torque of the synchronous generator. The mechanical drivetrain for
the small-scaled wind turbine are modelled based on Figure 13.
Figure 13 Wind turbine mechanical drivetrain model [36]
𝜏𝑇 = 𝐽𝑇𝜃�̈� + 𝐷(𝜔𝑇 − 𝜔𝐺) + 𝑘(𝜃𝑇 − 𝜃𝐺) (3.31)

28
−𝜏𝐺 = 𝐽𝐺𝜃�̈� + 𝐷(𝜔𝐺 − 𝜔𝑇) + 𝑘(𝜃𝐺 − 𝜃𝑇) (3.32)
𝑑
𝑑𝑡(𝜃𝐺 − 𝜃𝑇) = (𝜔𝐺 − 𝜔𝑇) (3.33)
𝜔�̇� = 1
𝐽𝑇∗ (𝜏𝑇 − 𝐷(𝜔𝑇 − 𝜔𝐺) − 𝑘(𝜃𝑇 − 𝜃𝐺)) (3.34)
𝜔�̇� = 1
𝐽𝐺∗ (−𝜏𝐺 + 𝐷(𝜔𝑇 − 𝜔𝐺) + 𝑘(𝜃𝑇 − 𝜃𝐺)) (3.35)
Where:
𝜏𝑇, 𝜏𝐺: wind turbine aerodynamic and generator electromagnetic torque [Nm]
𝐽𝑇, 𝐽𝐺: Moments of inertia of the wind turbine rotor and the generator [kgmm]
𝐷, 𝑘 : equivalent damping and stiffness [Nms/rad], [Nm/rad]
𝜃𝑇, 𝜃𝐺: angular position of the rotor and the generator [rad]
𝜔𝑇, 𝜔𝐺: Wind turbine rotor and the generator speed [rad/s]

29
3.3.3 Permanent Magnet Synchronous Generator
The Simulink model for the permanent magnet synchronous generator is shown
in figure 14. The model utilizes a negative torque as an input for the synchronous
machine which generate three phase voltage at its terminals.
Figure 14 Permanent magnet synchronous generator model
Matlab/Simulink model for permeant magnet synchronous machine was implemented
to transforms the mechanical torque generated by the wind turbine to three phase AC
electrical power. The model parameters and equations are described below in the next
part. Firstly, the three phase sinusoidal model of the generator electrical system is
modelled using the rotor reference frame (d-q frame) and all the equations and
parameters are referred to the rotor side:
𝑑
𝑑𝑡𝑖𝑑 =
1
𝐿𝑑∗ 𝑣𝑑 −
𝑅
𝐿𝑑𝑖𝑑 +
𝐿𝑞
𝐿𝑑𝑖𝑞 ∗ 𝑝 ∗ 𝑤𝑚 (3.36)
𝑑
𝑑𝑡𝑖𝑞 =
1
𝐿𝑞∗ 𝑣𝑞 −
𝑅
𝐿𝑞𝑖𝑞 +
𝐿𝑑
𝐿𝑞𝑖𝑑 ∗ 𝑝 ∗ 𝑤𝑚 −
𝜆∗𝑝∗𝑤𝑚
𝐿𝑞 (3.37)
𝑇𝑒 = 1.5 ∗ 𝑃[𝜆𝑖𝑞 + (𝐿𝑑 − 𝐿𝑞)𝑖𝑞 ∗ 𝑖𝑑] (3.38)
Where:
Lq, Ld : q and d axis inductances
R : Resistance of the stator windings
iq, id : q and d axis currents
vq, vd : q and d axis voltages
ωm : Angular velocity of the rotor
λ : Amplitude of the flux induced by the permanent magnets of the rotor in the
stator phases

30
p : Number of pole pairs
Te : Electromagnetic torque
The mechanical system for the same model are modelled as:
𝑑
𝑑𝑡𝜔𝑟 =
1
𝐽∗ (𝑇𝑒 − 𝑇𝑓 − 𝐹𝜔𝑚 − 𝑇𝑚) (3.39)
𝑑𝜃
𝑑𝑡= 𝜔𝑚 (3.40)
Where:
J: Combined inertia of rotor and load
F: Combined viscous friction of rotor and load
Θ: Rotor angular position
Tm: Shaft mechanical torque
Tf: Shaft static friction torque
ωm: Angular velocity of the rotor (mechanical speed)
3.4 Diesel Generator
Like various electromechanical power production systems, a diesel generator consists
of three main parts, the first part is the diesel generator prime mover which includes
the diesel engine with the generator speed governor. The second part is electrical
generator which utilized the mechanical input power from the diesel engine shaft to
transform the mechanical rotation energy to electrical energy. In this project, a salient
pole synchronous generator was implemented to produce the electrical energy. The
third part of the diesel generation system is the excitation system and the automatic
voltage regulator, which both were implemented using AC5A IEEE system
configuration and recommendations for per-unit systems.
The control strategy for the diesel generation set was achieved using diesel engine
speed governor and synchronous generator automatic voltage regulator (AVR). The
speed governor regulates the diesel engine rotation speed according to the pre-defined
value and the actual rotation value measured at the generator terminals. In a similar
approach, and to regulate the output voltage of the generator, automatic voltage
regulator (AVR) is used to regulate and stabilize the output voltage of the synchronous
generator via adjusting the excitation field voltage applied to the generator rotor via
slip rings. In the next part, a detailed explanation of the modelling process of the diesel
generator is illustrated.

31
3.4.1 Diesel Engine and Prime Mover
In diesel generator sets, diesel engine is the main purpose of providing impulsion. An
engine governor is used to automatically adjust and control the diesel engine speed.
The purpose is ensuring that the diesel engine can be at specific speed to stable
operation. In this paper, the combination of diesel engine and governor used second-
order transfer function for modeling. The following equations represents the controller
transfer function and the actuator transfer function for a diesel engine and its governor
system.
𝐻𝑐 = 𝑘 ∗1+𝑇3∗𝑠
1+𝑇1∗𝑠+𝑇1∗𝑇2∗𝑠2 (3.41)
𝐻𝑎 =1+𝑇4∗𝑠
𝑠(1+𝑇5∗𝑠)(1+𝑇6∗𝑠) (3.42)
Where:
Hc: Controller transfer function.
Ha: Actuator transfer function.
The model equations have been implemented using Matlab/Simulink environment.
The model will measure the difference between the reference speed and the actual
measure speed. Then, the error will be calculated and a PID controller is implemented
to tune the error and dynamically adjust the mechanical output power supplied to the
synchronous generator. Figure 15 shows the diesel engine governor model used in the
project.
Figure 15 Prime mover Simulink model
Table 2 includes the control parameters used for the diesel generator prime mover.

32
Table 2 Prime mover controller and actuator parameters
Parameters Value
Regulator gain K 15.62
Regulator time constants [T1 T2 T3 ] (s) [0.1 0.1 0.01]
Actuator time constants [T4 T5 T6] (s) [0.25 0.009 0.0384]
3.4.2 Synchronous Generator
The synchronous machine used in the model is a three-phase synchronous generator
with its input port connected to the mechanical output power Pmec of the Prime
Mover. Matlab/Simulink model was used to implement the synchronous machine
taking into considerations per-unit values (pu) as measured values of the generator.
The synchronous machine block operates in generator or motor modes. The operating
mode is dictated by the sign of the mechanical power (positive for generator mode,
negative for motor mode). The electrical part of the machine is represented by a sixth-
order state-space model and the mechanical part is the same as in the Simplified
Synchronous Machine block.
The model takes into account the dynamics of the stator, field, and damper windings.
The equivalent circuit of the model is represented in the rotor reference frame. All
rotor parameters and electrical quantities are viewed from the stator. They are
identified by primed variables. The subscripts used are defined as follows:
D, q: axis quantities for dq representation.
R, s: rotor and stator quantities for the synchronous machine.
I,m: Leakage and magnetization inductance.
F, k: field and damper winding quantities.
Figure 16 and 17 show the electrical model of the synchronous generator used in
the model as well as the equations of the electrical model.

33
Figure 16 Synchronous generator electrical model
Figure 17 Synchronous generator d-q equations
The synchronous machine block used in the diesel generator model is utilizing the Pu
fundamental standard for the stator and rotor parameters. In Table 3 and 4 the formulas
for the per-unit values are illustrated.
Table 3 Stator parameters in (Pu) representation
𝑅𝑍−𝑃𝑢 =𝑅𝑍
𝑍𝑆𝑏𝑎𝑠𝑒
Stator resistance / phase
𝐿𝐼−𝑃𝑢 =𝐿𝐼
𝐿𝑆𝑏𝑎𝑠𝑒
Stator leakage inductance
𝐿𝑚𝑑−𝑃𝑢 =𝐿𝑚𝑑
𝐿𝑆𝑏𝑎𝑠𝑒
Direct axis magnetization inductance
𝐿𝑚𝑞−𝑃𝑢 =𝐿𝑚𝑞
𝐿𝑆𝑏𝑎𝑠𝑒
quadrature axis magnetization inductance

34
Table 4 Rotor parameters in (Pu) representation
𝑅𝑓−𝑃𝑢 =𝑅𝑓
𝑍𝑆𝑏𝑎𝑠𝑒
Field resistance
𝐿𝐼𝑓𝑑−𝑃𝑢 =𝐿𝐼𝑓𝑑
𝐿𝑆𝑏𝑎𝑠𝑒
Field leakage inductance
The synchronous generator used in the diesel generation set is a 2000 VA generator
with a nominal voltage of 480 V and frequency of 60 Hz. The generator parameters
used in the model are shown in Table 5.
Table 5 Synchronous generator parameters
Parameter Value
Rotor Type Salient-Pole
Nominal power, line-to-line voltage,
frequency [ Pn(VA) Vn(Vrms) fn(Hz) ]
[ 2000 480 60]
Reactances [ Xd Xd' Xd'' Xq Xq'' Xl ]
(pu)
[ 0.078, 0.296, 0.252, 0.003,
0.243, 0.18 ]
Time constants [ Tdo' Tdo'' Tq'' ] (s) [ 4.49 0.0681 0.0513 ]
Stator resistance Rs (pu) 0.003
3.4.3 Excitation System and Automatic Voltage Regulator
The excitation system and the automatic voltage regulator were implemented to
stabilize the output voltage of the synchronous generator and to dynamically adjust the
terminal voltage according to the change in the load. AC5A IEEE system was
implemented by using a Matlab/Simulink blocks.
The calculation and control strategy was developed and implemented in the
Matlab/Simulink blocks based on the recommendations provided by IEEE for per-unit
systems. The voltage regulator will calculate the difference between the reference field
voltage for the synchronous generator (Vref) and the measured field voltage (Vt).
Then, a controller will be implemented to tune and eliminate the error. Figure 18 shows
the internal structure of the excitation and voltage regulator system.

35
Figure 18 Diesel generator AVR and excitation system model
3.5 Energy Storage and Control Strategy
3.5.1 Power Management System
Due to the irregularity and fragmentary of the renewable energy sources, which is
caused by the variations in solar irradiation levels as well as wind speeds, it is highly
doubtful that the AC/DC loads on board of the platforms will be only supplied by the
renewable sources. Hence, a control strategy should be applied to regulate different
operating conditions involving renewable sources, emergency generator, and energy
storage and dumping system. The control strategy should define the power demand
needed for the AC/DC loads of the unmanned platform and will apply the best system
topology in order to efficiently supply the loads at all time. Also, the controller will be
responsible for charging/discharging the battery system as well as running/
disconnecting the emergency diesel generator.
3.5.2 Controller Input and Output data
The proposed control strategy has three inputs, on/off signal to the emergency diesel
generator, Battery System State of Charge (SOC), and the amount of power to be
dumped. The control strategy working principle is as follow, first, the solar power,
wind power, and load demand should be known. Therefore, the controller determines,
based on the previous obtained data, if there is an excessive or shortage in power
supply in the hybrid system. If there is an excessive amount of generated power, the
system will check the SOC for the battery bank. Provided that the SOC for the battery
bank is more than 85 %, which means that the battery bank is fully charged, the

36
excessive power will be treated as a surplus power and will be dumped, otherwise it
will be sorted and used to charge the battery bank.
In addition to that, the SOC for the battery bank activates the on/off signal to the
generator. If the SOC is less than 20 %, which indicates that the battery bank is
depleted, then the emergency diesel generator will be turned on. To ensure a smooth
operation for the power system and a continuous non-disturbed supply to the loads,
the emergency diesel generator should be turned on before the battery bank is fully
depleted.
3.6 Optimization Study
In this section, the optimization study of the hybrid power system is presented. The
main objective of the optimization study is to achieve the optimal design of the hybrid
system components with the lowest cost. The study is carried out by using HOMER
software which is introduced by the American National Renewable Energy Laboratory
(NREL) and is dedicated to the optimization studies of off-grid hybrid power systems.
Moreover, the study will determine the ratings and sizing of each system components
during the lifetime of the project which is estimated to be 20 years (based on the
lifespan of PV panels). The general flowchart of the optimization study is shown in
Figure 19.
Figure 19 the general flowchart of the optimization model

37
3.6.1 The proposed optimization technique
The optimization technique selected is a parametric based approach. The optimization
model takes inputs from the hybrid system components as well as the wind data, solar
data, and diesel generator fuel cost. In addition to that, and seeking for the simplicity
of the analysis, the power ratings of the hybrid system components will be fixed.
However, the optimization model will vary the number of units for each components,
scaled annual irradiation level for the solar data, and scaled annual wind speed for the
wind data.
After constructing the hybrid system on HOMER software as shown in Figure 20, the
simulation will run for specifying the optimal system components that satisfy the
objective function of the optimization study.
Figure 20 Hybrid power system model in HOMER software
3.6.2 Cost objective function
The objective function of the study is to reduce the total cost of the project during its
total lifetime. Lifetime of the project will be considered as the lifetime of the solar
photovoltaic modules as they have the longest lifespan amongst all the system
components. The cost objective function of the project is represented by the net present

38
cost (NPC) of the project investment starting from the installation and commissioning
cost to a discounted value of operation and maintenance costs and hybrid system
components replacement cost. The inflation rate during the project lifetime will also
be taken into considerations.
The general equation of the cost objective function which will be used in the
optimization model includes capital cost (CC), annual operation and maintenance cost
(OMC), battery banks replacement cost (𝑅𝐶𝐶𝑜𝑠𝑡−𝐵𝑎𝑡𝑡𝑒𝑟𝑖𝑒𝑠), replacement cost of the
solar photovoltaic modules, replacement cost of the wind turbines, and the diesel
generator fuel cost (FC). All the cost will be calculated based on the total lifetime of
the project. However, the cost for inverters, rectifiers, system cables, and the overall
control system of the project will not be taken into considerations because they
represent a small share of the total system cost comparing with the major system
components mentioned in the first part. Consequently, the general equation of the cost
objective function of the project is as follow:
𝑂𝐹𝐶𝑜𝑠𝑡 = 𝐶𝐶 + 𝑂𝑀𝐶 + 𝑅𝐶𝐶𝑜𝑠𝑡−𝐵𝑎𝑡𝑡𝑒𝑟𝑖𝑒𝑠 + 𝑅𝐶𝑊𝑇 + 𝑅𝐶𝑃𝑉 + 𝐹𝐶 (3.43)
Where:
𝑂𝐹𝐶𝑜𝑠𝑡 : Total objective function cost.
𝐶𝐶 : Capital cost of the project.
𝑂𝑀𝐶 : Annual operation and maintenance cost.
𝑅𝐶𝐶𝑜𝑠𝑡−𝐵𝑎𝑡𝑡𝑒𝑟𝑖𝑒𝑠 : Replacement cost for the battery banks.
𝑅𝐶𝑊𝑇 : Replacement cost for the wind turbines.
𝑅𝐶𝑃𝑉 : Replacement cost for the solar photovoltaic modules.
𝐹𝐶: Diesel generator fuel cost.
The detailed description of each term of the general equation will be illustrated in the
following sections.
Capital cost
The capital investment of the project includes the cost of studies and designs, plant,
machinery, installation, and labors work. In this project the capital cost is specifically
presented for each major component of the hybrid power system. Also, capital cost is
a present cost which indicates the real cost of the project at the starting time of the
project. The capital cost (CC) is presented by:

39
𝐶𝐶 = 𝑃𝑊𝑖𝑛𝑑 + 𝑃𝑃𝑉 + 𝑄𝐵𝑎𝑡𝑡𝑒𝑟𝑦 + 𝑃𝐶𝑜𝑛𝑣𝑒𝑟𝑡𝑜𝑟 + 𝑉𝐶 (3.44)
Where:
𝐶𝐶 : Capital cost.
𝑃𝑊𝑖𝑛𝑑: Wind turbine cost.
𝑃𝑃𝑉: Solar photovoltaic modules cost.
𝑄𝐵𝑎𝑡𝑡𝑒𝑟𝑦 : Battery bank cost.
𝑃𝐶𝑜𝑛𝑣𝑒𝑟𝑡𝑜𝑟 : AC/DC power convertor cost.
𝑉𝐶 : Additional costs.
Operation and maintenance costs (OMC)
The annual operation and maintenance costs includes the maintenance cost of batteries,
wind turbines, wind turbines inverters, and solar photovoltaic panels. In addition to
that, the labors salaries and maintenance cost of the backup diesel generator will be
taken into considerations. The assumption made of the calculation is based on the fact
that OMC is almost stable and usually equals to a percentage of the total capital cost
of the project (CC). However, the increase of the OMC will only result from the change
in the inflation rate (fr) as well as the discount rate or the interest rate of the project
(ir).
𝑂𝑀𝐶 = 𝑂𝑀𝐶% ∗ 𝐶𝐶 ∗ (1+𝑓𝑟
1+𝑖𝑟)𝑡 (3.45)
Where:
𝑂𝑀𝐶 : Annual operation and maintenance costs.
𝑂𝑀𝐶% : Proposed percentage of the annual operation and maintenance costs.
𝐶𝐶 : Capital cost.
𝑓𝑟: Inflation rate.
𝑖𝑟 : Interest rate.
𝑡 : Project lifetime (years).
Replacement cost of the batteries (RC)
The replacement cost of the batteries identifying the replacement of existing batteries
or purchasing of new batteries during the project lifetime as the typical battery lifetime
is far less the project lifetime which is assumed to be 20 years. An assumption is made

40
to specify the replacement cost of the batteries during the project lifetime. The
assumption is based on the battery cost is not going to change significantly during the
project lifetime and will only be affected by inflation rate. The present value of the
battery replacement cost taking into considerations the interest rate.
𝑅𝐶𝐵𝑎𝑡𝑡𝑒𝑟𝑖𝑒𝑠 = 𝑄𝐵𝑎𝑡𝑡𝑒𝑟𝑦 ∗1
(1+𝑖𝑟)𝑡 (3.46)
Where:
𝑅𝐶𝐵𝑎𝑡𝑡𝑒𝑟𝑖𝑒𝑠 : Battery banks replacement costs.
𝑄𝐵𝑎𝑡𝑡𝑒𝑟𝑦 : Battery bank capital cost.
𝑖𝑟 : Interest rate.
𝑡 : Project lifetime (years).
Replacement cost for the solar PV modules and wind turbines:
Assumptions have been made for the replacement of the PV modules as well as the
wind turbines in the hybrid system. Theses assumption are based on the long lifespan
of the two components which is typically range from 15 to 20 years. Hence, the
replacement cost for both components will be assumed as a fixed percentage of the
initial capital cost. The replacement cost calculations for PV modules and wind
turbines are illustrated by:
𝑅𝐶𝑃𝑉 = 𝑃𝑃𝑉 ∗ 𝐹𝑝1 (3.47)
𝑅𝐶𝑊𝑇 = 𝑃𝑊𝑇 ∗ 𝐹𝑝2 (3.48)
Where:
𝑅𝐶𝑃𝑉 : Replacement cost of solar PV modules.
𝑅𝐶𝑊𝑇 : Replacement cost of wind turbines.
𝑃𝑃𝑉 : Capital cost of PV modules.
𝑃𝑊𝑇 : Capital cost of wind turbines.
𝐹𝑝1 : Fixed percentage for PV.
𝐹𝑝2 : Fixed percentage for Wind turbines.
Fuel cost:
The total cost of the diesel generator fuel is calculated based on varying the fuel cost
per liter starting from 0.3 $/L to 0.6$ per liter and with an increment of 0.05 $ per liter
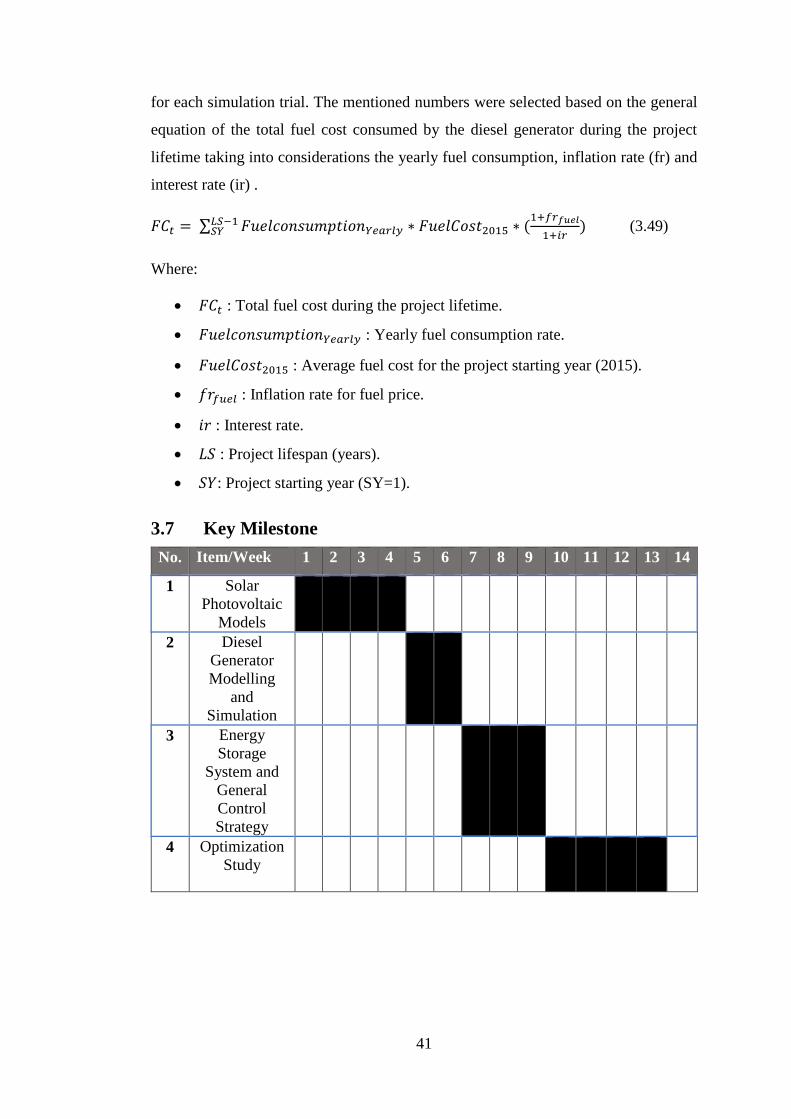
41
for each simulation trial. The mentioned numbers were selected based on the general
equation of the total fuel cost consumed by the diesel generator during the project
lifetime taking into considerations the yearly fuel consumption, inflation rate (fr) and
interest rate (ir) .
𝐹𝐶𝑡 = ∑ 𝐹𝑢𝑒𝑙𝑐𝑜𝑛𝑠𝑢𝑚𝑝𝑡𝑖𝑜𝑛𝑌𝑒𝑎𝑟𝑙𝑦𝐿𝑆−1𝑆𝑌 ∗ 𝐹𝑢𝑒𝑙𝐶𝑜𝑠𝑡2015 ∗ (
1+𝑓𝑟𝑓𝑢𝑒𝑙
1+𝑖𝑟) (3.49)
Where:
𝐹𝐶𝑡 : Total fuel cost during the project lifetime.
𝐹𝑢𝑒𝑙𝑐𝑜𝑛𝑠𝑢𝑚𝑝𝑡𝑖𝑜𝑛𝑌𝑒𝑎𝑟𝑙𝑦 : Yearly fuel consumption rate.
𝐹𝑢𝑒𝑙𝐶𝑜𝑠𝑡2015 : Average fuel cost for the project starting year (2015).
𝑓𝑟𝑓𝑢𝑒𝑙 : Inflation rate for fuel price.
𝑖𝑟 : Interest rate.
𝐿𝑆 : Project lifespan (years).
𝑆𝑌: Project starting year (SY=1).
3.7 Key Milestone
No. Item/Week 1 2 3 4 5 6 7 8 9 10 11 12 13 14
1 Solar
Photovoltaic
Models
2 Diesel
Generator
Modelling
and
Simulation
3 Energy
Storage
System and
General
Control
Strategy
4 Optimization
Study

42
3.8 Gantt Chart
No. Item/Week 1 2 3 4 5 6 7 8 9 10 11 12 13 14
1 Project
Methodology
2 Extended
Literature
Review
Preparing
Progress
Report
3 Progress
Report
4 Pre-SEDEX
5 Preparing
Final
Dissertation
& Technical
Paper
6 Preparing
for Viva

43
CHAPTER 4 : RESULTS AND DISCUSSION
4.1 Hybrid System Feasibility Study
Project Location
The project location is selected to be 120 km form the shores of Sabah and Sarawak
state and in line with Bintulu City. The coordination of the selected location are:
Longitude: 4.088 latitude: 112.567. Figure 21 shows the proposed project location.
Figure 21 Project location map (Southeast China sea)
Ambient Temperature Profile at Southeast China Sea
The monthly average temperature profile data was obtained by using the database for
NASA Surface Meteorology and Solar Energy. The database was gathered and
analysed over 22 years by using several satellites for data collection and analysis. In
Figure 22, maximum, minimum, and average monthly temperature profile is
presented. Moreover, analysing the temperature profile of the project location will
determine the hybrid system topology that will be used in the project.

44
Figure 22 Temperature profile at Southeast China sea
Solar Irradiation and Daylight Hours at Southeast China sea
The monthly average solar irradiation and daylight hours are presented in Figure 23 to
determine the potential of solar energy and the amount of power that can be generated
by utilizing solar panels. Also, NASA Surface Meteorology and Solar Energy database
will help the author in identifying the parameters of a photovoltaic panels, average
daylight hours per month and battery sizing and capacitance for the photovoltaic panels
to ensure continuous supply of power during no-sun days.
Figure 23 Hours of daylight-solar irradiation at Southeast China sea
Wind Profile at Southeast China Sea
One of the most important key points of the feasibility study is to identify the wind
profile and solar irradiation levels in the selected region. Moreover, the analysis of
both profiles will determine the total electrical power production of the system. In
22
23
24
25
26
27
28
29
1 2 3 4 5 6 7 8 9 10 11 12
Tem
p (
°C)
Months of the year
Monthly Minimum, Maximum and Average Temperature
at Southeast China Sea
22-year Average Minimum Maximum
0
1
2
3
4
5
6
7
0
4
8
12
16
1 2 3 4 5 6 7 8 9 10 11 12
Sola
r Ir
radia
tion (
W/m
2)
Dyal
ight
Hours
(h)
Months of the year
Solar Irradiation and Daylight Hours at Southeast China
Sea
Daylight Hours (h) Solar Irradiation (W/m2)

45
Figure 24, solar irradiation and wind speed profiles are presented. It can be shown that
wind speed profile does not have a regular patterns just like the solar irradiance profile.
Hence, both solar energy and wind energy will be considered for the project to achieve
the best result regarding the total power generated from the system.
Figure 24 Solar irradiation and wind speed profiles at Southeast China sea
4.2 Solar Photovoltaic Models
4.2.1 The First Model
Simpowersystems™ block representation were used to implement the mathematical
equations described in section 4.2 of the methodology. Integration between the
mathematical model and the power system model is achieved and the simulation was
applied in no-load environment. The detailed model is illustrated in Figure 25.
0
1
2
3
4
5
6
7
0
0.5
1
1.5
2
2.5
3
3.5
4
4.5
5
1 2 3 4 5 6 7 8 9 10 11 12
Sola
r Ir
radia
tion (
W/m
2)
Win
d s
pee
d a
t open
wat
er (
m/s
)
Months of the Year
Solar irradiation and Wind Speed at Project Location
Wind speed at open water (10m) Solar Irradiation (W/m2)

46
Figure 25 The First solar photovoltaic model
The solar photovoltaic module was built based on the manufacturer datasheet of
Solarex-MSX60 60Wp Solar Module. The module output voltage depends on the
variations in solar irradiance levels (Ir) as well as the operating temperature (Top). No
load I-V graphs were created by simulating the first model with various irradiation
levels as well as various operating temperatures and the graphs characteristics are
shown in Figures 26 and 27 respectively.
Figure 26 I-V curve with fixed operating temperature and different irradiation
0
0.5
1
1.5
2
2.5
3
3.5
4
0 5 10 15 20 25
Curr
ent
(Am
ps)
Voltage (Volt)
Top = 25°C and Different Irradiance
Ga = 1000 W/m2Ga = 800 W/m2Ga = 600 W/m2Ga = 400 W/m2

47
Figure 27 I-V curve with fixed irradiation and different operating temperatures
4.2.2 The Second Model
The second model was built and simulated in Matlab/Simulink environment to attach
an output variable resistance to the single solar photovoltaic module implemented in
the first model. The second model is presented in Figure 28. Moreover, a ramp function
was used to vary the value of the resistance and the output results are obtained in Figure
29. The resistance value used in the second model was 5.2 ohms and the ramp function
slope was 2.5 with zero start time.
Figure 28 The second model for a single solar photovolrtaic module
0
0.5
1
1.5
2
2.5
3
3.5
4
4.5
0 5 10 15 20 25
Curr
ent
(Am
ps)
Voltage (Volt)
Under Ga= 1000 W/m2 and different Top
Top = 0°C
Top = 25°C
Top = 50°C
Top = 75°C
Top = 100°C

48
Figure 29 Power, current, and voltage output values for the second model
4.2.3 The Third Model-Buck Convertor and MPPT Controller
The third model was implemented to control the solar array system output voltage
regardless of the values of the load resistance. The model schematic is shown in Figure
30. The third model is constructed of a solar photovoltaic system of 2 parallel arrays
with 10 series modules in each array. The maximum output power Pmpp from the
system is calculated to be 1100 watts according to Solarex-MSX60 60Wp Solar
Module characteristics used in the model.
Figure 30 The third model with buck convertor and controller
The model was tested in standard conditions; irradiation level of 1000 w/m2 and
operating temperature of 25° C, and the module values was obtained from the first and
second models. The internal structure of each block diagram in the third model is

49
illustrated in Figures 31, 32 and 33 respectively. In Figure 31, the PV array and PV
single module are presented. A smoothing capacitor of 1200 uf was added to the
reference PV single module to filter the output voltage signal which is going to be used
as an input value to the controller.
Figure 31 Solar photovoltaic system schematics
Figure 32 Fractional open-circuit voltage MPPT algorithm
In Figure 32, the MPPT algorithm and the controller is used to dynamically adjust the
switching frequency of the buck convertor. PI controller gains used in the model are
Kp = 10, Ki = 5. Moreover, the fractional value K used in the algorithm is 0.73 for
Solarex-MSX60 60Wp Solar Module.

50
Figure 33 Buck convertor Simulation blocks
In Figure 33, a voltage source convertor (VSC) is used to control the output voltage.
The convertor is being switched by the controller. The values used for the buck
convertor are illustrated in Table 6.
Table 6 Buck convertor parameters
Parameter Value
𝑉𝑖𝑛 171𝑉𝑜𝑙𝑡
𝑃𝑜 1100𝑊𝑎𝑡𝑡
𝐷 0.6
𝐼𝑜 11.6𝐴𝑚𝑝𝑠
𝐿 1.7𝑚𝐻
𝐶 0.56𝑢𝑓
Based on the calculations, the buck convertor input voltage and input current are
170 V and 6.5 A respectively. Hence, the output voltage and current are 100 V and
11.6 A respectively.
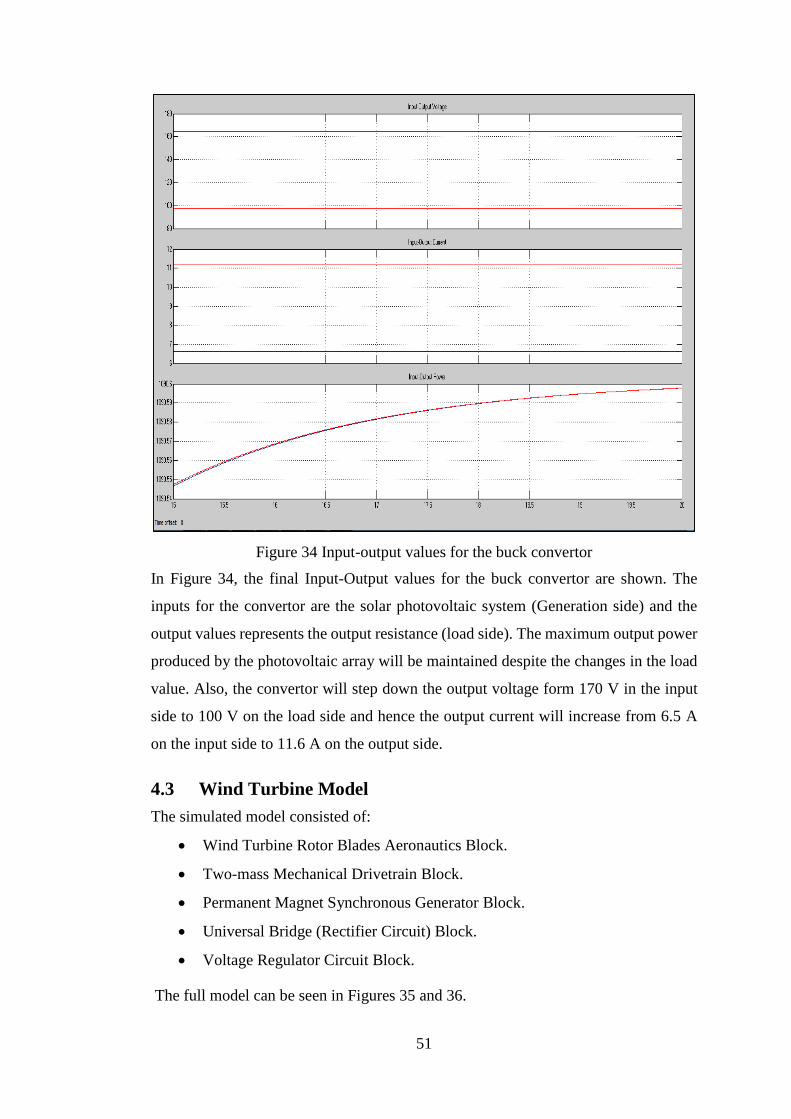
51
Figure 34 Input-output values for the buck convertor
In Figure 34, the final Input-Output values for the buck convertor are shown. The
inputs for the convertor are the solar photovoltaic system (Generation side) and the
output values represents the output resistance (load side). The maximum output power
produced by the photovoltaic array will be maintained despite the changes in the load
value. Also, the convertor will step down the output voltage form 170 V in the input
side to 100 V on the load side and hence the output current will increase from 6.5 A
on the input side to 11.6 A on the output side.
4.3 Wind Turbine Model
The simulated model consisted of:
Wind Turbine Rotor Blades Aeronautics Block.
Two-mass Mechanical Drivetrain Block.
Permanent Magnet Synchronous Generator Block.
Universal Bridge (Rectifier Circuit) Block.
Voltage Regulator Circuit Block.
The full model can be seen in Figures 35 and 36.

52
Figure 35 Wind turbine model
Figure 36 Internal structure of the wind turbine model
4.3.1 Wind Turbine Rotor Blades Aeronautics Block
The model was structured in the Matlab/Simulink environment and it can be used to
simulate the effect of wind speed variations on wind turbine output power as shown in
Figure 37. Also, the aeronautic block is used to calculate the output torque from the
wind turbine blades which will result in an input torque to the mechanical drivetrain
model.
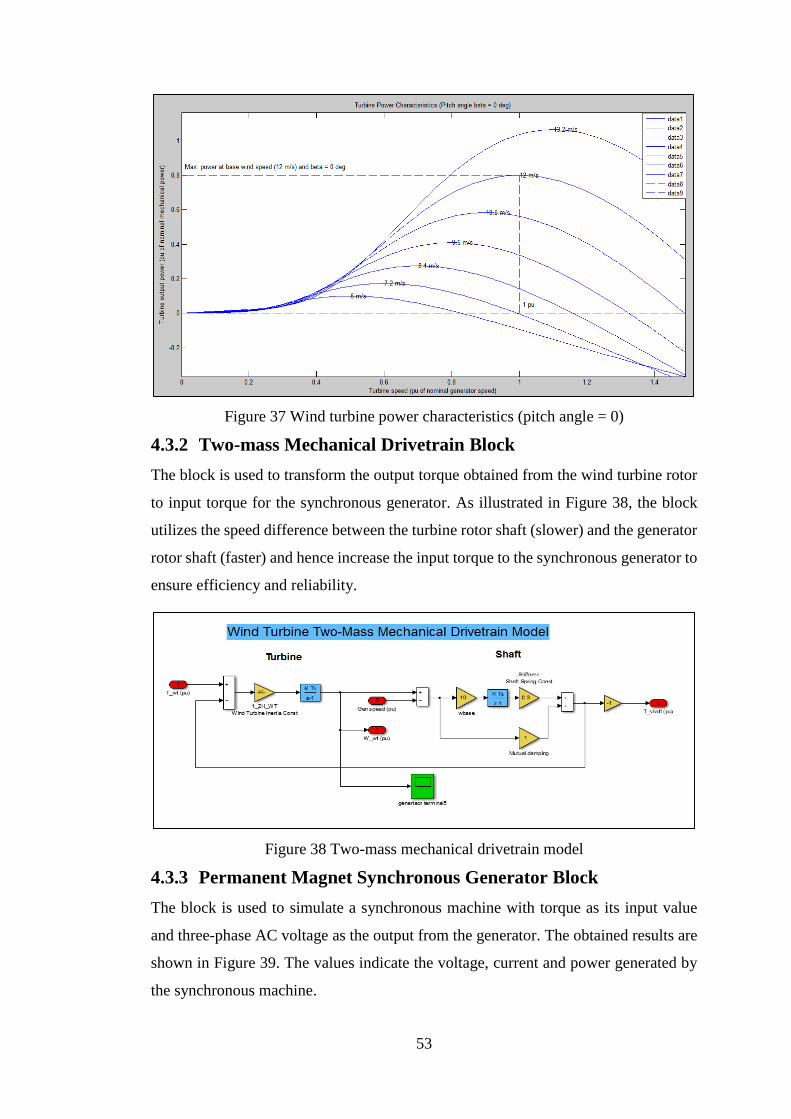
53
Figure 37 Wind turbine power characteristics (pitch angle = 0)
4.3.2 Two-mass Mechanical Drivetrain Block
The block is used to transform the output torque obtained from the wind turbine rotor
to input torque for the synchronous generator. As illustrated in Figure 38, the block
utilizes the speed difference between the turbine rotor shaft (slower) and the generator
rotor shaft (faster) and hence increase the input torque to the synchronous generator to
ensure efficiency and reliability.
Figure 38 Two-mass mechanical drivetrain model
4.3.3 Permanent Magnet Synchronous Generator Block
The block is used to simulate a synchronous machine with torque as its input value
and three-phase AC voltage as the output from the generator. The obtained results are
shown in Figure 39. The values indicate the voltage, current and power generated by
the synchronous machine.

54
Figure 39 Permanent magnet synchronous generator output values
4.3.4 Universal Bridge (Rectifier Circuit) Block
A universal bridge block was added as an AC-DC convertor for the output voltage of
the synchronous machine. The full-wave convertor implements ideal diodes as the
main switching devices. The results of the rectified voltage, current, and power values
are shown in Figure 40.
Figure 40 The Rectified values of synchrnous generator output values

55
4.3.5 Voltage Regulator Circuit Block
Voltage regulator circuit block was implemented to regulate the DC output voltage
from the rectifier circuit into 24VDC as the most common DC supply voltage for
instrumentation and control devices. The voltage regulator circuit consists of Zener
diode, NPN Transistor to control the switching, Op-amp amplifier to control the
transistor switching signals and two resistance in parallel to control the output voltage
value according to the formula:
𝑉𝑜𝑢𝑡 = 𝑉𝐵𝑟𝑒𝑎𝑘𝑑𝑜𝑤𝑛 ∗ 𝑅1+𝑅2
𝑅2 (5.3.5.1)
Where:
𝑅1: The first resistor value
𝑅1: The second resistor value
𝑉𝐵𝑟𝑒𝑎𝑘𝑑𝑜𝑤𝑛 : Zener Diode breakdown voltage value
The voltage regulator block used in the simulation is shown in Figure 41. The output
regulated values for voltage, current and power are concluded in Figure 42.
Figure 41 Wind turbine voltage regulator block

56
Figure 42 Regulated values of the wind turbine model
4.4 Diesel Generator
The diesel generator modelling and simulation process was achieved using
Matlab/Simulink software. The simulation has been implemented to analyze the
performance of the diesel generator and the contribution of the excitation system, the
speed governor, and the automatic voltage regulator towards increasing the
performance and reliability of the system. The diesel generator model showed high
stability and reliability while varying the output loads. Moreover, the final control
parameters were achieved to stabilize the system output voltage as well as the output
electrical active power which will be supplied to the load.
In addition to that, the speed, output voltage, generator field voltage, and output active
power waveforms were captured and the performance of the generator was stable
during the simulation process. The complete model of the diesel generator is shown in
Figures 43,44,45,46 and 47.

57
Figure 43 Diesel generator Simulink model
Figure 44 Mechanical vs electrical output power of the diesel generator

58
Figure 45 Reference voltage (Vref) vs field voltage (Vf) for the synchronous
generator
Figure 46 Reference speed (Wref) vs adjusted speed (Wm)

59
Figure 47 Synchronous Generator Output Voltage

60
4.5 Optimization Study
Prior to running the simulation on HOMER software, the parameters of the hybrid
power system components were inserted. Furthermore, wind speed profiles, solar
irradiation levels and diesel prices were added to present the actual meteorological
data of the project location. In addition to that, the total cost (CC) parameters were
calculated and the results were simulated along with the optimization model to achieve
the optimal design and sizing for the hybrid system. In Table 7, the solar PV module
parameters are listed. The parameters will be used for the optimization study of the
system.
Table 7 Solar PV optimization parameters
Module rated power (watt) 300 W
Module lifetime (years) 20 years
Module efficiency (%) 13 %
Module capital cost ($) 500 $
Module replacement cost ($) 400 $
Module OMC ($) 0 $
Number of modules for the simulation 1-10 units
Nominal operating temperature (°C) 25° C
Fixed percentage of replacement (%) 0.0112 %
Average annual irradiation level (Kwh/𝑚2/d) 4.97 (Kwh/𝑚2/d)
Project latitude 4.008
Project longitude 112.567
Table 8 shows the wind turbine parameters used in the optimization model. The wind
turbine used is a 1 kW horizontal axis Future Energy wind turbine.

61
Table 8 Wind turbine optimization parameters
Manufacturer Future Energy
Turbine model AF1-24v-0125 (406 PMG)
Turbine Blades 3 blades
Startup Wind Speed 2 m/s
Charging Initiation Wind Speed 3 m/s
Rated power (Kw) 1 Kw DC
Lifetime (years) 15 years
Capital cost ($) 3000 $
Replacement cost ($) 2500 $
OMC ($) 50 $
Number of modules for the simulation 1-3 units
Fixed percentage of replacement (%) 0.0112 %
Hub height (m) 6 m
Annual average wind speed (m/s) 4.5 m/s
Project latitude 4.008
Project longitude 112.567
The diesel generator parameters are shown in Table 9. The diesel generator will be
utilized in the project as a backup generation set and the renewable fraction of
generation will depend on the diesel fuel price as well as the metrological data.
Table 9 Diesel generator optimization parameters
Rated power (Kw) 1 Kw AC
Lifetime (operating hours) 15000
Capital cost ($) 1500 $
Replacement cost ($) 1200 $
OMC ($/hr) 0.05 $
Number of modules for the simulation 1-2 units
Fixed percentage of replacement (%) 0.0112 %
Maximum load ratio (%) 30 %
Generator fuel Diesel
Carbon monoxide emission factor (g/l) 6.5
Diesel Price ($/L) 0.35-0.6 ($/L)

62
In Table 10, the battery bank and AC/DC convertor parameters are listed. Battery bank
used in the optimization model is Vision 6FM200D and the detailed characteristics are
mentioned below.
Table 10 Battery and convertor optimization parameters
Battery nominal voltage (V) 12 V
Battery nominal capacity (Ah) 200 Ah (2.4 kWh)
Battery lifetime throughput (kWh) 917 kWh
Battery capital cost ($) 250 $
Battery replacement cost ($) 200 $
Battery OMC ($) 20 $
Number of battery modules for the optimization 1-12 units
Fixed percentage of replacement (%) 1 %
Convertor rated power (kW) 1 kW
Number of convertor modules for the optimization 1-3 units
Convertor capital cost ($) 1000 $
Convertor replacement cost ($) 1000 $
Convertor OMC ($) 100 $
Convertor lifetime (years) 15 years
Convertor efficiency 85-90 %
The optimization model results are shown in Figure 48 where the complete hybrid
power system schematic and the optimal system components are presented.
Figure 48 Optimization model results
In Figure 49, a detailed look on the proposed optimal system components is presented.
It can be seen that there are four proposed designs for the system which fulfill the cost
objective function. However, the first proposed design is the most optimum design for

63
the hybrid power system in terms of cost reduction. Despite the increase in the
renewable fraction of the second design to 60 %, the first design is proved to be the
lowest cost with a renewable fraction of 45 %.
Figure 49 Optimal hybrid power system components
The detailed cash flow for the optimum design is shown in Table 11. PV-diesel hybrid
power system achieves the best results for cost reduction without the wind turbine. The
main reason behind the result is the low average wind speed for the project selected
location comparing with world average wind speed.
Table 11 Project cash flow summary
Capital
($)
Replacement
($) OMC ($)
Fuel
($)
Salvages
($) Total ($)
PV 3,333 0 0 0 0 3,333
Diesel
Generator 1,500 3,154 2,159 4,983 -367 11,430
Vision
6FM200D 1,250 3,923 1,147 0 -179 6,141
Convertor 1,000 417 1,147 0 -208 2,356
System 7,083 7,494 4,453 4,983 -754 23,261
In addition to the cost consideration, the hybrid system performance is examined in
Figure 50, 51, 52, and 53 respectively. In Figure 50, the hybrid system electrical
performance is examined with total PV generation of 46 % comparing with 54 % of
diesel generation. Also, the total excess electricity per year is 376 kWh/year which
represents about 5.38 % of the total generated power from the hybrid system.

64
Figure 50 Hybrid system electrical performance
In Figure 51, the solar photovoltaic module performance is illustrated. With a rated
capacity of 2 kW and mean output power of 8.83 kWh/day, the total PV production is
3222.95 kWh/year. Also, the total hours of operation is 4470 hours/year.
Figure 51 Solar photovoltaic module performance
In Figure 52, the yearly diesel generator performance is shown. With a 3756 hours of
operation and total generated power of 3761 kWh/year, the diesel generator contributes
with 54 % of the total power production of the hybrid power system. Moreover, the
generator yearly fuel consumption is 1241 liters with a mean electrical efficiency of
30.8 %.

65
Figure 52 Diesel generator electrical performance
In Figure 53, the battery storage system performance is shown with detailed analysis
of battery state of charge, battery lifetime and utilized battery bank size. The battery
expected lifetime is 2.69 years with energy in and energy out of 1897 and 1523
kWh/year respectively. Furthermore, the average energy cost of the battery bank (5
batteries) is estimated to be 0.062 $/kWh.
Figure 53 Battery electrical performance
An additional study has been performed in the system along with the cost objective
function which is the sensitivity study. The sensitivity study measures and analyzes

66
the effect of changing the values of system inputs on the optimum design components.
For example, changing the average annual wind speed, changing the average annual
solar irradiation level or changing the diesel price per liter. The project main objective
was to achieve the lowest cost and it was mainly focused on the diesel price as an
indicator to this objective.
In the project, a sensitivity analysis was carried out on the hybrid system by varying
the fuel price (diesel) per liter and running the optimization study for all the proposed
values. Also, the sensitivity analysis had another variable to be considered during the
simulation which is the changing in the nominal operating temperature of the solar
photovoltaic modules. As it was discussed in the literature review of the project, the
efficiency of the solar panel are greatly affected by the changing in the nominal
operating temperature of the ambient environment. Hence, various operating
temperatures were considered for the operation of the hybrid system. The effects of
both sensitivity factor on the performance of the hybrid system are illustrated in
Figures 54 and 55.
Figure 54 Renewable fraction vs Diesel generator production
In Figure 54, the solar photovoltaic total electrical production vs the diesel generator
electrical production is examined. By using a sensitivity factor and varying the diesel
price as well as the nominal operating temperatures for the solar panels, it can be seen
that after a diesel price of 0.5 $/L, the value of the solar production will be increased
and the value of the diesel production will be decreased. In other words, the optimum
design of the hybrid system above 0.5 $/L for diesel price is aiming towards the
renewable sources of energy which can maintain the system supply with the lowest
cost.

67
However, by increasing the renewable energy production of the system, the capital
cost will increase as a result of the commissioning and installation costs of new solar
panels. On the contrary, the annual operation and maintenance cost of the hybrid
system will be significantly decreased by implementing renewable sources as
indicated in Figure 55.
Figure 55 Total capital cost of the system vs total electrical production
Figure 56 Annual operation and maintenance cost vs total production
In Figure 56, the annual operation and maintenance costs are significantly decreased
after 0.5 $/L for the diesel price because the hybrid system will implement a more
renewable sources approach which will decrease the fuel consumption and
consequently the annual operating costs.

68
CHAPTER 5 : CONCLUSION AND RECOMMENDATIONS
Based on the project and its main objectives, a hybrid power system is suitable for
installation and operation in the offshore environment of Malaysia. Moreover, the
modelling study as well as the optimization study suggested that the hybrid system
efficiency can be significantly increased by a proper and efficient utilization of the
solar photovoltaic models in the system. Such an implementation would require a more
efficient solar panels, a precise charging and converting control system and a well
sized battery bank to preserve the excess generated power.
In addition to that, wind turbines utilization in Malaysia has proved to be less efficient
than the solar photovoltaic models. As it was indicated in the literature review, the
main reason for that is the low average wind speed in Malaysia comparing to other
parts and countries in the world. However, by enhancing the control system of the
implemented wind turbines, more energy can be harvested form the wind speed and
hence a consistent, cheap and powerful supply of electricity could be ensured.
Furthermore, the diesel generator has proved to be a main backup for the hybrid system
especially during the unfavorable climatic conditions which may affect the operation
of wind turbines as well as solar photovoltaic panels. Also, the selection and sizing of
the diesel generator, along with other hybrid system components, should be carried out
after a detailed study about the offshore installation current load profile taking into
considerations the future loads as well as the decreasing efficiency of the system while
increasing the project lifetime.
Likewise, the optimization study has concluded that the fuel price of the diesel
generator set will affect greatly the operation of the hybrid power system. By
increasing the fuel price of the diesel generator, the dependence on the generator in
supplying the offshore installations loads will be decreased. On the contrary, the
renewable faction of the hybrid system will be increase by installing new solar panels
or wind turbines which throughout the project life time will be much economically
justified than using the diesel generator.
Finally, the implementation of the proposed hybrid power system in the Malaysian
offshore environment would have significant effects on offshore oil and gas
operations. An effect which not only will be limited to the total reduction in costs but
also reducing the emissions and preserve the environment.

69
REFERENCES
[1] D. B. Evans and E. F. Yong, "Environmental Issues in Oil and Gas Development in
Malaysia."
[2] C. K. Seong and T. Y. Hong, "A Review Of Offshore Oil Fields Development In
Malaysia."
[3] C. C. Wan, "Use Of Unmanned Platforms In An Offshore Environment."
[4] R. Rongsopa, "Hybrid Power Generation for Offshore Wellhead Platform: A Starting
Point for Offshore Green Energy."
[5] W. Zhou, "Simulation and optimum design of hybrid solar-wind and solar-wind-diesel
power generation systems," 3313069 Ph.D., Hong Kong Polytechnic University
(Hong Kong), Ann Arbor, 2008.
[6] E. Lorenzo, "Solar Electricity Engineering of Photovoltaic Systems," Artes Graficas
Gala, vol. S.L., 1994.
[7] G. Walker, ""Evaluating MPPT converter topologies using a MATLAB PV model” "
Journal of Electrical & Electronics Engineering, Australia, IEAust,vol.21,
pp.49-56, 2001.
[8] W. Schmitt, "Modeling and simulation of photovoltaic hybrid energy systems
optimization of sizing and control," in Photovoltaic Specialists Conference, 2002.
Conference Record of the Twenty-Ninth IEEE, 2002, pp. 1656-1659.
[9] S. M. S., "Modeling and Simulation of Photovoltaic module using
MATLAB/Simulink," International Journal of Chemical and Environmental
Engineering, vol. Volume 2, 2011.
[10] T. Ackermann, "Wind Power in Power Systems," Wiley, England, p. 1120, 2012.
[11] H. F. Fujita, T Sekine, H. Senjyu, T. Sakamoto, R Urasaki, N. , "Output Power
Levelling of Wind Turbine Generator for All Operating Regions by Pitch Angle
Control. ," IEEE Transactions on Energy Conversion, vol. 21, pp. 467-475, 2006.
[12] B. W. E. Association, "Environmental Impacts of Wind-Energy Projects," 2006.
[13] M. M. Karrari, O. Rosehart, W., "Comprehensive Control Strategy for a Variable
Speed Cage Machine Wind Generation Unit," IEEE Transactions on Energy
Conversion, vol. 20, pp. 415-423, 2005.
[14] P. V. B. Bongers, G. , "Wind turbine control design and implementation based on
experimental models. ," IEEE vol. 2, pp. 2454-2459, 1992.
[15] J. Martinez, "Modelling and Control of Wind Turbines," Department of Chemical
Engineering and Chemical Technology, Imperial College London, 2007.
[16] R. H. Harrison, E. Snel, H. , "Large Wind Turbines. ," Wiley, England., 2000.
[17] M. F. Balas, L. Johnson, K. Pao, L. , "Control of Variable-Speed Wind Turbines:
standard and adaptive techniques for maximizing energy capture," IEEE Control
Systems Magazine, vol. 26, pp. 70-81, 2006.
[18] A. M. a. A. H. Al-Badi, "“Economics of wind turbine as an energy fuel saver a case
study for remote application in oman”," Energy, vol. 34, pp. 1573-1578,2009.

70
[19] A. D. G. a. U. Hassan, "“what is power quality?,” in Proceedings of the 10-th british
Wind Energy Association Conference, D.J. Milborrow, London, March 1998,
pp.22 24.
[20] M. d. r. n. d. Q. ebec, "“Strat´ egie´ energ´ etique,” http://www. mrnf. gouv. qc.
ca/energie/´strategie/ index.jsp, December 2011"
[21] R. N. B. S. A. Jalilvand, ""Design of a multilevel control strategy for integration of
stand-alone wind/diesel system,"" Interntional Journl of Electrical Power & Energy
Systems, vol. 35, pp. 123-137, February 2012.
[22] R. L. Lawrence, "Principles of Alternating Current Machinery ,2nd ed. The University
of Michigan,Michigan : McGraw-Hili Book Company,Inc.,1920,2006"
[23] S. J. Chapman, "Electric Machinery Fundamentals, 5th ed. New York,USA: McGraw-
Hili Companies,Incorporated,2011,2011"
[24] B. R. H. M. R. Jongerden, ""Battery Modeling," University of Twente, Twente,The
Netherlands ,Technical Report 2012.
[25] I. R. JAOliver, JA. Cobos R.Prieto, ""Generic Battry Model based on a Paramaetric
Implementation," Universidad Potecnica de Madrid 1 Centro de Electronica Industrial,
Madrid, 2010"
[26] A. Y. Azman, A. A. Rahman, N. A. Bakar, F. Hanaffi, and A. Khamis, "Study of
renewable energy potential in Malaysia," in Clean Energy and Technology (CET),
2011 IEEE First Conference on, 2011, pp. 170-176.
[27] K. S. e. aI, "Building Integrated Photovoltaic (BIPV) in Malaysia – Potential, Current
Status Strategies For Long Term Cost Reduction," ISESCO JOURNAL OF SCIENCE
AND TECHNOLOGY, vol. 1, 2005.
[28] M. Z. H. e. al., "Monitoring results of Malaysian Building Integrated PV Project in
Grid-connected Photovoltaic system in Malaysia," Energy and Power, vol. 2,
pp. 39 45, 2012.
[29] O. Authority for Electricity Regulation, "Study on Renewable Energy Resources,"
Tech. Rep. 66847-1-1, 12.05.2008.
[30] K. S. A. Baharuddin, C. H. Yen, S. Mat, and A. Zaharim, "Key success factors in
implementing renewable energy programme in Malaysia," WSEAS Transactions on
Environment and Development, Algarve, Portugal, vol. 4, pp. 1141- 1150,
December 2008 [4th IASME/WSEAS International Conference on Energy,
Environment, Ecosystems and Sustainable Development (EEESD'08) 2008.
[31] S. Mekhilef and D. Chandrasegaran, "Assessment of off-shore wind farms in
Malaysia," in TENCON 2011 - 2011 IEEE Region 10 Conference, 2011,
pp. 1351 1355.
[32] a. S. M. S. M. A. Elhadidy, "Parametric study of hybrid (wind+solar+diesel) power
generating systems," Renewable Energy, vol. 21, pp. 129–139, October 2000 2000.
[33] F. Sulaiman, "Renewable energy and its future in Malaysia: a country paper," [In:
Proc. of Asia-Pacific Solar Experts Meeting, 1995], 1995.
[34] Z. A. Z. E. P. Chiang, P. A. Aswatha Narayana, and K. N. Seetharamu, "The potential
of wave and offshore wind energy in around the coastline of Malaysia that face the
South China Sea," International Symposillm on Renewable Energy: Environment

71
Protection & Energy Soilltion for Sustainable Development, Kuala Lumpur, Malaysia,
September 2003 2003.
[35] P. B. Maria Kalogera, "Optimization of an Off-grid Hybrid System for Supplying
Offshore Platforms in Arctic Climates," The 2014 International Power Electronics
Conference, 2014.
[36] M. a. S. Singh, S. , "Dynamic Models for Wind Turbines and Wind Power Plants,"
National Renewable Energy Labratory, 2011.