asean equity fund - saturna.com.my · malaysian ringgit will remain unchanged after the...
TRANSCRIPT

ASEAN Equity Fund
Quarterly Report 30 September 2016(unaudited)
Fund ManagerSATURNA SDN BHD (342171-V)Suite 5-03, 5th Floor, Menara Atlan161B Jalan Ampang, 50450 Kuala LumpurTel: (603)2164 5303 Fax: (603)2164 5308Email: [email protected] Website: www.saturna.com.my
TrusteeSCBMB Trustee Berhad (1005793-T)

2 ASEAN Equity Fund Quarterly Report 30 September 2016
CONTENTS
1. FUND MANAGER'S REPORT 3
Fund Name 3
Type of Fund 3
Category of Fund 3
Investment Objective 3
Distribution Policy 3
Breakdown of Unit Holdings By Size 3
Performance Benchmark 3
Fund Performance 3
Financial Performance 4
Average Total Return 4
Stock Market Review 5
Market Outlook and Investment Strategy 5
Asset Allocation of The Fund 5
2. STATEMENT BY FUND MANAGER 6
3. STATEMENT OF FINANCIAL POSITION 7
4. STATEMENT OF COMPREHENSIVE INCOME 8
5. STATEMENT OF CHANGES IN NET ASSET VALUE 9
6. STATEMENT OF CASH FLOWS 10
7. INVESTMENTS 11-12
8. NOTES TO FINANCIAL STATEMENTS 13-15
9. CORPORATE INFORMATION 16
Investors are advised to read the Fund’s Information Memorandum and understand the risks and fees involved and, if necessary, consult their professional adviser before investing. To obtain an Information Memorandum and other important information about Saturna Sdn Bhd’s ASEAN Equity Fund, please visit www.saturna.com.my or call our Kuala Lumpur office at 603 2164 5303.
Past performance of a fund should not be taken as indicative of its future performance.
Where a unit split or distribution is declared, investors are advised that following the issuance of additional units or distribution, the Net Asset Value (“NAV”) per unit will be reduced from pre-unit split or pre-distribution NAV to post-unit split NAV or ex-distribution NAV. Where a unit split is declared, investors should be aware of the fact that the value of their investment in Malaysian ringgit will remain unchanged after the distribution of the additional units.
The Information Memorandum as of 07-FEB-2014 has been lodged with the Securities Commission Malaysia who takes no responsibilities for its contents.
Units of the fund will only be sold to properly qualified investors upon receipt of an application form in good order and accompanying a copy of the Information Memorandum.
Investments in the Fund are exposed to security risk, in addition to price levels risk, concentration risk, country risk, currency risk, active investment risk, and Sharia non-compliance risk.
The Dow Jones Islamic Market ASEAN Index measures the stock performance of companies in the ASEAN region that pass rules-based screens for compliance with Islamic principles. The index covers Indonesia, Malaysia, Philippines, Singapore, Thailand, and Vietnam.
Saturna Sdn Bhd is a wholly-owned subsidiary of Saturna Capital Corporation of the United States of America.

30 September 2016 Quarterly Report ASEAN Equity Fund 3
1. FUND MANAGER’S REPORT
FUND NAME
ASEAN Equity Fund (“the Fund”)
TYPE OF FUND
Growth Fund
CATEGORY OF FUND
Shariah-compliant Equity (wholesale)
INVESTMENT OBJECTIVE
To achieve long-term capital growth by investing in Southeast Asian markets.
DISTRIBUTION POLICY
Subject to availability of income, distributions will be made on a yearly basis.
Any distributions shall be automatically reinvested in additional Units at the date of distribution, unless the Unit Holder specifically requests, in the application or in writing, for distributions to be made via cash payment. Any unclaimed distribution cheques will be automatically reinvested in additional Units at the expiry of the six-month validity period for cheques, based on the prevailing Net Asset Value (NAV) seven (7) Business Days after the validity period of the cheques.
BREAKDOWN OF UNIT HOLDINGS BY SIZE
Units No. of Unit holders % Unit holdings %
50,001 to 100,000 1 20.00 93,730 0.88
100,001 to 500,000 2 40.00 528,867 4.99
500,001 to 1,000,000 1 20.00 500,770 4.72
1,000,001 & above 1 20.00 9,481,620 89.41
Total 5 100.00 10,604,987 100.00
PERFORMANCE BENCHMARK
Dow Jones Islamic Market ASEAN Total Return Index (“the Benchmark”)
FUND PERFORMANCE
For the period 1 July 2016 - 30 September 2016, the Fund registered a return of 1.65%, as compared to the Benchmark’s 4.17%. Since inception on 7 February 2014, the Fund registered a return of 13.72%, as compared to the Benchmark’s 23.14%.
The underperformance was due to lower equity allocation in a rising equity environment and selection of certain stocks. Generally, we have a long-term positive view on our stock holdings.
-5%
0%
5%
10%
15%
20%
9/30/1
6
6/30/1
6
3/31/1
6
12/31/1
5
9/30/1
5
6/30/1
5
3/31/1
5
12/31/1
4
9/30/1
4
6/30/1
4
3/31/1
4
2/7/1
4
Performance of the FundFrom 7 February 2014 (inception date) to 30 September 2016
ASEAN Equity FundDow Jones Islamic Market ASEAN Total Return Index
25%

4 ASEAN Equity Fund Quarterly Report 30 September 2016
FINANCIAL PERFORMANCE (9 MONTHS ENDING)
As at 30 Sep 2016 30 Sep 2015 30 Sep 2014
Net Asset Value (RM) 12,059,845 11,416,942 10,778,165
Units in Circulation (units)
10,604,987 10,604,987 10,261,987
Net Asset Value / unit (RM)
1.1372 1.0766 1.0503
Highest NAV (RM) 1.1626 1.1110 1.0566
Lowest NAV (RM) 1.0396 1.0125 1.0377
Total Return
Capital growth 3.37% 1.30% 1.40%
Income distribution
- - -
Final Distribution
Gross Distribution/unit
- - -
Net Distribution/unit
- - -
Date of Distribution
- - -
Portfolio Composition
Quoted Equity Securities
84.91% 86.43% 74.71%
Other Liquid Assets
15.09% 13.57% 25.29%
Management Expense Ratio
1.15% 0.61% 0.40%
Portfolio Turnover Ratio
0.09 times 0.07 times 0.05 times
Management Expense Ratio
The management expense ratio for the current financial period is 1.15% .
Management Expense Ratio is derived from the following calculation:
MER = (A+B+C+D+E+F+G)
x100H
A = Administration Fee
B = Distribution Fee
C = Trustee Fee
D = Performance Fee
E = Audit Fee
F = Tax Agent’s Fee
G = Other Expenses
H = Average NAV of the Fund calculated on a daily basis
The average NAV of the Fund for the financial period calculated on a daily basis is RM11,668,320.86.
Portfolio Turnover Ratio
The portfolio turnover ratio for the current financial period is 0.09 times.
The portfolio turnover ratio is derived from the following calculation:
( Total acquisition for the financial year +
Total disposal for the financial year) ÷ 2
Average NAV of the Fund for the financial year calculated on a daily basis
Where:total acquisition for the financial period = RM 795,411.92total disposal for the financial period = RM 1,293,117.53
TOTAL RETURN (in %)
Total Return is based on NAV to NAV with distribution reinvested. Below is total return of the Fund as at 30 September 2016 since inception.
3 Months
6 Months
9 Months
1 Year
2 Years
Since Inception (07 Feb 14
– 30 Sep 16)
1.65% 5.19% 3.37% 5.63% 8.27% 13.72%
Note:Total Return of the Fund is derived by this formula:
([ End of Period FY Current Year
NAV per unit ] - 1 ) x100End of Period FY
Previous Year NAV per unit
AVERAGE TOTAL RETURN (in %)
Average Total Return is derived by the formula:
Average annualised return = [ (1 + total return) (1/number of years)] - 1
07 Feb 14 – 30 September 16 (Since Inception)
4.98%
Unit prices and return may fluctuate. Past performance is not indicative of future performance.
30 September 2016 Quarterly Report ASEAN Equity Fund 5
STOCK MARKET REVIEW
ASEAN equity markets staged another solid performance with The Dow Jones Islamic Market ASEAN Total Return Index measured in Malaysian Ringgit gaining 4.17% for the third quarter of 2016. Year to date, the index is up 6.68% as investors believe that, in a post-Brexit era the ASEAN region would offer better investment return over the long-run.
Indonesia in particular had a stellar run with the index surging 7.06% as the government’s tax amnesty program yielded results above expectation. Thailand also performed well in the quarter, up 3.71% as reduced political uncertainty and healthy Q2 GDP weighed on the market. Singapore and Malaysian equity markets gained 2.71% and 0.78% respectively. On the flipside, the Philippines market, which was a top performer in the previous quarter, was the only negative performer. The Philippines Stock Exchange Index declined by 1.74% as foreign investors turned skeptical on the government’s drug-trafficking policies and President Duterte’s increasingly anti-West rhetoric.
MARKET OUTLOOK AND INVESTMENT STRATEGY
China, which ASEAN countries heavily depend on for trade, posted some encouraging data in August and September 2016. The manufacturing PMI, an index that measures the performance of the manufacturing sector, came in at 50.4 in both months, highest since November 2014. By contrast, third quarter GDP is expected to have slowed slightly to 6.6% from 6.7% earlier in the year, as China attempts to cool the soaring property market while factory employment remains sluggish.
Elsewhere, the Bank of England may cut interest rates further as the UK economy remains shaky post-Brexit and the British Pound weakened to a 31-year low. Also, the euro zone PMI survey showed that business activity has slumped to its weakest level since January 2015. By contrast, US manufacturing activity remained healthy and the economy seemed to pick up steam. This, coupled with other positive economic data, signals that rate hikes could be in the cards. Notably, crude oil prices remain volatile amidst a supply glut and lack of clarity from OPEC.
As we move forward, Brexit dynamics, China’s recovery, oil and commodity prices, the health of the US economy, and the ongoing actions of the global central banks would continue to dictate investor sentiment. The results of the upcoming US elections could also have an impact on the global markets. We continue to be cautious but will look for exciting catalysts and take appropriate long – term positions to benefit the portfolio as a whole.
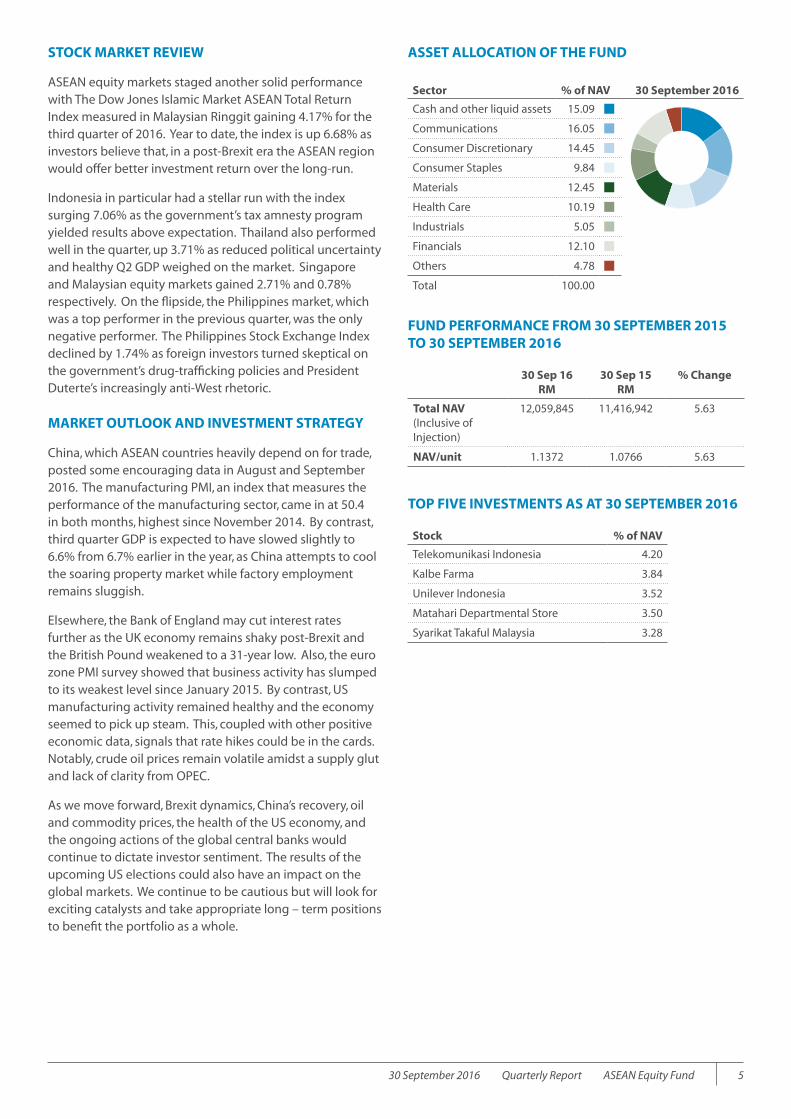
ASSET ALLOCATION OF THE FUND
Sector % of NAV 30 September 2016
Cash and other liquid assets 15.09
Communications 16.05
Consumer Discretionary 14.45
Consumer Staples 9.84
Materials 12.45
Health Care 10.19
Industrials 5.05
Financials 12.10
Others 4.78
Total 100.00
FUND PERFORMANCE FROM 30 SEPTEMBER 2015 TO 30 SEPTEMBER 2016
30 Sep 16RM
30 Sep 15RM
% Change
Total NAV (Inclusive of Injection)
12,059,845 11,416,942 5.63
NAV/unit 1.1372 1.0766 5.63
TOP FIVE INVESTMENTS AS AT 30 SEPTEMBER 2016
Stock % of NAV
Telekomunikasi Indonesia 4.20
Kalbe Farma 3.84
Unilever Indonesia 3.52
Matahari Departmental Store 3.50
Syarikat Takaful Malaysia 3.28

6 ASEAN Equity Fund Quarterly Report 30 September 2016
2. STATEMENT BY THE FUND MANAGER
For the interim period ended 30 September 2016 (unaudited)
We, Monem Salam and Dato’ Dr Lee Chee Kuon, being two of the directors of Saturna Sdn Bhd, do hereby state that, in the opinion of the Manager, the accompanying financial statements are drawn up in accordance with Malaysian Financial reporting Standards and the requirements of the Securities Commission’s Guidelines on Wholesale Funds in Malaysia so as to give a true and fair view of the financial position of ASEAN Equity Fund as at 30 September 2016 and of its financial performance and cash flows for the financial period then ended on that date and comply with the requirements of the Deed.
On behalf of the Board in accordance with a resolution of the Board of Directors of the Manager,
Monem Salam Dato’ Dr. Lee Chee Kuon President, Saturna Sdn Bhd Director, Saturna Sdn BhdPortfolio Manager
Kuala Lumpur, Malaysia4 November 2016

30 September 2016 Quarterly Report ASEAN Equity Fund 7
3. STATEMENT OF FINANCIAL POSITION
Opinion
In the opinion of the Fund Manager, the financial statements have been properly drawn up in accordance with the Malaysian Securities Commission’s Guidelines on Wholesale Funds so as to give a true and fair view of the financial position of the Fund as at 30th September 2016 and of its financial performance, the changes in net asset value and the cash flows of the Fund for the period then ended.
As at 30 September 2016
As at 31 December 2015
RM RM
Investments
Financial assets at fair value through profit or loss 10,240,537 10,486,505
Shariah-based deposits 1,780,481 -
12,021,018 10,486,505
Other Assets
Amount due from stockbrokers - -
Amount due from management company - -
Cash at bank 122,663 1,229,009
Other receivable 10,981 12,541
133,644 1,241,550
Total Assets 12,154,662 11,728,055
Liabilities
Amount due to manager 83,195 46,182
Amount due to trustee 511 1,567
Other payables 11,111 13,780
94,817 61,529
Net asset value attributable to unit holders 12,059,845 11,666,526
Total equity and liabilities 12,154,662 11,728,055
Number of units in circulation 10,604,987 10,604,987
Net asset value per unit 1.1372 1.1001

8 ASEAN Equity Fund Quarterly Report 30 September 2016
4. STATEMENT OF COMPREHENSIVE INCOME
For the financial period ended 30th September 2016
1 January 2016 to 30 September 2016
1 January 2015 to 30 September 2015
RM RM
Income
Profit from short-term Shariah-based deposits 36,731 46,895
Gross dividend income 279,161 252,248
Realised foreign exchange gain/(loss) (2,771) (744)
Unrealised foreign exchange gain/(loss) 2 11
Net realised gain/(loss) on sales of investment 62,960 (10,129)
Net unrealised gain/(loss) on changes of financial asset at fair value through profit or loss 188,778 (39,123)
564,861 249,158
Expenses
Administration fee 21,741 20,854
Distribution fee 21,741 20,854
Performance fee 52,637 6,789
Trustee's fee 4,348 4,171
Auditors' fee 8,235 7,479
Tax agent's fee 3,876 2,243
Administrative fees & expenses 21,456 5,450
134,034 67,840
Net profit before taxation 430,827 181,318
Taxation (37,508) (35,044)
Net profit after taxation 393,319 146,274
Net profit after taxation is made up as follows
Realised 204,539 185,386
Unrealised 188,780 (39,112)

30 September 2016 Quarterly Report ASEAN Equity Fund 9
5. STATEMENT OF CHANGES IN NET ASSET VALUE
For the financial period ended 30th September 2016
Unitholders’ Capital Retained Earnings Total Net Asset Value
RM RM RM
Net asset value as at 1st January 2015 10,271,620 644,948 10,916,568
Movement due to creation/(cancellation) of units during the period:
Creation of units 354,100 - 354,100
Cancellation of units - - -
Total comprehensive Income for the financial year - 146,274 146,274
Net asset value as at 30th September 2015 10,625,720 791,222 11,416,942
Unitholders’ Capital Retained Earnings Total Net Asset Value
RM RM RM
Net asset value as at 1st January 2016 10,625,720 1,040,806 11,666,526
Movement due to creation/(cancellation) of units during the period:
Creation of units - - -
Cancellation of units - - -
Total comprehensive Income for the financial year - 393,319 393,319
Net asset value as at 30th September 2016 10,625,720 1,434,125 12,059,845

10 ASEAN Equity Fund Quarterly Report 30 September 2016
6. STATEMENT OF CASH FLOWS
For the financial period ended 30th September 2016
1 January 2016 to 30 September 2016
1 January 2015 to 30 September 2015
RM RM
Cash flows from operating activities
Proceeds from sale of investments 1,293,117 253,557
Purchase of investments (795,412) (1,340,546)
Dividend received 240,694 205,376
Profit Murabahah received 36,481 47,936
Administration fee paid (23,003) (21,513)
Audit fee paid (11,836) (11,538)
Tax Agent fee paid (5,099) (3,373)
Performance fee paid (41,869) (64,665)
Trustee's fee paid (5,404) (2,727)
Distribution fee paid - (24,501)
Payment for other fees and expenses (13,534) (2,058)
Tax Recoverable - -
Net cash generated from/(used in) operating activities 674,135 (964,052)
Cash flows from financing activities
Proceeds from issuance of units - 354,100
Payments for cancellation of units - -
Net cash generated from/(used in) from financing activities - 354,100
Net increase/(decrease) in cash and cash equivalents 674,135 (609,952)
Cash and cash equivalents at beginning of the period 1,229,009 2,199,235
Cash and cash equivalents at end of the period 1,903,144 1,589,283
Cash and cash equivalents comprise:
Cash at bank 122,663 382,080
Shariah-based deposits 1,780,481 1,207,203
1,903,144 1,589,283

30 September 2016 Quarterly Report ASEAN Equity Fund 11
7. INVESTMENTS
Financial Assets held for trading as at 30th September 2016 are as detailed below:
Quantity (Units) Cost (RM) Market Value (RM) % of NAV
Communications
Advanced Info Service 8,000 183,359 152,401 1.26
Axiata Group Bhd 39,000 255,601 203,580 1.69
DIGI.com Bhd 50,000 262,578 249,000 2.07
PLDT Inc. 1,450 305,582 212,367 1.76
Singapore Telecommunications 30,600 296,916 368,016 3.05
Telekom Malaysia 36,000 210,955 244,080 2.02
Telekomunikasi Indonesia 370,000 256,085 506,165 4.20
1,771,076 1,935,609 16.05
Consumer Discretionary
Astra Otoparts 248,000 240,901 184,196 1.53
Bangkok Airways Public Co Ltd 46,000 134,533 135,280 1.12
Jollibee Foods Corp 18,000 226,058 380,351 3.15
Matahari Department Store 72,000 321,971 422,212 3.50
Robinson Department Store 37,000 193,560 267,624 2.22
Sime Darby Bhd 15,000 133,903 114,750 0.95
Singapore Airlines 7,500 225,996 238,791 1.98
1,476,922 1,743,204 14.45
Consumer Staples
Indofood CBP Sukses Makmur 60,000 145,636 180,445 1.50
Pepsi-Cola Products Philippines 900,000 304,869 245,611 2.04
Unilever Indonesia 30,000 244,605 424,212 3.52
Universal Robina Corp 22,000 223,068 335,010 2.78
918,178 1,185,278 9.84
Energy
PTT Exploration & Production 27,000 382,301 260,391 2.16
382,301 260,391 2.16
Financials
Al-‘Aqar Healthcare REIT 147,000 203,854 221,970 1.84
Axis Real Estate Investment Trust 100,000 172,638 175,000 1.45
BIMB Holdings Bhd 21,600 80,642 89,424 0.74
Global Logistic Properties Ltd 27,000 186,809 152,954 1.27
RHT Health Trust 80,000 240,566 253,256 2.10
Sabana Shariah Compliant REIT 108,000 291,454 171,766 1.42
Syarikat Takaful Malaysia 95,000 217,157 396,150 3.28
1,393,120 1,460,520 12.10
Health Care
Chularat Hospital PCL-Foreign 450,000 139,011 140,376 1.16
IHH Healthcare Bhd 52,000 215,135 329,160 2.73
Kalbe Farma 850,000 359,896 462,697 3.84
KPJ Healthcare Bhd 70,000 249,886 296,100 2.46
963,928 1,228,333 10.19
Industrials
Gamuda Bhd 26,000 119,369 127,400 1.06
Hartalega Holdings Bhd 48,000 168,062 222,720 1.85
SIA Engineering Co Ltd 23,000 281,932 258,497 2.14
569,363 608,617 5.05
Continued on next page.

12 ASEAN Equity Fund Quarterly Report 30 September 2016
Quantity (Units) Cost (RM) Market Value (RM) % of NAV
Materials
Holcim Philippines Inc 240,000 260,253 336,721 2.79
Indocement Tunggal Prakasa 57,000 361,232 313,898 2.60
Lafarge Malaysia Berhad 30,000 267,973 237,600 1.97
Semen Indonesia (Persero) 96,000 385,976 307,756 2.55
Siam City Cement 8,700 346,316 306,612 2.54
1,621,750 1,502,587 12.45
Utilities
Manila Electric Co 11,900 228,879 315,998 2.62
228,879 315,998 2.62
Total Quoted Equity Securities 9,325,517 10,240,537 84.91
7. INVESTMENTS (continued)

30 September 2016 Quarterly Report ASEAN Equity Fund 13
8. NOTES TO THE FINANCIAL STATEMENTS
FOR THE FINANCIAL PERIOD FROM 1 JANUARY 2016 TO 30 SEPTEMBER 2016
A. THE FUND, THE MANAGER AND THEIR PRINCIPAL ACTIVITIES
ASEAN Equity Fund (hereinafter referred to as “the Fund”) was constituted pursuant to the execution of a Trust Deed dated 23 November 2015 (hereinafter referred to as “the Deed”) between the Manager, Saturna Sdn. Bhd. and the Trustee, SCBMB Trustee Berhad.
The principal activity of the Fund is to invest in a diversified portfolio of Shariah-compliant equities across the ASEAN region. The objective of the Fund is to provide long-term capital growth. The Fund’s investments comply with Shariah requirements as prescribed by its Shariah Adviser. The Fund was launched on 7 February 2014 and will continue its operations until terminated by the Trustee as provided under Part 11 of the Trust Deed.
The Manager, Saturna Sdn. Bhd. is principally engaged in funds management. The Manager is incorporated in Malaysia.
B. SHORT TERM DEPOSITS
Short-term deposits bore a weighted average effective profit rate of 3.08% per annum at the end of the reporting period. The short-term deposits have a maturity period of 3 to 31 days.
C. NET ASSET VALUE ATTRIBUTABLE TO UNITHOLDERS
2016
RM
Unitholders’ contribution 10,625,720
Retained earnings
- Realised reserve 333,482
- Unrealised reserve 1,100,643
12,059,845
Unitholders Contribution
2016
Number of Units RM
At 1 January 2016 10,604,987 10,625,720
Creation of units - -
At 30 September 2016 10,604,987 10,625,720
ASEAN Equity Fund has an approved combined fund size of 50 million units. At 30 September 2016, the unissued units amounted to 39,395,013 units. (2015: 39,395,013 units)
D. MANAGER’S FEE
The Manager is entitled to receive an administration fee of 0.25% per annum of the NAV of the Fund. The fee is accrued daily and paid monthly out of the Fund.
The Manager is also entitled to a performance fee from the daily increase in the NAV of the Fund. The performance fee is 10% of the amount by which the NAV cumulatively increases or decreases each day in the calendar year.
The Fund reimburses The Manager up to 0.25% of the average Net Assets Value per year for its marketing and distribution expenses
E. TRUSTEE’S FEE
Trustee’s fee is computed on a daily basis at 0.05% per annum of the NAV of the Fund.
(Continued on next page.)

14 ASEAN Equity Fund Quarterly Report 30 September 2016
8. NOTES TO THE FINANCIAL STATEMENTS (continued)
F. UNITS HELD BY RELATED PARTIES
30 September 2016
Number of Units Value at NAV RM
Director of the Manager 403,004 458,291
Related party to the Director of the Manager 9,982,390 11,351,837
10,385,394 11,810,128
G. TRANSACTIONS WITH INVESTMENT BANKS
Details of transactions with investment banks for the financial period from 1 January 2016 to 30 September 2016 are as follows:
Value of TradePercentage of
Total Trade Brokerage FeesPercentage of
Total Brokerage Fees
RM % RM %
CIMB Investment Bank Berhad 33,854 1.62 85 1.87
Maybank Investment Bank Berhad 181,814 8.70 363 7.99
RHB Investment Bank Berhad 1,874,755 89.68 4,094 90.14
2,090,423 100.00 4,542 100.00
H. FINANCIAL RISK MANAGEMENT POLICIES
(a) Introduction
The Fund maintains investment portfolios in a variety of listed financial instruments as dictated by its Trust Deed and investment management strategy.
The Fund is exposed to a variety of financial risks, including market risks (which include interest rate risk, equity price risk and currency risk), credit risk and liquidity risk. Whilst these are the most important types of financial risk inherent in each type of financial instruments, the Manager and the Trustee would like to highlight that this list does not purport to constitute an exhaustive list of all the risks inherent in an investment in the Fund.
The Fund’s objective in managing risk is the creation and protection of Unitholders’ value. Risk is inherent in the Fund’s activities, but it is managed through a process of ongoing identification, measurement and monitoring of risks. Financial risk management is also carried out through sound internal control systems and adherence to the investment restrictions as stipulated in the Trust Deed, the Securities Commission’s Guidelines on Wholesale Funds and the Capital Market and Services Act, 2007.
(b) Risk Management Structure
The Manager is responsible for identifying and controlling risks. The Board of Directors of the Manager is ultimately responsible for the overall risk management approach within the Fund.
The key feature in the Manager’s approach is that tailoring of the level of portfolio risk taken is through Tactical Asset Allocation between liquid assets and equity. At least 70% of the Fund’s NAV are to be allocated to Shariah-compliant equities in ASEAN countries and up to 30% of the Fund’s NAV are allocated to liquid assets including money market instruments and Islamic deposits with Islamic financial institutions.
To achieve its objective, the Fund invests in a diversified portfolio of Shariah-compliant equities across the ASEAN region. Asset allocation decisions are made after a review of macroeconomic and currency trends in the Southeast Asian economies.
The Fund generally follows a relative value investment style, favoring companies with potential for earnings growth. The Fund Manager analyses the direction of GDP growth, interest rates, inflation, currencies and government policies. The Fund Manager will then assess the outlook for corporate earnings and determine if there are any predictable trends. The criteria for stock selection would include improving fundamentals and growth at reasonable valuations. Stock valuation fundamentals considered are sales growth, profit margin, cash generation, earnings per share, return on equity, price earnings ratio and net tangible asset multiplies.
The Fund’s investments comply with Shariah requirements as prescribed by its Shariah Adviser.

30 September 2016 Quarterly Report ASEAN Equity Fund 15
8. NOTES TO THE FINANCIAL STATEMENTS (continued)
H. FINANCIAL RISK MANAGEMENT POLICIES (continued)
(b) Risk Management Structure (continued)
The Fund generally invests for the long-term, with annual portfolio turnover not expected to exceed 30%. The Fund will not engage in short-term trading or speculative investments.
The Fund does not invest in debt instruments and investments that might be considered higher risk compared to equities, such as derivatives.
The Fund is allowed to hold cash at the discretion of the Fund Manager and/or for defensive purposes.
(c) Market Risk
Market risk is the risk that the fair value or future cash flows of financial instruments will fluctuate due to changes in market variables such as interest rates, foreign exchange rates and equity prices. The maximum risk resulting from financial instruments equals their fair value.
(i) Interest Rate Risk
Interest rates are inclined to fluctuate over time. A rise in the general level of interest rates may affect the short-term deposits.
Cash and short-term deposits are particularly sensitive to movements in interest rates. When interest rates rise, the return on cash will rise thus affecting the NAV of the Fund.
(ii) Equity Price Risk
Equity price risk is the risk of unfavourable changes in the fair values of equities as the result of changes in the levels of equity indices and the value of individual shares. The equity price risk exposure arises from the Fund’s investments in quoted equity securities.
(iii) Currency risk
The Fund is exposed to foreign currency risk on transactions and balances that are denominated in currencies other than Ringgit Malaysia. The currencies giving rise to this risk are primarily Indonesian Rupiah (“IDR”), Philippine Peso (“PHP”), Singapore Dollar (“SGD”) and Thai Baht (“THB”). Foreign currency risk is monitored closely on an ongoing basis to ensure that the net exposure is at an acceptable level.
(iv) Credit Risk
The Fund will transact most of its investments through financial institutions including but not limited to banks, brokers and dealers. The risk is that a financial institution may default on its obligations.
The Manager manages the Fund’s credit risk by undertaking credit evaluation and close monitoring of any changes to the issuer/counterparty’s credit profile to minimise such risk. It is the Fund’s policy to enter into financial instruments with reputable counterparties. The Manager also closely monitors the creditworthiness of the Fund’s counterparties (e.g., brokers, custodian, banks, etc.).
Credit risk exposure
At the reporting date, the Fund’s maximum exposure to credit risk is represented by the carrying amount of each class of financial assets recognised in the statement of financial position.
(v) Liquidity Risk
Investments that are relatively less liquid in nature can cause their value and hence the value of the Fund to drop. The Fund may not be able to realise illiquid investments at the desired prices. The risk managed by careful stock or asset selection and portfolio diversification.
It is the Fund’s policy that the Manager monitors the Fund’s liquidity position on a regular basis. The Fund also manages its obligation to redeem units required to do so and its overall liquidity risk by requiring a maximum of five (5) business days notice period before redemptions.
The Manager’s policy is to always maintain a prudent and sufficient level of liquid assets so as to meet normal operating requirements and expected redemption requests by unitholders. Liquid assets comprise cash, deposits with financial institutions and other instruments which are capable of being converted into cash within three (3) months.

16 ASEAN Equity Fund Quarterly Report 30 September 2016
9. CORPORATE INFORMATION
The Fund ManagerSaturna Sdn Bhd (342171-V)
Registered Office16-B, Jalan Tun Mohd Fuad 1Taman Tun Dr. Ismail60000 Kuala LumpurTel: 03-77268128 Fax: 03-77279702
Business OfficeSuite 5.03, 5th Floor, Menara Atlan161B Jalan Ampang50450 Kuala LumpurTel: 03-21645303 Fax: 03-21645308
The TrusteeSCBMB Trustee Berhad (1005793-T)
Board of DirectorsNicholas F. Kaiser (Chairman)Monem A. SalamDato’ Dr. Lee Chee KuonDato’ Dr. Vaseehar HassanMd. Noor Bin Haji A.Rahman
Investment CommitteeNicholas F. Kaiser (Chairman)Monem A. SalamDato’ Dr. Lee Chee KuonScott F. KlimoPadharmendren Annadorai Dharmen
Shariah AdvisorAmanie Advisors Sdn Bhd
Company SecretaryFulcrum Management Sdn Bhd (MAICSA 0868925)
Auditors & Reporting AccountantsCrowe Horwath AF 1018
Tax AdvisorCrowe Horwath KL Tax Sdn Bhd
SolicitorsWei Chien & Partners
Banker Standard Chartered Saadiq Berhad (823437K)